MultiType Shifting Predictive Moving Averages (MA) CrossoverJust 2 Moving Averages with adjustable settings and shifting capability, plus signals and predicting continuations.
At the time of publish these different types of MAs are supported:
- SMA (Simple)
- EMA (Exponential)
- DEMA (Double Exponential)
- TEMA (Triple Exponential)
- RMA (Adjusted Exponential)
- WMA (Weighted)
- VWMA (Volume Weighted)
- SWMA (Symmetrically Weighted)
- HMA (Hull)
I'm looking forward to any idea about filtering the signals. Thanks.
Cari dalam skrip untuk "Exponential"

RV-Scalping 34EAV ChannelWorks well with 1/3/5/15 min & above
//34 Exponential Moving Average of the Close
//34 Exponential Moving Average of the High
//34 Exponential Moving Average of the Low
//https://www.forexstrategiesresources.com/scalping-forex-strategies/106-1-min-scalping-with-34-exponential-moving-average-channel/
// When price is above the MAs (Moving Averages) we are only looking to buy as price comes back to the MAs.
// And when price is below the MAs, we are only looking to sell when price comes back to the MAs
// What we’re looking for when price pulls back to the MAs is for it to hold and then show that it is going to continue.
// We look for this continuation signal in terms of a strong, momentumdriven bar.
// 1) – Wait for pullback
// 2) – Enter when momentum comes into market
// 3) – Exit when momentum slows
// When the market has already moved a significant amount that day – Lets not enter in the same direct expecting a further move.

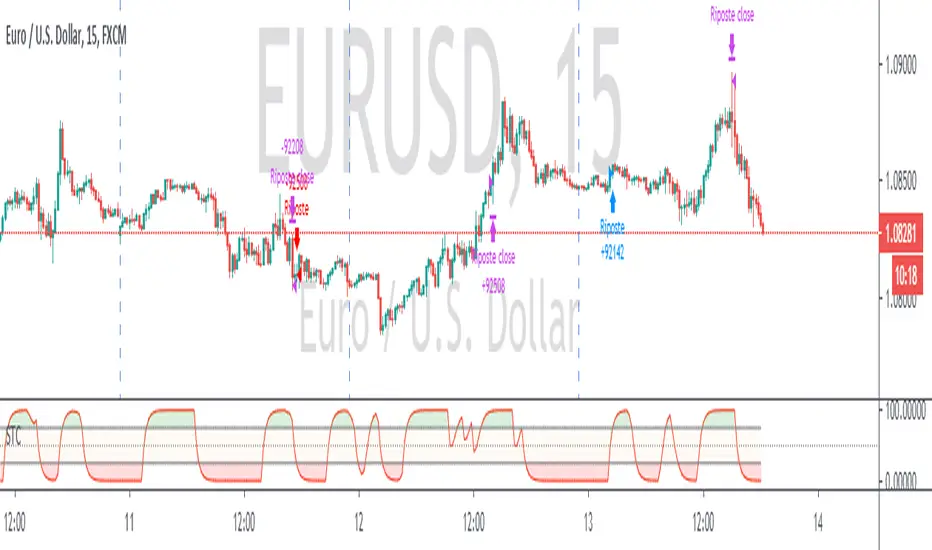
Schaff Trend Cycle + Double MAThis strategy uses two different moving averages to determine a trend. It opens a position on a pullback from a trend.
Conditions for buy signal are:
►Crossover out of Shaff Trend Cycle's extreme levels
►The price is above its short period exponential moving average.
►A short period exponential moving average is above a long period exponential moving average.
*Conditions for sell are the opposite.
All in all, I don't think it needs to be on your chart but it can be optimized and even successful on some timeframes.
Shaff Trend Cycle solution was provided by @everget, I converted his script to Pine v.4, added exponential averages and created an algorithm for backtesting.
Moving Average Compendium===========
Moving Average Compendium (16 MA Types)
===========
A selection of the most popular, widely used, interesting and most powerful Moving Averages we can think of. We've compiled 16 MA's into this script, and allowed full access to the source code so you can use what you need, as you need it.
-----------
From very simple moving averages using built-in functions, all the way through to Fractal Adaptive Averages, we've tried to cover as much as we can think of! BUT, if you would like to make a suggestion or recommendation to be added to this compendium of MA's please let us know! Together we can get a complete list of many dozens of types of Moving Average.
Full List (so far)
---
SMA - Simple Moving Average
EMA - Exponential Moving Average
WMA - Weighted Moving Average
VWMA - Volume Weighted Moving Average
DEMA - Double Exponential Moving Average
TEMA - Triple Exponential Moving Average
SMMA - Smoothed Moving Average
HMA - Hull Moving Average
ZLEMA - Zero-Lag Exponential Moving Average
KAMA - Kaufman Adaptive Moving Average
JMA - Jurik Moving Average
SWMA - Sine-Weighted Moving Average
TriMA - Triangular Moving Average
MedMA - Moving Median Average
GeoMA - Geometric Mean Moving Average
FRAMA - Fractal Adaptive Moving Average
Line color changes from green (upward) to red (downward) - some of the MA types will "linger" without moving up or down and when they are in this state they should appear gray in color.
Thanks to all involved -
Good Luck and Happy Trading!

Trade System Crypto InvestidorTrade System created to facilitate the visualization of crossing and extensions of the movements with Bollinger bands.
Composed by:
Moving Averages of 21, 50, 100 and 200.
Exponential Moving Averages: 17,34,72,144, 200 and 610.
Bollinger bands with standard deviation 2 and 3.
How it works?
The indicators work together, however there are some important cross-averages that need to be identified.
- Crossing the MA21 with 50, 100 and 200 up or down will dictate an up or down trend.
- MA200 and EMA200 are excellent indicators of resistance and support zone, if the price is above these averages it will be a great support, if the price is below these averages it will indicate strong resistance.
- Another important crossover refers to exponential moving averages of 17 to 72 indicates a possible start of a trend
- The crossing of the exponential moving average of 34 with 144 will confirm the crossing mentioned above.
- In addition, the exponential moving average of 610 used by Bo Williams is an excellent reference for dictating an upward or downward trend, if the price is above it it will possibly confirm an upward trend and the downside.
- To conclude we have bollinger bands with standard deviation 2 and 3, they help to identify the maximum movements.

HEMA - A Fast And Efficient Estimate Of The Hull Moving AverageIntroduction
The Hull moving average (HMA) developed by Alan Hull is one of the many moving averages that aim to reduce lag while providing effective smoothing. The HMA make use of 3 linearly weighted (WMA) moving averages, with respective periods p/2 , p and √p , this involve three convolutions, which affect computation time, a more efficient version exist under the name of exponential Hull moving average (EHMA), this version make use of exponential moving averages instead of linearly weighted ones, which dramatically decrease the computation time, however the difference with the original version is clearly noticeable.
In this post an efficient and simple estimate is proposed, the estimation process will be fully described and some comparison with the original HMA will be presented.
This post and indicator is dedicated to LucF
Estimation Process
Estimating a moving average is easier when we look at its weights (represented by the impulse response), we basically want to find a similar set of weights via more efficient calculations, the estimation process is therefore based on fully understanding the weighting architecture of the moving average we want to estimate.
The impulse response of an HMA of period 20 is as follows :
We can see that the first weights increases a bit before decaying, the weights then decay, cross under 0 and increase again. More recent closing price values benefits of the highest weights, while the oldest values have negatives ones, negative weighting is what allow to drastically reduce the lag of the HMA. Based on this information we know that our estimate will be a linear combination of two moving averages with unknown coefficients :
a × MA1 + b × MA2
With a > 0 and b < 0 , the lag of MA1 is lower than the lag of MA2 . We first need to capture the general envelope of the weights, which has an overall non-linearly decaying shape, therefore the use of an exponential moving average might seem appropriate.
In orange the impulse response of an exponential moving average of period p/2 , that is 10. We can see that such impulse response is not a bad estimate of the overall shape of the HMA impulse response, based on this information we might perform our linear combination with a simple moving average :
2EMA(p/2) + -1SMA(p)
this gives the following impulse response :
As we can see there is a clear lack of accuracy, but because the impulse response of a simple moving is a constant we can't have the short increasing weights of the HMA, we therefore need a non-constant impulse response for our linear combination, a WMA might be appropriate. Therefore we will use :
2WMA(p/2) + -1EMA(p/2)
Note that the lag a WMA is inferior to the lag of an EMA of same period, this is why the period of the WMA is p/2 . We obtain :
The shape has improved, but the fit is poor, which mean we should change our coefficients, more precisely increasing the coefficient of the WMA (thus decreasing the one of the EMA). We will try :
3WMA(p/2) + -2EMA(p/2)
We then obtain :
This estimate seems to have a decent fit, and this linear combination is therefore used.
Comparison
HMA in blue and the estimate in fuchsia with both period 50, the difference can be noted, however the estimate is relatively accurate.
In the image above the period has been set to 200.
Conclusion
In this post an efficient estimate of the HMA has been proposed, we have seen that the HMA can be estimated via the linear combinations of a WMA and an EMA of each period p/2 , this isn't important for the EMA who is based on recursion but is however a big deal for the WMA who use recursion, and therefore p indicate the number of data points to be used in the convolution, knowing that we use only convolution and that this convolution use twice less data points then one of the WMA used in the HMA is a pretty great thing.
Subtle tweaking of the coefficients/moving averages length's might help have an even more accurate estimate, the fact that the WMA make use of a period of √p is certainly the most disturbing aspect when it comes to estimating the HMA. I also described more in depth the process of estimating a moving average.
I hope you learned something in this post, it took me quite a lot of time to prepare, maybe 2 hours, some pinescripters pass an enormous amount of time providing content and helping the community, one of them being LucF, without him i don't think you'll be seeing this indicator as well as many ones i previously posted, I encourage you to thank him and check his work for Pinecoders as well as following him.
Thanks for reading !

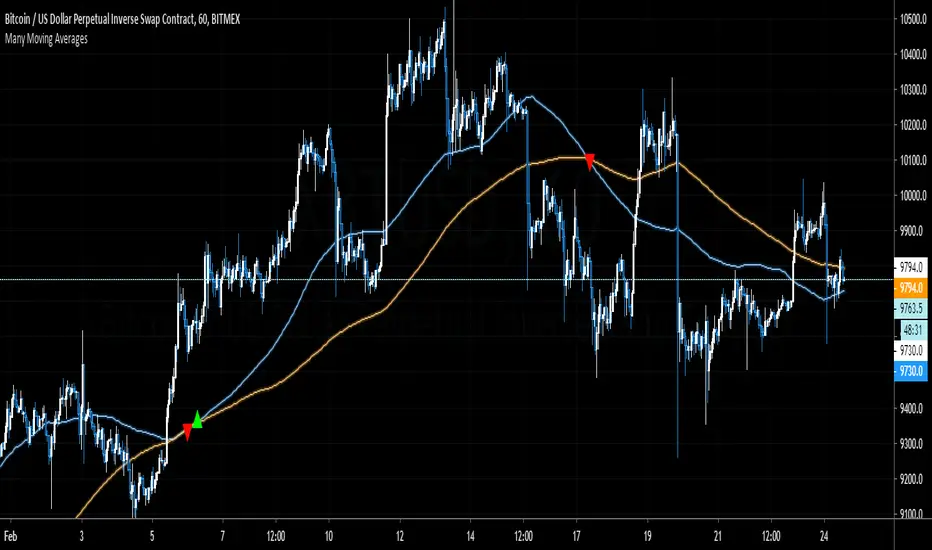
Many Moving AveragesThis script allows you to add two moving averages to a chart, where the type of moving average can be chosen from a collection of 15 different moving average algorithms. Each moving average can also have different lengths and crossovers/unders can be displayed and alerted on.
The supported moving average types are:
Simple Moving Average ( SMA )
Exponential Moving Average ( EMA )
Double Exponential Moving Average ( DEMA )
Triple Exponential Moving Average ( TEMA )
Weighted Moving Average ( WMA )
Volume Weighted Moving Average ( VWMA )
Smoothed Moving Average ( SMMA )
Hull Moving Average ( HMA )
Least Square Moving Average/Linear Regression ( LSMA )
Arnaud Legoux Moving Average ( ALMA )
Jurik Moving Average ( JMA )
Volatility Adjusted Moving Average ( VAMA )
Fractal Adaptive Moving Average ( FRAMA )
Zero-Lag Exponential Moving Average ( ZLEMA )
Kauman Adaptive Moving Average ( KAMA )
Many of the moving average algorithms were taken from other peoples' scripts. I'd like to thank the authors for making their code available.
JayRogers
Alex Orekhov (everget)
Alex Orekhov (everget)
Joris Duyck (JD)
nemozny
Shizaru
KobySK
Jurik Research and Consulting for inventing the JMA.
Well Rounded Moving AverageIntroduction
There are tons of filters, way to many, and some of them are redundant in the sense they produce the same results as others. The task to find an optimal filter is still a big challenge among technical analysis and engineering, a good filter is the Kalman filter who is one of the more precise filters out there. The optimal filter theorem state that : The optimal estimator has the form of a linear observer , this in short mean that an optimal filter must use measurements of the inputs and outputs, and this is what does the Kalman filter. I have tried myself to Kalman filters with more or less success as well as understanding optimality by studying Linear–quadratic–Gaussian control, i failed to get a complete understanding of those subjects but today i present a moving average filter (WRMA) constructed with all the knowledge i have in control theory and who aim to provide a very well response to market price, this mean low lag for fast decision timing and low overshoots for better precision.
Construction
An good filter must use information about its output, this is what exponential smoothing is about, simple exponential smoothing (EMA) is close to a simple moving average and can be defined as :
output = output(1) + α(input - output(1))
where α (alpha) is a smoothing constant, typically equal to 2/(Period+1) for the EMA.
This approach can be further developed by introducing more smoothing constants and output control (See double/triple exponential smoothing - alpha-beta filter) .
The moving average i propose will use only one smoothing constant, and is described as follow :
a = nz(a ) + alpha*nz(A )
b = nz(b ) + alpha*nz(B )
y = ema(a + b,p1)
A = src - y
B = src - ema(y,p2)
The filter is divided into two components a and b (more terms can add more control/effects if chosen well) , a adjust itself to the output error and is responsive while b is independent of the output and is mainly smoother, adding those components together create an output y , A is the output error and B is the error of an exponential moving average.
Comparison
There are a lot of low-lag filters out there, but the overshoots they induce in order to reduce lag is not a great effect. The first comparison is with a least square moving average, a moving average who fit a line in a price window of period length .
Lsma in blue and WRMA in red with both length = 100 . The lsma is a bit smoother but induce terrible overshoots
ZLMA in blue and WRMA in red with both length = 100 . The lag difference between each moving average is really low while VWRMA is way more precise.
Hull MA in blue and WRMA in red with both length = 100 . The Hull MA have similar overshoots than the LSMA.
Reduced overshoots moving average (ROMA) in blue and WRMA in red with both length = 100 . ROMA is an indicator i have made to reduce the overshoots of a LSMA, but at the end WRMA still reduce way more the overshoots while being smoother and having similar lag.
I have added a smoother version, just activate the extra smooth option in the indicator settings window. Here the result with length = 200 :
This result is a little bit similar to a 2 order Butterworth filter. Our filter have more overshoots which in this case could be useful to reduce the error with edges since other low pass filters tend to smooth their amplitude thus reducing edge estimation precision.
Conclusions
I have presented a well rounded filter in term of smoothness/stability and reactivity. Try to add more terms to have different results, you could maybe end up with interesting results, if its the case share them with the community :)
As for control theory i have seen neural networks integrated to Kalman flters which leaded to great accuracy, AI is everywhere and promise to be a game a changer in real time data smoothing. So i asked myself if it was possible for a neural networks to develop pinescript indicators, if yes then i could be replaced by AI ? Brrr how frightening.
Thanks for reading :)

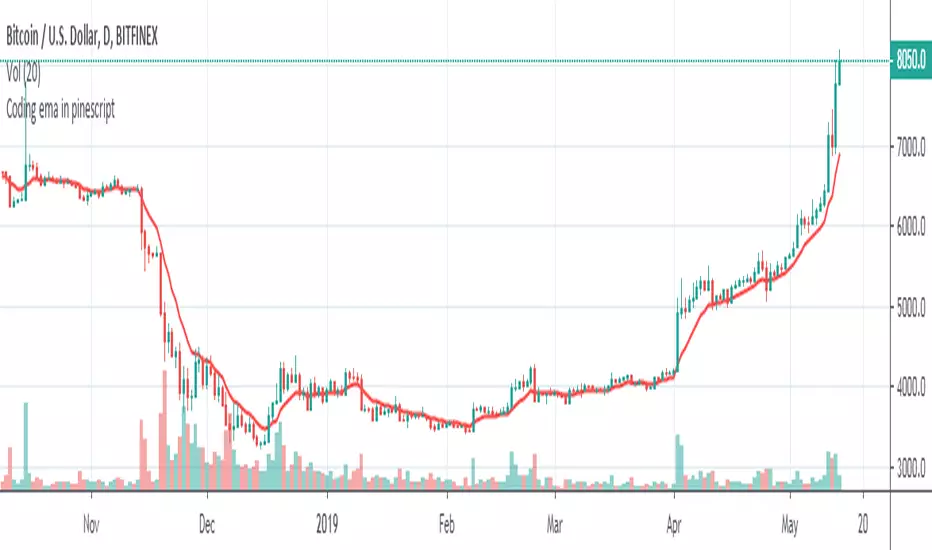
Coding ema in pinescriptWhat is EMA ?
Ema is known as exponential moving average, it comes from the class of weighted moving average. It gives more weightage to the recent price changes, thus making it much more relevant to the current market analysis. Also it provides a dynamic way of calculating support and resistances in a trend following setup.
The most common way to mint profit out from the market is to use trend following setups which can be easily achieved by using a group of EMA’s
So how’s this EMA calculated ?
Before understanding the calculation of EMA let’s look into a much wider topic:
“The Law of Averages”
It states : If you do something often enough a ratio will appear, simply put, any time series data, tend to deviate from its average.
EMA provides a way to statistically calculate the exponential moving average for a provided time series data giving much more emphasis on the most recent data in the series.
So in the 17th century, when the people were playing with numbers in their free time, they came up with a statistical strategy to envelop any time series data to detect the direction of the data flow , they called it exponential moving average.
Later in 1940’s with the increase in signal processing requirements in the field of electronic devices scientists started using Exponential moving average onto the electronic signal followers, just to classify the signals as above or below a moving/dynamic threshold.
So EMA is a smoothed time-series data.
The simplest form of EMA Smoothing can be given by the formula:
S(t) = alpha * X(t) + (1 - alpha) * X(t - 1).
The value of alpha must lie between 0 and 1
Where
alpha , is the smoothing factor
X(t) , is the current observation data point
X(t - 1), is the past observational data point.
t , is the current time
Generally,
In current day trading setups for EMA the alpha is calculated by
alpha = 2 / (time period window + 1)
Things to note here is that the alpha calculated above is the most generally used factor calculation method for EMA ,
You can tweak the alpha function above until it gives value between 0 and 1 for example alpha can also be written as
alpha = ln ( current price / past price )
Note it’s just a weighing scheme,
But for Our Case of EMA
We will be using
alpha = 2 / (time period window + 1)
Please refer to the script code below
Moving Average Trend IndicatorThis Indicator shows you the major moving averages, both in simple and exponential.

[ALERTS] MA Cross ElevenThis script is a crossing of eleven different MA, with alerts and SL and TP.
The simplest is what works best.
SMA --> Simple
EMA --> Exponential
WMA --> Weighted
VWMA --> Volume Weighted
SMMA --> Smoothed
DEMA --> Double Exponential
TEMA --> Triple Exponential
HMA --> Hull
TMA --> Triangular
SSMA --> SuperSmoother filter
ZEMA --> Zero Lag Exponential
Using "once per bar close" repaint is 0%, but if you like risk can choose "once per bar", better profit.
Thanks to JustUncleL and his amazing sripts.

[STRATEGY] MA Cross ElevenThis script is a crossing of eleven different MA, with alerts and SL and TP.
The simplest is what works best...
SMA --> Simple
EMA --> Exponential
WMA --> Weighted
VWMA --> Volume Weighted
SMMA --> Smoothed
DEMA --> Double Exponential
TEMA --> Triple Exponential
HMA --> Hull
TMA --> Triangular
SSMA --> SuperSmoother filter
ZEMA --> Zero Lag Exponential
Using "once per bar close" repaint is 0%, but if you like risk can choose "once per bar", better profit.
Thanks to JustUncleL and his amazing sripts.
Enjoy!
www.tradingview.com
"Note: When using non-standard (Renko, Kagi, Line Break, Point and Figure, Heikin Ashi, Spread Charts) types of chart as a basis for strategy, you need to realize that the result will be different. The orders will be executed at the prices of this chart (e.g.for Heikin Ashi it’ll take Heikin Ashi prices (the average ones) not the real market prices). Therefore we highly recommend you to use standard chart type for strategies."

RSI + BB (EMA) + Dispersion (2.0)First version here
Initial data:
1) RSI
2) Bollinger Bands (Basis - EMA )
3) Dispersion (around basis)
Signal for purchase: RSI crosses the dispersion zone upwards
Signal for sale: RSI crosses the dispersion zone downwards
Buffer zone: white area, it is not recommended to make transactions.
--- Add ( 02.10.2018 )
1) RSI lines (overbought / oversold) = 70 / 30. Сan be changed in the settings.
2) Alerts:
• RSI line crossover Dispersion Zone (green)
• RSI line crossunder Dispersion Zone (red)

MA&EMA - 10 - LibertusHello all,
Did you ever wanted to have loads of MA's and EMA's on your screen? This is script for you.
It will help you track most important MA's and EMA's. You can hide ones you don't need or change them into MA/EMA you need but it's not here by default.
Good trading and best of luck!

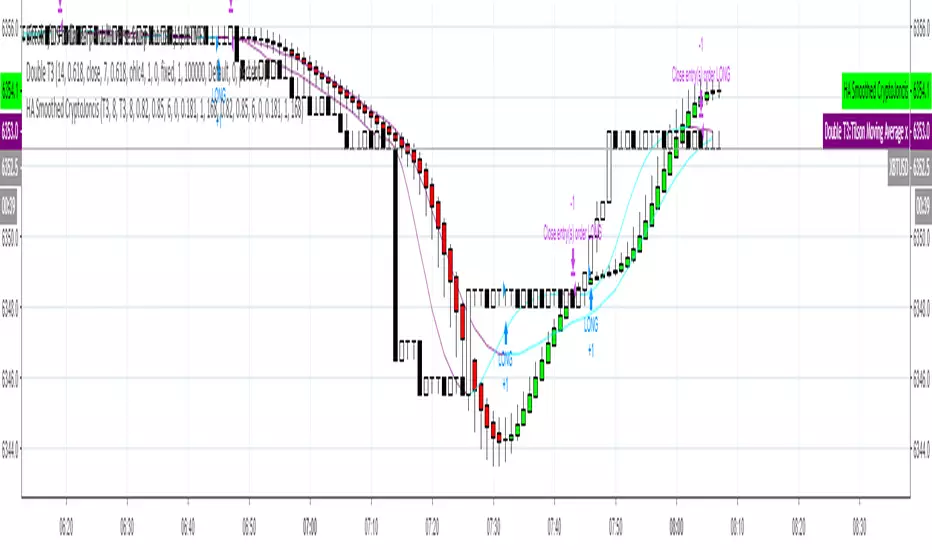
Heikin-Ashi Smoothed with option to change MA types CryptoJoncisPine Script version=3
Author CryptoJoncis
Heikin-Ashi Smoothed
The Heikin-Ashi Smoothed study is based upon the standard Heikin-Ashi study with additional moving average calculations. The following is the calculation formula for the bars:
1. The current bar Open, High, Low, Close values are smoothed individually by using the moving average type specified by the Moving Average Type 1 Input with a length/period specified by the Moving Average Period 1 Input.
2. The Heikin-Ashi bar Open, High, Low, Close values are set using the smoothed values from step 1. This is performed using the standard Heikin-Ashi formula.
3. The final Heikin-Ashi Open, High, Low, Close values are calculated by doing a second smoothing of the bar values from step 2 by using the moving average type specified by the Moving Average Type 2 Input with a length/period specified by the Moving Average Period 2 Input.
If you choose to tick the box where it offers to use only one smoothed HA then it skips the third/final step and you do not need to choose the second MA type for it to work.
Remember, using FRAMA, always make sure you use even number for length.
For simple Heikin-Ashi, please tick single smoothed and DEFAULT (Not smoothed as there are no MA used)
Heikin-Ashi bars are calculated:
1. Close = (Open + High + Low + Close) / 4
This is the average price of the current bar.
2. Open = (Open of Previous Bar + Close of Previous Bar) / 2
This is the midpoint of the previous bar.
3. High = Max of (High, Open, Close)
Highest value of the three.
4. Low = Min of (Low, Open, Close)
Lowest value of the three.
Any questions/suggestions/errors or spelling mistakes? Please leave a comment and let me know. I will try to fix it.
This took me few days to finish, so I hope you will find it useful.
Would you like to have more MA type choices? Please comment down with any other which aren't included in this indicator and I will research them and add.
MA included in this script:
Tillson Moving Average (T3)
Double Exponential Moving Average (DEMA)
Arnaud Legoux Moving Average (ALMA)
Least Squares Moving Average (LSMA)
Simple Moving Average (SMA)
Exponential Moving Average (EMA)
Weighted Moving Average (WMA)
Smoothed Moving Average (SMMA)
Triple Exponential Moving Average (TEMA)
Hull Moving Average (HMA)
Adaptive moving average (AMA)
Fractal Adaptive Moving Average (FAMA)
Variable Index Dynamic Average (VIDYA)
Triangular Moving Average (TRIMA)
You can use,publish,modify this code in any way as you wish, but only if you reference me after.
You are not allowed to sell it as it is.
If this code is useful to you, then consider to buy me a coffee (or better a pint of beer) by donating Bitcoin or Etherium to:
BTC: 3FiBnveHo3YW6DSiPEmoCFCyCnsrWS3JBR
ETH: 0xac290B4A721f5ef75b0971F1102e01E1942A4578
References:
www.sierrachart.com
www.investopedia.com
www.binarytribune.com
www.investopedia.com
www.stockfetcher.com
www.mql5.com
www.incrediblecharts.com
help.cqg.com
www.blastchart.com
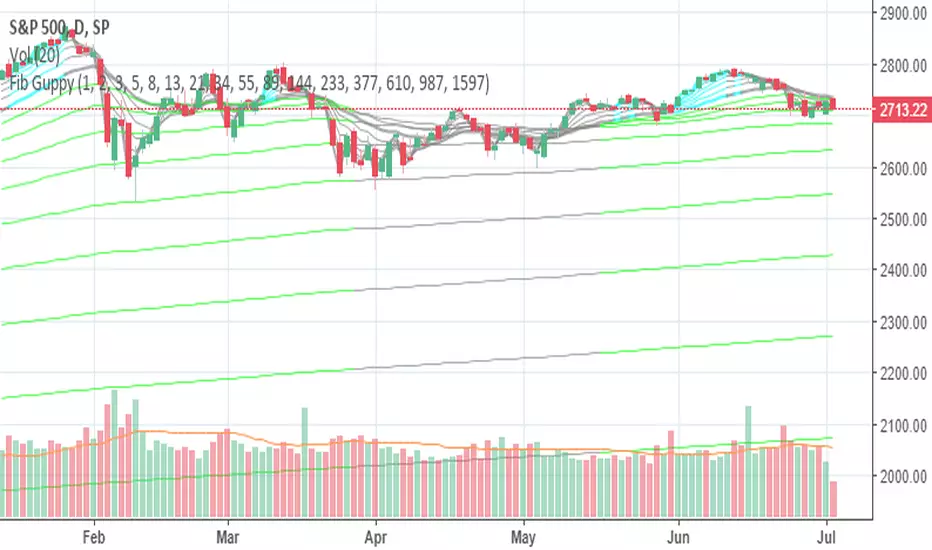
Fib Guppy for volatility predictionsThis is a guppy made from FIbbonacci numbers (from 1 to 1597).
Here is how to trade with this guppy.
when 6-8 lines tighten together, it means there will be high volatility coming very soon. Trade according to where the next candle opens (for scalping etc). For example: if the 8 lines of guppy tighten and candle closes above guppy with momentum and trend in the same direction(up), then there could be expected a big move in that direction. Vice versa if a candle closes below the tightened guppy with momentum and trend at the same direction, then the volatility will push price lower exponentially.
Easy. peace of cake. go make yourself a millionaire.
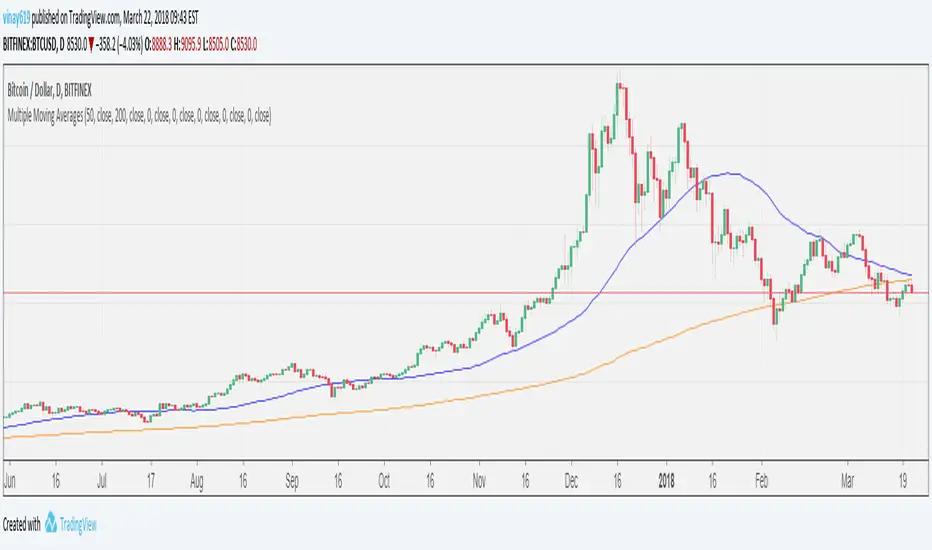
Multiple Moving AveragesFeatures
- 7 MAs in one indicator
- User changeable period for each MA
- SMA/EMA user selectable option for each MA
- Source (close,open,high,low etc) user selectable option for each MA
XPloRR MA-Trailing-Stop StrategyXPloRR MA-Trailing-Stop Strategy
Long term MA-Trailing-Stop strategy with Adjustable Signal Strength to beat Buy&Hold strategy
None of the strategies that I tested can beat the long term Buy&Hold strategy. That's the reason why I wrote this strategy.
Purpose: beat Buy&Hold strategy with around 10 trades. 100% capitalize sold trade into new trade.
My buy strategy is triggered by the fast buy EMA (blue) crossing over the slow buy SMA curve (orange) and the fast buy EMA has a certain up strength.
My sell strategy is triggered by either one of these conditions:
the EMA(6) of the close value is crossing under the trailing stop value (green) or
the fast sell EMA (navy) is crossing under the slow sell SMA curve (red) and the fast sell EMA has a certain down strength.
The trailing stop value (green) is set to a multiple of the ATR(15) value.
ATR(15) is the SMA(15) value of the difference between the high and low values.
The scripts shows a lot of graphical information:
The close value is shown in light-green. When the close value is lower then the buy value, the close value is shown in light-red. This way it is possible to evaluate the virtual losses during the trade.
the trailing stop value is shown in dark-green. When the sell value is lower then the buy value, the last color of the trade will be red (best viewed when zoomed)(in the example, there are 2 trades that end in gain and 2 in loss (red line at end))
the EMA and SMA values for both buy and sell signals are shown as a line
the buy and sell(close) signals are labeled in blue
How to use this strategy?
Every stock has it's own "DNA", so first thing to do is tune the right parameters to get the best strategy values voor EMA , SMA, Strength for both buy and sell and the Trailing Stop (#ATR).
Look in the strategy tester overview to optimize the values Percent Profitable and Net Profit (using the strategy settings icon, you can increase/decrease the parameters)
Then keep using these parameters for future buy/sell signals only for that particular stock.
Do the same for other stocks.
Important : optimizing these parameters is no guarantee for future winning trades!
Here are the parameters:
Fast EMA Buy: buy trigger when Fast EMA Buy crosses over the Slow SMA Buy value (use values between 10-20)
Slow SMA Buy: buy trigger when Fast EMA Buy crosses over the Slow SMA Buy value (use values between 30-100)
Minimum Buy Strength: minimum upward trend value of the Fast SMA Buy value (directional coefficient)(use values between 0-120)
Fast EMA Sell: sell trigger when Fast EMA Sell crosses under the Slow SMA Sell value (use values between 10-20)
Slow SMA Sell: sell trigger when Fast EMA Sell crosses under the Slow SMA Sell value (use values between 30-100)
Minimum Sell Strength: minimum downward trend value of the Fast SMA Sell value (directional coefficient)(use values between 0-120)
Trailing Stop (#ATR): the trailing stop value as a multiple of the ATR(15) value (use values between 2-20)
Example parameters for different stocks (Start capital: 1000, Order=100% of equity, Period 1/1/2005 to now) compared to the Buy&Hold Strategy(=do nothing):
BEKB(Bekaert): EMA-Buy=12, SMA-Buy=44, Strength-Buy=65, EMA-Sell=12, SMA-Sell=55, Strength-Sell=120, Stop#ATR=20
NetProfit: 996%, #Trades: 6, %Profitable: 83%, Buy&HoldProfit: 78%
BAR(Barco): EMA-Buy=16, SMA-Buy=80, Strength-Buy=44, EMA-Sell=12, SMA-Sell=45, Strength-Sell=82, Stop#ATR=9
NetProfit: 385%, #Trades: 7, %Profitable: 71%, Buy&HoldProfit: 55%
AAPL(Apple): EMA-Buy=12, SMA-Buy=45, Strength-Buy=40, EMA-Sell=19, SMA-Sell=45, Strength-Sell=106, Stop#ATR=8
NetProfit: 6900%, #Trades: 7, %Profitable: 71%, Buy&HoldProfit: 2938%
TNET(Telenet): EMA-Buy=12, SMA-Buy=45, Strength-Buy=27, EMA-Sell=19, SMA-Sell=45, Strength-Sell=70, Stop#ATR=14
NetProfit: 129%, #Trade

Triple Simple Moving AveragesBased on AdventTrading's TEMA script, but using simple moving averages instead of exponential. Also changed the colours to be nicer.

Log-Space EMA Ribbon [Krypt]Similar to basic EMA Ribbon indicator except uses log-space transformation. Should be better on very long timeframes and for determining beginning of a bull market. The tradeoff is that it is slower than regular EMA near peaks (regular EMA will outperform this indicator when determining when to sell).

EMA Ribbon [Krypt]A convenient way to add a ribbon indicator (one indicator instead of multiple EMAs)

ALTDEL S/E Awesome OscillatorA simple customization of the Awesome Oscillator: allows you to change the moving averages (integer) as well as make them exponential.

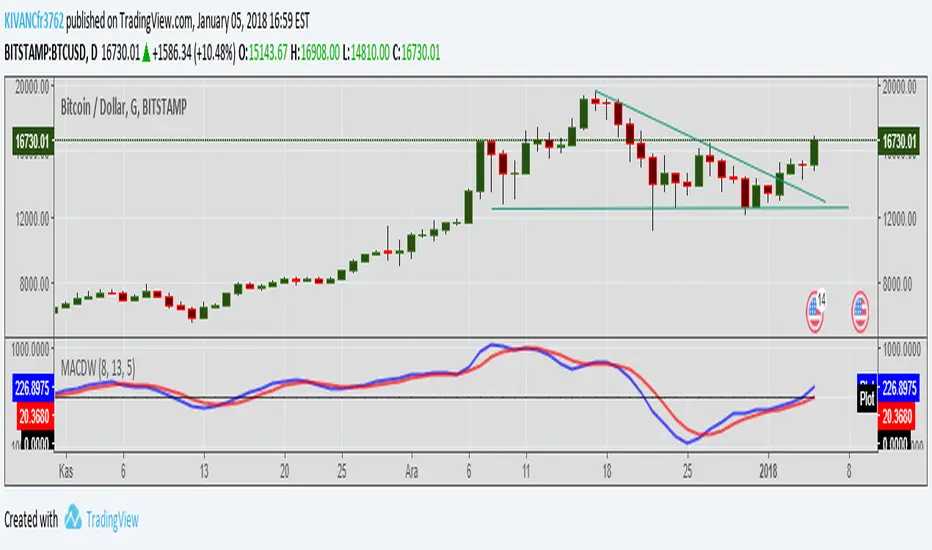
MACD WEIGHTEDA different style of MACD indicator with different period values of WEIGHTED MOVING AVERAGES INSTEAD OF EXPONENTIAL.
Default MOVING AVERAGES ARE
faster period: 8bars
slower period: 13 bars
signal period: 5 bars
TURKISH EXPLANATION:
MACD indikatörünün üssel yerine AĞIRLIKLI hareketli ortalamalar kullanılarak daha erken sinyaller alabilmek için daha kısa periyotlarla yorumlanması