Multi EMA (up to 6) - JamilThis indicator plots six customizable Exponential Moving Averages (EMA 1 to EMA 6) designed to help traders quickly identify market direction, trend strength, and dynamic support/resistance levels.
🔹 Key Features
Plots six EMAs simultaneously for multi-timeframe trend clarity
Helps detect trend reversals, pullbacks, and continuation setups
Ideal for scalping, intraday, swing trading, and funded challenges
Works on all markets (Gold, Forex, Crypto, Indices)
Customizable lengths and colors
Clean and lightweight — doesn’t affect chart performance
🔹 How to Use
When all EMAs are aligned and fanning out → Strong Trend
EMA compression → Low volatility / possible breakout setup
Price above all EMAs → Bullish zone
Price below all EMAs → Bearish zone
Perfect for traders who want a simple yet powerful trend-reading tool.
Cari dalam skrip untuk "Exponential"

Daily TrendDescription:
The "Daily Trend" script is a powerful technical analysis tool designed for TradingView. This indicator helps traders identify key support and resistance levels based on daily price data. It offers a visual representation of these levels, along with other technical indicators like Exponential Moving Averages (EMA), Supertrend, and Parabolic SAR.
Features:
Past Candle Price Levels: This script calculates and displays past daily candle price levels, including R1, R2, R3, R4, S1, S2, S3, and S4. These levels are vital for identifying potential reversals and breakout points.
Exponential Moving Average (EMA): The script includes an EMA indicator with a customizable period to help traders spot the trend direction and potential crossovers.
Supertrend Indicator: The Supertrend indicator is used to identify trend changes. It plots the Supertrend line and highlights the trend direction with color-coded regions.
Parabolic SAR: The Parabolic SAR indicator is integrated into the script to assist traders in identifying potential entry and exit points in the market.
Customizable Alerts: Traders can customize the indicator by choosing which past candle price levels and other features to display on the chart.
How to Use:
Apply the "Daily Trend" script to your TradingView chart.
Customize the indicator by enabling or disabling specific features, such as past candle price levels and EMA.
Pay attention to the color-coded regions for Supertrend and Parabolic SAR to determine the current trend direction.
Look for potential reversal or bounce signals based on the indicator's signals and the price action.
Consider using this script in conjunction with your trading strategy for enhanced technical analysis.
Risk Warning: Trading involves significant risk, and past performance is not indicative of future results. Always practice proper risk management and consider the broader context of the market before making trading decisions.

All in One EMA indicator with Average EMA Calculations The Indicator displays multiple exponential moving averages (EMAs) on the chart. The six available options will let you adjust and set ]exponential moving averages ( EMAS) as per your choice. Additionally I have added an Average ema which will calculate the average of all the emas that you have selected. This average ema works very strong and greatly to find potential zone of dynamic supports and resistance as well as to gauge the overall trend .. The average ema will also allow you to keep your chart clean and you wont have to add too many emas together.
The average of the selected EMAs are displayed as a single line. This helps identify trends and potential reversals in the market. i hope this indicator will help you with trading...
Plz use the chart BINANCE:LINKBTC as reference, for back testing and educational purposes only.
Thumbs up if you liked the script.
Happy trading..

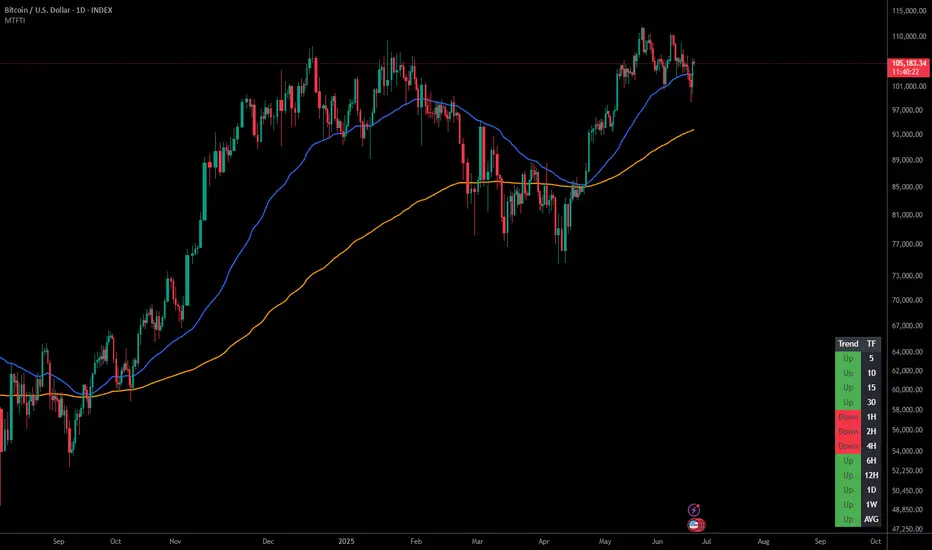
Multi-Timeframe Trend IndicatorThe Multi-Timeframe Trend Indicator (MTFTI) is a trend analysis tool designed to help traders quickly and easily assess the market direction across multiple timeframes. With the help of a table to visualize the trends on different timeframes.
Key features:
Multi-timeframe trend indicator for the following timeframes: 5 minutes, 15 minutes, 30 minutes, 1 hour, 2 hours, 4 hours, 6 hours, 12 hours, 1 day, and 1 week and average.
Displays trends for selected timeframes in a table.
Considers short and long-term exponential moving averages (EMAs) to determine trends.
Calculation of the average trend for all timeframes.
Display of trends with appropriate coloring for better readability (green for "Up", red for "Down", and intermediate shades for neutral or strong trends).
List of Parameters
Customization of the table's position on the screen (top-left, top-right, middle-left, middle-right, bottom-left, bottom-right).
Setting the lengths of the short and long-term exponential moving averages.
Option to activate or deactivate the display of EMAs for better customization (true by default).
Please note that the MTFTI is not a guarantee of future market performance and should be used in conjunction with proper risk management. Always ensure that you have a thorough understanding of the indicator’s methodology and its limitations before making any investment decisions. Additionally, past performance is not indicative of future results.
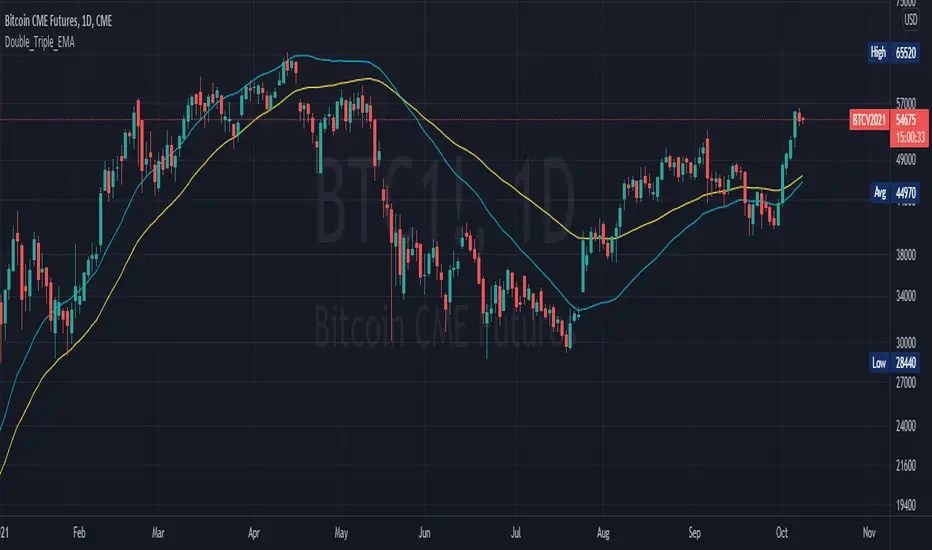
Double_Triple_EMALibrary "Double_Triple_EMA"
Provides the functions to calculate Double and Triple Exponentional Moving Averages (DEMA & TEMA).
dema(_source, _length) Calculates Double Exponentional Moving Averages (DEMA)
Parameters:
_source : -> Open, Close, High, Low, etc ('close' is used if no argument is supplied)
_length : -> DEMA length
Returns: Double Exponential Moving Average (DEMA) of an input source at the specified input length
tema(_source, _length) Calculates Triple Exponentional Moving Averages (TEMA)
Parameters:
_source : -> Open, Close, High, Low, etc ('close' is used if no argument is supplied)
_length : -> TEMA length
Returns: Triple Exponential Moving Average (TEMA) of an input source at the specified input length
EMA (10,20,60) + Bollinger BandsCombination of bollinger bands and exponential moving averages (10, 20, 60)
The coloring is optimized for dark background, and it is editable
This indicator combined 3 exponential moving average lines and bollinger bands . The EMA lines can be add or deleted in pine editor, and its parameters can be changed too. Same to the bollinger bands . Defaulted value for BB is 20SMA with 2 standard deviations.
Useful as a supplmentary indicators

Double EMA CROSS
Double EMA CROSS (DEC)
Useful for identifying and receiving alerts about uptrends and downtrends.
This script uses two Exponential Moving Averages (EMAs) to find price uptrends and downtrends.
An Exponential Moving Average ( EMA ) is a type of moving average that places a greater weight and significance on the most recent data points.
The script produces uptrend and downtrend signals based on crossovers and divergences between the two EMAs,
the user will be able to spot a trend change (when the EMAs crossover) and to determine the strength of the current trend (when the EMAs diverge).
It is also posible to get alerts for uptrends and downtrends on the web and mobile app with sound and pop-ups as well as via email.
The optimal time to enter and exit the market can be concluded from this trend changes.
The user can set their own EMAs, by default they are set to 25 and 75 periods for medium and long term respectively.
When the medium term EMA crosses below the long term EMA the asset is in a downtrend and the price will decline, and when the
medium term EMA crosses above the long term EMA the asset is in an uptrend and price will increase.
This scripts plots the following indicators and signals on the chart to help the user to identify trends:
1.- Medium and long term EMAs as lines overlaid on the price chart.
2.- Up green triangles above bars when the price is on an uptrend and down red triangles below bars when the price is on a downtrend.
3.- Arrows with text to indicate the start of an uptrend or downtrend.
The user can enable and disable the indicators and signals as well as set colors and shapes to their liking.
This script also lets the user create alerts for uptrends and downtrends. To create a new alert using this script follow this instructions:
1.- Once you added this script to your chart, go to the alerts panel (right on web or bottom tool bar on the mobile app) and add a new alert (alarm clock icon with a plus sign).
2.- A modal window will open. On the “Condition” dropdown menu select “DEC”.
3.- On the next dropdown menu (right below the “Condition” one) you can select.
4.- Lastly you can set all the normal alert options and create the alert.

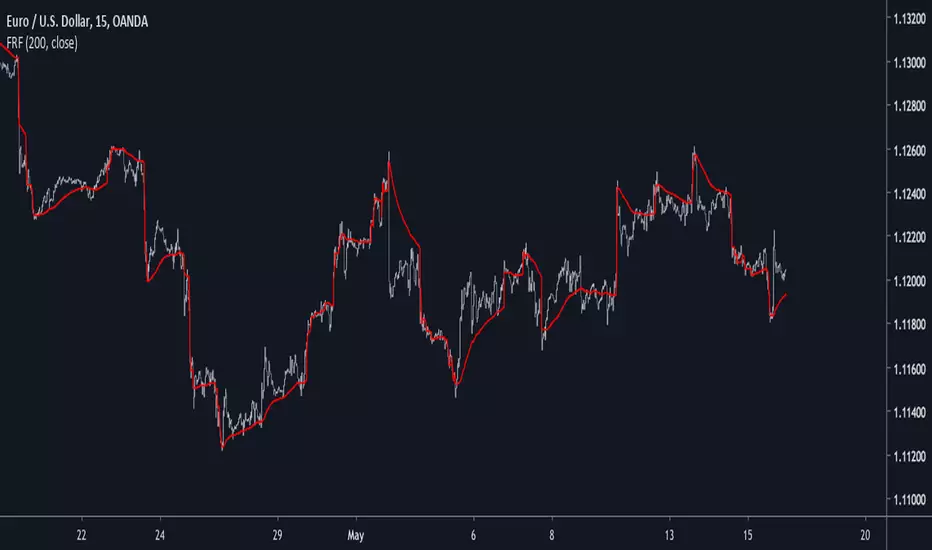
Falling-Rising FilterIntroduction
This is a modification of an old indicator i made. This filter aim to adapt to market trend by creating a smoothing constant using highest and lowest functions. This filter is visually similar to the edge-preserving filter, this similarity can make this filter quite good for MA cross strategies.
On The Filter Code
a = nz(a ) + alpha*nz(error ) + beta*nz(error )
The first 3 terms describe a simple exponential filter where error = price - a , beta introduce the adaptive part. beta is equal to 1 when the price is greater or lower than any past price over length period, else beta is equal to alpha , someone could ask why we use two smoothing variable (alpha, beta) instead of only beta thus having :
a = nz(a ) + beta*nz(error )
well alpha make the filter converge faster to the price thus having a better estimation.
In blue the filter using only beta and in red the filter using alpha and beta with both length = 200 , the red filter converge faster to the price, if you need smoother results but less precise estimation only use beta .
Conclusion
I have presented a simple indicator using rising/falling functions to calculate an adaptive filter, this also show that when you create an exponential filter you can use more terms instead of only a = a + alpha*(price - a ) . I hope you find this indicator useful.
Thanks for reading !
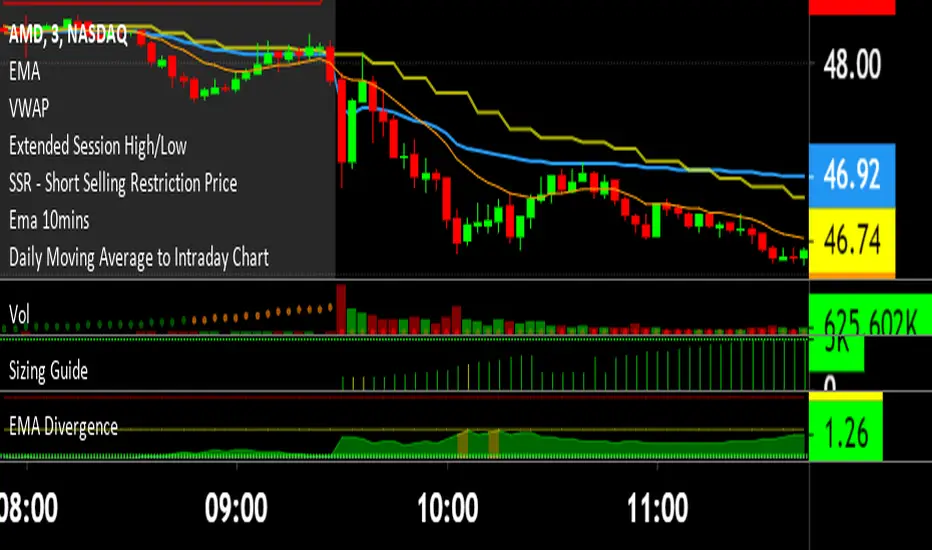
EMA DivergenceThis script automatically calculates the divergence between your favorite exponential moving average and the current price (13 ema default).
Additionally, it displays the area in yellow once the first threshold gets reached (1.5% divergence default) and in red once the second threshold gets reached (1.5% divergence default).
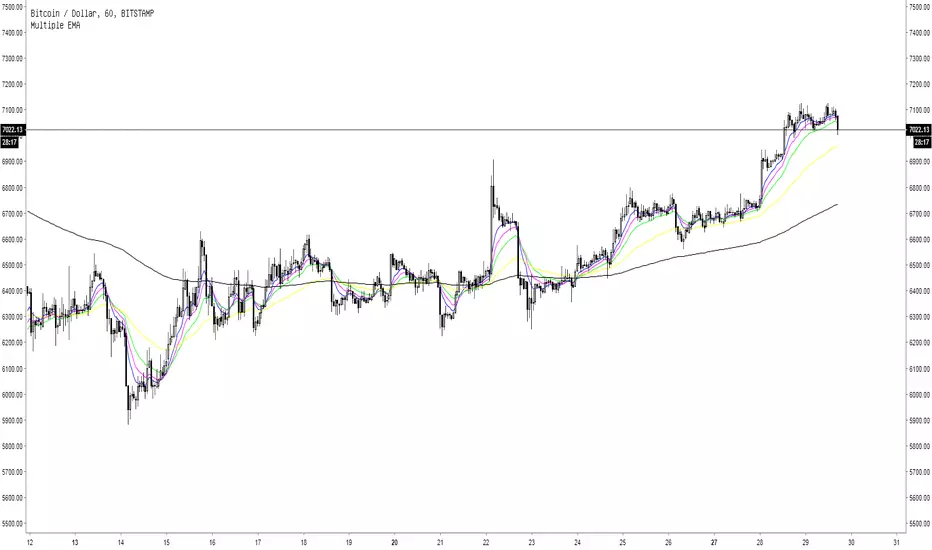
Multiple EMA5 Exponential Moving Averages
EMA 1: length 8, blue line
EMA 2: length 13, pink line
EMA 3: length 21, green line
EMA 4: length 55, yellow line
EMA 5: length 200, black line
Awesome Moving AveragesThis script allows you to add up to four simple and exponential moving averages the the chart instead of adding 4 simple moving averages and 4 exponential moving averages individually.
The stronger lines are SMA's and the thinner lines are EMA's.
White - "1st SMA" and "1st EMA"
Green - "2nd SMA" and "2nd EMA"
Blue - "3rd SMA" and "3rd EMA"
Red - "4th SMA" and "4th EMA"
You can modify which moving averages are visible on the chart and also modify the period of the moving averages.
There are four periods which you can edit - each period applies to a pair of moving averages (a pair of SMA and EMA). For example: "1st MA Length" option applies to "1st SMA" and "1st EMA" etc.
ibb.co
In addition to that Awesome Moving Averages script allows you to keep the daily moving averages resolution on intraday charts.
For example - here we have only "1st SMA" and "1st EMA" enabled and we are viewing a daily chart:
Now if we have "Keep Daily MA Resolution On Intraday Periods" option enabled we would see the daily moving averages (SMA and EMA) on intraday periods. Here we are viewing a 4h chart:
If you disable this option you would see the moving averages on intraday charts with the intraday MA lengths as you expect:
"Visible MA's On Intraday Periods" option allows you to choose which MA's you would like to be visible on intraday charts if the "Keep Daily MA Resolution On Intraday Periods" option is enabled.
If you have any thoughts or ideas on how to improve the "Awesome Moving Averages" script then let me know!

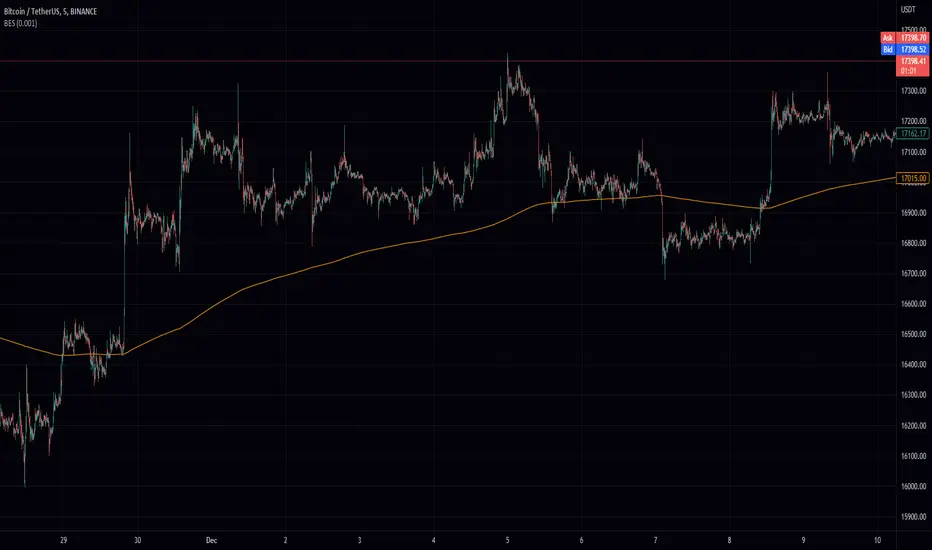
Brown's Exponential Smoothing (BES)The Brown's Exponential Smoothing indicator is a smoothing function that uses an exponentially weighted moving average to filter the input data. The "alpha" parameter controls the degree of smoothing, with a smaller value resulting in more smoothing and a larger value resulting in less smoothing.
The indicator is implemented as a function, bes, which takes two arguments: source and alpha. The source argument specifies the input data to be smoothed, and the alpha argument specifies the degree of smoothing. The default value for alpha is 0.7, but it can be modified by the user using an input field.
The bes function calculates a smoothed value using the current value of the input data and the previously calculated smoothed value, and updates the value of the smoothed data. This process is repeated for each data point in the input data, resulting in a smoothed version of the data.
The resulting smoothed data is then plotted on the chart using the plot function.
The "BES" indicator can be useful for smoothing noisy or volatile data and making trends in the data more discernible. It may be particularly useful in situations where the input data is highly variable or difficult to interpret due to noise. By adjusting the value of the alpha parameter, the user can control the degree of smoothing applied to the data, allowing them to tailor the indicator to their specific needs and preferences.
Heatmap Suite [PhenLabs]📊 Heatmap Suite
Version: PineScript™ v6
📌 Description
The Heatmap Suite is an advanced technical analysis tool that combines multiple density calculation methods with dynamic visualization to identify significant price levels and trading activity zones. It features a sophisticated analysis system that processes price and volume data through various kernel methods, providing traders with insights into market structure, support/resistance zones, and potential price reaction areas.
🚀 Points of Innovation:
Multi-method density calculation incorporating three distinct approaches
Adaptive visualization system with dynamic color gradients
Real-time dashboard with key market metrics
Significant level detection with automatic threshold adjustment
🚨 Important🚨
🔸Comprehensive tooltips included in the PhenLabs dashboard for in depth guidance
🔧 Core Components
Density Analysis: Multiple calculation methods for price distribution assessment
Heat Mapping: Dynamic visualization of price congestion zones
Level Detection: Automatic identification of significant price levels
Dashboard System: Real-time market metrics and analysis
🔥 Key Features
The indicator provides comprehensive analysis through:
Kernel Density: Traditional balanced view of price distribution
Exponential Kernel: Time-weighted analysis emphasizing recent price action
Volume-Weighted: Focus on high-volume price areas
Significant Levels: Automatic detection of important price zones
Heat Distribution: Color-coded visualization of price congestion
🎨 Visualization
Heat Zones: Shows intensity of price activity
Significant Lines: Key level indicators
Color Gradients: Indicates density strength
Dashboard Display: Real-time metrics
Dynamic Opacity: Reflects density intensity
📖 Usage Guidelines
The indicator offers several customization options:
Basic Settings:
Calculation Method: Choose between three density calculation approaches
Lookback Period: Analysis timeframe adjustment
Zone Count: Price range division granularity
Heat Sensitivity: Contrast adjustment for visualization
🎛️ Visual Settings:
Dashboard Size: Text size customization
Position: Dashboard placement options
Color Scheme: Heat map gradient visualization
Level Display: Significant price zone indicators
✅ Best Use Cases:
Identify strong support/resistance zones through high-density areas
Spot potential price reversal zones at significant levels
Analyze price congestion patterns
Monitor real-time changes in market structure
⚠️ Limitations
Requires sufficient historical data
Computational intensity increases with longer lookback periods
Heat sensitivity needs adjustment based on market conditions
Dashboard placement may need adjustment based on price action
💡 What Makes This Unique
Multi-method Analysis: Three distinct calculation approaches
Adaptive Visualization: Dynamic color gradient system
Real-time Metrics: Comprehensive dashboard display
Automatic Level Detection: Significant price zone identification
Memory-efficient Design: Optimized calculation methods
🔬 How It Works
The indicator processes market data through four main components:
1. Density Calculation:
Processes price and volume data
Applies selected kernel method
Generates density distribution
2. Heat Mapping:
Converts density values to color gradients
Updates visualization in real-time
Displays price congestion zones
3. Level Detection:
Identifies significant price levels
Applies threshold filtering
Marks important zones
4. Dashboard Updates:
Calculates real-time metrics
Updates display components
Provides market context
💡Note:
The indicator performs best with adequate historical data and proper sensitivity settings. Its sophisticated density analysis provides valuable insights into market structure beyond traditional support/resistance indicators.

Fear Of Missing Out grid of forex tradingAbstract
This script finds potential safe grids placing limit orders without fear of missing out.
This script computes grids according to power of 1.0025 .
You can reference those price levels for your trading.
Introduction
Grid trading is a popular trading method.
Traders plan several price levels as grids and repeat buying at lower grids and selling at higher grids.
Grids can be round number like multiple of 100 pips.
Grids can also be support and resistance according to price history.
Some traders may think they need to adjust grids to trade.
However, there are several problems in choosing grids.
One problem is rate of change is related and therefore exponential. 20 to 30 is different from 30 to 40.
Another interesting point is there are some special impressing reversal price levels.
Several months ago, I had a question why usdjpy bounced near 108.3 .
After using a calculator, I found that 108.3 = 100 * 1.083 ≒ 100 * pow(1.0025,31) .
1.0025 , as known as 0.25% of change, is a potential stop out zone.
Therefore, we can compute grids and one grid is a little more than 1.0025 times than an another one.
After we finished computing grids, we can consider buy and sell near those grids.
Note that different traders may obtain different grid values.
For example, from 1.0 to 2.0 , it can be splited as 270 grids or 277 grids because pow(1.0025,277)<2 .
Those grids cannot always imply potential reversal points but they can be useful for traders looking for 0.25% profit targets with reducing fearing of buying or selling too early.
Computing grids
This script split from 1.0 to 10.0 into three segments.
One is 1.0 to 2.0 .
The second segment is from 2.0 to 5.0 .
The third segment is from 5.0 to 10.0 .
This script does the same thing for 0.1 to 1.0 , 10.0 to 100.0 , and so on.
For 1.0 to 2.0 and 5.0 to 10.0 , this script split a segment as 270 grids.
For 2.0 to 5.0 , this script split a segment as 360 grids.
The last step is display the next grids to the daily low and daily high.
Maybe also display the grids behind grids shown.
Parameters
x1,x2,x3,x4 : display the next x1,x2,x3,x4 grids to daily high and daily low. 1 means the next grid to daily high and daily low. 2 means the next grid to 1.
x_seg : default 2.0 . This script split from 1.0 to 10.0 into three segments. One is 1.0 to x_seg. The second segment is from x_seg to 10.0/x_seg . The third segment is from 10.0/x_seg to 10.0 .
x_grid1 : how many grids in the first segment
x_grid2 : how many grids in the second segment
x_lowprice : add this number for bigger grid distance. Generally, you don't need this number when trading forex but you may need it in stock trading. For stocks with price between 50 to 100, I recommend you use x_lowprice=100.
Conclusion and suggestions
This script can find potential grids for trading.
If price touches grids usually, we can consider buy and sell after price touches grids.
If price reverses before touching grids usually, we may consider buy and sell before price touches grids.
Those grids can remind us don't buy too much unless the price touches the next grid.
For instruments with less volatility, maybe we need more grids.
For traders with more money, they may also consider more grids for more dedicated range trading to collect more profit.
Reference
Sorry, I forgot them.

Two Exponential Moving AveragesHi
It is for traders who do not have Pro badge on trading view. They are limited to use only 3 indicators. By using two moving averages in a single indicator would enhance their access from the current 3 to a plus one means four indicators.
You will be able to change the color of the lines, their thickness and their values.
I hope you will enjoy this work.
Regards
Bravetotrade

crashm111 3-200 Moving Average RibbonAll the moving averages bewteen 3 and 200 in increments of 5.
with the ability to change colours
and change between simple and exponential.
It provides an easy and fast way to determine the trend direction and possible reversals.

4EMA (8,13,21,55) + Bollinger BandsFive indicators in one.
4 Moving Average Exponential : 8, 13, 21, 55 - as per @Philakone strategy
Bollinger Bands
Check out my other scripts for RSI and Stoch RSI all in one, and 4EMA + Death Cross + Bollinger Bands.

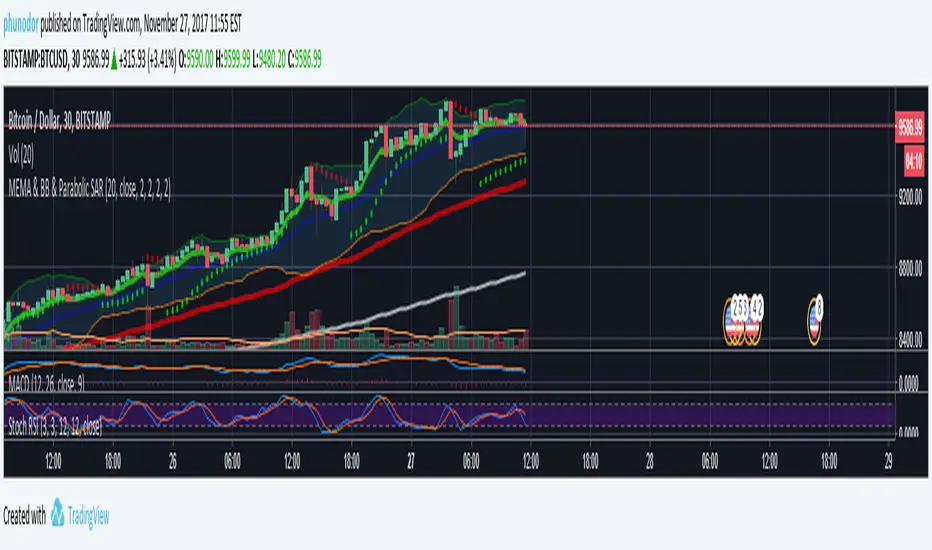
MEMA & BB & Parabolic SARMultiple Exponential Moving Average : 7, 77, 231
Bollinger Bands
Parabolic SAR
Simple and Exponential Moving AveragesThis script graphs 5 SMAs (20, 50, 100, 150, 200) and 5 EMAs (20, 50, 100, 150, 200). The first group uses blue and orange colors whereas the second one uses green and red. When a bar closes below a moving average, either orange or red will be used depending on which type of moving average and which period. In bullish mode, we show blue and green. Moving average periods are configurable, and you can hide the MAs you don't want.

Alper-EMAAlper-EMA
Description:
This indicator allows you to display 5 customizable EMAs (Exponential Moving Averages) on a single chart. Each EMA can be configured independently with length, color, visibility, and calculation timeframe.
Features:
5 fully customizable EMAs
Set individual length and color for each EMA
Toggle visibility for each EMA
Multi-timeframe calculation: e.g., display EMA300 calculated on a 30-minute timeframe while viewing a 1-minute chart
Labels display EMA period and timeframe for clarity
Adjustable label size: tiny / small / normal / large
Clear and readable plot lines
Use Cases:
Monitor multiple timeframe EMAs simultaneously
Analyze trend and support/resistance levels
Track EMA crossovers for strategy development
Note:
This indicator is suitable for both short-term (scalping) and medium-to-long term analysis. The multi-timeframe feature allows you to see different EMA perspectives on a single chart quickly.

The Trade Plan 9 & 15 EMA⭐ What Are EMAs?
An Exponential Moving Average (EMA) gives more weight to recent prices, making it more responsive than a simple moving average.
9-EMA = very fast, reacts quickly to price changes
15-EMA = slightly slower, smooths short-term noise
Together they help identify momentum shifts.
📈 How the 9/15 EMA Strategy Works
1. Buy Signal (Bullish Crossover)
You enter a long (buy) trade when:
➡ 9 EMA crosses above the 15 EMA
This suggests momentum is shifting upward and a new uptrend may be forming.
2. Sell Signal (Bearish Crossover)
You enter a short (sell) trade or exit long positions when:
➡ 9 EMA crosses below the 15 EMA
This suggests momentum is turning downward.
🔧 How Traders Typically Use It
Entry
Wait for a clear crossover.
Confirm with price closing on the same side of EMAs.
Some traders add confirmation using RSI, MACD, or support/resistance.
Exit
Several options:
Exit when the opposite crossover occurs.
Exit at predetermined risk-reward levels (e.g., 1:2).
Use trailing stop below/above EMAs.
👍 Strengths
Easy to follow
Good for fast-moving markets
Works well on trending markets
Minimal indicators needed
👎 Weaknesses
Whipsaws in sideways markets
Many false signals on very low timeframes
Works best with additional filters
🕒 Common Timeframes
Scalping: 1m, 5m
Day trading: 5m, 15m
Swing trading: 1H, 4H

Volume Weighted EMAsIt's a script to calculate the volume weighted moving averages using exponential moving averages such as EMA, DEMA and TEMA instead of the pre-existing VWMA which uses SMA to calculate it.
Note: works only with charts that have volume data present, obviously !!!

Super MTF Clouds (4x3 Pairs)Overview:
This script is based on Ripster's MTF clouds, which transcends the standard moving average cloud indicator by offering a powerful and deeply customizable Multi-Timeframe (MTF) analysis. Instead of being limited to the moving averages of your current charts from the current timeframe, this tool allows you to project and visualize the trend and key support/resistance zones from up to 4 different timeframes simultaneously. User can input up to 6 different EMA values which will form 3 pairs of EMA clouds, for each of the timeframes.
The primary purpose is to provide traders with immediate confluence. By observing how price interacts with moving average clouds from higher timeframes (e.g., Hourly, Daily, Weekly), you can make more informed decisions on your active trading timeframe (e.g., 10 Minute). It's designed as a complete MTF Cloud toolkit, allowing you to display all necessary MTFs in a single script to build a comprehensive view of the market structure without having to flick to different timeframe to look for cloud positions.
Key features:
Four Independent Multi-Timeframe Slots: Each slot can be assigned any timeframe available on TradingView (e.g., D, W, M, 4H).
Three MA Pairs Per Timeframe: For each timeframe, configure up to three separate MA clouds (e.g., a 9/12 EMA pair, a 20/50 EMA pair, and a 100/200 SMA pair).
Complete Customisation: For every single moving average (24 in total), you can independently control:
MA Type: Choose between EMA or SMA.
Length: Any period you require.
Line Color: Full colour selection.
Line Thickness: Adjust the visual weight of each line.
Cloud Control: For every pair (12 in total), you can set the fill colour and transparency.
How To Use This Script:
This tool is best used for confirmation and context. Here are some practical strategies that one can adopt:
Trend Confluence: Before taking a trade based on a signal on your current timeframe, glance at the higher timeframe clouds. If you see a buy signal on the 15-minute chart and the price is currently trading above a thick, bullish Daily cloud, the probability of that trade succeeding is significantly higher. Conversely, shorting into strong HTF support is a low-probability trade.
Dynamic Support & Resistance: The edges of the higher timeframe clouds often act as powerful, dynamic levels of support and resistance. A pullback to the 4-Hour 50 EMA on your 15-minute chart can be a prime area to look for entries in the direction of the larger trend.
Gauging Market Regimes: Use the toggles in the settings to quickly switch between different views. You can have a "risk-on" view with short-term clouds and a "macro" view with weekly and monthly clouds. This helps you adapt your trading style to the current market conditions.
Key Settings:
1. Global Setting
Source For All MAs: This determines the price data point used for every single moving average calculation.
Default: hl2 (an average of the High and Low of each bar). This gives a smooth midpoint price.
Options: You can change this to Close (the most common method), Open, High, Low, or ohlc4 (an average of the open, high, low, and close), among others.
Recommendation: For most standard trend analysis, the default hl2 is the common choice.
2. The Timeframe Group Structure
The rest of the settings are organized into four identical, collapsible groups: "Timeframe 1 Settings" through "Timeframe 4 Settings". Each group acts as a self-contained control panel for one multi-timeframe view.
Within each timeframe group, you have two master controls:
Enable Timeframe: This is the main power switch for the entire group. Uncheck this box to instantly hide all three clouds and lines associated with this timeframe. This is perfect for quickly decluttering your chart or focusing on a different set of analyses.
Timeframe: This dropdown menu is the heart of the MTF feature. Here, you select the higher timeframe you want to analyse (e.g., 1D for Daily, 1W for Weekly, 4H for 4-Hour). All calculations for the three pairs within this group will be based on the timeframe you select here.
3. Pair-Specific Controls
Inside each timeframe group, there are three sections for "Pair 1", "Pair 2", and "Pair 3". These control each individual moving average cloud.
Enable Pair: Just like the master switch for the timeframe, this checkbox turns a single cloud and its two MA lines on or off.
For each pair, the settings are further broken down:
Moving Average Lines (A and B): These two rows control the two moving averages that form the cloud. 'A' is typically used for the shorter-period MA and 'B' for the longer-period one.
Type (A/B): A dropdown menu to select either EMA (Exponential Moving Average) or SMA (Simple Moving Average). EMAs react more quickly to recent price changes, while SMAs are smoother and react more slowly.
Length (A/B): The lookback period for the moving average (e.g., 21, 50, 200).
Color (A/B): Sets the specific colour of the MA line itself on your chart.
Cloud Fill Settings
Fill Color: This controls the colour of the shaded area (the "cloud") between the two moving average lines. For a consistent look, you can set this to the same colour as your shorter MA line.
Transparency: Controls how see-through the cloud is, on a scale of 0 to 100. 0 is a solid, opaque colour, while 100 is completely invisible. The default of 85 provides a light, "cloud-like" appearance that doesn't obscure the price action.
----------------------------------------------------------------------
If anything is not clear please let me know!
