Liquidity Sweep Guardian (Universal % or point based)
Liquidity Sweep Guardian - Complete User Guide
## Overview
The **Liquidity Sweep Guardian** is a visual warning system designed to prevent premature counter-trend trades (fades) near Previous Day High (PDH) and Previous Day Low (PDL) levels. This indicator helps you avoid one of the most common trading mistakes: fading too early before liquidity sweeps complete.
---
## 🎯 Core Trading Principle
### **THE GOLDEN RULE: Don't Fade Until It's Unlocked**
Price often **accelerates into key levels** to sweep liquidity before reversing. Trading against this momentum is extremely dangerous.
**The Process:**
1. **Danger Zone** (Red/White Box) = ⚠️ **DO NOT FADE** - Sweep likely incoming
2. **Sweep Occurs** (Triangle marker appears) = Price penetrates the level
3. **Reclaim Happens** (Price returns above/below level) = Level is tested
4. **🔓 UNLOCKED** (Gold border, green label) = **NOW you may CONSIDER a fade**
> **Important:** "UNLOCKED" means you may now *consider* a fade setup. It is NOT a trade signal itself. You still need your entry confirmation, risk management, and trade plan.
---
## 📊 Visual Elements Explained
### 1. **Danger Zone Boxes (Red Border by Default)**
**Two types of zones around PDH/PDL:**
- **Outer Danger Zone** (White fill): ±75pts (or 0.30%) around the level
- Indicates proximity to a key level where sweeps commonly occur
- Yellow/cautious trading zone
- **Inner Critical Zone** (Black fill): ±25pts (or 0.10%) around the level
- Highest probability area for liquidity sweep traps
- Avoid fading here at all costs
**What to do:**
- When price enters these zones, **wait and watch**
- Do not initiate counter-trend positions
- Allow the sweep to play out
### 2. **Unlocked Zones (Gold Border #ffeb3b)**
When a zone turns **gold/yellow** with green fill:
- The level has been swept AND reclaimed
- The liquidity grab is complete
- You may now look for fade opportunities with proper confirmation
### 3. **PDH/PDL Lines**
- **PDH Line** (Red): Previous Day High with price label
- **PDL Line** (Green): Previous Day Low with price label
- These are your key reference levels for the session
### 4. **Sweep Labels**
**Triangle Markers (SWEEP):**
- **Green Triangle** = Clean sweep (10-25pts penetration)
- **Orange Triangle** = Extended sweep (25-50pts penetration)
- **Red Triangle** = Deep penetration (50+ pts) - likely continuation, not reversal
**Warning Labels:**
- **⚠️ DEEP CONTINUATION?** = Penetration too deep, probably NOT a reversal setup
**Unlock Labels:**
- **🔓 LONG UNLOCKED** = PDL swept and reclaimed, may consider long fades
- **🔓 SHORT UNLOCKED** = PDH swept and reclaimed, may consider short fades
---
## ⚙️ Settings Guide
### **Calculation Mode**
**Use Percentage Mode (Default: ON)**
- ✅ **Enabled**: Universal mode - works on NQ, ES, RTY, stocks, crypto, forex
- ❌ **Disabled**: Fixed points mode - for specific instruments only
**When to use each:**
- **Percentage Mode**: Trading multiple instruments, or instruments with varying price levels
- **Fixed Points Mode**: Single instrument focus (e.g., only trading NQ at current levels)
### **Danger Zone Settings**
**Percentage Mode (Default for Universal Use):**
- **Danger Zone**: 0.30% each side (≈75pts on NQ@25,000)
- **Critical Zone**: 0.10% each side (≈25pts on NQ@25,000)
**Fixed Points Mode (For NQ Specifically):**
- **Danger Zone**: 75 points each side
- **Critical Zone**: 25 points each side
**Adjustment Tips:**
- For more volatile instruments: Increase percentages/points
- For less volatile instruments: Decrease percentages/points
- For higher timeframes: Use wider zones
- For lower timeframes: Use tighter zones
### **Sweep Classification**
**What defines a "real" sweep:**
- **Minimum**: 10pts / 0.04% - Shallow penetration may not grab enough liquidity
- **Optimal**: 10-25pts / 0.04-0.10% - "Goldilocks zone" for reversal setups
- **Extended**: 25-50pts / 0.10-0.20% - Deeper sweep, less reliable
- **Continuation**: 50+pts / 0.20%+ - Too deep, likely NOT reversing
**Max Bars for Reclaim**: 5 bars (default)
- Price should reclaim the level relatively quickly
- If it takes too long, the sweep may have failed
### **Visual Customization**
**Box Settings:**
- **Left Extension**: 60 bars (how far back the box extends)
- **Right Extension**: 50 bars (how far forward the box extends)
**Toggle Options:**
- Show/Hide Danger Zone Boxes
- Show/Hide PDH/PDL Lines
- Show/Hide Price Labels on lines
- Show/Hide Sweep Labels
- Show/Hide Unlock Labels
### **Color Customization**
All colors are fully customizable:
- Danger Zone Fill & Border
- Critical Zone Fill & Border
- Unlocked Zone Fill & Border
- PDH/PDL Line Colors
- PDH/PDL Label Colors
- Border Widths (1-5 pixels)
- Line Widths (1-5 pixels)
---
## 🎓 Trading Strategy Examples
### **Example 1: Long Setup at PDL**
1. **Morning**: Price approaches PDL (danger zone appears)
2. **Don't Fade Yet**: Price enters critical zone - resist urge to buy
3. **Sweep**: Price drops 15pts below PDL (green triangle appears)
4. **Reclaim**: Price closes back above PDL within 3 bars
5. **🔓 UNLOCKED**: Gold border + "LONG UNLOCKED" label appears
6. **Trade Setup**: Now look for bullish confirmation (order flow, structure, etc.)
### **Example 2: Avoiding a Trap at PDH**
1. **Afternoon**: Price rallies into PDH danger zone
2. **Temptation**: You want to short here (it "looks toppy")
3. **Sweep**: Price breaks 50pts above PDH (red triangle + ⚠️ warning)
4. **Continuation**: Deep penetration suggests continuation, not reversal
5. **Result**: No unlock occurs, price keeps running higher - trap avoided!
### **Example 3: Failed Unlock (No Trade)**
1. Price sweeps PDL by 12pts (green triangle)
2. Price struggles to reclaim PDL, stays below for 10+ bars
3. No "UNLOCKED" label appears
4. **Correct Action**: Do not fade - sweep failed to reclaim
---
## 📱 Alerts
The indicator includes built-in alerts for:
- **Entering Danger Zones**: Get warned when price approaches PDH/PDL
- **Sweep Detection**: Know immediately when a level is swept
- **Unlock Signals**: Get notified when fade setups become available
- **Continuation Warnings**: Alert when penetration suggests continuation
**To Set Alerts:**
1. Right-click indicator → "Add Alert"
2. Select desired alert condition
3. Configure notification preferences
---
## ⚠️ Important Disclaimers
### **What This Indicator IS:**
✅ A visual warning system to prevent premature fades
✅ A tool to identify when liquidity sweeps have completed
✅ A framework for counter-trend trade timing
### **What This Indicator IS NOT:**
❌ A complete trading system
❌ An entry signal generator
❌ A guarantee of trade success
❌ A substitute for proper risk management
### **Always Remember:**
- "UNLOCKED" = You may CONSIDER a fade (not a signal to trade)
- You still need your own entry confirmation
- You still need proper stop placement
- You still need position sizing and risk management
- Not every unlock leads to a successful trade
- Market context and order flow still matter
---
## 🔧 Recommended Settings by Instrument
### **NQ (Nasdaq-100 E-mini Futures)**
- Mode: Percentage or Fixed Points
- Percentage: 0.30% / 0.10% (default)
- Fixed Points: 75pts / 25pts (default)
### **ES (S&P 500 E-mini Futures)**
- Mode: Percentage
- Danger: 0.25% / Critical: 0.08%
- Or Fixed Points: 15pts / 5pts
### **RTY (Russell 2000 E-mini Futures)**
- Mode: Percentage
- Danger: 0.35% / Critical: 0.12%
- Or Fixed Points: 8pts / 3pts
### **Stocks (High Volume Large Caps)**
- Mode: Percentage (recommended)
- Danger: 0.20-0.40% / Critical: 0.08-0.15%
- Adjust based on ATR and volatility
### **Crypto (BTC, ETH)**
- Mode: Percentage (essential)
- Danger: 0.40-0.60% / Critical: 0.15-0.20%
- Higher volatility requires wider zones
---
## 💡 Pro Tips
1. **Use on Higher Timeframes**: Works best on 5min, 15min, 1hr charts
2. **Combine with Order Flow**: Use with footprint/delta for confirmation
3. **Watch Volume**: Strong volume on sweep = better reversal potential
4. **Consider Time of Day**: Sweeps during RTH often more reliable
5. **Multiple Timeframes**: Check if higher TF also shows unlock
6. **Don't Force Trades**: Not every session produces clean setups
7. **Journal Results**: Track which unlock types work best for you
8. **Respect Continuation Signals**: When indicator says "too deep," listen
---
## 🆘 Troubleshooting
**Q: Box isn't showing up**
A: Check that "Show Danger Zone Boxes" is enabled in Visual Settings
**Q: No price on labels**
A: Enable "Show Price Labels on Lines" in Visual Settings
**Q: Zones seem too tight/wide**
A: Adjust Danger Zone % or points based on current volatility
**Q: Getting too many/too few unlocks**
A: Adjust sweep classification thresholds (min/max penetration)
**Q: Want thicker/thinner lines**
A: Adjust line widths in "PDH/PDL Line Colors" section
**Q: Colors not matching my chart theme**
A: Fully customize all colors in the color settings groups
---
## 📚 Additional Resources
- Study price action around PDH/PDL on your instruments
- Learn about liquidity sweeps and stop hunts
- Understand market structure and order flow
- Practice identifying setups on replay/historical data
- Keep a trading journal of unlock scenarios
---
*Remember: The best trade is often the one you don't take. This indicator helps you avoid the trades you shouldn't take, so you can focus on the ones you should.*
Cari dalam skrip untuk "Futures"

Unmitigated MTF High Low Pro - Cave Diving Bookmap Heatmap Plot
Unmitigated MTF High Low Pro - Cave Diving Bookmap Heatmap Plot
---
## 📖 Table of Contents
1. (#what-this-indicator-does)
2. (#core-concepts)
3. (#visual-components)
4. (#the-cave-diving-framework)
5. (#how-to-use-it-for-trading)
6. (#settings--customization)
7. (#best-practices)
8. (#common-scenarios)
---
## What This Indicator Does
The **Unmitigated MTF High Low v2.0** tracks unmitigated (untouch) high and low levels across multiple timeframes, helping you identify key support and resistance zones that the market hasn't revisited yet. Think of it as a sophisticated memory system for price action - it remembers where price has been, and more importantly, where it *hasn't been back to*.
### Why "Unmitigated" Matters
In futures trading, especially on instruments like NQ and ES, the market has a tendency to revisit levels where liquidity was left behind. An "unmitigated" level is one that hasn't been touched since it was formed. These levels often act as magnets for price, and understanding their age and proximity gives you a significant edge in:
- **Entry timing** - Waiting for price to approach tested levels
- **Exit planning** - Taking profits before ancient resistance/support
- **Risk management** - Avoiding entries when approaching multiple old levels
- **Liquidity mapping** - Visualizing where orders likely cluster
---
## Core Concepts
### 1. **Sessions & Age**
The indicator uses **New York trading sessions** (6:00 PM to 5:59 PM NY time) as the primary time measurement. This aligns with how futures markets naturally segment their activity.
**Age Categories:**
- 🟢 **New (0-1 sessions)** - Fresh levels, recently formed
- 🟡 **Medium (2-3 sessions)** - Tested by time, gaining significance
- 🔴 **Old (4-6 sessions)** - Highly significant, survived multiple days
- 🟣 **Ancient (7+ sessions)** - Extreme significance, major support/resistance
The longer a level remains unmitigated, the more significant it becomes. Think of it like compound interest - time adds weight to these zones.
### 2. **Multi-Timeframe Tracking**
You can set the indicator to track high/low levels from any timeframe (default is 15 minutes). This means you're watching for unmitigated 15-minute highs and lows while trading on, say, a 1-minute or 5-minute chart.
**Why this matters:**
- Higher timeframe levels have more weight
- You can see multiple timeframe structure simultaneously
- Helps you avoid fighting larger timeframe momentum
### 3. **Mitigation**
A level becomes "mitigated" (deactivated) when price touches it:
- **High levels** are mitigated when price reaches or exceeds them
- **Low levels** are mitigated when price reaches or goes below them
Once mitigated, the level disappears from view. The indicator only shows you the untouch levels that still matter.
---
## Visual Components
### 📊 The Dashboard Table
Located in the corner of your chart (configurable), the table shows:
```
┌─────────┬───────────┬────────┬─────┬───────┐
│ Level │ Price │ Points │ Age │ % │
├─────────┼───────────┼────────┼─────┼───────┤
│ ↑↑↑↑↑ │ 21,450.25 │ +45.50 │ 8 │ +0.21%│ ← 5th High (Ancient)
│ ↑↑↑↑ │ 21,430.00 │ +25.25 │ 5 │ +0.12%│ ← 4th High (Old)
│ ↑↑↑ │ 21,420.50 │ +15.75 │ 3 │ +0.07%│ ← 3rd High (Medium)
│ ↑↑ │ 21,412.00 │ +7.25 │ 1 │ +0.03%│ ← 2nd High (New)
│ ↑ ⚠️ │ 21,408.25 │ +3.50 │ 0 │ +0.02%│ ← 1st High (Proximity Alert!)
├─────────┼───────────┼────────┼─────┼───────┤
│ 15 mins │ 🟢 │ Δ 8.75 │ 2U │ │ ← Status Row
├─────────┼───────────┼────────┼─────┼───────┤
│ ↓ ⚠️ │ 21,399.50 │ -5.25 │ 0 │ -0.02%│ ← 1st Low (Proximity Alert!)
│ ↓↓ │ 21,395.00 │ -9.75 │ 2 │ -0.05%│ ← 2nd Low (Medium)
│ ↓↓↓ │ 21,385.25 │ -19.50 │ 4 │ -0.09%│ ← 3rd Low (Old)
│ ↓↓↓↓ │ 21,370.00 │ -34.75 │ 6 │ -0.16%│ ← 4th Low (Old)
│ ↓↓↓↓↓ │ 21,350.75 │ -54.00 │ 9 │ -0.25%│ ← 5th Low (Ancient)
├─────────┼───────────┼────────┼─────┼───────┤
│ 📊 15↑ / 12↓ │ ← Statistics (optional)
└─────────┴───────────┴────────┴─────┴───────┘
```
**Reading the Table:**
- **Level Column**: Number of arrows indicates position (1-5), color shows age
- **Price**: The actual price level
- **Points**: Distance from current price (+ for highs, - for lows)
- **Age**: Number of full sessions since creation
- **%**: Percentage distance from current price
- **⚠️**: Proximity alert - price is within threshold distance
- **Status Row**: Shows timeframe, direction (🟢 bullish/🔴 bearish), tunnel width (Δ), and Strat pattern
### 📈 Visual Elements on Chart
**1. Level Lines**
- Horizontal lines showing each unmitigated level
- **Color-coded by age**: Bright colors = new, darker = older, deep purple/teal = ancient
- **Line style**: Customizable (solid, dashed, dotted)
- Automatically turn **yellow** when price gets close (proximity alert)
**2. Price Labels**
- Show the exact price and age: "21,450.25 (8d)"
- Fixed at small size for clean readability
- Positioned with configurable offset from current bar
**3. Bands (Optional)**
- Shaded zones between pairs of unmitigated levels
- Default: Between 1st and 2nd levels (the "tunnel")
- Can switch to 1st-3rd, 2nd-3rd, or disable entirely
- **Upper band** (pink/maroon) - Between unmitigated highs
- **Lower band** (blue/teal) - Between unmitigated lows
- These represent the "no man's land" or consolidation zones
---
## The Cave Diving Framework
This indicator is designed around the **Cave Diving Trading Framework** - a psychological and technical approach that maps cave diving safety protocols to futures trading risk management.
### 🤿 The Core Metaphor
**Cave diving has clear danger zones based on depth and overhead environment. Your trading should too.**
#### Shallow Water (New Levels, 0-1 Sessions)
- **Light**: Bright colors (bright red highs, bright green lows)
- **Psychology**: Fresh territory, recently tested
- **Trading**: Be aware but not overly concerned
- **Cave Diving Parallel**: You can see the surface, easy exit
#### Penetration Depth (Medium Levels, 2-3 Sessions)
- **Light**: Medium intensity colors
- **Psychology**: Building significance, market memory forming
- **Trading**: Start respecting these levels for entries/exits
- **Cave Diving Parallel**: Deeper in, need to track your line back
#### Deep Dive Zone (Old Levels, 4-6 Sessions)
- **Light**: Dark colors (deep maroon, dark blue)
- **Psychology**: Highly tested support/resistance
- **Trading**: Major decision points, plan accordingly
- **Cave Diving Parallel**: Significant overhead, careful navigation required
#### Overhead Environment (Ancient Levels, 7+ Sessions)
- **Light**: Very dark, purple/deep teal
- **Psychology**: Extreme caution required, major liquidity zones
- **Trading**: These are your "turn back" signals - don't fight ancient levels
- **Cave Diving Parallel**: Maximum danger, no room for error
### 🎯 The Proximity Alert System
Just like a cave diver's depth gauge that warns at critical thresholds, the proximity alerts (⚠️) tell you when you're entering a danger zone. When price gets within your configured threshold (default 5 points), the indicator:
- Highlights the level in **yellow** on the chart
- Shows **⚠️** in the table
- Signals: "You're entering a high-significance zone - adjust your position accordingly"
This prevents the trading equivalent of going deeper into a cave without checking your air supply.
---
## How to Use It for Trading
### 🎯 Entry Strategies
**1. The "Bounce Setup" (Mean Reversion)**
- Wait for price to approach an old or ancient unmitigated level
- Look for confluence: multiple levels nearby, bands narrowing
- Enter when price shows rejection (reversal candle patterns)
- **Example**: Price drops to a 6-session-old low, shows bullish engulfing → Long entry
**2. The "Break and Retest" (Trend Following)**
- Wait for price to break through an unmitigated level (mitigates it)
- Enter on the retest of the newly broken level
- **Example**: Price breaks above 4-session-old high → Wait for pullback to that level → Long entry
**3. The "Tunnel Trade" (Range Trading)**
- When bands are active, trade the range between 1st-2nd levels
- Short near upper band resistance, long near lower band support
- Exit at opposite side or when bands break
### 🚨 Risk Management Rules
**The Ancient Level Rule**
> Never fight ancient levels (7+ sessions). If you're long and approaching an ancient high, take profits. If you're short and approaching an ancient low, take profits.
These levels have survived a full trading week without being touched - there's likely significant liquidity and institutional interest there.
**The Proximity Exit Rule**
> When you see ⚠️ proximity alerts on multiple levels above/below your position, tighten stops or scale out.
This is your "overhead environment" warning. You're in dangerous territory.
**The New Level Filter**
> Be cautious taking positions based solely on new levels (0-1 sessions). Wait for them to age or combine with other confluence.
Fresh levels haven't been tested by time. They're like unconfirmed support/resistance.
### 📊 Reading Market Structure
**Bullish Structure (🟢 in status row)**
- Unmitigated lows are aging and holding
- Price respecting the lower band
- Old lows below acting as strong support
- **Bias**: Look for long entries at lower levels
**Bearish Structure (🔴 in status row)**
- Unmitigated highs are aging and holding
- Price respecting the upper band
- Old highs above acting as strong resistance
- **Bias**: Look for short entries at higher levels
**The Tunnel Compression**
- When the Δ (delta) in the status row is small, levels are tight
- This often precedes a breakout
- **Trading**: Wait for breakout direction, then trade the break
### 🔄 Strat Integration
The indicator shows Strat patterns in the status row:
- **1** - Inside bar (consolidation)
- **2U** - Broke high only (bullish)
- **2D** - Broke low only (bearish)
- **3** - Broke both (wide range, volatility)
Use these with the unmitigated levels:
- **2U near old high** → Potential resistance, watch for rejection
- **2D near old low** → Potential support, watch for bounce
- **3 pattern** → High volatility, respect wider stops
---
## Settings & Customization
### 📅 Session & Timeframe Settings
**HL Interval** (Default: 15 minutes)
- The timeframe for high/low calculation
- **Lower (1m, 5m)**: More levels, more noise, good for scalping
- **Higher (30m, 1H, 4H)**: Fewer levels, stronger significance, good for swing trading
- **Recommendation for NQ/ES**: 15m or 30m for day trading, 1H for swing trading
**Session Age Threshold** (Default: 2)
- How many sessions before a level is considered "old"
- Lower = more levels classified as old
- Higher = stricter definition of significance
### 📊 Level Display Options
**Show Level Lines**
- Toggle: Display horizontal lines for each level
- **Turn off** if you prefer a cleaner chart and only want the table
**Show Level Labels**
- Toggle: Display price labels on the chart
- **Turn off** for minimal visual clutter
**Label Offset**
- Distance (in bars) from current price bar to place labels
- Increase if labels overlap with price action
**Level Line Width & Style**
- Customize visual appearance
- **Thin solid**: Minimal distraction
- **Thick dashed**: High visibility
### 🎨 Age-Based Color Coding
Customize colors for each age category (high and low separately):
- **New (0-1 sessions)**: Default bright red/green
- **Medium (2-3 sessions)**: Default medium intensity
- **Old (4+ sessions)**: Default dark red/blue
- **Ancient (7+ sessions)**: Default deep purple/teal
**Color Strategy Tips:**
- Keep ancient levels in highly contrasting colors
- Use opacity (transparency) if you want subtler lines
- Match your chart's color scheme for aesthetic coherence
### 🎯 Band Settings
**Band Mode**
- **1st-2nd** (Default): The primary "tunnel" between most recent levels
- **1st-3rd**: Wider band, more room for price action
- **2nd-3rd**: Band between less immediate levels
- **Disabled**: No bands, lines only
**Band Colors & Borders**
- Customize fill color and border separately
- **Tip**: Keep bands very transparent (90-95% transparency) to avoid obscuring price action
### ⚠️ Proximity Alert Settings
**Enable Proximity Alerts**
- Toggle: Turn on/off the warning system
- When enabled, levels within threshold distance show ⚠️ and turn yellow
**Alert Threshold** (Default: 5.0 points)
- Distance in points to trigger the alert
- **For NQ**: 5-10 points is reasonable
- **For ES**: 2-5 points is reasonable
- **For MES/MNQ**: Scale down proportionally
**Alert Highlight Color**
- The color lines/labels turn when proximity is triggered
- Default: Yellow (high visibility)
### 📋 Table Settings
**Show Table**
- Toggle: Display the dashboard table
**Table Location**
- Top Left, Top Right, Bottom Left, Bottom Right
- Choose based on your chart layout and other indicators
**Text Size**
- Tiny, Small, Normal, Large
- **Recommendation**: Normal for 1080p monitors, Small for 4K
**Show % Distance**
- Toggle: Add percentage distance column to table
- Useful for comparing relative distances across different price ranges
**Show Statistics Row**
- Toggle: Show total count of unmitigated highs/lows
- Format: "📊 15↑ / 12↓" (15 unmitigated highs, 12 unmitigated lows)
- Useful for gauging overall market structure
### ⚡ Performance Settings
**Enable Level Cleanup**
- Automatically remove very old levels to maintain performance
- **Keep on** unless you want unlimited history
**Max Lookback Levels** (Default: 10,000)
- Maximum number of levels to track
- 10,000 ≈ 6+ months of 15-minute bars
- **Increase** if you want more history
- **Decrease** if experiencing performance issues
**Max Boxes Per Band** (Default: 245)
- TradingView limit is 500 total boxes
- With 2 bands, 245 each = 490 total (safe maximum)
---
## Best Practices
### 🎯 Position Management
**1. Scaling In Near Old Levels**
```
Price approaching 5-session-old low:
- First position: 30% size at proximity alert (⚠️)
- Second position: 40% size at exact level
- Third position: 30% size if it shows strong rejection
```
**2. Scaling Out Near Ancient Levels**
```
Holding long position, approaching 8-session-old high:
- Exit 50% at proximity alert (⚠️)
- Exit 30% at exact level
- Trail stop on remaining 20%
```
### 🧠 Trading Psychology Integration
Drawing from principles in *The Mountain Is You*, this indicator helps you:
**1. Recognize Self-Sabotage Patterns**
- **The Premature Entry**: Entering before price reaches your planned level
- **Solution**: Set alerts at unmitigated levels, wait for proximity warnings
- **The Profit-Taking Problem**: Exiting too early from fear
- **Solution**: Identify the next unmitigated level and commit to holding until proximity alert
- **The Loss Holding**: Refusing to exit losing trades
- **Solution**: When price breaks through and mitigates your entry level, it's telling you the structure changed
**2. Building Better Habits**
The color-coded age system trains your brain to:
- Respect levels that have proven themselves over time
- Distinguish between noise (new levels) and structure (old levels)
- Make decisions based on objective data, not fear or greed
**3. Emotional Regulation**
The proximity alerts serve as:
- **Circuit breakers** - Forcing you to re-evaluate before dangerous zones
- **Permission to act** - Giving you objective signals to exit without second-guessing
- **Validation** - Confirming when you're in alignment with market structure
### 📝 Pre-Market Routine
**Daily Setup Checklist:**
1. ✅ Identify the 3 nearest unmitigated highs above current price
2. ✅ Identify the 3 nearest unmitigated lows below current price
3. ✅ Note which are ancient (7+) - these are your "no-go" zones
4. ✅ Check the tunnel width (Δ in status row) - tight or wide?
5. ✅ Set alerts at the 1st high and 1st low for proximity warnings
6. ✅ Plan: "If we go up, I exit at ___. If we go down, I enter at ___."
### 🔄 Timeframe Confluence
**Multi-Timeframe Strategy:**
Run the indicator on **three instances**:
- **15-minute** (short-term structure)
- **1-hour** (intermediate structure)
- **4-hour** (major structure)
**Strong Setup**: When all three timeframes show unmitigated levels converging at the same price zone.
**Example:**
- 15m: Old low at 21,400
- 1H: Ancient low at 21,398
- 4H: Ancient low at 21,395
- **Result**: 21,395-21,400 is a monster support zone
### ⚠️ What This Indicator Doesn't Do
**Not a Crystal Ball**
- It doesn't predict where price will go
- It shows you where price *hasn't been* and how long it's been avoided
- The trading decisions are still yours
**Not an Entry Signal Generator**
- It provides context and structure
- You need to combine it with your entry methodology (price action, indicators, order flow, etc.)
**Not Foolproof**
- Ancient levels get broken
- Proximity alerts can trigger early in strong trends
- The market doesn't "owe" you a reversal at any level
---
## Common Scenarios
### Scenario 1: "Level Cluster Ahead"
**Situation**: You're long at 21,400. The table shows:
- 1st High: 21,425 (2 sessions old)
- 2nd High: 21,428 (3 sessions old)
- 3rd High: 21,435 (6 sessions old)
**Interpretation**: There's a resistance cluster just 25-35 points away. The 6-session-old level is particularly significant.
**Action**:
- Set first profit target at 21,420 (before the cluster)
- Set second target at 21,426 (between 1st and 2nd)
- Trail remaining position, but be ready to exit on rejection at 21,435
**Cave Diving Analogy**: You're approaching an overhead section with limited clearance. Lighten your load (reduce position) before entering.
---
### Scenario 2: "Ancient Level Approaches"
**Situation**: The market is grinding higher. You see ⚠️ appear next to a 9-session-old high at 21,500.
**Interpretation**: This level has survived over a week without being touched. Massive potential liquidity zone.
**Action**:
- If long, this is your absolute exit zone. Take profits before or at level.
- If looking to short, wait for clear rejection (price taps and reverses)
- Don't try to buy the breakout until it clearly breaks and retests
**Cave Diving Analogy**: Your dive computer is beeping - you've reached your planned turn-back depth. No matter how interesting it looks ahead, honor your plan.
---
### Scenario 3: "Mitigated Levels Create New Structure"
**Situation**: Price breaks and mitigates the 1st High. The previous 2nd High becomes the new 1st High.
**Interpretation**: The structure just shifted. What was the 2nd level is now most relevant.
**Action**:
- Watch how price reacts to the newly-mitigated level
- If it holds below (acts as resistance), bearish
- If it reclaims and holds above (acts as support), bullish
- The NEW 1st High is your next target/resistance
**Cave Diving Analogy**: You've passed through a restriction - the cave layout ahead is different now. Update your mental map.
---
### Scenario 4: "Tight Tunnel, Upcoming Breakout"
**Situation**: The Δ in the status row shows 3.25 points (very tight). Bands are converging.
**Interpretation**: Price is consolidating between very close unmitigated levels. Breakout likely.
**Action**:
- Don't try to predict direction
- Set alerts above 1st High and below 1st Low
- When break occurs, trade the retest
- Expect volatility - use wider stops
**Cave Diving Analogy**: You're in a narrow passage. Movement will be sudden and directional once it starts.
---
### Scenario 5: "Imbalanced Structure"
**Situation**: The statistics row shows "📊 22↑ / 7↓"
**Interpretation**: There are many more unmitigated highs than lows. This suggests:
- Price has been declining (hitting lows, leaving highs behind)
- Potential bullish reversal zone (lots of overhead supply mitigated)
- Or continued bearish structure (resistance everywhere above)
**Action**:
- Look at the age of those 22 highs
- If mostly new (0-2 sessions): Just a recent downmove, not significant yet
- If many old/ancient: Strong overhead resistance, be cautious on longs
- Compare to price action: Is price respecting the remaining lows?
**Cave Diving Analogy**: You've swam deeper than your starting point - most of your markers are above you now. Are you planning the ascent or going deeper?
---
## Final Thoughts: The Philosophy
This indicator is built on a simple but powerful principle: **The market has memory, and that memory has weight.**
Every unmitigated level represents:
- Liquidity left behind
- Orders waiting to be filled
- Institutional interest potentially parked
- Psychological significance for participants
The longer a level remains unmitigated, the more "charged" it becomes. When price finally revisits it, something significant usually happens - either a strong reversal or a definitive break.
Your job as a trader isn't to predict which outcome will occur. Your job is to:
1. **Recognize** when you're approaching these charged zones
2. **Respect** them by adjusting position size and risk
3. **React** appropriately based on how price behaves at them
4. **Remember** that ancient levels (like ancient wisdom) deserve extra reverence
The Cave Diving Framework embedded in this indicator serves as a constant reminder: Trading, like cave diving, requires rigorous respect for environmental hazards, meticulous planning, and the discipline to turn back when your limits are reached.
**Every proximity alert is the market asking you**: *"Do you really want to go deeper?"*
Sometimes the answer is yes - when your setup, confluence, and risk management all align.
Often, the answer should be no - and that's the trader avoiding the accident that would have happened to the gambler.
---
### 🎯 Quick Reference Card
**Color System:**
- 🟢 Bright colors = New (0-1 sessions) = Shallow water
- 🟡 Medium colors = Medium (2-3 sessions) = Penetration depth
- 🔴 Dark colors = Old (4-6 sessions) = Deep dive zone
- 🟣 Deep dark colors = Ancient (7+ sessions) = Overhead environment
**Symbols:**
- ↑ ↑↑ ↑↑↑ ↑↑↑↑ ↑↑↑↑↑ = High levels (1st through 5th)
- ↓ ↓↓ ↓↓↓ ↓↓↓↓ ↓↓↓↓↓ = Low levels (1st through 5th)
- ⚠️ = Proximity alert (danger zone)
- 🟢 = Bullish structure
- 🔴 = Bearish structure
- Δ = Tunnel width (distance between 1st high and 1st low)
**Critical Rules:**
1. Never fight ancient levels (7+ sessions)
2. Respect proximity alerts (⚠️)
3. Scale out near old/ancient resistance
4. Wait for confluence when entering
5. Let mitigated levels prove their new role
---
**Remember**: The indicator gives you structure. The trading edge comes from your discipline in respecting that structure.
Trade safe, trade smart, and always know your exit before your entry. 🎯
---
*"You don't become your best self by denying your patterns. You become your best self by recognizing them, understanding them, and choosing differently." - Adapted from The Mountain Is You*
In trading: You don't become profitable by ignoring market structure. You become profitable by recognizing it, understanding it, and choosing your entries accordingly.

Effort-Result Divergence [Interakktive]The Effort-Result Divergence (ERD) measures whether volume effort is producing proportional price result. It quantifies the classic Wyckoff principle: when price moves easily, momentum is real; when price struggles despite heavy volume, absorption is occurring.
Think of ERD as "energy efficiency" for price movement — green means price is gliding, red means price is grinding.
█ WHAT IT DOES
• Measures volume EFFORT relative to average volume
• Measures price RESULT relative to ATR-normalized movement
• Computes ERD = Result minus Effort (each scaled 0-100)
• Flags statistical divergences via Z-score analysis
• Absorption events: high effort, low result (negative ERD)
• Vacuum events: low effort, high result (positive ERD)
█ WHAT IT DOES NOT DO
• NO buy/sell signals
• NO entry/exit recommendations
• NO alerts (v1 is educational only)
• NO performance claims or guarantees
This is a context tool for understanding market participation quality.
█ HOW IT WORKS
The ERD analyzes two dimensions of market activity and compares them.
EFFORT (Volume Intensity)
Compares current volume to a moving average baseline:
Effort Ratio = Volume ÷ SMA(Volume, Length)
Effort Score = clamp(100 × Effort Ratio ÷ Effort Cap)
High effort means above-average volume participation.
Low effort means below-average volume participation.
RESULT (Price Efficiency)
Measures how much price moved relative to expected volatility:
Result Ratio = |Close − Previous Close| ÷ ATR
Result Score = clamp(100 × Result Ratio ÷ Result Cap)
High result means price moved significantly for the volatility regime.
Low result means price barely moved despite market activity.
ERD SCORE
ERD = Result − Effort
• Positive ERD: Result exceeds effort → price moved easily (vacuum/thin liquidity)
• Negative ERD: Effort exceeds result → price struggled (absorption/accumulation)
• Near zero: Balanced effort-to-result relationship
STATISTICAL DIVERGENCE DETECTION
Z-score analysis identifies statistically significant extremes:
Z = (ERD − Mean) ÷ StdDev
• Absorption Event: Z ≤ −threshold (extreme negative ERD)
• Vacuum Event: Z ≥ +threshold (extreme positive ERD)
█ INTERPRETATION
GREEN BARS (Positive ERD)
Price moved with relatively little volume effort. This suggests:
• Thin liquidity / low resistance
• Strong directional interest
• Momentum is "real" — not forced
RED BARS (Negative ERD)
Heavy volume was used but price barely moved. This suggests:
• Absorption / accumulation occurring
• Large players opposing the move
• Inefficiency — someone is working hard for little result
THE KEY INSIGHT
When you see:
• Down moves = high effort (red spikes)
• Up moves = low effort (green bars)
This means: It's easier for price to go up than down.
That is asymmetric strength — classic bullish pressure.
The reverse (red on up moves, green on down moves) signals bearish pressure.
PRACTICAL RULES
Without any other indicators:
• Avoid shorting when ERD is mostly green and red spikes appear only on down candles
• Be cautious buying when ERD turns red on up candles (signals absorption of buying pressure)
• Vacuum events (extreme green) often precede continuation or pause — not violent reversal
• Absorption events (extreme red) often precede reversals or range formation
█ VOLUME DATA NOTE
This indicator uses the volume variable which represents:
• Exchange volume on stocks and futures
• Tick volume on Forex and CFD instruments
Tick volume is a proxy for activity, not actual exchange volume. The indicator remains useful on Forex as relative volume comparisons are still meaningful, but interpretation should account for this limitation.
█ INPUTS
Core Settings
• Volume Average Length: Baseline period for effort calculation (default: 20)
• ATR Length: Volatility normalization period (default: 14)
• Effort Cap: Volume ratio that maps to 100% effort (default: 3.0)
• Result Cap: ATR multiple that maps to 100% result (default: 1.0)
Divergence Detection
• Z-Score Lookback: Statistical analysis window (default: 100)
• Z-Score Threshold: Standard deviations for event flags (default: 2.0)
Visual Settings
• Show ERD Histogram: Toggle main display
• Show Zero Line: Toggle reference line
• Show Divergence Markers: Toggle event circles
• Show Effort/Result Lines: Display component breakdown
█ ORIGINALITY
While Wyckoff's effort-versus-result principle is well-established, existing implementations are typically:
• Purely visual with no quantification
• Pattern-based requiring subjective interpretation
• Not statistically normalized for comparison across instruments
ERD is original because it:
1. Normalizes both effort and result to 0-100 scales for direct comparison
2. Uses ATR for result normalization (adapts to volatility regime)
3. Applies statistical Z-score for objective divergence detection
4. Provides quantified output suitable for systematic analysis
█ DATA WINDOW EXPORTS
When enabled, the following values are exported:
• Effort (0-100)
• Result (0-100)
• ERD Score
• Z-Score
• Absorption Event (1/0)
• Vacuum Event (1/0)
█ SUITABLE MARKETS
Works on: Stocks, Futures, Forex, Crypto
Best on: Instruments with reliable volume data (stocks, futures, crypto)
Timeframes: All timeframes — interpretation adapts accordingly
█ RELATED
• Market Efficiency Ratio — measures price path efficiency
• Wyckoff Volume Spread Analysis — conceptual foundation
█ DISCLAIMER
This indicator is for educational purposes only. It does not constitute financial advice. Past performance does not guarantee future results. Always conduct your own analysis before making trading decisions.

FVG MTF Consensus OscillatorFVG MTF Consensus Oscillator
A multi-timeframe, multi-component oscillator that combines momentum, deviation, and slope analysis across multiple timeframes using Zeiierman's Chebyshev-filtered trend calculation. This indicator identifies potential turning points with zone-based signal classification and timeframe consensus filtering.
Backed by ML/Deep Learning evaluation on ES Futures data from 2015-2024.
🎯 Concept
Traditional oscillators suffer from two major weaknesses:
Single measurement - relying on one metric makes them susceptible to noise
Single timeframe - missing the bigger picture leads to fighting the trend
The FVG MTF Consensus Oscillator addresses both issues by combining three independent measurements across three timeframes into a weighted consensus signal.
The Three Components
Momentum - How fast is the trend moving?
Deviation - How far has price stretched from the trend?
Slope - What is the short-term directional bias?
The Three Timeframes
TF1 (Chart) - Your current chart timeframe (lowest weight)
TF2 (Medium) - Typically 1H or 4H (medium weight)
TF3 (High) - Typically 4H or Daily (highest weight)
By requiring agreement across multiple components AND multiple timeframes, the oscillator filters out noise while capturing meaningful, high-probability market movements.
🔧 How It Works
The Core: Chebyshev Type 1 Filter
At its heart, this indicator uses a Chebyshev Type 1 low-pass filter (inspired by Zeiierman's FVG Trend) to extract a clean trend line from price action. Unlike simple moving averages, the Chebyshev filter offers:
Sharper cutoff between trend and noise
Minimal lag for a given smoothness level
Controlled overshoot via the ripple parameter
Three Oscillator Components
1. Momentum Component
Momentum = Current Trend Value - Previous Trend Value
Measures the velocity of the trend. High positive values indicate strong upward acceleration, while high negative values show downward acceleration.
2. Deviation Component
Deviation = Close Price - Trend Value
Measures how far price has stretched away from the trend line. Useful for identifying overextended conditions and mean reversion opportunities.
3. Slope Component
Slope = Change in Trend over 3 bars
Captures the short-term directional bias of the trend itself, helping confirm trend changes.
Normalization & Component Consensus
Each component is individually normalized to a -100 to +100 scale using adaptive scaling. The oscillator output is a weighted average of all three components, allowing you to emphasize different aspects based on your trading style.
Multi-Timeframe Weighting
The final oscillator value combines all three timeframes using configurable weights:
Combined = (TF1 × Weight1 + TF2 × Weight2 + TF3 × Weight3) / Total Weight
Default weights (1, 2, 3) ensure higher timeframes have more influence, keeping you aligned with the dominant trend while timing entries on lower timeframes.
📊 Zone System
The oscillator uses a fuzzy zone system to classify market conditions:
ZoneRangeInterpretationSignal ColorNeutral-5 to +5No clear bias, avoid tradingGrayContinuation±5 to ±25Trend pullback, continuation setupsAquaDeep Swing±25 to ±50Extended move, stronger setupsGreenReversalBeyond ±50Extreme extension, reversal potentialOrange
When "Show Zone Background" is enabled, the background shading darkens as the oscillator moves into more extreme zones, providing instant visual feedback.
📈 Signal Interpretation
Turn Signals
The indicator plots triangular markers when the oscillator changes direction:
▲ Triangle Up (bottom): Oscillator turning up from a low
▼ Triangle Down (top): Oscillator turning down from a high
Signal Quality by Zone
Not all signals are equal. The signal color indicates which zone the turn occurred in:
ColorZoneProbabilityBest UseGrayNeutralLowAvoid or use very tight stopsAquaContinuationModerateTrend continuation entriesGreenDeep SwingHigherSwing trade entriesOrangeReversalHighestCounter-trend with caution
Timeframe Consensus Filter
Signals only fire when the required number of timeframes agree on direction. With default settings (TF Consensus = 2), at least 2 of 3 timeframes must be moving in the same direction for a signal to trigger.
This prevents:
Taking longs when higher timeframes are bearish
Taking shorts when higher timeframes are bullish
Whipsaws during timeframe disagreement
Trend Coloring
The combined oscillator line changes color based on trend direction:
Light purple (RGB 240, 174, 252): Majority of timeframes trending up
Dark purple (RGB 84, 19, 95): Majority of timeframes trending down
Info Table
When MTF is enabled, a table in the top-right corner displays:
Current oscillator values for each timeframe (TF1, TF2, TF3)
Combined value (CMB)
Color coding: Green = rising, Red = falling
⚙️ Settings Guide
Timeframe Settings
SettingDefaultDescriptionEnable Multi-TimeframeOnMaster switch for MTF functionalityTF1 (Chart)"" (current)First timeframe, typically your chart TFTF2 (Medium)60Second timeframe, typically 1HTF3 (High)240Third timeframe, typically 4HTF1/TF2/TF3 Weight1 / 2 / 3Influence of each TF on combined signal
Timeframe Tips:
Keep TF1 ≤ TF2 ≤ TF3 (ascending order)
For day trading: 5m / 15m / 1H
For swing trading: 1H / 4H / Daily
For position trading: 4H / Daily / Weekly
Display Settings
SettingDefaultDescriptionShow All TimeframesOffDisplay individual TF oscillator linesShow Combined LineOnDisplay the weighted combined oscillatorShow Zone BackgroundOffShade background based on current zone
Trend Filter Settings
SettingDefaultDescriptionTrend Ripple4.0Filter responsiveness (1-10). Higher = faster but more overshootTrend Cutoff0.1Cutoff frequency (0.01-0.5). Lower = smoother trendNormalization Length50Lookback for scaling. Longer = more stable
Component Weights
SettingDefaultDescriptionMomentum Weight1.0Emphasis on trend speedDeviation Weight1.0Emphasis on price stretch from trendSlope Weight1.0Emphasis on short-term trend direction
Component Tips:
For trend-following: Increase Momentum and Slope weights
For mean reversion: Increase Deviation weight
Set any weight to 0 to disable that component
Zone Thresholds
SettingDefaultDescriptionNeutral Zone5Inner boundary (±5 = neutral)Continuation Zone25Middle boundary for continuation setupsDeep Swing Zone50Outer boundary for reversal zone
Adjust based on instrument volatility. More volatile instruments may need wider zones.
Signal Filters
SettingDefaultDescriptionSignal Cooldown3Minimum bars between signalsMin Turn Size2.0Minimum oscillator change for valid turnTF Consensus Required2Minimum TFs agreeing for signal (1-3)
💡 Usage Examples
Example 1: Trend Continuation (Dip Buying)
Setup: Uptrend confirmed by higher timeframes
Check the info table - TF2 and TF3 should show green (rising)
Wait for TF1 to pull back, oscillator enters Continuation zone
Enter on Aqua ▲ signal (turn up with TF consensus)
Stop below recent swing low
Target: Previous high or next resistance
Why it works: You're buying a dip in an established uptrend with multi-timeframe confirmation.
Example 2: Deep Swing Entry
Setup: Extended move showing exhaustion
Oscillator reaches Deep Swing zone (±25 to ±50)
At least 2 TFs start showing the same direction
Enter on Green signal indicating momentum exhaustion
Use tighter stop as the move is already extended
Target: Return to Continuation zone or trend line
Why it works: Extended moves tend to mean-revert. The zone system identifies these opportunities.
Example 3: Reversal Setup (Advanced)
Setup: Extreme extension with diverging timeframes
Oscillator reaches Reversal zone (beyond ±50)
Watch for TF1 to turn while TF3 is still extended
Enter on Orange signal - this is counter-trend!
Use smaller position size and wider stops
Target: Return to Deep Swing or Continuation zone
Why it works: Extreme extensions eventually correct. The orange signal marks high-probability reversal points.
Example 4: Avoiding Bad Trades
What to avoid:
Gray signals in Neutral zone - No edge, random noise
Signals against TF3 direction - Fighting the dominant trend
Signals without TF consensus - Timeframe disagreement = choppy market
Multiple signals in quick succession - Let cooldown filter work
🔬 Multi-Timeframe Analysis Tips
Reading the Info Table
The info table shows real-time oscillator values:
| TF1 | TF2 | TF3 | CMB |
| 23.5 | 45.2 | 67.8 | 52.1 |
All green: Strong uptrend across all timeframes
All red: Strong downtrend across all timeframes
Mixed colors: Potential transition or consolidation
Timeframe Alignment States
TF1TF2TF3Interpretation↑↑↑Strong bull - look for long entries↓↓↓Strong bear - look for short entries↑↑↓Pullback in downtrend - caution on longs↓↓↑Pullback in uptrend - caution on shorts↑↓↑Choppy - reduce position size↓↑↓Choppy - reduce position size
The Power of Consensus
With TF Consensus = 2, signals only fire when 2+ timeframes agree. This single filter eliminates most whipsaws and keeps you aligned with the dominant trend.
For more conservative trading, set TF Consensus = 3 (all timeframes must agree).
⚠️ Important Notes
This indicator does not predict the future. It measures current market conditions and momentum across multiple timeframes.
Always use proper risk management. No indicator is 100% accurate.
Combine with price action. The oscillator works best when confirmed by support/resistance, candlestick patterns, or other confluence factors.
Respect the higher timeframe. When TF3 disagrees, trade smaller or sit out.
Zone signals are probabilistic. Orange (reversal) signals have higher probability but aren't guaranteed reversals.
Adjust settings per instrument. Default settings are optimized for ES Futures but may need tuning for other markets.
🧪 ML/Deep Learning Background
The default parameters and zone thresholds were evaluated using machine learning techniques on ES Futures data spanning 2015-2024. This included:
Optimization of component weights
Zone threshold calibration
Timeframe weight balancing
Signal filter tuning
While past performance doesn't guarantee future results, the parameters represent a data-driven starting point rather than arbitrary defaults.
🙏 Credits
This indicator is inspired by Zeiierman's Multitimeframe Fair Value Gap (FVG) indicator, specifically utilizing concepts from his Chebyshev Type 1 filter implementation for trend calculation.
Original indicator: Multitimeframe Fair Value Gap – FVG (Zeiierman)
📝 Changelog
v1.0
Initial release
Three-component consensus oscillator (Momentum, Deviation, Slope)
Multi-timeframe support with weighted combination
Fuzzy zone classification system
Configurable component and timeframe weights
TF consensus filter for signal quality
Signal cooldown and minimum turn size filters
Real-time info table with TF values
Optional zone background shading

Buy-Dip / Sell-Pullback Buy the Dip / Sell the Pullback – Trend-Following Strategy (EOD → Next Day Execution)
Overview
This is a trend-following futures strategy designed to participate in pullbacks within established trends, not to predict reversals.
It works on End-of-Day (EOD) confirmation and executes trades on the next trading session, making it suitable for positional and swing traders.
The strategy combines momentum, trend direction, volatility, and price location to filter for high-quality setups while avoiding overtrading.
🔍 Core Philosophy
Trade only in the direction of the prevailing trend
Buy dips in uptrends
Sell pullbacks in downtrends
Avoid chasing price after extended gaps
Use volatility-adjusted risk management (ATR-based SL & targets)
📊 Indicators Used
RSI (20)
Measures underlying momentum strength
Stochastic Oscillator (55, 34, 21)
Confirms pullback exhaustion within a trend
Supertrend (10, 2)
Defines primary trend direction
Bollinger Bands (20, 2)
Provides structural trend bias
ATR (5)
Used for:
Entry gap filter
Stop-loss
Profit target
Supertrend buffer
✅ Long (Buy) Setup – Evaluated at EOD
A long setup is generated when all of the following conditions are satisfied at the close of the trading day:
RSI(20) is above the bullish threshold (default: 48)
Stochastic %K is above %D (confirming pullback momentum)
Supertrend direction is bullish
Price is near or above Supertrend, allowing a volatility-adjusted buffer (ATR-based)
Price is above the Bollinger Band middle line
This combination ensures:
The market is trending up
Momentum supports continuation
The pullback is controlled, not a breakdown
❌ Short (Sell) Setup – Evaluated at EOD
A short setup is generated when:
RSI(20) is below the bearish threshold (default: 52)
Stochastic %K is below %D
Supertrend direction is bearish
Price is near or below Supertrend, with an ATR buffer
Price is below the Bollinger Band middle line
This filters for pullbacks within sustained downtrends.
⏰ Trade Execution Logic (Next Day Rule)
Once a setup is confirmed at EOD, a trade is attempted on the next trading session
To avoid chasing gaps:
Long trades are allowed only if price does not move more than a defined multiple of the previous day’s True Range
Short trades follow the same logic in reverse
This is implemented via limit orders, ensuring realistic backtesting and execution behavior
🛑 Risk Management
All exits are volatility-adjusted using ATR:
Stop-Loss:
1.1 × ATR(5) from entry price
Target:
2.2 × ATR(5) from entry price
This results in a risk–reward ratio of approximately 1:2
ATR is frozen at entry to avoid forward-looking bias.
🧠 Why This Strategy Works
Avoids low-quality trades during consolidation
Participates only when trend + momentum align
Prevents emotional gap-chasing
Adapts automatically to changing volatility
Suitable for index futures and liquid stocks
📌 Recommended Usage
Timeframe: Daily
Instruments:
Index Futures (e.g. NIFTY, BANKNIFTY)
Highly liquid stocks
Market Type: Trending markets
Not ideal for: Sideways or low-volatility environments
⚙️ Customization Tips
You can control trade frequency and aggressiveness by adjusting:
RSI thresholds
Supertrend buffer (ATR multiple)
Gap filter multiplier
Stochastic edge parameter
Looser settings → more trades
Stricter settings → higher selectivity
⚠️ Disclaimer
This strategy is for educational and research purposes only.
Backtest results do not guarantee future performance.
Always validate with paper trading before deploying real capital.

AMT Structure: 80% Traverse, PD Levels & nPOCsHere is a clean, professional description formatted for the TradingView description box. It highlights the methodology (AMT/80% Rule), the specific features, and the credits.
Title: AMT Structure: 80% Traverse, PD Levels & nPOCs
Description:
This indicator is a comprehensive toolkit designed for futures traders utilizing Auction Market Theory (AMT) and Volume Profile strategies. It consolidates multiple scripts into a single, unified overlay to declutter your chart while providing essential structural references for the 80% Traverse setup, intraday context, and longer-term auction targets.
Key Features:
1. 80% Rule / Traverse Setup (Chart Champions Logic)
Automated RTH Open Detection: Hardcoded to the 08:30 AM CT Open to ensure accuracy for US Futures (ES/NQ) regardless of your chart's timezone settings.
Value Area Logic: Automatically calculates the Previous Day's Value Area High (VAH), Value Area Low (VAL), and Point of Control (POC).
Setup Detection: If the market opens outside of the previous day's value, the script highlights the Value Area in color (default: Purple), signaling that an 80% traverse (filling the value area) is structurally possible if price re-enters value.
Background Fill: Optional shading between VAH and VAL to clearly visualize the "playing field" for the traverse.
2. Auction Market Theory (AMT) Premarket Levels
Overnight High/Low: Automatically captures the highest and lowest prices traded during the overnight session (17:00 - 08:30 CT).
Breakout Alerts: Includes logic to detect and alert when these overnight levels are broken during the RTH session.
Auto-Cleanup: Lines can be set to auto-delete after a specified time (default: 60 mins into the session) to keep the chart clean after the Initial Balance (IB) period.
3. Structural Reference Levels
Previous Day Levels: Plots Previous Day High, Low, and Equilibrium (Midpoint) as standard reference lines.
Initial Balance (IB): Option to display the First Hour High and Low (08:30 - 09:30 CT) to assess day type (Neutral, Trend, Normal Variation, etc.).
RTH VWAP: An anchored VWAP that resets specifically at the RTH Open (08:30 CT), distinct from the standard 24-hour VWAP.
4. Naked Points of Control (nPOCs)
Multi-Timeframe Tracking: Tracks and plots Naked POCs for Daily, Weekly, and Monthly profiles.
Auto-Cleanup: Lines automatically delete themselves the moment price touches them, ensuring you only see untested levels.
Customization: Toggle each timeframe on/off individually.
Settings & Customization:
Global Offset: Move all text labels to the right with a single setting to prevent price action from obscuring text.
8:30 Open Offset: Independent offset for the Open label to distinguish it from other opening references.
Smart Coloring: Text labels automatically match their corresponding line colors for easy identification.
Modular Toggles: Every section (AMT, VWAP, PD Levels, CCV, nPOCs) can be turned on or off individually to suit your specific trading plan.
Usage: This tool is specifically tuned for ES and NQ futures trading but can be adapted for other instruments. It replaces the need for separate indicators for Overnight Highs/Lows, Previous Day Levels, and Volume Profile targeting.

Open Interest Z-Score [BackQuant]Open Interest Z-Score
A standardized pressure gauge for futures positioning that turns multi venue open interest into a Z score, so you can see how extreme current positioning is relative to its own history and where leverage is stretched, decompressing, or quietly re loading.
What this is
This indicator builds a single synthetic open interest series by aggregating futures OI across major derivatives venues, then standardises that aggregated OI into a rolling Z score. Instead of looking at raw OI or a simple change, you get a normalized signal that says "how many standard deviations away from normal is positioning right now", with optional smoothing, reference bands, and divergence detection against price.
You can render the Z score in several plotting modes:
Line for a clean, classic oscillator.
Colored line that encodes both sign and momentum of OI Z.
Oscillator histogram that makes impulses and compressions obvious.
The script also includes:
Aggregated open interest across Binance, Bybit, OKX, Bitget, Kraken, HTX, and Deribit, using multiple contract suffixes where applicable.
Choice of OI units, either coin based or converted to USD notional.
Standard deviation reference lines and adaptive extreme bands.
A flexible smoothing layer with multiple moving average types.
Automatic detection of regular and hidden divergences between price and OI Z.
Alerts for zero line and ±2 sigma crosses.
Aggregated open interest source
At the core is the same multi venue OI aggregation engine as in the OI RSI tool, adapted from NoveltyTrade's work and extended for this use case. The indicator:
Anchors on the current chart symbol and its base currency.
Loops over a set of exchanges, gated by user toggles:
Binance.
Bybit.
OKX.
Bitget.
Kraken.
HTX.
Deribit.
For each exchange, loops over several contract suffixes such as USDT.P, USD.P, USDC.P, USD.PM to cover the common perp and margin styles.
Requests OI candles for each exchange plus suffix pair into a small custom OI type that carries open, high, low and close of open interest.
Converts each OI stream into a common unit via the sw method:
In COIN mode, OI is normalized relative to the coin.
In USD mode, OI is scaled by price to approximate notional.
Exchange specific scaling factors are applied where needed to match contract multipliers.
Accumulates all valid OI candles into a single combined OI "candle" by summing open, high, low and close across venues.
The result is oiClose , a synthetic close for aggregated OI that represents cross venue positioning. If there is no valid OI data for the symbol after this process, the script throws a clear runtime error so you know the market is unsupported rather than quietly plotting nonsense.
How the Z score is computed
Once the aggregated OI close is available, the indicator computes a rolling Z score over a configurable lookback:
Define subject as the aggregated OI close.
Compute a rolling mean of this subject with EMA over Z Score Lookback Period .
Compute a rolling standard deviation over the same length.
Subtract the mean from the current OI and divide by the standard deviation.
This gives a raw Z score:
oi_z_raw = (subject − mean) ÷ stdDev .
Instead of plotting this raw value directly, the script passes it through a smoothing layer:
You pick a Smoothing Type and Smoothing Period .
Choices include SMA, HMA, EMA, WMA, DEMA, RMA, linear regression, ALMA, TEMA, and T3.
The helper ma function applies the chosen smoother to the raw Z score.
The result is oi_z , a smoothed Z score of aggregated open interest. A separate EMA with EMA Period is then applied on oi_z to create a signal line ma that can be used for crossovers and trend reads.
Plotting modes
The Plotting Type input controls how this Z score is rendered:
1) Line
In line mode:
The smoothed OI Z score is plotted as a single line using Base Line Color .
The EMA overlay is optionally plotted if Show EMA is enabled.
This is the cleanest view when you want to treat OI Z like a standard oscillator, watching for zero line crosses, swings, and divergences.
2) Colored Line
Colored line mode adds conditional color logic to the Z score:
If the Z score is above zero and rising, it is bright green, representing positive and strengthening positioning pressure.
If the Z score is above zero and falling, it shifts to a cooler cyan, representing positive but weakening pressure.
If the Z score is below zero and falling, it is bright red, representing negative and strengthening pressure (growing net de risking or shorting).
If the Z score is below zero and rising, it is dark red, representing negative but recovering pressure.
This mapping makes it easy to see not only whether OI is above or below its historical mean, but also whether that deviation is intensifying or fading.
3) Oscillator
Oscillator mode turns the Z score into a histogram:
The smoothed Z score is plotted as vertical columns around zero.
Column colors use the same conditional palette as colored line mode, based on sign and change direction.
The histogram base is zero, so bars extend up into positive Z and down into negative Z.
Oscillator mode is useful when you care about impulses in positioning, for example sharp jumps into positive Z that coincide with fast builds in leverage, or deep spikes into negative Z that show aggressive flushes.
4) None
If you only want reference lines, extreme bands, divergences, or alerts without the base oscillator, you can set plotting to None and keep the rest of the tooling active.
The EMA overlay respects plotting mode and only appears when a visible Z score line or histogram is present.
Reference lines and standard deviation levels
The Select Reference Lines input offers two styles:
Standard Deviation Levels
Plots small markers at zero.
Draws thin horizontal lines at +1, +2, −1 and −2 Z.
Acts like a classic Z score ladder, zero as mean, ±1 as normal band, ±2 as outer band.
This mode is ideal if you want a textbook statistical framing, using ±1 and ±2 sigma as standard levels for "normal" versus "extended" positioning.
Extreme Bands
Extreme bands build on the same ±1 and ±2 lines, then add:
Upper outer band between +3 and +4 Z.
Lower outer band between −3 and −4 Z.
Dynamic fill colors inside these bands:
If the Z score is positive, the upper band fill turns red with an alpha that scales with the magnitude of |Z|, capped at a chosen max strength. Stronger deviations towards +4 produce more opaque red fills.
If the Z score is negative, the lower band fill turns green with the same adaptive alpha logic, highlighting deep negative deviations.
Opposite side bands remain a faint neutral white when not in use, so they still provide structural context without shouting.
This creates a visual "danger zone" for position crowding. When the Z score enters these outer bands, open interest is many standard deviations away from its mean and you are dealing with rare but highly loaded positioning states.
Z score as a positioning pressure gauge
Because this is a Z score of aggregated open interest, it measures how unusual current positioning is relative to its own recent history, not just whether OI is rising or falling:
Z near zero means total OI is roughly in line with normal conditions for your lookback window.
Positive Z means OI is above its recent mean. The further above zero, the more "crowded" or extended positioning is.
Negative Z means OI is below its recent mean. Deep negatives often mark post flush environments where leverage has been cleared and the market is under positioned.
The smoothing options help control how much noise you want in the signal:
Short Z score lookback and short smoothing will react quickly, suited for short term traders watching intraday positioning shocks.
Longer Z score lookback with smoother MA types (EMA, RMA, T3) give a slower, more structural view of where the crowd sits over days to weeks.
Divergences between price and OI Z
The indicator includes automatic divergence detection on the Z score versus price, using pivot highs and lows:
You configure Pivot Lookback Left and Pivot Lookback Right to control swing sensitivity.
Pivots are detected on the OI Z series.
For each eligible pivot, the script compares OI Z and price at the last two pivots.
It looks for four patterns:
Regular Bullish – price makes a lower low, OI Z makes a higher low. This can indicate selling exhaustion in positioning even as price washes out. These are marked with a line and a label "ℝ" below the oscillator, in the bullish color.
Hidden Bullish – price makes a higher low, OI Z makes a lower low. This suggests continuation potential where price holds up while positioning resets. Marked with "ℍ" in the bullish color.
Regular Bearish – price makes a higher high, OI Z makes a lower high. This is a classic warning sign of trend exhaustion, where price pushes higher while OI Z fails to confirm. Marked with "ℝ" in the bearish color.
Hidden Bearish – price makes a lower high, OI Z makes a higher high. This is often seen in pullbacks within downtrends, where price retraces but positioning stretches again in the direction of the prevailing move. Marked with "ℍ" in the bearish color.
Each divergence type can be toggled globally via Show Detected Divergences . Internally, the script restricts how far back it will connect pivots, so you do not get stray signals linking very old structures to current bars.
Trading applications
Crowding and squeeze risk
Z scores are a natural way to talk about crowding:
High positive Z in aggregated OI means the market is running high leverage compared to its own norm. If price is also extended, the risk of a squeeze or sharp unwind rises.
Deep negative Z means leverage has been cleaned out. While it can be painful to sit through, this environment often sets up cleaner new trends, since there is less one sided positioning to unwind.
The extreme bands at ±3 to ±4 highlight the rare states where crowding is most intense. You can treat these events as regime markers rather than day to day noise.
Trend confirmation and fade selection
Combine Z score with price and trend:
Bull trends with positive and rising Z are supported by fresh leverage, usually more persistent.
Bull trends with flat or falling Z while price keeps grinding up can be more fragile. Divergences and extreme bands can help identify which edges you do not want to fade and which you might.
In downtrends, deep negative Z that stays pinned can mean persistent de risking. Once the Z score starts to mean revert back toward zero, it can mark the early stages of stabilization.
Event and liquidation context
Around major events, you often see:
Rapid spikes in Z as traders rush to position.
Reversal and overshoot as liquidations and forced de risking clear the book.
A move from positive extremes through zero into negative extremes as the market transitions from crowded to under exposed.
The Z score makes that path obvious, especially in oscillator mode, where you see a block of high positive bars before the crash, then a slab of deep negative bars after the flush.
Settings overview
Z Score group
Plotting Type – None, Line, Colored Line, Oscillator.
Z Score Lookback Period – window used for mean and standard deviation on aggregated OI.
Smoothing Type – SMA, HMA, EMA, WMA, DEMA, RMA, linear regression, ALMA, TEMA or T3.
Smoothing Period – length for the selected moving average on the raw Z score.
Moving Average group
Show EMA – toggle EMA overlay on Z score.
EMA Period – EMA length for the signal line.
EMA Color – color of the EMA line.
Thresholds and Reference Lines group
Select Reference Lines – None, Standard Deviation Levels, Extreme Bands.
Standard deviation lines at 0, ±1, ±2 appear in both modes.
Extreme bands add filled zones at ±3 to ±4 with adaptive opacity tied to |Z|.
Extra Plotting and UI
Base Line Color – default color for the simple line mode.
Line Width – thickness of the oscillator line.
Positive Color – positive or bullish condition color.
Negative Color – negative or bearish condition color.
Divergences group
Show Detected Divergences – master toggle for divergence plotting.
Pivot Lookback Left and Pivot Lookback Right – how many bars left and right to define a pivot, controlling divergence sensitivity.
Open Interest Source group
OI Units – COIN or USD.
Exchange toggles for Binance, Bybit, OKX, Bitget, Kraken, HTX, Deribit.
Internally, all enabled exchanges and contract suffixes are aggregated into one synthetic OI series.
Alerts included
The indicator defines alert conditions for several key events:
OI Z Score Positive – Z crosses above zero, aggregated OI moves from below mean to above mean.
OI Z Score Negative – Z crosses below zero, aggregated OI moves from above mean to below mean.
OI Z Score Enters +2σ – Z enters the +2 band and above, marking extended positive positioning.
OI Z Score Enters −2σ – Z enters the −2 band and below, marking extended negative positioning.
Tie these into your strategy to be notified when leverage moves from normal to extended states.
Notes
This indicator does not rely on price based oscillators. It is a statistical lens on cross venue open interest, which makes it a complementary tool rather than a replacement for your existing price or volume signals. Use it to:
Quantify how unusual current futures positioning is compared to recent history.
Identify crowded leverage phases that can fuel squeezes.
Spot structural divergences between price and positioning.
Frame risk and opportunity around events and regime shifts.
It is not a complete trading system. Combine it with your own entries, exits and risk rules to get the most out of what the Z score is telling you about positioning pressure under the hood of the market.

Position Size Calculator + Live R/R Panel — SMC/ICT (@PueblaATH)Position Size + Live R/R Panel — SMC/ICT (@PueblaATH)
Position Size + Live R/R Panel — SMC/ICT (@PueblaATH) is a professional-grade risk management and execution module built for Smart Money Concepts (SMC) and ICT Traders who require accurate, repeatable, institution-style trade planning.
This tool delivers precise position sizing, R:R modeling, leverage and margin projections, fee-adjusted PnL outcomes, and real-time execution metrics—all directly on the chart. Optimized for crypto, forex, and futures, it provides scalpers, day traders, and swing traders with the clarity needed to execute high-quality trades with confidence and consistency.
What the Indicator Does
Institutional Position Sizing Engine
Calculates position size based on account balance, % risk, and SL distance.
Supports custom minimum lot size rounding across crypto, FX, indices, and derivatives.
Intelligent direction logic (Auto / Long / Short) based on SMC/ICT structure.
Advanced Risk/Reward & Profit Modeling
Real-time R:R ratio using actual rounded position size.
Live PnL readout that updates with price movements.
Gross & net profit projections with full fee deduction.
Execution Planning with Draggable Levels
Entry, SL, and TP levels fully draggable for fast scenario modeling.
Automatic projected lines backward/forward with clean label alignment.
TP and SL tags include % movement from Entry, ideal for SMC/ICT journaling.
Precise modeling of real exchange fee structures
Maker fee per side
Taker fee per side
Mixed fee modes (Maker entry, Taker exit, Average, etc.)
Leverage & Margin Forecasting
Margin requirements displayed for 3 customizable leverage settings.
Helps traders understand capital commitment before executing the trade.
Useful for futures, crypto perps, and CFD setups.
Clean HUD Panel for Rapid Decision-Making
A full professional trading panel displays:
Target & actual risk
Position size
Entry / SL / TP
TP/SL percentage distance
Gross profit
Net profit (after fees)
Fees @ TP and @ SL
Live PnL
Margin requirements
Optimized for SMC & ICT Workflows
Perfect for traders using:
Breakers, FVGs, OBs
Liquidity sweeps
Session models
Precision entries (OTE, Displacement, Rebalancing)
Leverage-based execution (crypto perps, futures)
How to Use It
Attach the indicator to your chart.
Set account balance, risk %, fee model, and leverage presets.
Drag Entry, SL, and TP to shape the setup.
View instant calculations of: Position size; R:R; Net PnL after fees; Margin required
Use it as your pre-trade checklist & execution model.
Originality & Credits
This script is an original creation by @PueblaATH, released under the MPL 2.0 license.
It does not copy, modify, or repackage any existing TradingView code.
All logic—including the fee engine, margin calculator, responsive HUD, dynamic risk model, and visual execution system—is authored specifically for this indicator.

ES-VIX Expected Daily MoveThis indicator calculates the expected daily price movement for ES futures based on current volatility levels as measured by the VIX (CBOE Volatility Index).
Formula:
Expected Daily Move = (ES Price × VIX Price) / √252 / 100
The calculation converts the annualized VIX volatility into an expected daily move by dividing by the square root of 252 (the approximate number of trading days per year).
Features:
Real-time calculation using current ES futures price and VIX level
Histogram visualization in a separate pane for easy trend analysis
Information table displaying:
Current ES futures price
Current VIX level
Expected daily move in points
Expected daily move as a percentage

Risk On/Risk Off by Gary# Risk On/Risk Off Indicator (RORO)
## Overview
The Risk On/Risk Off (RORO) Indicator is a comprehensive market sentiment gauge that measures the balance between risk-seeking and risk-averse behavior across multiple asset classes. This indicator helps traders identify shifts in market sentiment and potential trend changes.
## How It Works
The RORO indicator aggregates normalized price movements (Z-scores) from eight major asset classes:
**Risk-On Assets (Bullish Sentiment):**
- Bitcoin Futures (BTC1!) - Cryptocurrency risk appetite
- WTI Crude Oil Futures (CL1!) - Energy sector strength
- AUD/JPY Exchange Rate - Carry trade indicator
- Emerging Markets ETF (EEM) - Global growth proxy
**Risk-Off Assets (Defensive Sentiment):**
- Gold Futures (GC1!) - Safe haven demand
- 10-Year Treasury Bonds (ZN1!) - Flight to quality
- US Dollar Index (DXY) - Reserve currency strength
- VIX Index - Market fear gauge (inverted)
## Key Features
- **Z-Score Normalization**: Standardizes different asset classes for fair comparison
- **Customizable Weights**: Adjust the influence of each asset class
- **Dynamic Coloring**: Green indicates rising risk appetite, red shows declining risk appetite
## Interpretation
- **Rising RORO (Green)**: Increasing risk appetite - favorable for equities, commodities, and growth assets
- **Falling RORO (Red)**: Decreasing risk appetite - rotation into safe havens
- **Divergences**: When RORO and price move in opposite directions, potential reversal signal
## Use Cases
1. **Market Regime Identification**: Determine current risk environment
2. **Divergence Trading**: Spot when price action contradicts underlying sentiment
3. **Portfolio Management**: Time defensive vs. aggressive positioning
4. **Confirmation Tool**: Validate breakouts and trend changes
## Settings
- **Lookback Period**: Controls Z-score calculation sensitivity (default: 50)
- **Asset Weights**: Fine-tune the contribution of each asset class
- **Color Scheme**: Customize rising/falling colors
## Best Practices
- Use on daily or higher timeframes for most reliable signals
- Combine with price action and volume analysis
- Watch for sustained moves rather than single-bar changes
---
*This indicator is designed for educational purposes. Always conduct your own analysis and risk management.*

CME Bitcoin Weekend Gap (Global) @jerikooDescription:
The Problem: You are watching the wrong hours. Many traders assume CME Bitcoin futures follow standard stock market hours or open Monday morning. This is incorrect.
Stock Market: Opens Monday morning.
CME Bitcoin: Opens Sunday Evening (US Time).
If you are in Europe, this means the market actually opens at Midnight (00:00) Monday. If you are waiting for the "Monday Morning Open," you are late.
The Solution: True Gap Detection This indicator highlights the exact downtime of the CME Bitcoin Futures market to help you identify true liquidity gaps.
Why this script is different: Most gap scripts break when you change your chart's time zone (e.g., switching from UTC to New York). This script is Universal.
Hardcoded Exchange Time: It calculates logic based on "America/Chicago" (CME HQ) time, regardless of your local chart settings.
Manual Offset Fix: Some data feeds have a +/- 1 or 2-hour sync difference depending on the broker. This script includes a "Hour Shift" setting to manually align the box perfectly to your specific candles.
How to use:
Add to your chart.
Look for the Dark Green highlighted zone.
This zone represents the Weekend Gap (Friday Close to Sunday Open).
Troubleshooting: If the box starts 1-2 hours too early or too late, go to Settings and change the "Hour Shift" value (e.g., -1, +1) until it snaps perfectly to the Friday close candle.
Technical Details:
CME Close: Friday 16:00 CT
CME Open: Sunday 17:00 CT
Color: Dark Green (50% Transparency)
Step 3: Categories & Tags
Select these options in the right-hand menu of the publishing page.
Category: Trend Analysis OR Bitcoin
Tags: CME Bitcoin BTC Gap Futures Weekend
Step 4: Final Checklist Before Clicking "Publish"
Load the Code: Make sure the "Manual Fix" version of the code (the last one I gave you) is currently open in the Pine Editor.
Add to Chart: You must click "Add to Chart" so the script is visible on your screen before publishing.
Privacy: Select Public (so others can search for it) or Private (if you only want to share the link).
Visibility: Choose Open (so others can see the code) or Protected (if you want to hide the code, though Open is better for simple scripts like this).

Volume Climax Reversal (VCR) — Catch Exhaustion Tops & BottomsNew! VCR spots exhaustion spikes at highs/lows using volume extremes + price action + VWAP context.
If you trade parabolic runners, indices, or mean-reversion edges, VCR helps you time the backside (shorts) and fade capitulation (longs) with clean, rule-based signals.
What it does
Detects volume climax: current volume > SMA(len) × multiplier and a new volume high in the lookback.
Confirms price context: makes a higher high (for tops) or lower low (for bottoms).
Filters with VWAP (optional): bearish signals only below VWAP, bullish signals only above VWAP.
Optional wick filter: requires an exhaustion wick > body to reduce chop.
Why traders like it
Clear entries: “VCR↓” (bearish) at exhaustion tops, “VCR↑” (bullish) at washout lows.
Fewer false signals: VWAP gating + wick filter focus on true climaxes.
Built-in alerts: set once, get notified on your phone/desktop when a setup appears.
How I trade it (simple playbook)
Bearish reversal (short / puts)
Wait for VCR↓ (exhaustion at/near HH).
Look for a lower high that fails to reclaim the signal candle high.
Enter on the break of that lower-high candle low.
Stop above the signal wick high.
Covers/targets: VWAP first; then 20–30% fade from the local top / prior demand.
Bullish reversal (long / calls)
Wait for VCR↑ (capitulation at/near LL).
Look for a higher low that holds above the signal candle low.
Enter on the break of the HL candle high.
Stop below the signal wick low.
Targets: VWAP first; then prior supply/MA bands.
Tip for small-cap/“Dux” style: VCR pairs perfectly with a gap + high USD-rotation scan. Let them blow off, then use VCR for the timing.
Inputs (tune to your market)
Volume SMA Length (default 20)
Volume Spike Multiplier (default 2.0)
Lookback High / Low (default 10 / 10)
Require VWAP confirmation? (on)
Use wick filter? (on)
Works on stocks, indices, futures, crypto.
Timeframes: 1–15m for day trading; 1h–4h–D for swing.
Alerts
Set one (or both) alerts and forget it:
Bearish Volume Climax — VCR↓
Bullish Volume Climax — VCR↑
You’ll get instant notifications when a qualified top/bottom prints.
Best practices
Don’t countertrend the first front-side ramp—wait for the VCR and a lower-high/higher-low.
Respect VWAP: it’s your first profit-taking and a bias filter.
Size small into volatility; widen stops in fast markets.
Combine with your watchlist filters (gap %, float/O/S, USD rotation, session timing).
What’s included
Clean visual signals (triangles + subtle background shading)
Session-anchored VWAP
Alert conditions that appear in TradingView’s alert menu
Sensible defaults + clear docs (this post)
FAQ
Q: Does it repaint?
No. VCR uses completed-bar data; signals print end-of-bar.
Q: Which markets?
Anything with volume: US equities, futures, crypto, indices.
Q: Can I use it for scalps?
Yes—1–5m with wick filter on and VWAP required works well.
Get more / upgrades
I’m iterating fast (MTF filter, heatmap panel, combined “one-alert” mode).
Want the pro template with dashboard & combined alerts? Message me on TV or DM / email you@domain.com
.
Risk Notice
This is educational research, not financial advice. Markets carry risk—always manage position size and use stops.
If this helped you, smash the 👍 and ⭐ — it really helps!
#volume #vwap #reversal #exhaustion #trendreversal #smallcaps #scalping #daytrading #swingtrading #stocks #futures #crypto #indicator

DD RatioThe DD Ratio (“Directional Distribution Ratio”) is a breadth indicator that shows, in real time, how many of the selected stocks (e.g., S&P 500 components) are bullish vs. bearish relative to today’s open.
The DD Ratio tells you what’s really happening under the hood of the index:
Futures may mislead: An index future (like ES or NQ) can rise on a few heavy-weighted stocks even while most components fall.
The DD Ratio exposes that divergence.
Breadth confirmation: When the futures are up and DD Ratio ≥ 0.5 → healthy rally.
When futures are up but DD Ratio < 0.5 → weak, narrow advance.
Intraday sentiment gauge: It updates live with each bar, reflecting “who’s winning” since the open.

Bitcoin CME gaps multi-timeframe auto finder1. Overview
The Bitcoin CME Gap Multi-Timeframe Detector automatically identifies price gaps in the Bitcoin CME (Chicago Mercantile Exchange) futures market and visually displays them on the TradingView chart.
Because the CME futures market closes for about an hour after each weekday session and remains closed over the weekend, price gaps frequently appear when trading resumes on Monday.
This indicator analyzes gaps across six major timeframes, from 5-minute to 1-day charts, allowing traders to easily identify structural imbalances and potential support/resistance zones.
It is the most accurate and feature-rich CME gaps indicator available on TradingView.
2. Key Features
■ Multi-Timeframe Gap Detection
Analyzes 5m, 15m, 30m, 1h, 4h, and 1D charts simultaneously.
This enables traders to observe both short-term volatility and mid-to-long-term structure, providing a multi-dimensional view of market dynamics.
■ Gap Direction Classification
Up Gap: When the next candle’s open is higher than the previous candle’s high (default color: green tone)
Down Gap: When the next candle’s open is lower than the previous candle’s low (default color: red tone)
Gaps are color-coded to intuitively visualize potential support and resistance zones.
■ Highlight Function
Gaps exceeding a user-defined threshold (%) are highlighted (default color: yellow).
This helps quickly identify zones with abnormal volatility or sharp price dislocations.
■ Labels and Box Extension
Each gap displays a percentage label indicating its relative size and significance.
Gap zones are extended to the right as boxes, allowing traders to visually track when and how the gap gets filled over time.
■ Alert System
When a gap forms on the selected timeframe (or across all timeframes), a TradingView alert is triggered.
This enables real-time response to significant gap events.
3. Trading Strategies
■ Gap Fill Behavior
CME gaps statistically tend to get filled over time.
Gap boxes help distinguish between filled and unfilled gaps at a glance.
Up Gap: Price tends to decline to fill the previous high–next open zone.
Down Gap: Price often rises later to fill the previous low–next open zone.
■ Support & Resistance Levels
Gap zones frequently act as strong support or resistance.
When price retests a gap area, observing the reaction of buyers and sellers can provide valuable trading insights.
Overlapping gap boxes across multiple timeframes indicate high-confidence support/resistance zones.
■ Market Sentiment & Volatility Analysis
Large gaps usually result from shifts in market sentiment or major news events.
This indicator allows traders to detect volatility spikes early and prepare for potential trend reversals.
■ Combination with Other Technical Tools
While fully functional on its own, this indicator works even better when combined with tools like moving averages (MA), RSI, MACD, or Fibonacci retracements.
For example, if the bottom of a gap coincides with the 0.618 Fibonacci level, it may signal a strong rebound zone.
4. Settings Options
Minimum Gap % | Sets the minimum percentage movement required to detect a gap (lower values show smaller gaps)
Display Timeframes | Choose which timeframes to display (5m, 15m, 30m, 1h, 4h, 1D)
Box Colors | Assign colors for up and down gaps
Box Extension (Bars) | Number of bars to extend gap boxes to the right
Show Labels | Toggle display of gap percentage labels
Label Position / Size | Adjust label position and size
Highlight Gap ≥ % | Highlight gaps exceeding a specified percentage
Highlight Colors | Set highlight color for labels and boxes
Enable Alerts | Enable or disable alerts
Alert Timeframe | Select timeframe(s) for alerts (“All” = all timeframes)
5. Summary
This indicator is a professional trading tool that provides quantitative and visual analysis of price gaps in the Bitcoin CME futures market.
By combining multi-timeframe detection, highlighting, and alert systems, it helps traders clearly identify zones of market imbalance and potential reversal areas.

Relative Valuation OscillatorThis is a Relative Valuation Oscillator (RVO) this is attempt of replication OTC Valuation - a sophisticated multi-asset comparison indicator designed to measure whether the current asset is overvalued or undervalued relative to up to three reference assets.
Overview
The RVO compares the current chart's asset against reference assets (default: 30-Year Treasury Bonds, Gold, and US Dollar Index) to determine relative strength and valuation extremes. It outputs normalized oscillator values ranging from -100 (undervalued) to +100 (overvalued).
Key Features
Multiple Calculation Methods
The indicator offers 5 different calculation approaches:
Simple Ratio - Normalized ratio deviation from average
Percentage Difference - Percentage change comparison
Ratio Z-Score - Standard deviation-based comparison
Rate of Change Comparison - Momentum differential analysis (default)
Normalized Ratio - Min-max normalized ratio
Configurable Reference Assets
Asset 1: Default ZB (30-Year Treasury Bond Futures) - tracks interest rate sensitivity
Asset 2: Default GC (Gold Futures) - tracks safe-haven and inflation dynamics
Asset 3: Default DXY (US Dollar Index) - tracks currency strength
Each asset can be enabled/disabled independently
Fully customizable symbols
Visual Components
Multiple oscillator lines - One for each active reference asset (color-coded)
Average line - Combined signal from all active assets
Overbought/Oversold zones - Configurable threshold levels (default: ±80)
Zero line - Neutral valuation reference
Background coloring - Visual zones for extreme conditions
Signal line - Optional smoothed average
Entry markers - Long/short signals at key reversals
Signal Generation
Crossover alerts - When crossing overbought/oversold levels
Entry signals - Reversals from extreme zones
Divergence detection - Bullish/bearish divergences between price and oscillator
Zero-line crosses - Trend strength changes
Customization Options
Lookback period (10-500): Controls statistical calculation window
Normalization period (50-1000): Determines scaling sensitivity
Smoothing toggle: Optional EMA/SMA smoothing with adjustable period
Visual customization: Colors, levels, and display options
Information Table
Real-time dashboard showing:
Average oscillator value
Current status (Overvalued/Undervalued/Neutral)
Current asset price
Individual values for each active reference asset
Use Cases
Mean reversion trading - Identify extreme relative valuations for reversal trades
Sector rotation - Compare assets within similar categories
Hedging strategies - Understand correlation dynamics
Multi-asset analysis - Simultaneously compare against bonds, commodities, and currencies
Divergence trading - Spot price/oscillator divergences
Trading Strategy Applications
Long signals: When oscillator crosses above oversold level (asset recovering from undervaluation)
Short signals: When oscillator crosses below overbought level (asset declining from overvaluation)
Confirmation: Use multiple reference assets for stronger signals
Risk management: Avoid trading when all assets show neutral readings
This indicator is particularly useful for traders who want to incorporate inter-market analysis and relative strength concepts into their trading decisions, especially in OTC (Over-The-Counter) and futures markets.
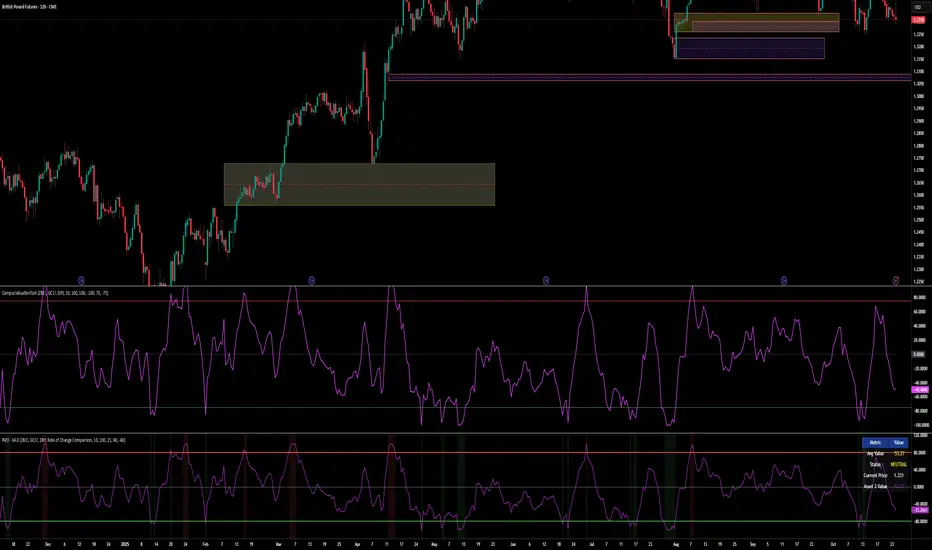
VSTrade OMCThe indicator calculates the ratio of Open Interest (OI) of a futures contract to the market capitalization (Market Cap) of the spot asset. OI is the number of open (unclosed) futures positions in the market, expressed in contracts. Market Cap is the total value of the asset (price * circulating supply). The ratio shows how "overheated" or "interesting" the futures market is relative to the size of the asset.This is not a direct trading signal, but a tool for analyzing liquidity, speculation, and market sentiment.
Индикатор рассчитывает отношение Open Interest (OI) фьючерсного контракта к рыночной капитализации (Market Cap) спотового актива. OI — это количество открытых (незакрытых) фьючерсных позиций на рынке, выраженное в контрактах. Market Cap — общая стоимость актива (цена * circulating supply). Отношение (ratio) показывает, насколько "перегрет" или "интересен" рынок фьючерсов относительно размера актива.
Это не прямой торговый сигнал, а инструмент для анализа ликвидности, спекуляции и рыночных настроений.
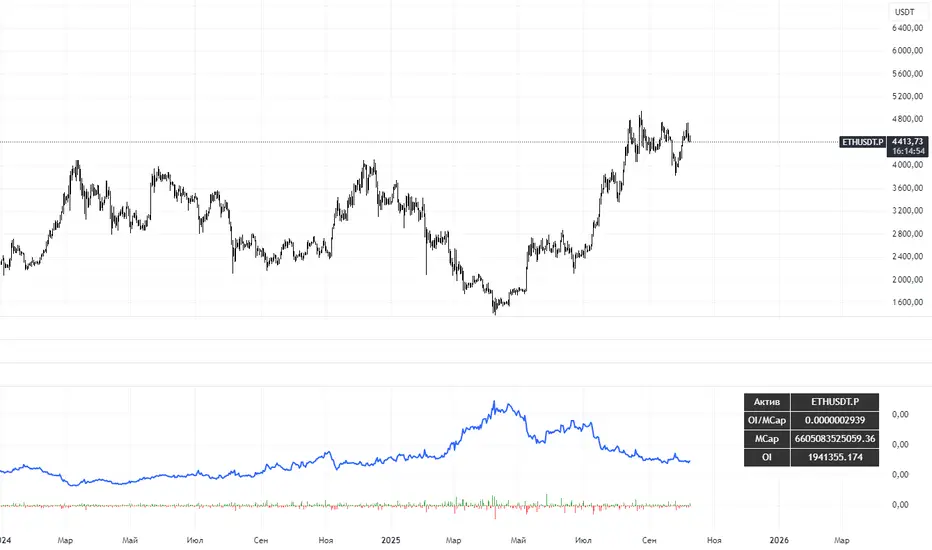
Nifty vs Nifty Fut Premium indicator This indicator compares Nifty Spot and Nifty Futures prices in real-time, displaying the premium (or discount) between them at the top of the pane.
Trading applications:
Arbitrage opportunities: When the premium becomes unusually high or low compared to fair value (based on cost of carry), traders can exploit the mispricing through cash-futures arbitrage
Market sentiment: A rising premium often indicates bullish sentiment as traders are willing to pay more for futures, while a declining or negative premium suggests bearish sentiment
Rollover strategy: Near expiry, monitoring the premium helps traders decide optimal timing for rolling positions from current month to next month contracts
Risk assessment: Sudden spikes in premium can signal increased demand for leveraged long positions, potentially indicating overbought conditions or strong momentum
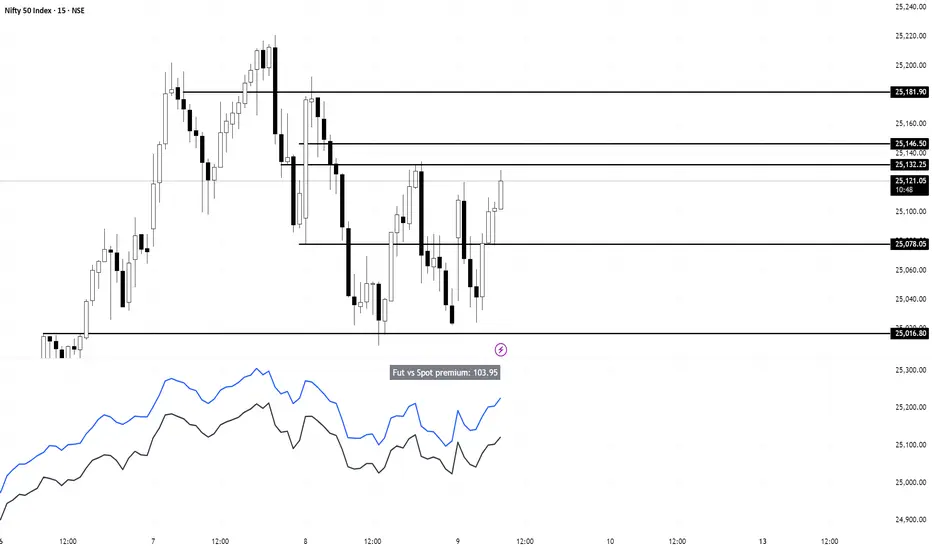
Algo Trading Signals - Buy/Sell System# 📊 Algo Trading Signals - Dynamic Buy/Sell System
## 🎯 Overview
**Algo Trading Signals** is a sophisticated intraday trading indicator designed for algorithmic traders and active day traders. This system generates precise buy and sell signals based on a dynamic box breakout strategy with intelligent position management, add-on entries, and automatic target adjustment.
The indicator creates a reference price box during a specified time window (default: 9:15 AM - 9:45 AM IST) and generates high-probability signals when price breaks out of this range with confirmation.
---
## ✨ Key Features
### 📍 **Smart Signal Generation**
- **Primary Entry Signals**: Clear buy/sell signals on confirmed breakouts above/below the reference box
- **Confirmation Bars**: Reduces false signals by requiring multiple bar confirmation before entry
- **Cooldown System**: Prevents overtrading with configurable cooldown periods between trades
- **Add-On Positions**: Automatically identifies optimal pullback entries for scaling into positions
### 📦 **Dynamic Reference Box**
- Creates a high/low range during your chosen time window
- Automatically updates after each successful trade
- Visual box display with color-coded boundaries (red=resistance, green=support)
- Mid-level reference line for market structure analysis
### 🎯 **Intelligent Position Management**
- **Automatic Target Calculation**: Sets profit targets based on average move distance
- **Add-On System**: Up to 3 additional entries on optimal pullbacks
- **Position Tracking**: Monitors active trades and remaining add-on capacity
- **Auto Box Shift**: Adjusts reference box after target hits for continued trading
### 📊 **Visual Clarity**
- **Color-Coded Labels**:
- 🟢 Green for BUY signals
- 🔴 Red for SELL signals
- 🔵 Blue for ADD-ON buys
- 🟠 Orange for ADD-ON sells
- ✓ Yellow for Target hits
- **TP Level Lines**: Dotted lines showing current profit targets
- **Hover Tooltips**: Detailed information on entry prices, targets, and add-on numbers
### 📈 **Real-Time Statistics**
Live performance dashboard showing:
- Total buy and sell signals generated
- Number of add-on positions taken
- Take profit hits achieved
- Current trade status (LONG/SHORT/None)
- Cooldown timer status
### 🔔 **Comprehensive Alerts**
Built-in alert conditions for:
- Primary buy entry signals
- Primary sell entry signals
- Add-on buy positions
- Add-on sell positions
- Buy take profit hits
- Sell take profit hits
---
## 🛠️ Configuration Options
### **Time Settings**
- **Box Start Hour/Minute**: Define when to begin tracking the reference range
- **Box End Hour/Minute**: Define when to lock the reference box
- **Default**: 9:15 AM - 9:45 AM (IST) - Perfect for Indian market opening range
### **Trade Settings**
- **Target Points (TP)**: Average move distance for profit targets (default: 40 points)
- **Breakout Confirmation Bars**: Number of bars to confirm breakout (default: 2)
- **Cooldown After Trade**: Bars to wait after closing position (default: 3)
- **Add-On Distance Points**: Minimum pullback for add-on entry (default: 40 points)
- **Max Add-On Positions**: Maximum additional positions allowed (default: 3)
### **Display Options**
- Toggle buy/sell signal labels
- Show/hide trading box visualization
- Show/hide TP level lines
- Show/hide statistics table
---
## 💡 How It Works
### **Phase 1: Box Formation (9:15 AM - 9:45 AM)**
The indicator tracks the high and low prices during your specified time window to create a reference box representing the opening range.
### **Phase 2: Breakout Detection**
After the box is locked, the system monitors for:
- **Bullish Breakout**: Price closes above box high for confirmation bars
- **Bearish Breakout**: Price closes below box low for confirmation bars
### **Phase 3: Signal Generation**
When confirmation requirements are met:
- Entry signal is generated with clear visual label
- Target price is calculated (Entry ± Target Points)
- Position tracking activates
- Cooldown timer starts
### **Phase 4: Position Management**
During active trade:
- **Add-On Logic**: If price pulls back by specified distance but stays within favorable range, additional entry signal fires
- **Target Monitoring**: Continuously checks if price reaches TP level
- **Box Adjustment**: After TP hit, box automatically shifts to new range for next opportunity
### **Phase 5: Trade Exit & Reset**
On target hit:
- Position closes with TP marker
- Statistics update
- Box repositions for next setup
- Cooldown activates
- System ready for next signal
---
## 📌 Best Use Cases
### **Ideal For:**
- ✅ Intraday breakout trading strategies
- ✅ Algorithmic trading systems (via alerts/webhooks)
- ✅ Opening range breakout (ORB) strategies
- ✅ Index futures (Nifty, Bank Nifty, Sensex)
- ✅ High-liquidity stocks with clear ranges
- ✅ Automated trading bots
- ✅ Scalping and day trading
### **Markets:**
- Indian Stock Market (NSE/BSE)
- Futures & Options
- Forex pairs
- Cryptocurrency (adjust timing for 24/7 markets)
- Global indices
---
## ⚙️ Integration with Algo Trading
This indicator is **algo-ready** and can be integrated with automated trading systems:
1. **TradingView Alerts**: Set up alert conditions for each signal type
2. **Webhook Integration**: Connect alerts to trading platforms via webhooks
3. **API Automation**: Use with brokers supporting TradingView integration (Zerodha, Upstox, Interactive Brokers, etc.)
4. **Signal Data Access**: All signals are plotted for external data retrieval
---
## 📖 Quick Start Guide
1. **Add Indicator**: Apply to your chart (works best on 1-5 minute timeframes)
2. **Configure Time Window**: Set your desired box formation period
3. **Adjust Parameters**: Tune confirmation bars, targets, and add-on settings to your trading style
4. **Set Alerts**: Create alert conditions for automated notifications
5. **Backtest**: Review historical signals to validate strategy performance
6. **Go Live**: Enable alerts and start receiving real-time trading signals
---
## ⚠️ Risk Disclaimer
This indicator is a **tool for analysis** and does not guarantee profits. Trading involves substantial risk of loss. Always:
- Use proper position sizing
- Implement stop losses (not included in this indicator)
- Test thoroughly before live trading
- Understand market conditions
- Never risk more than you can afford to lose
- Consider your risk tolerance and trading experience
**Past performance does not indicate future results.**
## 🔄 Version History
**v1.0** - Initial Release
- Dynamic box formation system
- Confirmed breakout signals
- Add-on position management
- Visual signal labels and statistics
- Comprehensive alert system
- Auto-adjusting target boxes
---
## 📞 Support & Feedback
If you find this indicator helpful:
- ⭐ Please leave a like/favorite
- 💬 Share your feedback in comments
- 📊 Share your results and improvements
- 🤝 Suggest features for future updates
---
## 🏷️ Tags
`breakout` `daytrading` `signals` `algo` `automated` `intraday` `ORB` `opening-range` `buy-sell` `scalping` `futures` `nifty` `banknifty` `algorithmic` `box-strategy`
*Remember: The best indicator is combined with proper risk management and trading discipline.* Use it at your own rist, not as financial advie

Sentinel Nexus Dashboard [AGP] Ver.1.5Sentinel Nexus Dashboard is a versatile Pine Script designed as a comprehensive technical analysis tool. It condenses a variety of key indicators and metrics into a single, intuitive visual dashboard, providing an integrated view of market trends, momentum, volatility, and liquidity, all neatly organized on your TradingView chart.
Key Features and Benefits
All-in-One Dashboard: This script centralizes relevant information, offering a clean, efficient control panel that helps you make quick decisions without cluttering your chart with multiple overlays.
Trend Analysis with ADX: It incorporates the Average Directional Index (ADX) to measure trend strength. The dashboard displays ADX, DI+, and DI- values with dynamic color-coding to highlight trend intensity (e.g., blue for a very strong trend).
Momentum Analysis with MACD: The dashboard shows MACD line and signal line values in a table. The background color of the MACD values reflects the histogram's direction, allowing you to quickly identify crosses and shifts in market momentum.
Multi-Timeframe RSI Analysis: The RSI (Relative Strength Index) dashboard displays values across multiple timeframes (from 1 minute to 1 month). Overbought (77) and oversold (23) levels are color-coded for immediate identification of market conditions, making it an ideal tool for multi-timeframe analysis.
Smart and Dynamic Volume: The script uses a bar coloring algorithm based on average volume. Chart bars change color according to volume magnitude (extreme, high, average, or low) relative to the average, distinguishing between bullish and bearish bars. This helps you identify significant, liquidity-driven price movements.
Fair Value Analysis: The script calculates an asset's "fair value" using a noise filter (similar to a Kalman filter) on recent highs and lows to determine a midpoint. The price dashboard's background color changes to indicate if the current price is above or below this fair value.
Fibonacci EMA Analysis: A table displays several Exponential Moving Averages (EMAs) based on the Fibonacci sequence. The values are color-coded to show whether the current price is above (white) or below (orange) each EMA, helping you quickly identify dynamic support and resistance levels.
CME Futures Data Integration: For Bitcoin, the script can show a chart label with the Bitcoin futures price (CME:BTC1!), allowing you to compare the spot price with the CME futures market.
Potential Uses and Applications
The Sentinel Nexus Dashboard is an excellent support tool for trading. It is not a signal system but rather a suite of confirmation tools that can be used to:
Confirm Trend Strength: Before entering a trade, use the ADX data to ensure the trend has enough strength for your expected move.
Detect Reversal Points: Multi-timeframe RSI data can alert you to potential overbought or oversold conditions, indicating possible exhaustion of a price move.
Validate Price Movements: Bar coloring based on volume helps you determine if a price move is genuine and supported by strong market participation. High volume can confirm a breakout or reversal.
Identify Support and Resistance: The Fibonacci EMAs allow you to quickly visualize key levels where price might find support or resistance, aiding in planning entries and exits.
In short, this script is perfect for traders who want a comprehensive market overview without chart clutter. It efficiently integrates trend, momentum, and volume analysis in one place.
Legal Disclaimer
RISK WARNING:
This Pine Script is a technical analysis tool and should not be considered financial advice. Past performance of any indicator is no guarantee of future results. Trading in financial markets involves a high risk of loss and is not suitable for all investors. By using this indicator, you accept full responsibility for your trading decisions and acknowledge that any financial loss is your sole responsibility.
IMPORTANT:
Some script functions, such as the CME price label, may not work correctly if your TradingView subscription plan is not a paid one. Please check your plan's limitations to ensure the indicator's optimal functionality.

DNSE VN301!, ADX Momentum StrategyDiscover the tailored Pine Script for trading VN30F1M Futures Contracts intraday.
This strategy applies the Statistical Method (IQR) to break down the components of the ADX, calculating the threshold of "normal" momentum fluctuations in price to identify potential breakouts for entry and exit signals. The script automatically closes all positions by 14:30 to avoid overnight holdings.
www.tradingview.com
Settings & Backtest Results:
- Chart: 30-minute timeframe
- Initial capital: VND 100 million
- Position size: 4 contracts per trade (includes trading fees, excludes tax)
- Backtest period: Sep-2021 to Sep-2025
- Return: over 270% (with 5 ticks slippage)
- Trades executed: 1,000+
- Win rate: ~40%
- Profit factor: 1.2
Default Script Settings:
Calculates the acceleration of changes in the +DI and -DI components of the ADX, using IQR to define "normal" momentum fluctuations (adjustable via Lookback period).
Calculates the difference between each bar’s Open and Close prices, using IQR to define "normal" gaps (adjustable via Lookback period).
Entry & Exit Conditions:
Entry Long: Change in +DI or -DI > Avg IQR Value AND Close Price > Previous Close
Exit Long: (all 4 conditions must be met)
- Change in +DI or -DI > Avg IQR Value
- RSI < Previous RSI
- Close–Open Gap > Avg IQR Gap
- Close Price < Previous Close
Entry Short: Change in +DI or -DI > Avg IQR Value AND Close Price < Previous Close
Exit Short: (all 4 conditions must be met)
- Change in +DI or -DI > Avg IQR Value
- RSI > Previous RSI
- Close–Open Gap > Avg IQR Gap
- Close Price > Previous Close
Disclaimers:
Trading futures contracts carries a high degree of risk, and price movements can be highly volatile. This script is intended as a reference tool only. It should be used by individuals who fully understand futures trading, have assessed their own risk tolerance, and are knowledgeable about the strategy’s logic.
All investment decisions are the sole responsibility of the user. DNSE bears no liability for any potential losses incurred from applying this strategy in real trading. Past performance does not guarantee future results. Please contact us directly if you have specific questions about this script.

Deadband Hysteresis Filter [BackQuant]Deadband Hysteresis Filter
What this is
This tool builds a “debounced” price baseline that ignores small fluctuations and only reacts when price meaningfully departs from its recent path. It uses a deadband to define how much deviation matters and a hysteresis scheme to avoid rapid flip-flops around the decision boundary. The baseline’s slope provides a simple trend cue, used to color candles and to trigger up and down alerts.
Why deadband and hysteresis help
They filter micro noise so the baseline does not react to every tiny tick.
They stabilize state changes. Hysteresis means the rule to start moving is stricter than the rule to keep holding, which reduces whipsaw.
They produce a stepped, readable path that advances during sustained moves and stays flat during chop.
How it works (conceptual)
At each bar the script maintains a running baseline dbhf and compares it to the input price p .
Compute a base threshold baseTau using the selected mode (ATR, Percent, Ticks, or Points).
Build an enter band tauEnter = baseTau × Enter Mult and an exit band tauExit = baseTau × Exit Mult where typically Exit Mult < Enter Mult .
Let diff = p − dbhf .
If diff > +tauEnter , raise the baseline by response × (diff − tauEnter) .
If diff < −tauEnter , lower the baseline by response × (diff + tauEnter) .
Otherwise, hold the prior value.
Trend state is derived from slope: dbhf > dbhf → up trend, dbhf < dbhf → down trend.
Inputs and what they control
Threshold mode
ATR — baseTau = ATR(atrLen) × atrMult . Adapts to volatility. Useful when regimes change.
Percent — baseTau = |price| × pctThresh% . Scale-free across symbols of different prices.
Ticks — baseTau = syminfo.mintick × tickThresh . Good for futures where tick size matters.
Points — baseTau = ptsThresh . Fixed distance in price units.
Band multipliers and response
Enter Mult — outer band. Price must travel at least this far from the baseline before an update occurs. Larger values reject more noise but increase lag.
Exit Mult — inner band for hysteresis. Keep this smaller than Enter Mult to create a hold zone that resists small re-entries.
Response — step size when outside the enter band. Higher response tracks faster; lower response is smoother.
UI settings
Show Filtered Price — plots the baseline on price.
Paint candles — colors bars by the filtered slope using your long/short colors.
How it can be used
Trend qualifier — take entries only in the direction of the baseline slope and skip trades against it.
Debounced crossovers — use the baseline as a stabilized surrogate for price in moving-average or channel crossover rules.
Trailing logic — trail stops a small distance beyond the baseline so small pullbacks do not eject the trade.
Session aware filtering — widen Enter Mult or switch to ATR mode for volatile sessions; tighten in quiet sessions.
Parameter interactions and tuning
Enter Mult vs Response — both govern sensitivity. If you see too many flips, increase Enter Mult or reduce Response. If turns feel late, do the opposite.
Exit Mult — widening the gap between Enter and Exit expands the hold zone and reduces oscillation around the threshold.
Mode choice — ATR adapts automatically; Percent keeps behavior consistent across instruments; Ticks or Points are useful when you think in fixed increments.
Timeframe coupling — on higher timeframes you can often lower Enter Mult or raise Response because raw noise is already reduced.
Concrete starter recipes
General purpose — ATR mode, atrLen=14 , atrMult=1.0–1.5 , Enter=1.0 , Exit=0.5 , Response=0.20 . Balanced noise rejection and lag.
Choppy range filter — ATR mode, increase atrMult to 2.0, keep Response≈0.15 . Stronger suppression of micro-moves.
Fast intraday — Percent mode, pctThresh=0.1–0.3 , Enter=1.0 , Exit=0.4–0.6 , Response=0.30–0.40 . Quicker turns for scalping.
Futures ticks — Ticks mode, set tickThresh to a few spreads beyond typical noise; start with Enter=1.0 , Exit=0.5 , Response=0.25 .
Strengths
Clear, explainable logic with an explicit noise budget.
Multiple threshold modes so the same tool fits equities, futures, and crypto.
Built-in hysteresis that reduces flip-flop near the boundary.
Slope-based coloring and alerts that make state changes obvious in real time.
Limitations and notes
All filters add lag. Larger thresholds and smaller response trade faster reaction for fewer false turns.
Fixed Points or Ticks can under- or over-filter when volatility regime shifts. ATR adapts, but will also expand bands during spikes.
On extremely choppy symbols, even a well tuned band will step frequently. Widen Enter Mult or reduce Response if needed.
This is a chart study. It does not include commissions, slippage, funding, or gap risks.
Alerts
DBHF Up Slope — baseline turns from down to up on the latest bar.
DBHF Down Slope — baseline turns from up to down on the latest bar.
Implementation details worth knowing
Initialization sets the baseline to the first observed price to avoid a cold-start jump.
Slope is evaluated bar-to-bar. The up and down alerts check for a change of slope rather than raw price crossings.
Candle colors and the baseline plot share the same long/short palette with transparency applied to the line.
Practical workflow
Pick a mode that matches how you think about distance. ATR for volatility aware, Percent for scale-free, Ticks or Points for fixed increments.
Tune Enter Mult until the number of flips feels appropriate for your timeframe.
Set Exit Mult clearly below Enter Mult to create a real hold zone.
Adjust Response last to control “how fast” the baseline chases price once it decides to move.
Final thoughts
Deadband plus hysteresis gives you a principled way to “only care when it matters.” With a sensible threshold and response, the filter yields a stable, low-chop trend cue you can use directly for bias or plug into your own entries, exits, and risk rules.

Index Position Size Calculator for [US30 / US100 / SP500]What it does
This tool helps you size positions consistently for index trades on US30 (Dow Jones), NAS100 (Nasdaq-100), and SP500 (S&P 500). Enter your account balance, risk %, and your planned Entry / Stop-Loss / Target and the script calculates:
• Position Size (rounded to your lot/contract step)
• Risk-to-Reward (R/R)
• Potential P/L in USD based on your inputs
• Visual Entry / SL / TP lines with green/red zones and concise labels
Supported contract styles
Choose a preset for common products (e.g., CFD $1/pt, YM/NQ/ES futures, MYM/MNQ/MES micros) or override the economics yourself. You remain in control of the two key levers:
• $/point — how many dollars you gain/lose per 1 index point per contract/lot
• Point size — how many price units equal 1 index point on your chart (often 1.0, but some brokers use 0.1 or 0.5)
Inputs
• Account Balance ($) and Risk % per trade
• Index: US30 / NAS100 / SP500
• Contract: CFD / Futures (YM, NQ, ES) / Micros (MYM, MNQ, MES)
• $/point: auto from Contract or manual override
• Point size: auto from Index or manual override
• Position size step: rounding (e.g., 1 for futures, 0.01 for CFDs)
• Entry / SL / TP: typed values (snapped to tick), with on-chart zones and labels
• Display toggles for lines and labels
How the math works
• StopPoints = |Entry − SL| ÷ PointSize
• ProfitPoints = |TP − Entry| ÷ PointSize
• Position Size = (AccountBalance × Risk%) ÷ (StopPoints × $/point)
• R/R = ProfitPoints ÷ StopPoints
• Potential P/L = PositionSize × Points × $/point
How to use (quick start)
1. Select Index and Contract.
2. Confirm $/point and Point size match your broker’s specs.
3. Enter Entry / SL / TP for the trade idea.
4. Read the Position Size, R/R, and Potential P/L in the info box.
5. Adjust for fees, spreads, and slippage as needed.
Notes & limitations
• Broker symbols can vary. Always verify $/point and Point size for your instrument before risking capital.
• The script does not place orders and does not generate trade signals; it’s a sizing/visualization tool.
• Results can differ across brokers due to pricing, spreads, minimum lot sizes, and execution rules.
• Use on the intended indices; you’ll see a reminder if you load it elsewhere.
Changelog highlights
• Pine v6, constant-safe inputs, tick-snapping, global fills (no local-scope errors).
• Robust label handling and optional minimal chart markers.
Disclaimer
This script is provided for educational purposes only and does not constitute financial advice or a recommendation to buy or sell any security or derivative. Trading involves risk, including the possible loss of principal. Always do your own research, verify contract specifications with your broker, and consider testing in a demo environment before trading live.

Renko Open Range delta
Delta Renko-Style Indicator Guide (NQ Focus)
This indicator takes inspiration from the Renko Chart concept and is optimized for the RTH session (New York time zone), specifically applied to the Nasdaq futures (NQ) product.
If you’re unfamiliar with Renko charts, it may help to review their basics first, as this indicator borrows their clean, block-based perspective to simplify price interpretation.
⸻
🔧 How the Indicator Works
• At market open (9:30 AM EST), the indicator plots a horizontal open price line, referred to as 0 delta.
• From this anchor, it plots 10 incremental levels (deltas) both above and below the open, each spaced by 62.5 NQ points.
Why 62.5?
• With NQ currently trading in the 23,000–24,000 range, a 62.5-point move represents roughly 0.26% of the daily average range.
• This makes each delta step significant enough to capture movement while filtering out smaller noise.
A mini table (location adjustable) displays:
• Current delta zone
• Last touched delta level
This gives you a quick snapshot of where price sits relative to the open.
⸻
📈 How to Read the Market
• At the open, price typically oscillates between 0 and +1 / -1 delta.
• A break beyond this zone often signals stronger directional intent:
• Trending day: price can push into +2, +3, +4, +5 (or the inverse for downside).
• Range day: expect price to bounce between +1, 0, -1 deltas.
⚠️ Note: This is a visualization tool, not a trading system. Its purpose is to help you quickly recognize range vs. trend conditions.
⸻
📊 Example
• In this case, NQ reached +1 delta shortly after open.
• A retest of 0 delta followed, and price later surged to +5/+6 deltas (helped by Fed news).
⸻
🛠️ Practical Uses
This indicator can help you:
• Define profit targets
• Place hard stop levels
• Gauge whether a counter-trend trade is worth the risk
⚠️ Caution: Avoid counter-trend trades if price is aggressively pushing toward +5/+6 or -5/-6 deltas, as trend exhaustion usually hasn’t set in yet.
⸻
🔄 Adapting for ES (S&P Futures)
• On NQ, 62.5 points ≈ $1,250 per contract.
• For ES, this translates to 25 points.
• Since 1 NQ contract ≈ 2 ES contracts in dollar terms, an optimized ES delta step would be 12.5 points.
You may also experiment with different delta values (e.g., 50 or 31.25 for NQ) to align with your risk profile and trading style.
⸻
🧪 Extending Beyond NQ
You can experiment with applying this indicator to ES or even stocks, but non-futures assets may require additional calibration and testing.
⸻
✅ Bottom line: This tool provides a clean, Renko-inspired framework for quickly gauging trend vs. range conditions, setting realistic profit targets, and avoiding poor counter-trend setups.
