Seasonal tendency: week-on-week % change and 10yr Averages-shows week-on-week % change, and 10yr averages of these % changes
-scan across the 10yr averages to get a good idea of the seasonality of an asset
-best used on commodities with strong seasonal tendencies (Gold, Wheat, Coffee, Lean hogs etc)
-works only on daily timeframe
-by default it will compare SMA(length) in the following way, BTC: Sunday cf previous Sunday | ES/Gold: Monday cf previous Monday
-for most assets, 5 daily bars in a week (SMA(5)) => that's the default. For BTC can change this to 7.
~~inputs:
-change input year to show any previous decade of asset's history; the table will display over that year on the chart
-choose expression for Average of % change week on week: SMA, ohlc4, vwma, vwap (default SMA)
-choose number of daily bars in a week (i.e. SMA length)
-change label sizes/colors
~~notes:
-When applied to current year: will print the 10yr average for previous weeks in the year; 9yr average for future weeks in the year
-drawings and SMA plot on the above chart are just to show visually how the week's average is calculated, and how this lines up with the label
-current week of year will highlight in large font orange by default
-the first 2 weeks of the year are omitted because of a bug i can't figure out, which throws out bad numbers.
-cannot print all the values for each of previous 10yrs; 'code too long' error. Could likely do this via using matrices but would require a rewrite
17th Dec 2022
@twingall
Cari dalam skrip untuk "GOLD"

[blackcat] L3 YACD38Level 3
Background
"3/8 moving average" golden cross enters, and dead cross exits.
Function
This set of methods is an improved moving average usage - "38 moving average usage", we need to use three moving averages:
3-day, 8-day and 21-day moving averages.
Why is it the 3-day, 8-day, and 21-day moving averages? Most of my friends may not be clear. 3, 8, and 21 are all Fibonacci numbers, also known as the golden section numbers. The Fibonacci number is a basic pattern of nature, which exists in all things. If you don’t understand it, you can go to a certain degree to understand it. In short, it is a very magical existence.
Keep in mind the principle of only doing uptrends and not downtrends. Then we have to use our 21-day moving average skillfully. The 21-day moving average happens to be the average price line for one month. We take it as the decision-making line. When the decision-making line goes down or goes flat, we mainly wait and see; , the operation success rate is higher!
Let's directly share the technical points of "38 moving average usage":
1. Entry point: the 3-day line crosses the 8-day line to form a golden cross, or both the 3-day and 8-day line cross the 21-day moving average; the position of the golden cross must be above the 21-day moving average, and it is invalid if it is below;
2. Basis for holding shares: After entering the market, the moving averages are arranged in a long position, and the K-line rises along the 3-day and 8-day moving averages, hold it patiently, and sell for whatever reason you buy!
3. Exit point: When the 3-day moving average crosses the 8-day moving average to form a dead cross, or the 3-day and 8-day moving averages break below the 21-day moving average, then decisively leave the market;
Note: "38 moving average usage" only needs to refer to the moving average, and the other most reference quantities can be changed. As long as the above conditions are met, you can boldly intervene, and after the intervention, you will rise to the top! Don't underestimate the usage of this set of moving averages, carefully comprehend and memorize them by heart, and be able to achieve the unity of knowledge and action, and you will be able to stand up and be the master from now on!
Remarks
Feedbacks are appreciated.

The Investment ClockThe Investment Clock was most likely introduced to the general public in a research paper distributed by Merrill Lynch. It’s a simple yet useful framework for understanding the various stages of the US economic cycle and which asset classes perform best in each stage.
The Investment Clock splits the business cycle into four phases, where each phase is comprised of the orientation of growth and inflation relative to their sustainable levels:
Reflation phase (6:01 to 8:59): Growth is sluggish and inflation is low. This phase occurs during the heart of a bear market. The economy is plagued by excess capacity and falling demand. This keeps commodity prices low and pulls down inflation. The yield curve steepens as the central bank lowers short-term rates in an attempt to stimulate growth and inflation. Bonds are the best asset class in this phase.
Recovery phase (9:01 to 11:59): The central bank’s easing takes effect and begins driving growth to above the trend rate. Though growth picks up, inflation remains low because there’s still excess capacity. Rising growth and low inflation are the Goldilocks phase of every cycle. Stocks are the best asset class in this phase.
Overheat phase(12:01 to 2:59): Productivity growth slows and the GDP gap closes causing the economy to bump up against supply constraints. This causes inflation to rise. Rising inflation spurs the central banks to hike rates. As a result, the yield curve begins flattening. With high growth and high inflation, stocks still perform but not as well as in recovery. Volatility returns as bond yields rise and stocks compete with higher yields for capital flows. In this phase, commodities are the best asset class.
Stagflation phase (3:01 to 5:59): GDP growth slows but inflation remains high (sidenote: most bear markets are preceded by a 100%+ increase in the price of oil which drives inflation up and causes central banks to tighten). Productivity dives and a wage-price spiral develops as companies raise prices to protect compressing margins. This goes on until there’s a steep rise in unemployment which breaks the cycle. Central banks keep rates high until they reign in inflation. This causes the yield curve to invert. During this phase, cash is the best asset.
Additional notes from Merrill Lynch:
Cyclicality: When growth is accelerating (12 o'clock), Stocks and Commodities do well. Cyclical sectors like Tech or Steel outperform. When growth is slowing (6 o'clock), Bonds, Cash, and defensives outperform.
Duration: When inflation is falling (9 o'clock), discount rates drop and financial assets do well. Investors pay up for long duration Growth stocks. When inflation is rising (3 o'clock), real assets like Commodities and Cash do best. Pricing power is plentiful and short-duration Value stocks outperform.
Interest Rate-Sensitives: Banks and Consumer Discretionary stocks are interest-rate sensitive “early cycle” performers, doing best in Reflation and Recovery when central banks are easing and growth is starting to recover.
Asset Plays: Some sectors are linked to the performance of an underlying asset. Insurance stocks and Investment Banks are often bond or equity price sensitive, doing well in the Reflation or Recovery phases. Mining stocks are metal price-sensitive, doing well during an Overheat.
About the indicator:
This indicator suggests iShares ETFs for sector rotation analysis. There are likely other ETFs to consider which have lower fees and are outperforming their sector peers.
You may get errors if your chart is set to a different timeframe & ticker other than 1d for symbol/tickers GDPC1 or CPILFESL.
Investment Clock settings are based on a "sustainable level" of growth and inflation, which are each slightly subjective depending on the economist and probably have changed since the last time this indicator was updated. Hence, the sustainable levels are customizable in the settings. When I was formally educated I was trained to use average CPI of 3.1% for financial planning purposes, the default for the indicator is 2.5%, and the Medium article backtested and optimized a 2% sustainable inflation rate. Again, user-defined sustainable growth and rates are slightly subjective and will affect results.
I have not been trained or even had much experience with MetaTrader code, which is how this indicator was originally coded. See the original Medium article that inspired this indicator if you want to audit & compare code.
Hover over info panel for detailed information.
Features: Advanced info panel that performs Investment Clock analysis and offers additional hover info such as sector rotation suggestions. Customizable sustainable levels, growth input, and inflation input. Phase background coloring.
⚠ DISCLAIMER: Not financial advice. Not a trading system. DYOR. I am not affiliated with Medium, Macro Ops, iShares, or Merrill Lynch.
About the Author: I am a patent-holding inventor, a futures trader, a hobby PineScripter, and a former FINRA Registered Representative.

10yr, 20yr, 30yr Averages: Month/Month % Change; SeasonalityCalculates 10yr, 20yr and 30yr averages for month/month % change
~shows seasonal tendencies in assets (best in commodities). In above chart: August is a seasonally bullish month for Gold: All the averages agree. And January is the most seasonally bullish month.
~averages represent current month/previous month. i.e. Jan22 average % change represents whole of jan22 / whole of dec21
~designed for daily timeframe only: I found calling monthly data too buggy to work with, and I thought weekly basis may be less precise (though it would certainly reduce calculation time!)
~choose input year, and see the previous 10yrs of monthly % change readings, and previous 10yrs Average, 20yr Average, 30yr Average for the respective month. Labels table is always anchored to input year.
~user inputs: colors | label sizes | decimal places | source expression for averages | year | show/hide various sections
~multi-yr averges always print, i.e if only 10yrs history => 10yr Av = 20yr Av = 30yr Av. 'History Available' label helps here.
Based on my previously publised script: "Month/Month Percentage % Change, Historical; Seasonal Tendency"
Publishing this as seperate indicator because:
~significantly slower to load (around 13 seconds)
~non-premium users may not have the historical bars available to use 20yr or 30yr averages =>> prefer the lite/speedier version
~~tips~~
~after loading, touch the new right scale; then can drag the table as you like and seperate it from price chart
##Debugging/tweaking##
Comment-in the block at the end:
~test/verifify specific array elements elements.
~see the script calculation/load time
~~other ideas ~~
~could tweak the array.slice values in lines 313 - 355 to show the last 3 consecutive 10yr averages instead (i.e. change 0, 10 | 0,20 | 0, 30 to 0, 10 | 10, 20 | 20,30)
~add 40yr average by adding another block to each of the array functions, and tweaking the respective labels after line 313 (though this would likely add another 5 seconds to the load time)
~use alternative method for getting obtaining multi-year values from individual month elements. I used array.avg. You could try array.median, array.mode, array.variance, array.max, array.min (lines 313-355)

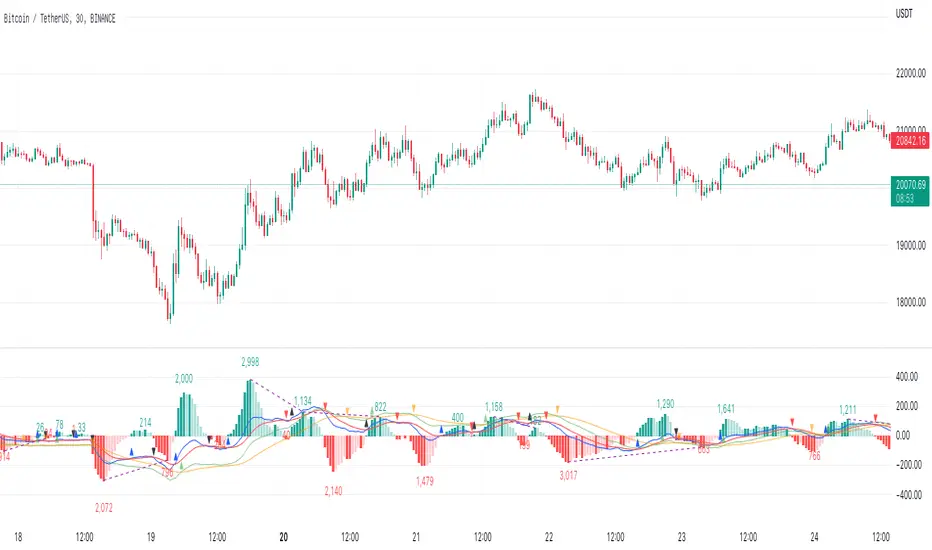
MACD XDThis indicator is based on the classic MACD indicator, and with the following additional features:
1. Another set of MACD and signal lines (green and orange) is added for analyzing a bigger trend in a higher time frame. The default set of MACD and signal lines (red and blue) are used for the smaller trend (current time frame).
2. Small upward and downward triangles are added to mark the golden and death crosses of MACD and signal lines: Blue and red triangles (buy and sell signals) - golden and death crosses of MACD and signal lines for the smaller trend (current time frame), green and orange triangles (buy and sell signals) - golden and death crosses of MACD and signal lines for the bigger trend (a higher time frame).
3. The total areas of histograms above and below the MACD zero axis are calculated and shown by the numbers next to the histogram. This information can be used to analyze the top and bottom divergences of the smaller trend (current time frame).
4. A line connecting peaks of adjacent positive or negative histograms is drawn when top and bottom divergences occur, which indicates a potential trend reversal.
This indicator can be used in the following way: after a golden cross occurs in the bigger trend (green arrow), a death cross in the smaller trend (red arrow) may lead to a potential long entry at the pull back of the bigger up trend; after a death cross occurs in the bigger trend (orange arrow), a golden cross in the smaller trend (blue arrow) may lead to a potential short entry at the pull back of the bigger down trend. Note that in general, golden crosses occur when MACD and signal lines are above the zero axis means a higher high will be made, and death crosses occur when MACD and signal lines are below the zero axis means a lower low will be made. On the contrary, golden crosses occurring below the zero axis or death crosses occurring above the zero axis may only lead to a potential pull back in a trend.
本指标基于经典的MACD指标,适合与缠论指标结合使用:
1. 加入第二组MACD线和信号线,适用于辅助判断缠论中的线段背离。
2. 加入计算直方图(红绿柱子)面积的部分,有助于判断缠论中的笔背离。
3. 标注出两组MACD线与信号线的金叉死叉,以及用特殊颜色表示零轴上方金叉和零轴下方死叉的情况。
4. 用直线标注出顶底背离发生的情况,利于准确分辨和判断。
Trendlines Boll Ichi S1 by GammaprodI. How to use this indicator :
------------------------------
I.1. Set your teadingview theme to dark theme.
I.2. Gammaprod indicator is valid for forex, stock and but more valid for crypto.
I.3. Use three timeframe for more validation (choose between those, that fit to your trading style) :
- Timeframe 1m, 5m, and 15m for Scalping
- Timeframe 30m, 1h and 4h for Intraday
- Timeframe 4h, 1D and 1W for Swing Trading
I.4 Always use THREE INDICATORS FROM GAMMAPROD, those three indicators is back to back each other, by the way, I only made those three indicators only (for now) :
- Trendlines Boll Ichi S1 by Gammaprod
- MACD Volume S2 by Gammaprod
- Stoch RSI Divs Zone S2 by Gammaprod
============================================================================
II. How to setting :
--------------------
II.1. Trendlines Boll Ichi Crypto by Gammaprod
II.1.A. Support and Resistance
- Well if you familiar with this indicator you can add it, but recommended for Timeframe 30m or more
II.1.B. Trendlines Primary or Trendlines Secondary
- Timeframe 1m you DON'T NEED Trendlines Primary or Trendlines Secondary
- Timeframe 5m you DON'T NEED Trendlines Secondary, but you CAN ADD Trendlines Primary if you fell it helpful (for me, it is helpful to find where the candles start or the end trend or a consolidation or where the candles will surpass a resistance or a support).
- Timeframe 15m you DON'T NEED Trendlines Secondary, DEFENITELY add Trendlines Primary it will help to find where the candles stop or a consolidation or where the candles will surpass a resistance or a support).
- Timeframe 30m or more, DEFENITELY NEED BOTH Trendlines Primary and Secondary Trendlines, it will help to find where the candle stop or consolidation or where the candle will surpass a resistance or support).
II.1.C. Bollinger, Ichimoku Cloud and Lagging Span
- Please DON'T CHANGE IT at all, it's really helpful to know when and where to make an entry decesion or a trend or a consolidation, if you don't understand how to read it, you better to learn it first (on "how to read" section and "How to OPEN position" the section below)
II.2. Stoch RSI Divs Zone Crypto by Gammaprod (DON'T CHANGE IT)
II.3. MACD Volume Crypto by Gammaprod (DON'T CHANGE IT)
============================================================================
III. How to read :
------------------
III.1. Sell or Buy Priority :
III.1.A. Sell Priority
- Color background on macd and stoch rsi is pink or purple sell is the priority, (if you're not sure to buy, just wait until the best moment to sell)
III.1.B. Buy Priority
- Color background on macd and stoch rsi Teal or light green buy is the priority, (if you're not sure to sell, just wait until the best moment to buy)
III.1.C. Indecision / Golden Moment
- Color background on stoch rsi yellow is indecision / golden moment of reversal pattern (wait until it formed background only on Stoch RSI), please be careful at this moment.
III.2. Trend / Consolidation :
III.2.A. BULLISH trend
- When Stoch RSI and MACD have teal or light green background that's means BULLISH trend, better to confirm by the candle is above green cloud and lagging span (red line) is also above the candle.
III.2.B. BEARISH trend
- When Stoch RSI and MACD have the Pink or purple background that's means BEARISH trend, better to confirm by the candle is above purple cloud and lagging span (red line) is also below the candle.
III.2.C. CONSOLIDATION
- When Stoch RSI have the mix background that's means CONSOLIDATION, better to confirm by the candle is in or near to green / purple cloud and lagging span (red line) is also on the candle.
III.3. Special Mark
III.3.A. Ideal Bullish :
- Near line 20 and green / teal background = When Stoch RSI have the char R / H on lime color label, that's means divergence or hidden divergence for buy position, if you not see this label that's means just a standard confirmation for buy
III.3.B. Not an Ideal Bullish :
- Near line 80 and green / teal background = if this happens make sure you know what happen, it could be a false signal or bullish continual pattern
III.3.C. Ideal Bearish :
- Near line 80 and pink / purple background = When Stoch RSI have the char R / H on lime color label, that's means divergence or hidden divergence for buy position, if you not see this label that's means just a standard confirmation for sell position.
III.3.D. Not an Ideal Bearish:
- Near line 20 and pink / purple background = if this happens make sure you know what happen, it could be a false signal or bearish continual pattern
III.3.E. The Beginning of Reversal (from BEARISH to BULLISH) :
- When Stoch RSI line shaping GREEN position is near 20.
- MACD lines still PINK, position lines is UNDER the HISTOGRAM, but the HISTOGRAM start to SHAPE FALL PINK (light pink) and the BACKGROUND still PINK / PURPLE.
- Position CANDLES NEAR BLUE line, NEAR PURPLE CLOUD, and lagging span (red line) STILL ON the area candle. (it used to be confirmed with the golden moment).
III.3.F. The Beginning of Reversal (from BULLISH to BEARISH) :
- When Stoch RSI line shaping PINK position is near 80.
- MACD lines still GREEN, position lines is ABOVE the HISTOGRAM, but the HISTOGRAM start to SHAPE FALL GREEN (light green) and the BACKGROUND still TEAL / GREEN.
- Position CANDLES NEAR WHITE line, NEAR TEAL CLOUD, and lagging span (red line) STILL ON the area candle. (it used to be confirmed with the golden moment).
III.3.G. False Signals, or It could be a Golden Moment (better to see it on TF 15 or bigger):
- Near line 20 or 80 and yellow background = When Stoch RSI have the char R / H on color label, that's means divergence or hidden divergence for buy / sell position, if you not see this label that's means just a standard confirmation for buy / sell depends on where the Stoch RSI line if near 20 that's means buy, near 80 means sell
============================================================================
IV. How to OPEN position:
-------------------------
IV.1. Bullish
IV.1.A. Trendlines Boll Ichi S1 by Gammaprod
- The candles above the green cloud.
- Lagging span (red line) above the candles.
- then open buy near yellow line (the first option) / blue line (the second option) (always confirm the position with two other indicators below).
IV.1.B. MACD Volume S2 by Gammaprod
- Teal or Green background.
- The lines is shaped or shaping green.
- Better if at the green histogram.
IV.1.C. Stoch RSI Divs Zone S3 by Gammaprod
- Teal or Green background.
- The lines is shaping green.
- Better if on the bottom (at a range 20).
IV.2. Bearish
IV.2.A. Trendlines Boll Ichi S1 by Gammaprod
- The candles below the purple cloud.
- Lagging span (red line) below the candles.
- then open buy near yellow line (the first option) / white line (the second option) (always confirm the position with two other indicators below).
IV.2.B. MACD Volume S2 by Gammaprod
- Pink or purple background.
- The lines are shaped or shaping green.
- Better if at the pink histogram.
IV.2.C. Stoch RSI Divs Zone S3 by Gammaprod
- Pink or purple background.
- The lines are shaping pink.
- Better if the line on the top (at a range 80).
IV.3. Consolidation
IV.3.A. Trendlines Boll Ichi S1 by Gammaprod
- The candles on the cloud (green or purple).
- Lagging span (red line) on the candles.
- then open buy near the white or blue line (always confirm the position with two other indicators below).
IV.3.B. MACD Volume S2 by Gammaprod
- Changing the background.
- The line is near the middle line.
- Have small Histogram.
IV.3.C. Stoch RSI Divs Zone S3 by Gammaprod
- Mix background specially on a timeframe 15m or more.
- The line move fast up and down.
- Better if on the bottom or the top of the lines (at a range 20 or 80).
============================================================================
>> The secret ingredient is comparing the timeframe :
The example scalping (Timeframe 1m, 5m and 15m)
- TF 1m is for making an open position.
- TF 5m is for making a judgement of the trend market.
- TF 15m is to confirm that judgement from TF 5m, be careful if it not similar then it used to be a consolidation or the beginning of the reversal.
There's a lot a way to open the position than above information that i gave it to you, but consider there are a limit chars on this column, I hope it will help your trading and make a more profit on it.

MACD Volume S2 By Gammaprod>> How to use this indicator :
1. Set your teadingview theme to dark theme.
2. My indicator is valid for forex, stock and but more valid for crypto.
3. Use three timeframe for more validation (choose between those, that fit to your trading style) :
- Timeframe 1m, 5m, and 15m for Scalping
- Timeframe 30m, 1h and 4h for Intraday
- Timeframe 4h, 1D and 1W for Swing Trading
4 . Always use THREE INDICATORS FROM GAMMAPROD, those three indicators is back to back each other, by the way, I only made those three indicators only (for now) :
- Trendlines Boll Ichi Crypto by Gammaprod
- Stoch RSI Divs Zone Crypto by Gammaprod
- MACD Volume Crypto by Gammaprod
>> How to setting :
1. Trendlines Boll Ichi Crypto by Gammaprod
A. Support and Resistence
- Well if you familiar with this indicator you can add it, but recommended for Timeframe 30m or more
B. Trendlines Primary or Trendlines Secondary
- Timeframe 1m you DON'T NEED Trendlines Primary or Trendlines Secondary
- Timeframe 5m you DON'T NEED Trendlines Secondary, but you CAN ADD Trendlines Primary if you fell it helpful (for me, it is helpful to find where the candles start or the end trend or a consolidation or where the candles will surpass a resistance or a support).
- Timeframe 15m you DON'T NEED Trendlines Secondary, DEFENITELY add Trendlines Primary it will help to find where the candles stop or a consolidation or where the candles will surpass a resistance or a support).
- Timeframe 30m or more, DEFENITELY NEED BOTH Trendlines Primary and Secondary Trendlines, it will help to find where the candle stop or consolidation or where the candle will surpass a resistance or support).
C. Bolinger, Ichimoku Cloud and Lagging Span
- Please DON'T CHANGE IT at all, it's really helpful to know when and where to make an entry decesion or a trend or a consolidation, if you don't understand how to read it, you better to learn it first (on "how to read" section and "How to OPEN position" the section below)
2. Stoch RSI Divs Zone Crypto by Gammaprod (DON'T CHANGE IT)
3. MACD Volume Crypto by Gammaprod (DON'T CHANGE IT)
>> How to read :
1. Sell or Buy Priority :
A. Buy Priority
- Color background on macd and stoch rsi is pink or purple sell is the priority, (if you're not sure to buy, just wait until the best moment to sell)
B. Buy Priority
- Color background on macd and stoch rsi Teal or light green buy is the priority, (if you're not sure to sell, just wait until the best moment to buy)
C. Indecision / Golden Moment
- Color background on stoch rsi yellow is indecision / golden moment of reversal pattern (wait until it formed background only on Stoch RSI), please becareful at this moment.
2. Trend / Consolidation :
A. BULLISH trend
- When Stoch RSI and MACD have teal or light green background that's means BULLISH trend, better to confirm by the candle is above green cloud and lagging span (red line) is also above the candle.
B. BEARISH trend
- When Stoch RSI and MACD have the Pink or purple background that's means BEARISH trend, better to confirm by the candle is above purple cloud and lagging span (red line) is also below the candle.
C. CONSOLIDATION
- When Stoch RSI have the mix background that's means CONSOLIDATION, better to confirm by the candle is in or near to green / purple cloud and lagging span (red line) is also on the candle.
3. Special Mark
A. Ideal Bullish :
- Near line 20 and green / teal background = When Stoch RSI have the char R / H on lime color label, that's means divergence or hidden divergence for buy position, if you not see this label that's means just a standard confirmation for buy
B. Not an Ideal Bullish :
- Near line 80 and green / teal background = if this happens make sure you know what happen, it could be a false signal or bullish continual pattern
C. Ideal Bearish :
- Near line 80 and pink / purple background = When Stoch RSI have the char R / H on lime color label, that's means divergence or hidden divergence for buy position, if you not see this label that's means just a standard confirmation for sell position.
D. Not an Ideal Bearish:
- Near line 20 and pink / purple background = if this happens make sure you know what happen, it could be a false signal or bearish continual pattern
E. The Beginning of Reversal (from BEARISH to BULLISH) :
- When Stoch RSI line shaping GREEN position is near 20.
- MACD lines still PINK, position lines is UNDER the HISTOGRAM, but the HISTOGRAM start to SHAPE FALL PINK (light pink) and the BACKGROUND still PINK / PURPLE.
- Position CANDLES NEAR BLUE line, NEAR PURPLE CLOUD, and lagging span (red line) STILL ON the area candle. (it used to be confirmed with the golden moment).
F. The Beginning of Reversal (from BULLISH to BEARISH) :
- When Stoch RSI line shaping PINK position is near 80.
- MACD lines still GREEN, position lines is ABOVE the HISTOGRAM, but the HISTOGRAM start to SHAPE FALL GREEN (light green) and the BACKGROUND still TEAL / GREEN.
- Position CANDLES NEAR WHITE line, NEAR TEAL CLOUD, and lagging span (red line) STILL ON the area candle. (it used to be confirmed with the golden moment).
G. False Signals, or It could be a Golden Moment (better to see it on TF 15 or bigger):
- Near line 20 or 80 and yellow background = When Stoch RSI have the char R / H on color label, that's means divergence or hidden divergence for buy / sell position, if you not see this label that's means just a standard confirmation for buy / sell depends on where the Stoch RSI line if near 20 that's means buy, near 80 means sell
>> How to OPEN position:
A. Bullish
1. Trendlines Boll Ichi Crypto by Gammaprod
- The candles above the green cloud.
- Lagging span (red line) above the candles.
- then open buy near yellow line (the first option) / blue line (the second option) (always confirm the position with two other indicators below).
2. Stoch RSI Divs Zone Crypto by Gammaprod
- Teal or Green background.
- The lines is shaping green.
- Better if on the bottom (at a range 20).
3. MACD Volume Crypto by Gammaprod
- Teal or Green background.
- The lines is shaped or shaping green.
- Better if at the green histogram.
B. Bearish
1. Trendlines Boll Ichi Crypto by Gammaprod
- The candles below the purple cloud.
- Lagging span (red line) below the candles.
- then open buy near yellow line (the first option) / white line (the second option) (always confirm the position with two other indicators below).
2. Stoch RSI Divs Zone Crypto by Gammaprod
- Pink or purple background.
- The lines are shaping pink.
- Better if the line on the top (at a range 80).
3. MACD Volume Crypto by Gammaprod
- Pink or purple background.
- The lines are shaped or shaping green.
- Better if at the pink histogram.
C. Consolidation
1. Trendlines Boll Ichi Crypto by Gammaprod
- The candles on the cloud (green or purple).
- Lagging span (red line) on the candles.
- then open buy near the white or blue line (always confirm the position with two other indicators below).
2. Stoch RSI Divs Zone Crypto by Gammaprod
- Mix background specially on a timeframe 15m or more.
- The line move fast up and down.
- Better if on the bottom or the top of the lines (at a range 20 or 80).
3. MACD Volume Crypto by Gammaprod
- Changing the background.
- The line is near the middle line.
- Have small Histogram.
>> The secret ingridient is comparing the timeframe :
The example scalping (Timeframe 1m, 5m and 15m)
- TF 1m is for making an open position.
- TF 5m is for making a judgement of the trend market.
- TF 15m is to confirm that judgement from TF 5m, be careful if it not similar then it used to be a consolidation or the beginning of the reversal.
There's a lot a way to open the position than above information that i gave it to you, but consider there are a limit char on this column, I hope it will help your trading and make a more profit on it.

Stoch RSI, Div, Zone S3 by Gammaprod>> How to use this indicator :
1. Set your teadingview theme to dark theme.
2. My indicator is valid for forex, stock and but more valid for crypto.
3. Use three timeframe for more validation (choose between those, that fit to your trading style) :
- Timeframe 1m, 5m, and 15m for Scalping
- Timeframe 30m, 1h and 4h for Intraday
- Timeframe 4h, 1D and 1W for Swing Trading
4 . Always use THREE INDICATORS FROM GAMMAPROD, those three indicators is back to back each other, by the way, I only made those three indicators only (for now) :
- Trendlines Boll Ichi Crypto by Gammaprod
- Stoch RSI Divs Zone Crypto by Gammaprod
- MACD Volume Crypto by Gammaprod
>> How to setting :
1. Trendlines Boll Ichi Crypto by Gammaprod
A. Support and Resistence
- Well if you familiar with this indicator you can add it, but recommended for Timeframe 30m or more
B. Trendlines Primary or Trendlines Secondary
- Timeframe 1m you DON'T NEED Trendlines Primary or Trendlines Secondary
- Timeframe 5m you DON'T NEED Trendlines Secondary, but you CAN ADD Trendlines Primary if you fell it helpful (for me, it is helpful to find where the candles start or the end trend or a consolidation or where the candles will surpass a resistance or a support).
- Timeframe 15m you DON'T NEED Trendlines Secondary, DEFENITELY add Trendlines Primary it will help to find where the candles stop or a consolidation or where the candles will surpass a resistance or a support).
- Timeframe 30m or more, DEFENITELY NEED BOTH Trendlines Primary and Secondary Trendlines, it will help to find where the candle stop or consolidation or where the candle will surpass a resistance or support).
C. Bolinger, Ichimoku Cloud and Lagging Span
- Please DON'T CHANGE IT at all, it's really helpful to know when and where to make an entry decesion or a trend or a consolidation, if you don't understand how to read it, you better to learn it first (on "how to read" section and "How to OPEN position" the section below)
2. Stoch RSI Divs Zone Crypto by Gammaprod (DON'T CHANGE IT)
3. MACD Volume Crypto by Gammaprod (DON'T CHANGE IT)
>> How to read :
1. Sell or Buy Priority :
A. Buy Priority
- Color background on macd and stoch rsi is pink or purple sell is the priority, (if you're not sure to buy, just wait until the best moment to sell)
B. Buy Priority
- Color background on macd and stoch rsi Teal or light green buy is the priority, (if you're not sure to sell, just wait until the best moment to buy)
C. Indecision / Golden Moment
- Color background on stoch rsi yellow is indecision / golden moment of reversal pattern (wait until it formed background only on Stoch RSI), please becareful at this moment.
2. Trend / Consolidation :
A. BULLISH trend
- When Stoch RSI and MACD have teal or light green background that's means BULLISH trend, better to confirm by the candle is above green cloud and lagging span (red line) is also above the candle.
B. BEARISH trend
- When Stoch RSI and MACD have the Pink or purple background that's means BEARISH trend, better to confirm by the candle is above purple cloud and lagging span (red line) is also below the candle.
C. CONSOLIDATION
- When Stoch RSI have the mix background that's means CONSOLIDATION, better to confirm by the candle is in or near to green / purple cloud and lagging span (red line) is also on the candle.
3. Special Mark
A. Ideal Bullish :
- Near line 20 and green / teal background = When Stoch RSI have the char R / H on lime color label, that's means divergence or hidden divergence for buy position, if you not see this label that's means just a standard confirmation for buy
B. Not an Ideal Bullish :
- Near line 80 and green / teal background = if this happens make sure you know what happen, it could be a false signal or bullish continual pattern
C. Ideal Bearish :
- Near line 80 and pink / purple background = When Stoch RSI have the char R / H on lime color label, that's means divergence or hidden divergence for buy position, if you not see this label that's means just a standard confirmation for sell position.
D. Not an Ideal Bearish:
- Near line 20 and pink / purple background = if this happens make sure you know what happen, it could be a false signal or bearish continual pattern
E. The Beginning of Reversal (from BEARISH to BULLISH) :
- When Stoch RSI line shaping GREEN position is near 20.
- MACD lines still PINK, position lines is UNDER the HISTOGRAM, but the HISTOGRAM start to SHAPE FALL PINK (light pink) and the BACKGROUND still PINK / PURPLE.
- Position CANDLES NEAR BLUE line, NEAR PURPLE CLOUD, and lagging span (red line) STILL ON the area candle. (it used to be confirmed with the golden moment).
F. The Beginning of Reversal (from BULLISH to BEARISH) :
- When Stoch RSI line shaping PINK position is near 80.
- MACD lines still GREEN, position lines is ABOVE the HISTOGRAM, but the HISTOGRAM start to SHAPE FALL GREEN (light green) and the BACKGROUND still TEAL / GREEN.
- Position CANDLES NEAR WHITE line, NEAR TEAL CLOUD, and lagging span (red line) STILL ON the area candle. (it used to be confirmed with the golden moment).
G. False Signals, or It could be a Golden Moment (better to see it on TF 15 or bigger):
- Near line 20 or 80 and yellow background = When Stoch RSI have the char R / H on color label, that's means divergence or hidden divergence for buy / sell position, if you not see this label that's means just a standard confirmation for buy / sell depends on where the Stoch RSI line if near 20 that's means buy, near 80 means sell
>> How to OPEN position:
A. Bullish
1. Trendlines Boll Ichi Crypto by Gammaprod
- The candles above the green cloud.
- Lagging span (red line) above the candles.
- then open buy near yellow line (the first option) / blue line (the second option) (always confirm the position with two other indicators below).
2. Stoch RSI Divs Zone Crypto by Gammaprod
- Teal or Green background.
- The lines is shaping green.
- Better if on the bottom (at a range 20).
3. MACD Volume Crypto by Gammaprod
- Teal or Green background.
- The lines is shaped or shaping green.
- Better if at the green histogram.
B. Bearish
1. Trendlines Boll Ichi Crypto by Gammaprod
- The candles below the purple cloud.
- Lagging span (red line) below the candles.
- then open buy near yellow line (the first option) / white line (the second option) (always confirm the position with two other indicators below).
2. Stoch RSI Divs Zone Crypto by Gammaprod
- Pink or purple background.
- The lines are shaping pink.
- Better if the line on the top (at a range 80).
3. MACD Volume Crypto by Gammaprod
- Pink or purple background.
- The lines are shaped or shaping green.
- Better if at the pink histogram.
C. Consolidation
1. Trendlines Boll Ichi Crypto by Gammaprod
- The candles on the cloud (green or purple).
- Lagging span (red line) on the candles.
- then open buy near the white or blue line (always confirm the position with two other indicators below).
2. Stoch RSI Divs Zone Crypto by Gammaprod
- Mix background specially on a timeframe 15m or more.
- The line move fast up and down.
- Better if on the bottom or the top of the lines (at a range 20 or 80).
3. MACD Volume Crypto by Gammaprod
- Changing the background.
- The line is near the middle line.
- Have small Histogram.
>> The secret ingridient is comparing the timeframe :
The example scalping (Timeframe 1m, 5m and 15m)
- TF 1m is for making an open position.
- TF 5m is for making a judgement of the trend market.
- TF 15m is to confirm that judgement from TF 5m, be careful if it not similar then it used to be a consolidation or the beginning of the reversal.
There's a lot a way to open the position than above information that i gave it to you, but consider there are a limit char on this column, I hope it will help your trading and make a more profit on it.

[blackcat] L2 Hann Ehanced DMILevel: 2
Background
Among the many indicators, it can be said that DMI is the only "super turning" indicator. This indicator can alone send out risk warning signals when extreme market conditions occur in the stock market, helping us to solve some problems.
If we can operate according to the instructions of DMI, firstly, we can avoid the mistake of buying stocks at the head. Secondly, in the process of falling fear of the market, we can follow the direction signal sent by DMI and catch every time on the way down. Opportunity to rebound to unwind.
If you look at the diagram of the DMI, you will think it is very complicated, because there are four lines in its diagram, and they are intertwined, and it is difficult to distinguish the complex signals in it. But don't worry about its complex structure, we will fully dissect this indicator.
Function
These four lines are: PDI, MDI, ADX and ADXR. The scale of the table is from 0-100, which means from very weak to very strong. The PDI curve and MDI curve on some software are called +DI curve and -DI curve , all have the same meaning.
PDI: Represents the position of multiple parties in the market.
In market movements, the higher the PDI, the stronger the current market. On the contrary, it is a weak market. The A-share market is easy to go to extremes. Therefore, we can see that in the past A-share market, the PDI sometimes fell to near zero, and at this time, it often indicated that a rebound and uptrend was about to start.
MDI: Represents the position of the bears in the market.
In the market movement, the higher the MDI goes, the weaker the current market is, and vice versa, it is a strong market. Before a big bull market comes, we can see the MDI drop to a position close to zero, and at this time, the bears in the market have no power to fight back.
The relationship between PDI and MDI:
In the operation of the market, PDI and MDI are intertwined with each other. If the PDI is above the MDI, the market at this time is a strong market. The MDI is above the PDI, which is a bear market. The closer the distance between the two, the market is in a stalemate of consolidation. On the contrary, the further apart the two lines are, the more obvious the unilateral nature of the market is, whether it is a bull market or a bear market. The so-called unilateral market means that there is no midway adjustment when it rises, and there is no rebound correction when it falls.
ADX: Fast steering pullback.
The difference between ADX and other analysis indicators is that whether it is rising or falling, as long as there is a unilateral market, it runs upwards, not like other indicators, the strong market runs upwards and the weak market runs downwards.
The thread is almost entwined with PDI and MDI in general market movement, which makes no sense at this time. However, once the market breaks out of the market and starts to go to extremes, whether the market is rising or falling, ADX will start to run upwards. At this time, ADX has a clear meaning, because DMI has begun to issue early warning of impending turn!
ADXR: slow pull back.
This line is matched to ADX and is a moving average of ADX values. When ADX goes up, ADXR goes up with it, just slower.
When a round of rapid decline ends, it usually needs to be corrected by a rebound, and ADX will take the lead in turning up. Once it crosses with ADXR, it is regarded as an effective breakthrough.
Numerical division. I set an input threshold for HEDMI, and users can set the optimal threshold to buy and sell according to different TFs.
When PDI crosses the threshold, no matter how strong the bull market is, we must beware of risks from happening at any time.
In order to distinguish more clearly, I slightly modified the formula of the system, and when this happens, the indicator will issue a green warning label, so as to avoid risks in time.
Comprehensive use of four lines:
If the four lines in the steering indicator DMI are intertwined below 50, it usually means that the market is in a state of mild consolidation at this time. The DMI indicator at this time is useless because it does not generate a strong pullback force. Don't worry about an unexpected turnaround in the market. As for the consolidation, it's not a turnaround, it's a breakout.
When PDI and MDI gradually separate, at this time, ADX and ADXR will also rise. At this time, the DIM that is usually messy like twine will be clearly separated. When rising, PDI rises along with ADX and ADXR, while MDI sinks weakly. On the contrary, when the market starts to fall, MDI will rise along with ADX and ADXR, and PDI will sink helplessly. At this time, the DMI will be like a "tiger's mouth", gradually opening its bloody mouth. The bigger the opening, the more lethal the bite.
Here comes a tactic, or technical trend, called double hooves, that is, PDI and MDI split, ADX and ADXR upward to produce golden forks, PDI and MDI are like the double front hooves of a horse, ADX and ADXR The golden fork is like the rear hooves of a steed ready to take off, and this trend of the four lines is like the four legs of a steed that is about to run.
If you think it is too complicated to look at DMI like this, then I can tell you the easiest way to judge, that is, just look at the PDI line. When the PDI line falls below 10, boldly buy the dip, because it is a dip, so you need to calculate the rebound At this time, combined with the golden section theory I often talk about, you can easily find the selling point by making the golden section of the downward trend for the previous trend.
This kind of bottom-hunting method uses the golden section theory, and basically there will be no losses. Remember that one thing is not to be greedy and strictly enforce discipline. This is bottom-hunting, and advancing with both hooves is chasing up. The two styles are different, and the operation styles are different. You also need to explore more in actual combat. Any kind of trick, if you practice it proficiently, it is a unique trick.
Remark
Hanning Window Enhanced DMI
Free and Open Source Indicator

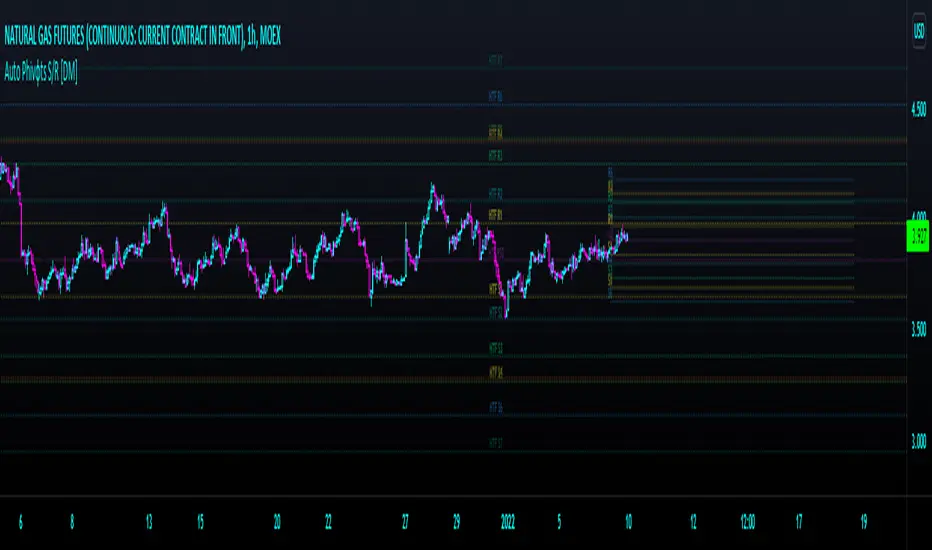
Auto Phivots PP S/R Log /Lin V2 [DM]Greetings, I cover version two since the code has had great changes.
This script has two time frames with a separate symbol from the main window.
Alerts for the two different configurable time frames.
Van use for a big ranges or small and Log Scales.
The colors, extensions, thickness, style of the lines and the labels are completely configurable.
With a few small adjustments it can be used in a separate window with another symbol
Enjoy BigfOOts
Pythagorean Means of Moving AveragesDESCRIPTION
Pythagorean Means of Moving Averages
1. Calculates a set of moving averages for high, low, close, open and typical prices, each at multiple periods.
Period values follow the Fibonacci sequence.
The "short" set includes moving average having the following periods: 5, 8, 13, 21, 34, 55, 89, 144, 233, 377.
The "mid" set includes moving average having the following periods: 5, 8, 13, 21, 34, 55, 89, 144, 233, 377, 610, 987, 1597.
The "long" set includes moving average having the following periods: 5, 8, 13, 21, 34, 55, 89, 144, 233, 377, 610, 987, 1597, 2584, 4181.
2. User selects the type of moving average: SMA, EMA, HMA, RMA, WMA, VWMA.
3. Calculates the mean of each set of moving averages.
4. User selects the type of mean to be calculated: 1) arithmetic, 2) geometric, 3) harmonic, 4) quadratic, 5) cubic. Multiple mean calculations may be displayed simultaneously, allowing for comparison.
5. Plots the mean for high, low, close, open, and typical prices.
6. User selects which plots to display: 1) high and low prices, 2) close prices, 3) open prices, and/or 4) typical prices.
7. Calculates and plots a vertical deviation from an origin mean--the mean from which the deviation is measured.
8. Deviation = origin mean x a x b^(x/y)/c.
9. User selects the deviation origin mean: 1) high and low prices plot, 2) close prices plot, or 3) typical prices plot.
10. User defines deviation variables a, b, c, x and y.
Examples of deviation:
a) Percent of the mean = 1.414213562 = 2^(1/2) = Pythagoras's constant (default).
b) Percent of the mean = 0.7071067812 = = = sin 45˚ = cos 45˚.
11. Displaces the plots horizontally +/- by a user defined number of periods.
PURPOSE
1. Identify price trends and potential levels of support and resistance.
CREDITS
1. "Fibonacci Moving Average" by Sofien Kaabar: two plots, each an arithmetic mean of EMAs of 1) high prices and 2) low prices, with periods 5, 8, 13, 21, 34, 55, 89, 144, 233, 377, 610, 987, 1597, 2584, 4181.
2. "Solarized" color scheme by Ethan Schoonover.

vol_premiaThis script shows the volatility risk premium for several instruments. The premium is simply "IV30 - RV20". Although Tradingview doesn't provide options prices, CBOE publishes 30-day implied volatilities for many instruments (most of which are VIX variations). CBOE calculates these in a standard way, weighting at- and out-of-the-money IVs for options that expire in 30 days, on average. For realized volatility, I used the standard deviation of log returns. Since there are twenty trading periods in 30 calendar days, IV30 can be compared to RV20. The "premium" is the difference, which reflects market participants' expectation for how much upcoming volatility will over- or under-shoot recent volatility.
The script loads pretty slow since there are lots of symbols, so feel free to delete the ones you don't care about. Hopefully the code is straightforward enough. I won't list the meaning of every symbols here, since I might change them later, but you can type them into tradingview for data, and read about their volatility index on CBOE's website. Some of the more well-known ones are:
ES: S&P futures, which I prefer to the SPX index). Its implied volatility is VIX.
USO: the oil ETF representing WTI future prices. Its IV is OVX.
GDX: the gold miner's ETF, which is usually more volatile than gold. Its IV is VXGDX.
FXI: a china ETF, whose volatility is VXFXI.
And so on. In addition to the premium, the "percentile" column shows where this premium ranks among the previous 252 trading days. 100 = the highest premium, 0 = the lowest premium.

MathConstantsLibrary "MathConstants"
Mathematical Constants
E() The number e
Log2E() The number log (e)
Log10E() The number log (e)
Ln2() The number log (2)
Ln10() The number log (10)
LnPi() The number log (pi)
Ln2PiOver2() The number log (2*pi)/2
InvE() The number 1/e
SqrtE() The number sqrt(e)
Sqrt2() The number sqrt(2)
Sqrt3() The number sqrt(3)
Sqrt1Over2() The number sqrt(1/2) = 1/sqrt(2) = sqrt(2)/2
HalfSqrt3() The number sqrt(3)/2
Pi() The number pi
Pi2() The number pi*2
PiOver2() The number pi/2
Pi3Over2() The number pi*3/2
PiOver4() The number pi/4
SqrtPi() The number sqrt(pi)
Sqrt2Pi() The number sqrt(2pi)
SqrtPiOver2() The number sqrt(pi/2)
Sqrt2PiE() The number sqrt(2*pi*e)
LogSqrt2Pi() The number log(sqrt(2*pi))
LogSqrt2PiE() The number log(sqrt(2*pi*e))
LogTwoSqrtEOverPi() The number log(2 * sqrt(e / pi))
InvPi() The number 1/pi
TwoInvPi() The number 2/pi
InvSqrtPi() The number 1/sqrt(pi)
InvSqrt2Pi() The number 1/sqrt(2pi)
TwoInvSqrtPi() The number 2/sqrt(pi)
TwoSqrtEOverPi() The number 2 * sqrt(e / pi)
Degree() The number (pi)/180 - factor to convert from Degree (deg) to Radians (rad).
Grad() The number (pi)/200 - factor to convert from NewGrad (grad) to Radians (rad).
PowerDecibel() The number ln(10)/20 - factor to convert from Power Decibel (dB) to Neper (Np). Use this version when the Decibel represent a power gain but the compared values are not powers (e.g. amplitude, current, voltage).
NeutralDecibel() The number ln(10)/10 - factor to convert from Neutral Decibel (dB) to Neper (Np). Use this version when either both or neither of the Decibel and the compared values represent powers.
Catalan() The Catalan constant
Sum(k=0 -> inf){ (-1)^k/(2*k + 1)2 }
EulerMascheroni() The Euler-Mascheroni constant
lim(n -> inf){ Sum(k=1 -> n) { 1/k - log(n) } }
GoldenRatio() The number (1+sqrt(5))/2, also known as the golden ratio
Glaisher() The Glaisher constant
e^(1/12 - Zeta(-1))
Khinchin() The Khinchin constant
prod(k=1 -> inf){1+1/(k*(k+2))^log(k,2)}

Long only EMA CROSS 8/50/200 BacktestImprove EMA CROSS 8/50/200 with adjustable Exit EMA Level, and can open trade only when above EMA200

Random Entries Work!" tHe MaRkEtS aRe RaNdOm ", say moron academics.
The purpose of this study is to show that most markets are NOT random! Most markets show a clear bias where we can make such easy money, that a random number generator can do it.
=== HOW THE INDICATOR WORKS ===
The study will randomly enter the market
The study will randomly exit the market if in a trade
You can choose a Long Only, Short Only, or Bidirectional strategy
=== DEFAULT VALUES AND THEIR LOGIC ===
Percent Chance to Enter Per Bar: 10%
Percent Chance to Exit Per Bar: 3%
Direction: Long Only
Commission: 0
Each bar has a 10% chance to enter the market. Each bar has a 3% to exit the market . It will only enter long.
I included zero commission for simplification. It's a good exercise to include a commission/slippage to see just how much trading fees take from you.
=== TIPS ===
Increasing "Percent Chance to Exit" will shorten the time in a trade. You can see the "Avg # Bars In Trade" go down as you increase. If "Percent Chance to Exit" is too high, the study won't be in the market long enough to catch any movement, possibly exiting on the same bar most of the time.
If you're getting the red screen, that means the strategy lost so much money it went broke. Try reducing the percent equity on the Properties tab.
Switch the start year to avoid/minimize black swan events like the covid drop in 2020.
=== FINDINGS ===
Most markets lose money with a "Random" direction strategy.
Most markets lose ALL money with a "Short Only" strategy.
Most markets make money with a "Long Only" strategy.
Try this strategy on: Bitcoin (BTCUSD) and the NASDAQ (QQQ).
There are two popular memes right now: "Bitcoin to the moon" and "Stocks only go up". Both are seemingly true. Bitcoin was the best performing asset of the 2010's, gaining several billion percent in gains. The stock market is on a 100 year long uptrend. Why? BECAUSE FIAT CURRENCIES ALWAYS GO DOWN! This is inflation. If we measure the market in terms of others assets instead of fiat, the Long Only strategy doesn't work anymore (or works less well).
Try this strategy on: Bitcoin/GLD (BTCUSD/GLD), the Eurodollar (EURUSD), and the S&P 500 measured in gold (SPY/GLD).
Bitcoin measured in gold (BTCUSD/GLD) still works with a Long Only strategy because Bitcoin increased in value over both USD and gold.
The Eurodollar (EURUSD) generally loses money no matter what, especially if you add any commission. This makes sense as they are both fiat currencies with similar inflation schedules.
Gold and the S&P 500 have gained roughly the same amount since ~2000. Some years will show better results for a long strategy, while others will favor a short strategy. Now look at just SPY or GLD (which are both measured in USD by default!) and you'll see the same trend again: a Long Only strategy crushes even when entering and exiting randomly.
=== " JUST TELL ME WHAT TO DO, YOU NERD! " ===
Bulls always win and Bears always lose because fiat currencies go to zero.
You're not underperforming a random number generator, are you?

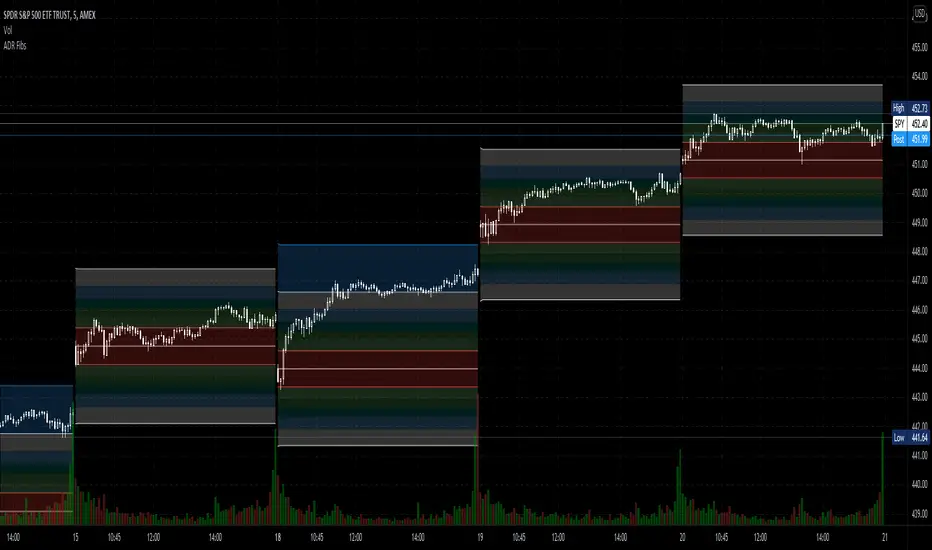
Average Daily Range Fibonacci LevelsThe Average Daily Range is a simple concept, calculated as the difference between daily highs and lows averaged over some period. This indicator uses that range in conjunction with Fibonacci ratios to create zones centered on the day's open that tends to act as areas of support and resistance.
The thicker White lines are the ADR levels; all other lines are the same value adjusted by the various Fibonacci values.
A simpler version of this concept can be seen in my other script, Average Daily Range Zones, which does not include the Fibonacci ratio zones.
Thanks to @Hank Hill for the original idea and TV for the feedback and support on the use of the security() function.
Also thanks to @GoldenCross for the Fibonacci obsession.
CPR, Camarilla & Moving AverageThis script is created primarily for Intraday trading but can also be used for short and long term trading. This is a combination of Central Pivot Range (CPR), Moving Averages and Camarilla Pivot levels (with inner levels). This helps you to combine the strategies of CPR and Moving Averages to identify the best trading opportunities with greater edge. Central Pivot Range and Camarilla pivots are taken from PivotBoss by Franc Ochoa.
Key features:
# Daily CPR levels
# Weekly CPR levels
# Monthly CPR levels
# Previous Day High and Lows
# Previous Week Highs and Lows
# Previous Month Highs and Lows
# Camarilla Pivots with inner Levels
# CPR Levels for the next Day, Week and Month
# 5 Simple moving averages and 5 Exponential Moving Averages
What separates this script from other scripts with CPR and Moving averages?
# One of the few indicators (if not the only one) which combines the 2 types of Moving Averages, CPR and also Camarilla Pivots.
# CPR Levels for not just the next Day, but for next Week(Weekly CPR) and Month(Monthly CPR) also.
# Hide the previous day's levels according to your wish. This is the most unique feature of this indicator. You can set the number of Daily CPR levels you want to load in the chart. This is not just for the Daily CPR but also for the Weekly and Monthly CPR also. This makes the chart less cluttered and prevents the candles from getting buried in the indicators. Please notice how the previous day's CPR levels are hidden in the displayed demo chart on the script page. In the chart, only one trading day's data is shown(by default).
# This script is OPEN SOURCE.
Strategies :
For CPR & Camarilla Strategies for intraday trading and swing trading refer to the book 'Secrets of a Pivot Boss: Revealing Proven Methods for Profiting in the Market' by Franklin O. Ochoa.
Moving averages strategies :
Moving averages can be combined and also used individually for several strategies
* 9 EMA can be used as trailing stop loss for strong moving trends that helps you to catch big moves.
* 20sma can be used not just trailing stop loss but also for taking re-entry to the trend.
* Golden cross - The golden cross occurs when a short-term moving average crosses over a major long-term moving average to the upside. This indicates a bullish turn in the market. Eg: 50 SMA cuts 200 SMA from below.
* Death Cross - The death cross occurs when the short term moving average crosses the long-term average from above. This indicates a bearish turn in the market. Eg: 50 SMA cuts 200 SMA from above.
* When 20 SMA is above 50 SMA and 20 SMA and 50 SMA are angling up like parallel lines, then it denotes bullish strength. If this happens right after Golden Cross, big moves to the upside can be expected.
* When 20 SMA is below 50 SMA and 20 SMA and 50 SMA are angling down like parallel lines, then it denotes bearish strength. If this happens right after Death Cross, big moves to the downside can be expected.
* When 20SMA and 50 SMA are going flat and crossing each other, then it denotes sideways sentiment.
Moving average strategies are taken from the book 'How to Make Money in Intraday Trading' by Ashwani Gujral. For learning more about how to combine CPR and Moving averages in your trading please refer to this book.

Beam Bands + Fibonacci LevelsThis indicator calculates the Fibonacci retracement levels based on beam bands. As you can see the price very often reacts to these levels.

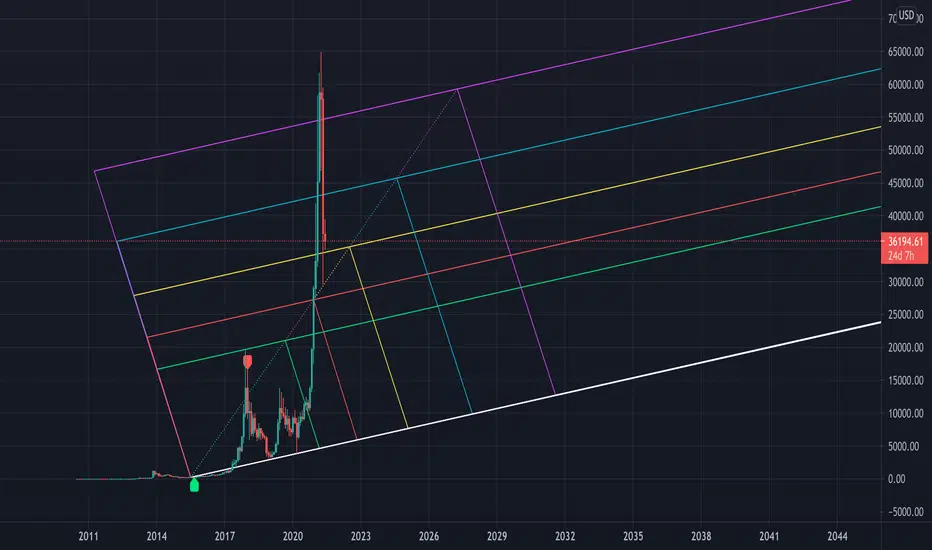
Euler Cubes - CubᵋI give you the "Euler Cubes", inspired by the mathematical number 'e' (Euler's number).
It is suggested (fibonacci ratios analogy) that price/e ratio can give Support/Resistance area's.
The first cube is made by a low/high of choice, for example:
You set the 'source low'/'source high' in position:
Then you choose the 'e ratio' (x times 'e')
This multiplies the distance 'high-low' times '0.271828' times 'the set number' .
For example, choosing 5 gives 5 x 0.271828 = 1.35914, the distance 'high-low' hereby multiplied by 1.35914, the following cubes multiply the previous distance by 1.35914.
(Settings below 5 will give cubes smaller than the 'high-low' distance)
In the case of x times 'e' = 5:
You can extend the lines:
Now you can give it an angle:
Do mind, using it over very little bars and using an angle can cause some lines to not align as intended, because for now, it is not possible to plot in between bars.
There are also 'Euler' SMA and EMA available with following length's:
27, 54, 82,109, 136, 163, 190 and 217
Cheers!
Pi Cycle Top IndicatorIndicator Overview
The Pi Cycle Top Indicator has historically been effective in picking out the timing of market cycle highs to within 3 days.
It uses the 111 day moving average (111DMA) and a newly created multiple of the 350 day moving average, the 350DMA x 2.
Note: The multiple is of the price values of the 350DMA not the number of days.
For the past three market cycles, when the 111DMA moves up and crosses the 350DMA x 2 we see that it coincides with the price of Bitcoin peaking.
It is also interesting to note that 350 / 111 is 3.153, which is very close to Pi = 3.142. In fact, it is the closest we can get to Pi when dividing 350 by another whole number.
It once again demonstrates the cyclical nature of Bitcoin price action over long time frames. Though in this instance it does so with a high degree of accuracy over the past 7 years.
How It Can Be Used
Pi Cycle Top is useful to indicate when the market is very overheated. So overheated that the shorter term moving average, which is the 111 day moving average, has reached a x2 multiple of the 350 day moving average. Historically it has proved advantageous to sell Bitcoin at this time in Bitcoin's price cycles.
Created By
Philip Swift

Multi Moving Average Crossing (by Coinrule)Moving Averages are among the most common trading indicators. They are straightforward to interpret and effective to use.
One of the limitations of using moving averages is they can provide buy and sell signals with a relatively high lag , making it very difficult to spot the lows and tops of the trend.
Moving averages calculated with a low number of periods like the MA9 (the average of the previous nine price periods) react very fast to price moves providing prompt signals. On the other side, more signals may end up with more false-signals and more trades in a loss.
On the contrary, moving averages calculated with a higher number of periods like the MA100 (which considers the previous one hundred price periods) give more reliable signals, but with a delay.
A system catching the crossing of the MA50 over the MA100 is a good compromise for successful long-term strategies. It provides, on average, reliable buy signals.
The Multi Moving Average Crossing Strategy tries to optimize the exit without waiting for the same opposite crossing (MA50 below MA100). It uses the MA9 crossing below the MA50, instead, to spot a better time for selling.
The setup is as follows.
BUY when the Moving Average 50 crosses above the Moving Average 100
SELL when the Moving Average 9 crosses below the Moving Average 50
The higher is the time frame to calculate the Moving Averages, the better is the overall performance of the strategy. The 4-hour (or 6-hour) time frame seems to be the best, even if it results in fewer trades. If you want to trade more still with good results, the 1-hour time is a good compromise.
Advantages of the strategy
This strategy seeks to catch those that are more likely relevant uptrends and close the trade relatively quickly. More trades mean more opportunities. This is especially effective if you run the strategy on all the available coins on the market, as you could do with Coinrule.
Generally, a Multi Moving Averages approach beats the classic crossing strategy involving only two Moving Averages. We backtested a sample of twenty trading pairs to assess the benefits empirically.
The results show that the Multi Moving Average Strategy
outperforms 13 out of 20 times
has 95% higher average return
has 67% higher median return
The strategy assumes each order to trade 30% of the available capital and opens a trade at a time. A trading fee of 0.1% is taken into account.

Floor Pivots With CPR and Camarilla 3 LevelsThis script plots floor pivots with the central pivot range and camarilla R3/S3 pivots, to spot with ease the Golden Pivot Zone (GPZ). As described in the book *Secret of a pivot Boss* by Franklin Ochoa, the Golden Pivot Zone occurs when R3 or S3 pivot from the Camarilla Equation or from lies within the central pivot range. This combination can be simply profitable.
A bearish GPZ occurs when R3 of the Camarilla Equation is mixed within the central pivot range, therefore we should look for sells in that zone.
A bullish GPZ occurs when S3 of the Camarilla Equation is mixed within the central pivot range, therefore we should look for buys in that zone.
Here are some examples on Gold
Good luck !
Ps* i got part of the code from @cristian.d script

EMA Cross LevelsCalculates fast and slow moving averages of lengths(inputs= 'n_fast', 'n_slow').
Plots the price level of the most recent cross. If bullish cross (fast crosses up over slow), color = green, and color=red if cross was bearish.
