All in one [Liubam]Hey tradingviewers!
This is an All in one Indicator for those who can't add too many indicators on your charts. Inspired by ©LonesomeTheBlue "Indicators all in one" script. I found a lot of very interesting scripts on the public library and I decided to make a tool with some of the greatest IMO, adding some modifications to improve the indicators. With this tool you can plot 1 of 6 different indicators by selecting it from a drop-down list (on the indicator settings).
All the credit goes to it's respective owners (taggeds).
THIS INDICATOR INCLUDES:
1. Classic RSI with some OB/OS tools:
The relative strength index (RSI) is a popular momentum indicator displayed as an oscillator (a line graph that moves between two extremes) that measures the magnitude of recent price changes to evaluate overbought or oversold conditions, in other words it shows signals about bullish and bearish price momentum. I added some visual improvements to help you finding the OB/OS zones.
2. Classic CCI with some OB/OS tools.
The Commodity Channel Index (CCI) is a momentum-based oscillator used as market indicator to help determine market movements that may indicate buying or selling. Added some vistual improvements to the chart.
3. ADX and DMI oscillator with the keylevel coded by @console:
The Average Directional Index (ADX) is non-directional indicator used by some traders to determine the strength of a trend. When the ADX line is rising (Above the keylevel) trend strength is increasing, and the price moves in the direction of the trend whether up or down. Otherwise, low ADX (Below the keylevel) is usually a sign of accumulation or distribution (Range). Non-trending doesn't mean the price isn't moving. It may not be, but the price could also be making a trend change or is too volatile for a clear direction to be present.
Suggested settings of the keylevel is 23-25.... REMEMBER: The trend may be your friend.
4. MFI
The Money Flow Index (MFI) is a technical oscillator for identifying overbought or oversold signals in an asset. Unlike conventional oscillators such as the RSI, the Money Flow Index incorporates both price and volume data, as opposed to just price. It can also be used to spot divergences which warn of a trend change in price.
5. Stochastic:
A stochastic oscillator is range-bound, meaning it is always between 0 and 100. This makes it a useful indicator of overbought and oversold conditions. Traditionally, readings over 80 are considered in the overbought range, and readings under 20 are considered oversold. However, these are not always indicative of impending reversal; very strong trends can maintain overbought or oversold conditions for an extended period. Instead, traders should look to changes in the stochastic oscillator for clues about future trend shifts. I added some features for this popular indicator to show the stochastic crosses.
6. The famous Squeeze momentum Indicator made by @Lazybear:
This is derivate of John Carter's "TTM Squeeze" volatility indicator and its very strong when using with trending indicator such a ADX. Black line (or no-line) on the midline show that the market just entered a squeeze ( Bollinger Bands are with in Keltner Channel). This signifies low volatility , market preparing itself for an explosive move (up or down). Gray line signify "Squeeze release". Mr.Carter suggests waiting till the gray line after a blackline, and taking a position in the direction of the momentum (for ex., if momentum value is above zero, go long). Exit the position when the momentum changes.
------------------------------------------------------------------------------------------------------------------------------------------------------------------------------------------------------------------------------------------------
This script is source code protected, but you can add to your favorite list to use it. Also you can add twice to use 2 different indicators at the same time (E.g. Squeeze Momentum Indicator + ADX)
An additional indicator I made (MA Hunterz + InfoPanel) is needed to not miss good entry points.
Your valuable comment and feedback is much appreciated...
And remember indicators can be really helpfull but always use Price Action.
Cari dalam skrip untuk "LazyBear"

BOSCILLATOR. A BOSS OSCILLATORI would like to first say I do not the indicator pieces. Would like to personally give thanks and credit to @MarkBench for coding this indicator and helping to get my vision for this system finally able to be published and used by anyone. I would also like the thank @lazy bear and @ChrisMoody for their bringing the Firefly oscillator and the SCHAFF TREND and the PPO price percentage oscillator to trading view. and @scilentor for his version of Godmode with LSMA . Thanks to @Shizaru for bringing Frama moving average (which we have adopted into the PPO as one of the base selections for the first time, as well as the ALMA ). Divergences have also been added. and components of the firefly have been removed such as the histogram. I have added two oscillators in the picture. The bottom is the standard settings. The above is how I prefer mine to look after tweaking the settings.
Before I get into explaining how its used. I want to say all the indicators are open and none privately owned or at least owned by indivduals who brought them to trading view. Any due permission is granted at my disclocsure. I also want to say this is not your typical mashup of indicators as the is a very clear way to view and use this specifically. Also I want to say original tools from their original scripts are also improved. For example the PPO being used we have added the FRAMA and ALMA moving average basis option which it did not have before. And now everything has clear divergences and some other minor changers. but here are the rules and examples.
THE BOSCILLATOR - A MULTI-LEVEL CONFLUENCE/CONFIRMATION FILTER VISUALIZATION
Some shorthand
(Main oscillator - firefly)
(background wave thing - PPO )
(the red vertical up and down line with red and green dots - STC )
(the blue, yellow and red dots - warning dots)
WHO IS THIS INDICATOR FOR? - This indicator itself is not meant to be a signal giver to buy or sell right now even though it could be and some of the original scripts are used as such. This indicator is actually meant to be a VISUAL CONFIRMATION & FILTER for trades taken in other methods outside of this indicator. What are some of those methods that may benefit from having this? Pivot point traders, FIB traders, Bollinger band traders, Moving average traders.. just to name a few. This indicator itself is meant to in a quick glance allow the trade to see the condition of many different elements outside of the main price and chart, and determine if that trade looks like it has too much risk, or if that trade looks suitable. It also provides a series of confirmations that could be used for adding to a position at different levels at the trade's discretion.
OPTIMAL CONDITIONS FOR CONSIDERING A SHORT = The PPO is orange/red + the STC is at the TOP + the Firefly is above the midline. The warning dots are being printed at the top. There is regular or hidden bearish divergence present.
OPTIMAL CONDITIONS FOR CONSIDERING A LONG = The PPO is light/dark green + the STC is at the BOTTOM + the Firefly is below the midline. The warning dots are being printed at the bottom. There is regular or hidden bullish divergence present.
Triggers for scaling/adding into your position = Keeping in mind that this oscillator on its own is not meant to be the sole reason for taking a trade, here are some triggers you will see for getting into position (preferably with the optimal conditions being met) The firefly flips from a green line into a red slide and vise versa. The firefly crosses the midline up or down. The STC begins going up/down and triggers a green or red dot while crossing one of the levels at 20 or 80. The warning dots being made begin to be printed lower/higher than the dot before last. The PPO shift from one color to the next in the favored direction of the trade you wish to make.
Signs for taking profit and protecting your trade = The Dots begin to print, the PPO changes colors at the top or bottom. the STC arrived are the top.
FILTER SITUATIONS TO AVOID TRADES = Wise to not take a trade if the PPO and the firefly do not agree. For example - if the PPO is showing green yet the firefly is still red may be an indication that it is getting a bit late for you to enter the trade. Same with opposing divergences and warning dots contradicting the trade you are looking at. The STC being already on the bottom or top may be a small indication that trade may already have been a little too ripe, but on its own is not always the case.
When selecting the PPO settings and moving average you are going to want it to be in favor of what you are trying to accomplish.IF you are one low time frames and trying to swing or scalp trade... chances are you want a reactive MA setting that iss responsive. Iwould recommend the HULL, ALMA, TEMA DEMA. For the Higher time frame the EMA or the T3 WDma can be wuite patient and helpful for a constant reminder of caution
Some notes - for the swing and scalp trading... in my experience the PPO moving average basis sees more responsive changes with the FRAMA , ALMA , HULL settings. for entering a trade, at least a couple of your triggers being present increases the success rate by a lot.
This chart illustrates the usefullness of having a Zero lag function for the firefly. The firefly should not be taken for signals or trades itself. However it is the most precise finder of divergences within the system. It is aways good to flip on and off zero lag just to take a quick look for divergences you might have mixed.
In this chart illustrates the general visual look and order of events to guide you along your way. Starts with the PPO turning green or red or orange which is potentially time to get out of your current trade. Then it switched colors when reversal begins and that is when you want to at the same time see the STC, the firefly, and lower caution dots coming in around the same area (highlighted in blue squares). Now near the end you see a red box. This is a filter aspect. The PPO is green, yet the others are saying down/short. This does not mean it must be a long, however it is great warning to maybe avoid getting to bearish for the downside in that time. You want the PPO and line up with the others and it should be visually apparent that they all want to go the same way.
Here is a list of some key elements (before changes this script made) of parts this oscillator includes. My original publication of my oscillation setup was blocked by the mods here.. this one however includes a large variety of items that have been altered from their original formats and a well-explained trading system to use it with.
// Firefly
Firefly Oscillator
// PPO
PPO PercentileRank Mkt Tops & Bottoms (@PuppyTherapy)
// Divergence
Divergence Indicator (any oscillator)
// Godmode
Godmode3.2+LSMA
// Schaff
Schaff Trend Cycle
// Frama
(FRAMA) Fractal Adaptive Moving Average

Woodfield Edit on [LazyBear]I have added some coloring and flow changes which makes it easy to view the data points.

Squeeze Momentum Indicator v4_pine [By Lazy Bear]This is the famous Squeeze Momentum Indicator made by @LazyBear in v4 version if someone wants to test some strategies, as the original code was in v2 version the code converter couldn't convert to v4.

Profit Accumulator Heat MapHi Everyone
Happy to share this heat map packed full of indicators to make those trading decisions. There are a whole host of indicators including:
Inverse Fischer Transform
Moving Average Slope
EMA50 Crossover
Schaff Trend Cycle
MACD
RSI
Stochastic RSI
Moving Average Cross Over
Quantitative Qualitative Estimation
On Balance Volume
All of the indicators are customisable in the settings so you can adjust them to how you want.
I often find that the combination of MACD and QQE provide good early entry and exit signals.
Any comments or improvements then please feel free to get in touch.
Cheers
Mike
Big thanks go to @everget, @JustUncleL and @LazyBear for the use of their codes.


WaveTrend Oscillator v2 [Aspenforest]This is your regular WaveTrend Oscillator, which was originally scripted by LazyBear, but I updated the source code to Pine Script version 4, refactored the logic, and made the indicator more aesthetically pleasing.

Pip collector ModThis modification of LazyBear's popular script called Pip collector features custom signal generation and information section displaying elapsed bar time useful for timing trades.

[Zekis]Squeeze Momentum + IchimokuHi,
This is a strategy developed by @zsone, a strategy suitable mostly for altcoins (but not necessary).
The strategy is using the following indicators: Squeeze Momentum (LazyBear), two Ichimoku Clouds (one is MTF), daily EMA21 and EMA golden cross (optionally).
Setting should be used as default.
Rules for entries (scalping):
Go Long (green line on the histogram):
- use low time frames (3m, 5m, 15m)
- candle closes above the ichimoku cloud
- squeeze momentum, first grey cross on green histogram (2 ways):
1. histogram is green and have a black cross and later it turns to grey cross
2. the histogram is red with grey cross and it goes to green with grey cross without having a black cross, just directly goes green histogram with grey cross
- price is above the daily EMA21
- price is above or inside de ichimoku cloud MTF (1h TF)
- optionally! EMA golden/death cross
Go Short (red line on the histogram):
- vice versa
Rules for exits:
- DI+ crosses down on DI- on longs
- DI- crosses up on DI+ on shorts
- or any fixed, dynamic, trailing... TP/SL (according to the market conditions)
This strategy can be used also for high time frames (12h, 1D) with a golden/death cross confirmation.
Soon I will publish a screener that scan multiple altcoins at once to find setups easier.
P.S.1 The strategy should be used with it's default settings/values (you can change them if you want), but there are 2 versions of Squeeze Momentum from Lazy Bear that you can choose from.
P.S.2 This is not a magic strategy, please do your research before using real money!
P.S.3 The strategy is free to use, just add it to the favorites and then to the chart.
Enjoy!

Delorean TDI - Traders Dynamic IndexTraders Dynamic Index (for the Delorean Strategy)
===============================================================
This indicator helps to decipher and monitor market conditions related to trend direction, market strength, and market volatility.
TDI has the following components:
* Green line = RSI Price line
* Red line = Trade Signal line
* Blue lines = Volatility Bands
* Yellow line = Market Base Line
Trend Direction - Immediate and Overall:
----------------------------------------------------
* Yellow line trends up and down generally between the lines 32 & 68. Watch for Yellow line to bounces off these lines for market reversal. Trade long when price is above the Yellow line, and trade short when price is below.
Market Strength & Volatility - Immediate and Overall:
----------------------------------------------------
* Immediate = Green Line -> Strong = Steep slope up or down.
* Immediate = Green Line -> Weak = Moderate to Flat slope.
* Overall = Blue Lines -> When expanding, market is strong and trending.
* Overall = Blue Lines -> When constricting, market is weak and in a range.
* Overall = Blue Lines -> When the Blue lines are extremely tight in a narrow range, expect an economic announcement or other market condition to spike the market.
Note Credit: LazyBear - altered for the Delorean Strategy

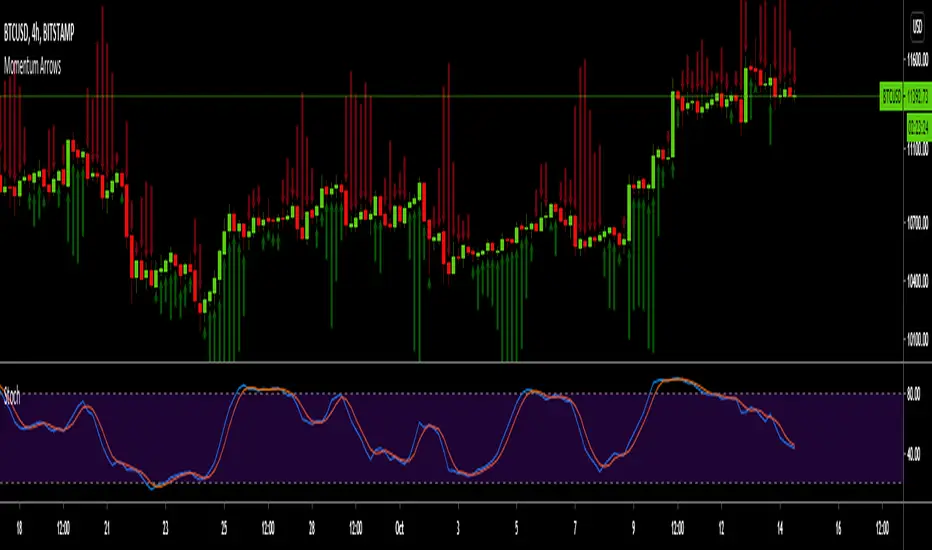
Momentum ArrowsThis simple indicators paints the Momentum based on Stochastic, RSI or WaveTrend onto the Price Chart by showing Green or Red arrows.
In the settings it can be selected which indicator is used, Stochastic is selected by default.
Length of the arrows is determined by the strength of the momentum:
Stochastic: Difference between D and K
RSI: Difference from RSI-50
WaveTrend: Difference between the Waves
(Thanks to @LazyBear for the WaveTrend inspiration)
PS:
If anyone has an idea how to conditionally change the color of the arrows, then please let me know - that would be the icing on the cake. Then it would be possible to indicate Overbought/Oversold levels with different colors.
Unfortunately it currently seems not to be possible to dynamically change the arrow colour.
Stoic Stoch MFI V2.0 [Nest]This indicator has 2 price momentum oscillators
Aqua line = fast stochastics that react to price action faster (5m and 10m timeframe)
Pink line = slow stochastics that react to price action slow (20m timeframe)
Both lines use a complex smoothing average formula to give more precise measurements of momentum.
Added on top of this indicator is "Godmode by LazyBear" and MFI for confluence.

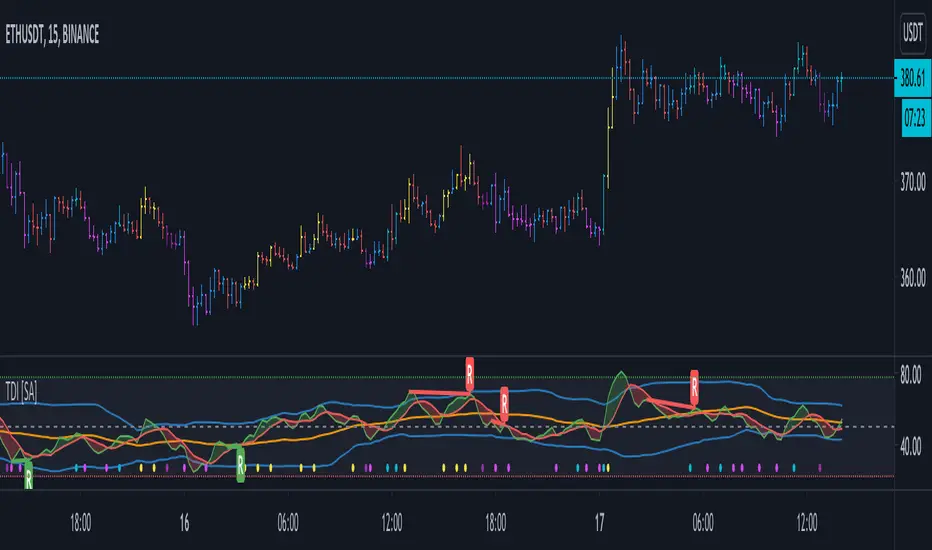
TDI - Traders Dynamic Index [SystemAlpha]Traders Dynamic Index with Divergence
Credits to the original code author LazyBear and modifications by JustUncleL
JMA filter 1This my adapt version of juric filter
I took the script from chuck berger
I just add my adaptation to it
i think it make this filter more accurate
Lazy Bear is the original creator of this filter
by time it has many version
So I try to make my to this great script
buy is lime
sell is red
thanks to original authors
tesla
dow 30
etc etc:)

NN Trading SystemThis indicator is an attempt to be all-in-one solution that follows the structure of NNFX Youtube channel. The components may vary from trader to trader. This is my compilation. If you have any ideas to make it better, let me know.
Brief Info about the structure:
The trader chooses best indicators for the positions described below; enters and exits positions strictly based on the consensus of the indicators. Here are components:
1. Baseline (trend line): I usually use "Regression Line" indicator that can be found in the public library. If the price is above the baseline, look for longs; if the price is below the baseline, look for shorts. This part cannot be included in this indicator since it needs the indicator to be an overlay indicator. So choose and couple with your own.
2. Entry Signal: This is the main indicator that signals opening positions. I tested lots of indicators and finally chose LazyBear's MACD Leader Indicator. This is the modified version of it. When the signal line crosses over the zero line, it's a long signal. When the signal line crosses under the zero line, it's a short signal. You may also use the peaks of the hills it creates as a signal if you think it performs better. It's up to you. I have added dots for the possible peaks using "alma" cross algorithm.
3. Confirmation Signal #1: To open a position both the confirmation signals need to give a green signal. otherwise you are not allowed to open the position. Chosen indicator for this job is ATR. Set your minimum ATR value on the settings box and if the current ATR on the current timeframe is below the ATR value, a gray line will be drawn over the entry signal line and you should not take the trade. If you are already have a position, this doesn't mean that you should close the position though. It just informs you that momentum is low. YOU NEED TO ADJUST THIS ATR LIMIT FOR EVERY ASSET AND TIMEFRAME YOU TRADE. For BTC 1min, my example limit value is 8. Find your best value.
4. Confirmation Signal #2: I have chosen Aroon indicator for trend confirmations. If the background of the indicator is green, it's suitable for longs, if it's red, it's suitable for shorts. If the color is brighter, that means the signal is stronger. Aroon is a very powerful indicator but you need to find the best settings for the timeframe you are using.
5. Exit Signal: This one is the hardest role to find an indicator for. The one i ended up choosing is "Relative Vigor Index". It doesn't give good entry signals but with the right settings, it works as an exit signal in my experience. This signal is drawn as a green and red boxes and the top and the bottom of the indicator area. If it changes color while you have a position, it's time to close the position. Find the right settings for it so that every time it signals reversal, you obey the rule and close the position.
To summarise, the components are:
* ATR
* MACDL
* ALMA CROSSOVER
* AROON
* RVGI
plus
* a trend line indicator of your choice added seperately to your chart.
My recommendation is to turn all the indicators off on the settings box and enable on by one finding the best values individually. If you found the best settings for an asset and timeframe, please share in the comments for others.
You may leave a comment for bug reports, feedback and suggestions.
Hope it works for you.
Cheers.

Price Action Trading System v0.3 by JustUncleL with modifcationsThe base of this script is the Price Action Trading System from JustUncle .
I have first combined it with script ADX and DI by BeikabuOyaji to indicate when the +DI is above the -DI and the ADX is above 20. This is represented by crosses at the top of the page: green indicating that the +DI is above the -DI and ADX above 20, and red if -DI is above the +DI and ADX above 20. If the ADX is increasing in slope while the +DI is above the -DI, an up green arrow is shown at the bottom of the page, indicating an increase in this trend, and the slope of the ADX is increasing and the -DI is above the +DI, a down arrow is shown at the bottom. One could think to a green cross with a green up arrow as a potential buy opportunity, and a red cross with a red down arrow as a potential sell opportunity.
Next, I have combined this script with the Indicator: WaveTrend Oscillator from Lazybear . If the oscillator has readings below -45 and the slope of the line is increasing, a green diamond appears above the chart. This indicates a potential buy opportunity. If the oscillator has readings above 50 and the slope of the line is decreasing, a red diamond appears above the chart. This indicates a potential sell opportunity. Now if the slope of the oscillator is rising significantly but does not hit the -45 threshold to start its increase, but is negative in value, a green flag appears at the top of the page. This represents a potential buy opportunity. If the slope of the oscillator is significantly decreasing and is positive in value, a red flag appears at the bottom of the page. This represents a potential sell opportunity.
The base of this script, the Price Action Trading System v0.3 by JustUncle , has many of its own features that I have kept. If the MACD is positive, the background colour is green. If it is negative, the colour is red. If the CCI and RSI indicate an oversold opportunity and the MACD is positive, you get an up olive arrow below the chart. If they indicate an overbought opportunity and the MACD is negative, you get a red down arrow above the chart. If the CCI value stays oversold after a green arrow, the candle chart turns turquoise, and if overbought, turns black after a red arrow.
You can use these indicators in combination to help you with your trading strategy.

1337 Volume - V2This volume script uses a Z-Score based filter to identify statistically significant high and low volume conditions.
It also includes a variation of LazyBear's obv_oscillator to map volume flow.
Regular volume will appear either lime or red.
Irregularly high volume will appear bright lime / bright red.
Irregularly low volume will appear white.
It comes with tested pre-defined thresholds and lookback lengths, but feel free to play with the settings on your own.
Enjoy!

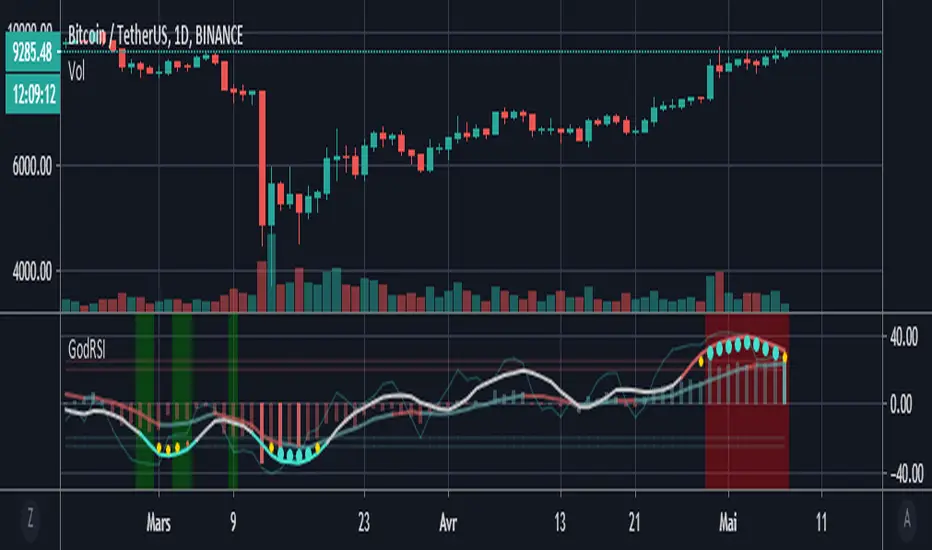
Godmode RSI with MFIBased on the Godmode indicators modified by LEGION, LAZYBEAR, Ni6HTH4wK, xSilas, oh92, sco77m4r7in and anise.
Big thanks to them.
Just an add on of the excellent script of anise.
I only added the possibility to chose the exchange and asset so that the multi exchange option can be used on other assets and the MFI's overbought and oversold highlights.
WaveTrend Oscillator w/ Short/Long/Close Alerts - WIPHigh TFs work best, but it works on any TF. I plan to continue releasing updates to it to improve overall form and function. Green Circles are Long Alerts, Red Circles are Short Alerts. Blue and Yellow Circles are Close Position Alerts. First Blue Circle After Red Circle would be Short Exit. First Yellow Circle After Green Circle would be Long Exit.
Original script was based on Lazybear Indicator-WaveTrend-Oscillator-WT Script. I have added and modified some code to my personal liking.

WaveTrend By LimaIndicator packing both WaveTrend and RSI.
Source code for the WaveTrend belongs to LazyBear and RSI well, it is a Pinescript method.

Squeeze PanelThis is a combination of the Squeeze Momentum Indicator by LazyBear and the Wave A/B/C indicator by UCSGEARS, presented as a panel inspired from work by lejmer.
The panel consist of 5 rows:
1. Squeeze Indicator
2. Squeeze Direction
3. Wave A
4. Wave B
5. Wave C

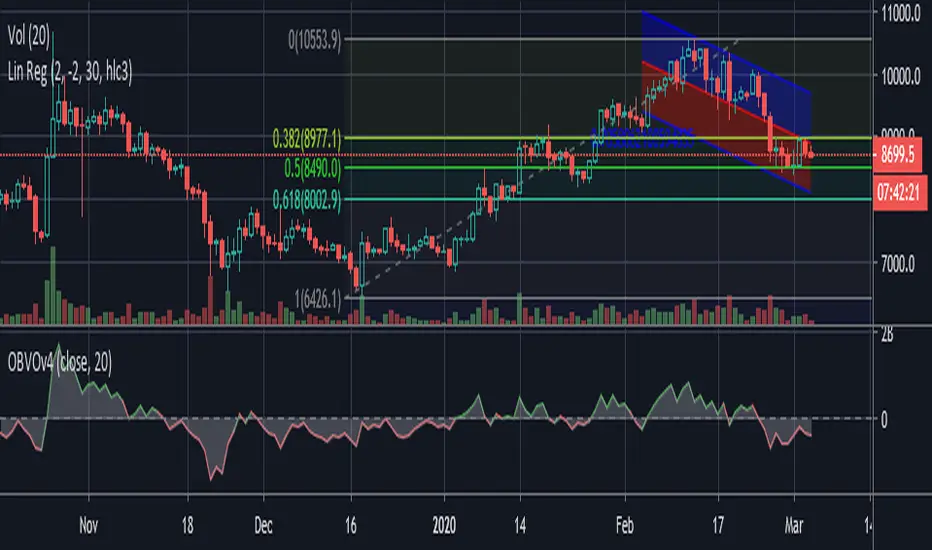
Code Upd: On Balance Volume Oscillator [LazyBear] v4One of the review indicator from me.
I reviewed code for more comfortable use - the basic code was not modified.
Enjoy it!
[CryptoWho] Multi DivergencesThis script looks for divergences on up to six indicators, sums them up and draw a histogram below the chart.
You have several options to customize the output:
1. indicators: RSI, Stoch RSI, MACD, CCI, OBV, WaveTrend (LazyBear)
2. Divergences: Regular, hidden, both
3. Lookback period for divergences
BITSTAMP:BTCUSD
