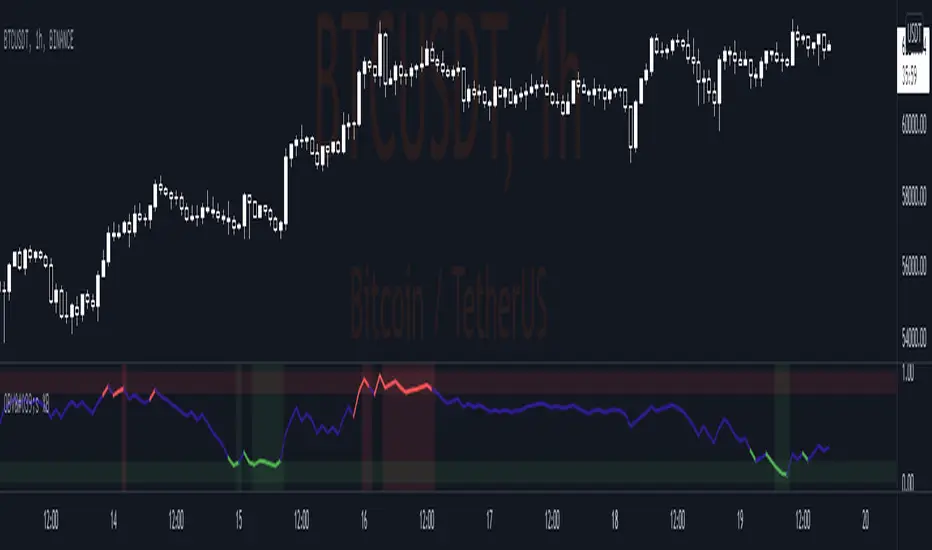
OBV TSI IndicatorThe OBV TSI Indicator combines two powerful technical analysis tools: the On-Balance Volume (OBV) and the True Strength Index (TSI). This hybrid approach provides insights into both volume dynamics and momentum, helping traders identify potential trend reversals, breakouts, or continuations with greater accuracy.
The OBV TSI Indicator tracks cumulative volume shifts via OBV and integrates the TSI for momentum analysis. It offers customizable moving average options for further smoothing. Visual trendlines, pivot points, and signal markers enhance clarity.
The OBV tracks volume flow by summing volumes based on price changes. Positive volume is added when prices rise, and negative volume is subtracted when prices fall. The result is smoothed to detect meaningful trends in volume. A volume spread is derived from the difference between the smoothed OBV and cumulative volume. This is then adjusted by the price deviation to generate the shadow spread, which highlights critical volume-driven price levels.
The shadow spread is added to either the high or low price, depending on its sign, producing a refined OBV output. This serves as the main source for the subsequent TSI calculation. The TSI is a momentum oscillator calculated using double-smoothed price changes. It provides an accurate measure of trend strength and direction.
Various moving average options, such as EMA, DEMA, or TEMA, are applied to the smoothed OBV for additional trend filtering. Users can select their preferred type and length to suit their trading strategy. Trendlines are plotted to visualize the overall direction. When a significant change in trend is detected, up or down arrows indicate potential buy or sell signals. The script identifies key pivot points based on the highest and lowest levels within a defined period. These pivots help pinpoint reversal zones.
The indicator offers customization options, allowing users to adjust the OBV length for smoothing, choose from various moving average types, and fine-tune the short, long, and signal periods for TSI. Additionally, users can toggle visibility for trendlines, signals, and pivots to suit their preferences.
This indicator is ideal for practical use cases such as spotting potential trend reversals by observing TSI crossovers and pivot levels, anticipating breakouts from key price levels using the shadow spread, and validating trends by aligning TSI signals with OBV and moving averages.
The OBV TSI Indicator is a versatile tool designed to enhance decision-making in trading by combining volume and momentum analysis. Its flexibility and visual aids make it suitable for traders of all experience levels. By leveraging its insights, you can confidently navigate market trends and improve your trading outcomes.
Cari dalam skrip untuk "OBV"

OBV + Custom MA StrategyFor a long time, the use of the OBV indicator has been relatively monotonous, with its expression and content lacking diversity. Therefore, I'm considering trying new ways of representation.
This "OBV + Custom MA Strategy" indicator combines the On-Balance Volume (OBV) with customizable moving averages (SMA, EMA, or WMA) to provide advanced insights into market trends. The indicator calculates OBV manually and overlays two moving averages: a short-term and a long-term MA. Key features include:
OBV plotted alongside short-term and long-term moving averages for better trend visualization.
Signals generated when OBV crosses the short-term MA or when the short-term MA crosses the long-term MA.
Alerts for bullish and bearish crossovers to help identify potential buy or sell opportunities.
This indicator is suitable for traders looking to incorporate volume dynamics into their strategy while customizing their moving average type and periods.
中文说明
此“OBV + 自定义均线策略”指标结合了成交量指标OBV与可定制的移动均线(SMA、EMA或WMA),为市场趋势分析提供了更多的视角。该指标手动计算OBV,并叠加短期与长期均线,主要特点包括:
绘制OBV以及短期和长期均线,以更清晰地观察趋势。
当OBV上穿/下穿短期均线或短期均线上穿/下穿长期均线时,生成买卖信号。
提供多种看涨和看跌信号的警报,帮助识别潜在的买入或卖出机会。
此指标适合希望将成交量动态纳入策略的交易者,并支持自定义均线类型和周期以满足个性化需求。
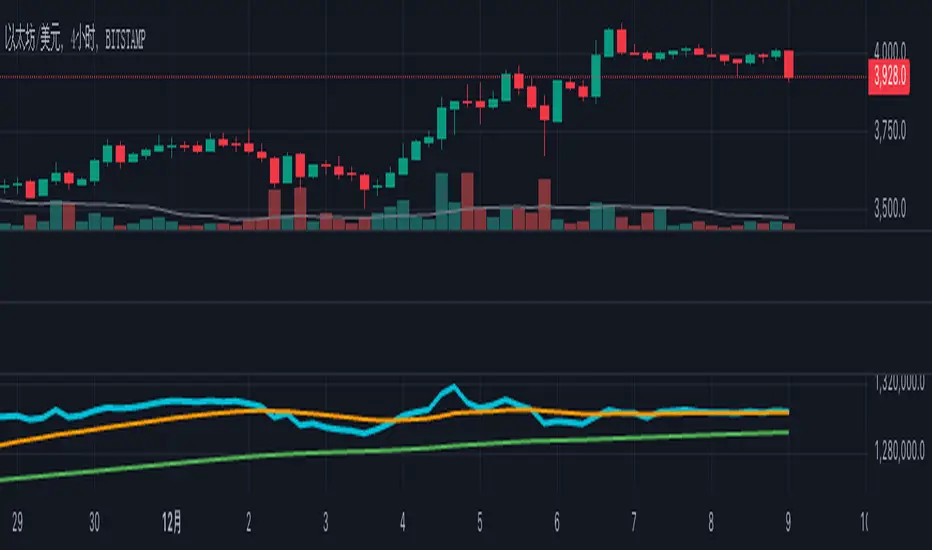
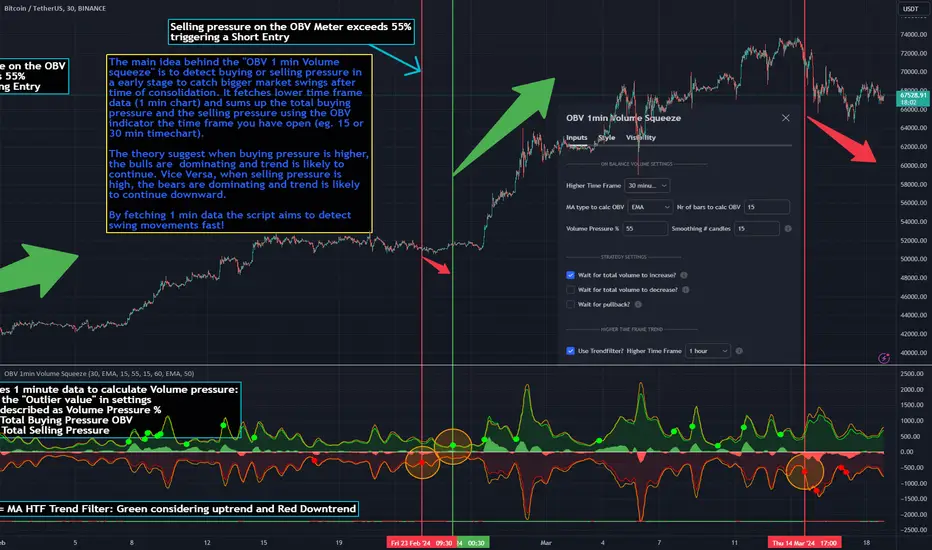
OBV 1min Volume SqueezeIn the vast realm of trading strategies, few terms evoke as much intrigue as the word "squeeze." It conjures images of pent-up energy, ready to burst forth in a sudden and decisive move. In this blog post, we'll delve into a new trading idea titled the "OBV 1-Minute Volume Squeeze" which aims to catch bigger market movements by fetching 1 minute OBV data on higher time charts.
The Essence of Squeeze
In trading parlance, a "squeeze" typically denotes a scenario where volatility contracts, and prices consolidate within a narrow range. Translating this concept to volume dynamics, a "volume squeeze" suggests a period of compressed volume activity. It is unclear if the Bulls or the Bears are at winning hand and price is thus consolidating. The script calculates buying and selling pressure by fetching 1 min data. The total volume presure is the sum of absolute values of the buying and selling pressure added up. By deviding the Buying volume by the total volume we know the Buying Pressure.
The trading theory suggest that when the buying pressure exceeds a certain value eg. 50% (default value in the script is 55%) it is likely the trend will continue to go up for a longer period of time. Vice Versa when selling pressure is higher, the trend is likely to continue down. In the script you can adjust the sensitivity in such way a higher "Volume Pressure %" result in less trading signals.
Fetching 1 min data
The OBV is a wonderful indicator to measure the buying and selling pressure. A disadvantage of the script is that the total volume pressure is presented as a positive (buying) or negative value (selling) value in the Oscillator. It does not offset the Bulls power against the Bears power at given time. The script aims to do measure the directional volume power by defining a volume pressure % (oulier value) by fetching 1 min OBV data on higher time frame charts comparing the Bulls power against the Bears Power. The code is included below:
// Fetch Lower Timeframe Data in an array
// nV = ZeroValue, sV = Selling Volume, bV = Buying Volume, tV = Total Volume
= request.security_lower_tf(syminfo.tickerid, '1', )
sum_bV_Lengthbars = array.sum(bV)
sum_sV_Lengthbars = array.sum(sV)
sum_tV_Lengthbars = sum_bV_Lengthbars + sum_sV_Lengthbars // Combine buying and selling volumes to get total volume
// Calculate buying and selling volume as percentage of the total volume, but ensure the denominator isn't zero.
buying_percentage = sum_tV_Lengthbars != 0 ? sum_bV_Lengthbars / sum_tV_Lengthbars * 100 : na
selling_percentage = sum_tV_Lengthbars != 0 ? -(sum_sV_Lengthbars / sum_tV_Lengthbars * 100) : na
OBV Oscillator Explanation
The On Balance Volume (OBV) indicator is a technical analysis tool used to measure buying and selling pressure in the market. It does this by keeping a running total of volume flows. OBV is typically calculated by adding the volume on a candle when the price closes higher than the previous candle's close and subtracting the volume on candles when the price closes lower than the previous candles close. If the price closes unchanged from the previous candle, the volume is not added to or subtracted from the OBV. The OBV can be presented as an oscillator. Positve value is the buying pressure and negative values is the selling pressure. In the settings the OBV is calculated based on 1 min data and comes with the following input options for visualization on the chart:
Higher Time Frame Settings (make sure the HTF is higher than the chart you have open)
Type of MA being: EMA, DEMA, TEMA, SMA, WMA, HMA, McGinley
Volume Pressure % (outlier value)
Length of number of bars (of the choosen HTF settings)
Smoothing of number candles of hte opened timechart. Note that higher number of bars to smoothen the indicator results in less signals, but lag of the indicator increases.
The Oscilator contains 3 main lines which are used to determin the entry signals:
Orange Line = the Outlier value in settings described as "Volume Pressure %"
Green Line = Total Buying Pressure OBV
Red Line = Total Selling Pressure OBV
If the Green or Red line is in between the zero line and the orange line the volume is squeezed and waiting for a directional break out.
If the Green line crosses over the orange line the buying pressure is > 55% and triggers a long entry position (green dot). If the Red line crosses under the orange line the selling pressure is > 55% and triggers an short entry (red dot). In the strategy settings this option is called: "Wait for total volume to increase?".
Alternative Strategy Options
In order to play around with different settings users can opt for two more strategy entry settings, called:
"Wait for total volume to deacrease?" --> Only gives a signal when total volume is declining, but buying or selling pressure maintains and crosses % threshold.
"Wait for Pull Back?" --> After a pullback occured and opposite buy/sell pressure gets lower than threshold (direction is shifting)
Turning on all options will logically result into more signals. Note these strategy ideas are experimental and can best be used in confirmation with other indicators.
Moving Average Filter (HTF)
The Oscillator has a horizontal line at the bottom. The line is green when the moving average is in a uptrend and red when the moving average is in a downtrend. The MA Filter comes with the following settings:
Higher Time Frame Setting
Type of MA being: EMA, DEMA, TEMA, SMA, WMA, HMA, McGinley
Length of number of bars (of the choosen HTF settings)
At last I hope you like this volume trading idea and if you have any comments let me know!
OBV-MACDThe OBV-MACD indicator is a momentum-based technical analysis tool that helps traders identify trend reversals and trend strength. This Pine script is an implementation of the OBV-MACD indicator that uses the On-Balance Volume (OBV) and Moving Average Convergence Divergence (MACD) indicators to provide a momentum data of OBV.
The OBV-MACD indicator uses the OBV to calculate the cumulative volume, which is then smoothed using two moving averages - fast and slow. The difference between these moving averages is plotted as a histogram, with a signal line plotted over it. A buy signal is generated when the histogram crosses above the signal line, indicating a bullish trend, while a sell signal is generated when the histogram crosses below the signal line, indicating a bearish trend.
This Pine script also includes an OBV-MACD-Donchian version that incorporates Donchian channels for the OBV-MACD. The Donchian channel is a technical analysis indicator that helps traders identify the highs and lows of an asset's price over a certain period. The OBV-MACD-Donchian version uses the OBV-MACD indicator along with the Donchian channels to provide signals that the momentum of OBV is making new high/low during that period of time.
Traders can customize the input parameters of the OBV-MACD indicator, such as the timeframe, method of calculation for the moving averages, and the lengths of the moving averages and breakout lengths. The colors of the plot can also be customized to suit the trader's preferences.

OBV Oscillator [LazyBear]- with some MAsThis indicator in modified OBV written by @LazyBear
I just added the 2 different Bollinger Bands and 2 different moving averages to the OBV version of LazyBear.
OBV line green -> OBV above zero
OBV line red -> OBV under zero
green background line -> OBV crossover 1st Moving Average
red background line -> OBV crossunder 1st Moving Average
blue '◆' -> OBV crossover 2nd Moving Average
yellow '◆' -> OBV crosunder 2nd Moving Average
blue '+' -> 1st Moving Average crossUNDER 2nd Moving Average
red '+' -> 1st Moving Average crossOVER 2nd Moving Average

OBV's %BIndicator display where OBV (On Balance Volume) is in relation to the bands of Bollinger Bands (OBV,100,3)
A. OBV's Bb Info
1. Basis = SMA (OBV,100)
2. Upper Band = Basis + 3 x Standard Deviation
3. Lower Band = Basis - 3 x Standard Deviation
B. OBV's %B Info
1. %B Above 1 = OBV is Above the Upper Band
2. %B Below 0 = OBV is Below the Lower Band
3. %B Above 0.8 = OBV is Nearing the Upper Band
4. %B Below 0.20 = OBV is Nearing the Lower Band
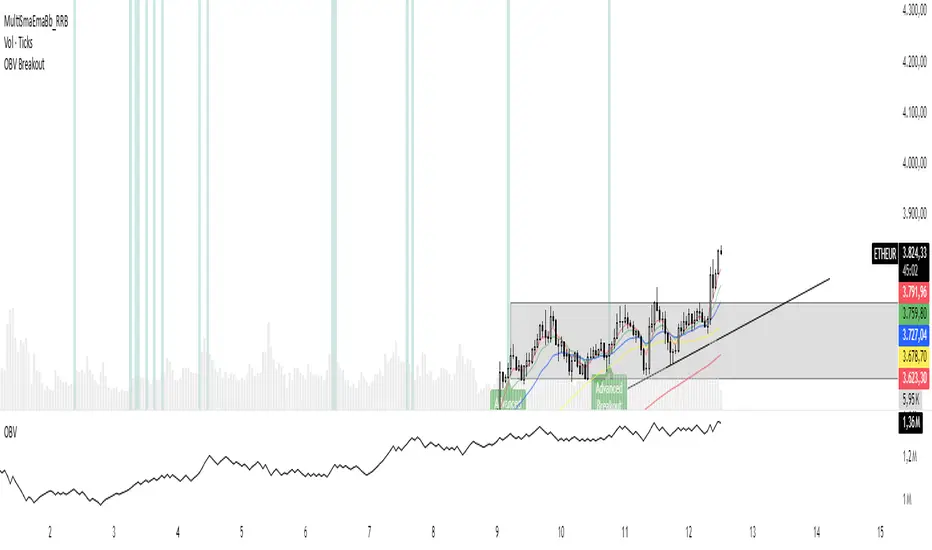
OBV Breakout Screener (By Tarso)1. Purpose of the Indicator
The "Advanced OBV Breakout Screener" is a specialized tool designed to find a powerful bullish signal. It scans for assets where buying pressure is increasing significantly, even though the price has not yet broken out.
The core strategy is to identify assets where:
Volume is leading Price: The On-Balance Volume (OBV) has already broken its recent high.
Price is still contained: The asset's price has not yet broken its recent high.
This setup helps you find potential trading opportunities right before a possible upward move.
2. How to Set Up the Indicator
First, you need to add the script to your TradingView account.
Open any chart on TradingView.
Click on the "Pine Editor" tab at the bottom of the screen.
Delete any existing code and paste the entire "Advanced OBV Breakout Screener" script into the editor.
Click "Add to chart". The indicator will now appear in a separate panel below your main price chart.
3. How to Use it with the Pine Screener (Step-by-Step)
This is the main purpose of the indicator. The script does all the complex analysis and provides a simple "1" (Signal is ON) or "0" (Signal is OFF). You only need to set up one filter.
Open the Stock Screener (or Crypto/Forex Screener).
Click the Filters button to open the settings panel.
Ensure you are on the Pine Screener tab (this allows you to filter using custom indicators).
In the indicator selection menu (it might say "Select Indicator..."), find and choose Advanced OBV Breakout Screener from your list.
Now, configure the single filter condition as follows:
In the first box, select Advanced Breakout Signal.
In the second box, select Equal to.
In the third box, select Number and type 1.
Your filter setup should look clean and simple, like this:
That's it! The screener will now display a list of all assets that currently meet the "Advanced Breakout" criteria for the timeframe you have selected (e.g., Daily, 4h, 1h).
4. Configuring the Lookback Period
By default, the indicator analyzes the last 20 periods. If you want to change this (for example, to scan for breakouts over 50 days), you must adjust it in the indicator's settings on your chart.
Go back to your chart view.
Find the "Advanced OBV Breakout Screener" panel.
Click the Settings icon (⚙️) next to the indicator's name.
In the "Inputs" tab, change the "Lookback Period (days)" to your desired value.
Click "OK".
The Pine Screener will automatically use this new setting for its market scan.
5. Understanding the On-Chart Visuals
When you add the indicator to your chart, you will see:
Blue Line: This is the On-Balance Volume (OBV).
Red Stepped Line: This represents the highest value the OBV has reached during the lookback period. A breakout happens when the blue line moves above this red line.
Green Triangle (▲): This symbol appears below a price candle whenever the full "Advanced Breakout" condition (OBV breakout + Price containment) is met, giving you a clear visual confirmation.
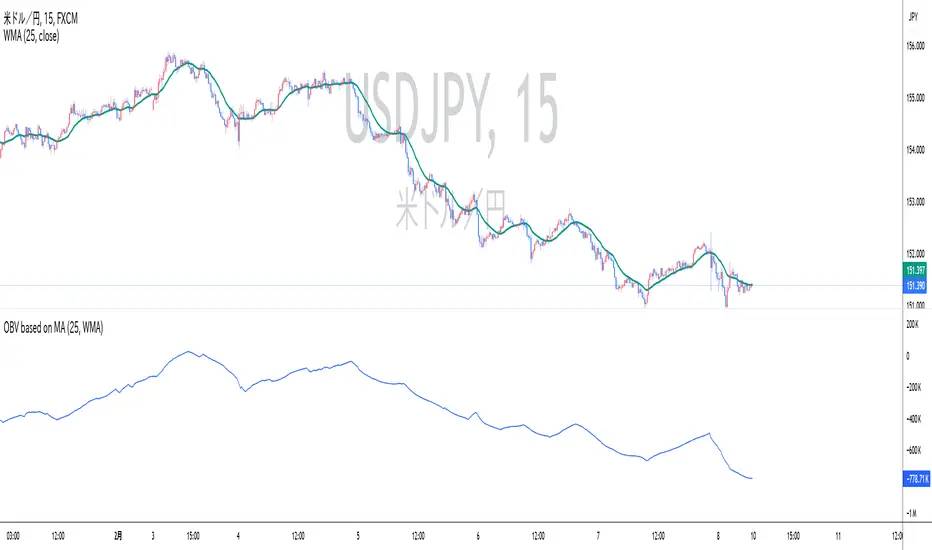
OBV based on MADescription:
This indicator calculates On-Balance Volume (OBV) based on the direction of a Simple Moving Average (SMA). Instead of using price movements, this OBV adds or subtracts volume depending on whether the SMA is rising or falling.
SMA-based OBV: When the SMA rises, the volume is added to the OBV. When the SMA falls, the volume is subtracted from the OBV. This allows traders to observe cumulative volume in relation to the wave patterns created by the SMA.
SMA Period: The period of the SMA can be customized, allowing traders to adjust it according to the wave size they want to observe.
While the cumulative volume indicator already exists, traders who analyze volume patterns can use this indicator to more easily conduct volume analysis across different wave sizes.
Inputs:
SMA Period: Defines the lookback period for calculating the Simple Moving Average (default is 25).
Ideal for:
Traders who want to analyze volume flow relative to moving average trends, rather than price movements. This can help identify underlying strength or weakness in market trends.
説明:
このインジケーターは、単純移動平均(SMA)の方向に基づいてオンバランス・ボリューム(OBV)を計算します。価格の動きではなく、SMAが上昇しているときは出来高を加算し、SMAが下降しているときは出来高を減算します。
SMA基準のOBV: SMAが上昇している場合はOBVに出来高が加算され、SMAが下降している場合は出来高が減算されます。これにより、SMAが作る波形に即した累積出来高を観察することができます。
SMA期間: トレーダーが見たい波のサイズ感に応じて、SMAの期間をカスタマイズできます。
既に累積出来高(Cumulative Volume)というインジケーターは存在しますが、波形を基に出来高を分析しているトレーダーは、このインジケーターを使うことで、様々なサイズの波形に即した出来高分析をより簡単に行うことができます。
入力項目:
SMA期間: 単純移動平均の計算に使用される期間を定義します(デフォルトは25)。
適しているトレーダー:
より波形に即した累積出来高分析を重視するトレーダーに最適です。
OBV based on Heikin-AshiDescription
This indicator calculates the On-Balance Volume (OBV) based on Heikin-Ashi candles rather than regular candlesticks.
OBV based on Heikin-Ashi: The OBV is calculated based on Heikin-Ashi candle trends. Volume is added when the Heikin-Ashi close is above the open (bullish) and subtracted when the close is below the open (bearish).
Volume Analysis: This approach helps traders identify significant volume shifts in a smoother trend environment, reducing market noise that often accompanies traditional candlestick charts.
説明
このインジケーターは、通常のローソク足ではなく、平均足(Heikin-Ashi)を基にオンバランス・ボリューム(OBV)を計算します。
平均足に基づくOBV: OBVは、平均足のトレンドに基づいて計算されます。平均足の終値が始値を上回った場合(陽線)は出来高が加算され、終値が始値を下回った場合(陰線)は出来高が減算されます。
出来高分析: この手法により、通常のローソク足チャートで発生するノイズを軽減し、滑らかなトレンド環境で重要な出来高の変化を把握できます。

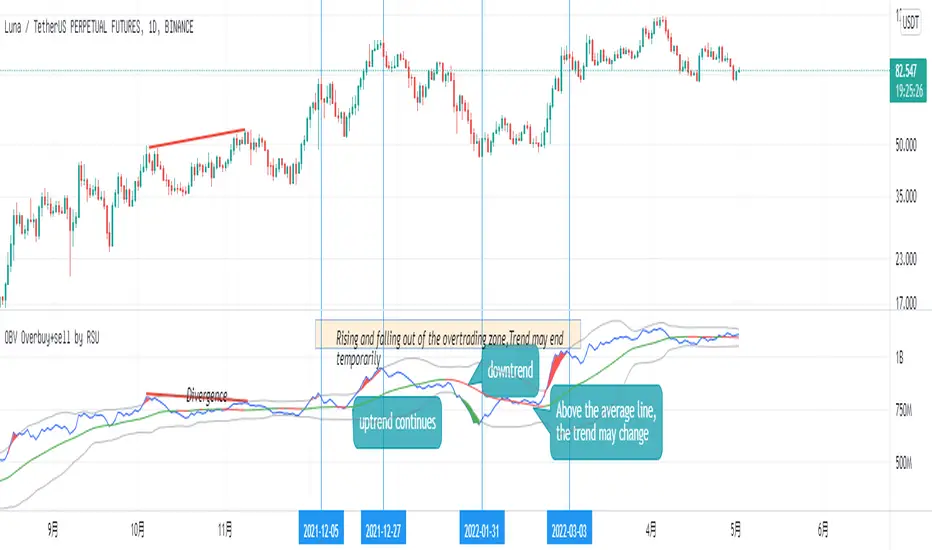
OBV Overbuy+sell Oscillator[RSU]On-balance volume (OBV) is a technical trading momentum indicator that uses volume flow to predict changes in stock price. Joseph Granville first developed the OBV metric in the 1963 book Granville's New Key to Stock Market Profits.
This indicator is based on the OBV indicator and adds 2 times the standard deviation Bollinger Band to evaluate the overbought and oversold phenomenon of the OBV indicator.
The characteristics of Bollinger Bands: According to the normal distribution phenomenon, only 5% of the cases will exceed 2 times the standard deviation of the Bollinger Bands . So when it exceeds, I use colors to mark red overbought and green oversold situations.
Usage:
1.Identify trends: Identify current stock trends by OBV's 30 average line color.
2.Breakthrough:OBV Breakthrough 30 average,signal trend may reversal.
3.Oversell and overbuy:A break below overbuy could signal a temporary end to the uptrend.
4.Divergence:When the slope of the two highs is opposite to the slope of the two highs of the indicator, a trend reversal signal may occur.

OBV and OBV SMA comparisonCompare OBV and OBV SMA relative strength
---------------------------------------------------
Key Points in this study:
Default SMA34
In Daily down trend or consolidation in uptrend
1. if OBV crosses above OBV SMA34, Long entry
2. OBV breakout to new high, Long entry

OBV Z-Score + Table📘 OBV Z-Score — Indicator Description
Overview
This indicator converts the On-Balance Volume (OBV) into a Z-Score oscillator, providing a normalized statistical view of volume flow strength relative to its recent history.
How It Works
OBV Calculation
The On-Balance Volume accumulates volume based on price direction, showing whether volume is flowing into or out of an asset.
Z-Score Transformation
The OBV values are normalized via Z-Score:
ini
Kopieren
Bearbeiten
Z = (OBV - Mean) / Standard Deviation
This reveals how unusually strong or weak volume momentum is compared to recent norms.
Smoothing
An optional moving average smoothing (SMA, EMA, VWMA, etc.) can be applied for cleaner signals.
Z-Score Table
A live Z-Score value is displayed in a table on the top-right of the indicator pane, clamped between +2 and -2:
+2 indicates unusually high positive volume momentum
-2 indicates unusually high negative volume momentum
How to Use It
Bullish Signal: Z-Score crossing above +1.5 or +2 signals strong buying volume pressure
Bearish Signal: Z-Score crossing below -1.5 or -2 signals strong selling volume pressure
Combine with Price Action: Use alongside price trends or other Z-Score indicators to improve decision making in SDCA or volume-based trading systems

OBV Overbuy+sell by RSUOn-balance volume (OBV) is a technical trading momentum indicator that uses volume flow to predict changes in stock price. Joseph Granville first developed the OBV metric in the 1963 book Granville's New Key to Stock Market Profits.
This indicator is based on the OBV indicator and adds 2 times the standard deviation Bollinger Band to evaluate the overbought and oversold phenomenon of the OBV indicator.
The characteristics of Bollinger Bands: According to the normal distribution phenomenon, only 5% of the cases will exceed 2 times the standard deviation of the Bollinger Bands. So when it exceeds, I will use colors to mark red overbought and green oversold situations.
Usage:
1.Identify trends: Identify current stock trends by OBV's 30 average line color.
2.Breakthrough:A break below overbuy could signal a temporary end to the uptrend.
3.Oversell and overbuy:A break below overbuy could signal a temporary end to the uptrend.
4.Divergence:When the slope of the two highs is opposite to the slope of the two highs of the indicator, a trend reversal signal may occur.
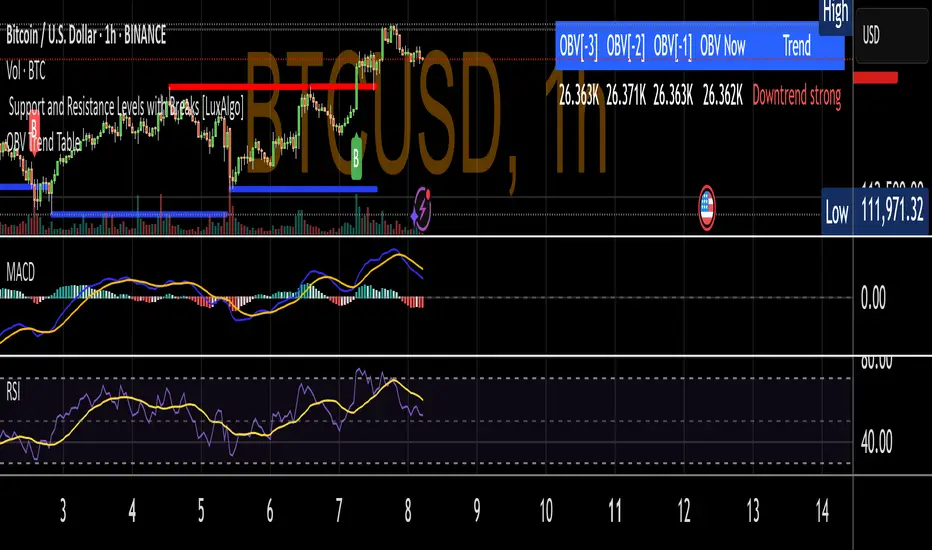
OBV Trend TableDisplays last 3 TF OBV values and current value of OBV. Also displays one of the trend values
- Uptrend healthy (price ↑ + OBV ↑)
- Downtrend strong (price ↓ + OBV ↓)
- Early reversal (price and OBV diverge)
- No clear trend (flat or mixed)
OBV with DivergenceAll I did was combine the logic from LazyBear for his OBV Oscillator to regular RSI divergence logic (where I replaced the RSI input to use LazyBear's OBV).
I didn't use any original code! Neither OBV (written by LazyBear) nor DIvergence (author unknown) was written by me. I merely modified the sytax a little to combine them.
Very useful for spotting divergences with OBV oscillator.

OBV Traffic LightsThe idea with On-balance volume (OBV) is to see price movement based on volume instead of the distance between the open and close of a candle. This can be used to find the relationship between volume and price action much easier than normal volume bars.
This version spices the OBV up a bit by basing it off of the current and previous close of the Heikin Ashi of the current bar, as well as adding "traffic light"
moving averages to the mix to get a better grasp of trends and when volume has shifted direction as well as by how much.
Thanks to Peter Whipp for the original idea of using the OBV with traffic light moving averages, as well as the default settings for them.

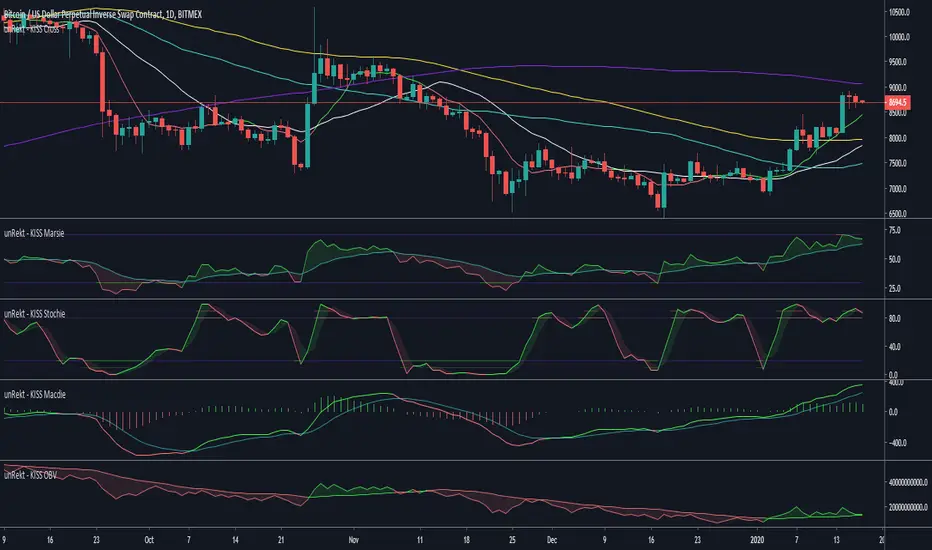
unRekt - KISS OBVOBV is the 'On Balance Volume' indicator and is part of the 'keeping it simple' series that have a similar color scheme. the OBV measures buying and selling pressure as a cumulative indicator, adding volume on up days and subtracting it on down days. The OBV can show divergences or confirm trend.

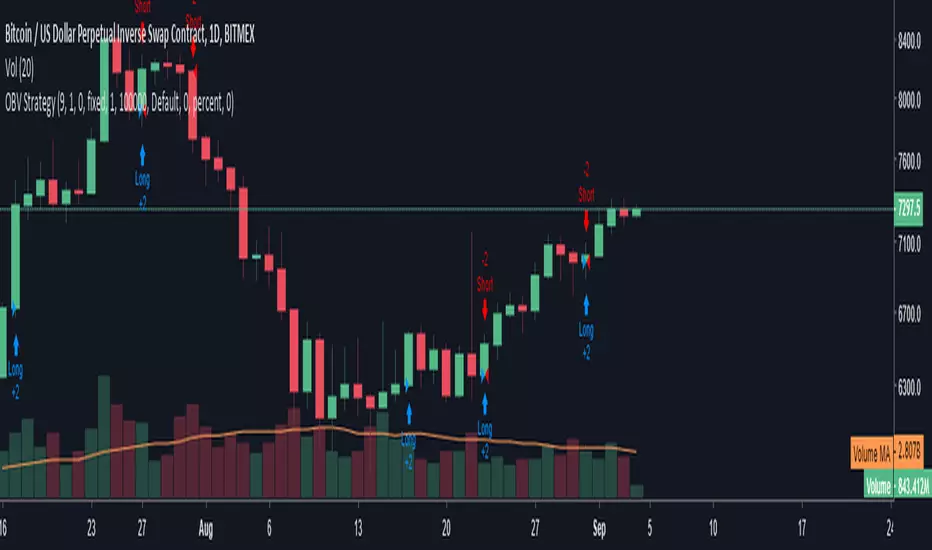
OBV StrategyA simple strategy to give buy/sell signals based on OBV and EMA crossover/crossunder.
When OBV crossunder the EMA it gives a sell signal. When OBV crossover EMA it gives a buy signal.
You can adjust the length of the EMA . By default it is set to 9
OBV Daily High Low Box Realtime (On Balance Volume)Overview
This indicator plots horizontal lines at the daily high and low levels of the On Balance Volume (OBV).
The numerical lines for each day are updated in real-time as the OBV high and low values change.
Please note that there are limitations on how far back in history the indicator can go due to Pine Script's object drawing limitations.

OBV CSI [mado]This Indicator shows you the strength of the Currency based OBV RSI.
If the Currency label is on the top, it is strong, if it is on the bottom, it is weak
use sample image
I use 1 chart just for OBV CSI :)

OBV+EMA HistogramHistogram of the difference between On Balance Volume and an EMA of the On Balance Volume (OBV + EMA).
Using a 55 EMA, on the daily timeframe of BTC, bull/bear trends occur when the histogram is above/below the zero line respectively.
Divergences also have a notable effect.
-- Added alert conditions when OBV crosses EMA to signal a possible trend change, for bullish and bearish cases.

Better OBVOBV with William C. Garrett's Approximation
In the classical OBV (On-Balance Volume) indicator, it simply takes the idea from traditional tape reading - treat the "up tick" as Buy, "down tick" as Sell, and it assumes no change in price as neutral* (*which is not the case in tape reading).
When it comes to interpret the daily volume as such, errors will add up cumulatively. For example, there are days when a Doji Star with high volume just merely one cent higher than yesterday price and the whole day volume would be taken as a BUY Volume....
Here is a gentlemen, William C. Garrett, attempted to break down the daily volume into two parts in his book - "Torque Analysis of Stock Market Cycle".
Published indicator has two modes: Cumulative and Time Segmented. Time Segmented Volume (TSV) - performs a MACD operation on the Garrett Money Flow.
Note on Divergence:
When using a indicator as Time Segmented Money Flow, divergence would surely occur on and off. This is where Wyckoff 3rd principle comes into play - "Effort vs Result" that is not matching. Meaning that the cumulation of shares goes in one direction while the price goes another direction.
