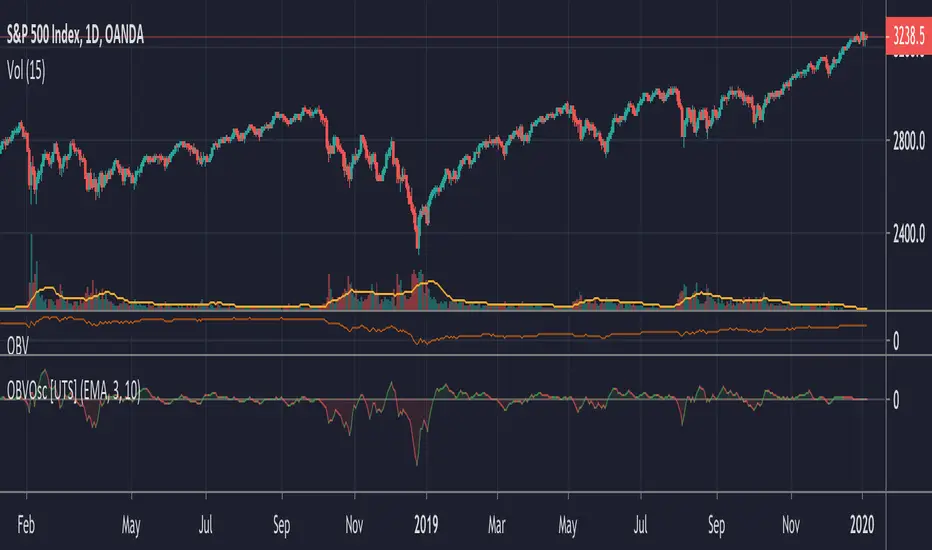
OBV Correlation CoefficientFind the correlation between OBV and price.
Basically, they should be correlated, but sometimes they are inversely correlated (less than -0.4).
It was released because it seems to be in a phase for some reason.
When the inverse correlation is over, it is possible to think about how to buy and sell for the time being
OBVと価格との相関関係を求めます。
基本的には相関するはずなんですけど、たまに逆相関(-0.4以下)になっているときがあります。
何らかの理由で局面になっていそうなので公開しました。
逆相関が終わるときに売買という使い方がとりあえず考えられます
Cari dalam skrip untuk "OBV"

OBV Osc - On Balance Volume Oscillator [UTS]The oscillator version of the well known On Balance Volume Indicator (OBV).
General Usage
Plain old OBV can be used to confirm trends, as well as spot possible trading signals due to divergences.
A benefit of the oscillator version is that it can produce LONG or SHORT signals on zero line cross.
Moving Averages
4 different Moving Averages are available:
EMA (Exponential Moving Average)
SMA (Simple Moving Average)
VWMA (Volume Weighted Moving Average)
WMA (Weighted Moving Average)
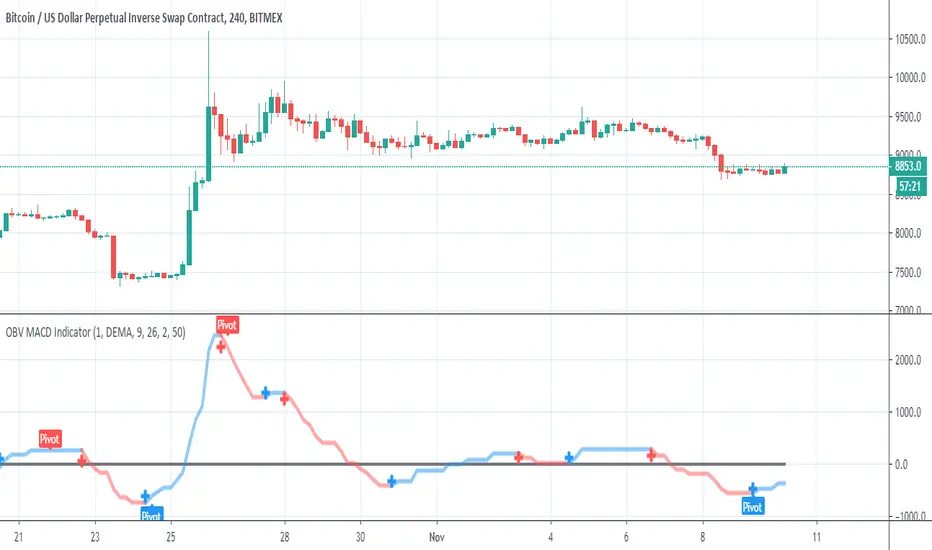
OBV MACD IndicatorSo this script is my improvement to macd that we all know . it faster and more accurate with less lag
first is based on OBV as it primary source
next we convert the OBV to MA style format , in this case we can add all form of MA in order to calculate it . as you will see in settimgs it has many type of MA as each beahave differently
I make the signal to be in linear form jst to make it more sharp/ and in the end in order to make the signal i use Alex grover method (this guy is a genius:) )
in final step we can make pivots point on our new for macd
end resolt is a faster more accurate MACD and much more options fro modification then the regular macd
this is volume indicator based so in some graph where volume does not exist this will not work
OBV with Auto Fibonacci LevelsI like to use OBV as a summary of the order book action + I added Fib levels from my other script for more context. I typically trade swings on H4, and HMA of the OBV helps me set the bias/trend.

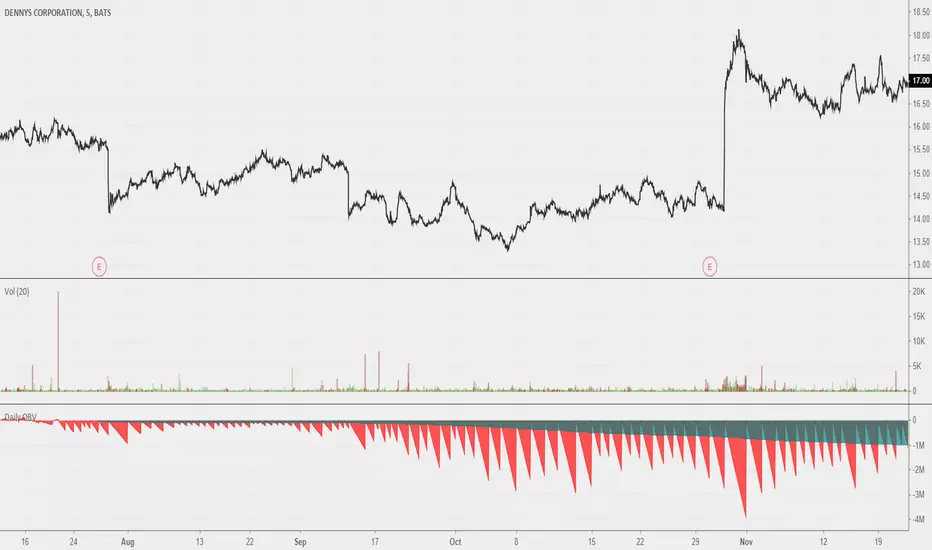
Daily OBVOBV that should reset on a daily session break. Looks neat when you scroll out all the way. Good use remains to be found; I believe this could be a useful reference for a more fleshed out idea for 'local zone' OBVs. Maybe comparing previous sessions' daily OBVs to current.
OBV ShadowsOverlay shows difference between OBV and OBV's moving average as green and red dos above and below cendles.
Designed to fast divergence detection.

OBV & AD Oscillators with Dual Smoothing OptionsOn Balance Volume and Accumulation/Distribution
Overlaid into 1 and then some,
Now it is an oscillator!
3 customizable moving average types
- Ehlers Deviation Scaled Moving Average
- Volatility Dynamic Moving Average
- Simple Moving Average
Each with customizable periods
And with the ability to overlay a second set too
Default Settings have a longer period MA of 377 using Ehlers DSMA to better capture the standard view of OBV and A/D.
An extra overlay of a shorter period using a Volatility DMA uses Average True Range with its own custom settings, seeks to act more as an RSI

OBV with Volume/Momentum DivergenceCredits go to vyperphi696 and LazyBear for the original OBV with Divergence script.
This indicator has the new option to check for momentum divergence, which I have done by adding RSI and MACD data.
Hence the indicator allows combined testing of volume and momentum divergence. This feature aims to improve trend reversal detection by reducing false positives.
In summary, 3 divergence categories are shown by default as lines:
Volume + RSI + MACD (dark green/red)
Volume + RSI / Volume + MACD (light green/red)
Volume (gray)
Line colors can be adjusted via plot settings. Therefore it is also possible to distinguish Volume + RSI and Volume + MACD divergence if necessary.
Lastly, I edited the indicator scaling mechanism when changing from one timeframe to another; the transitions are smoother now. This only applies when auto-scaling is off.

OBV RSI TunTuneCombination of OBV and RSI.
Use as RSI like normal way. You can add another indicator as Bollinger Band for more power .

OBV Pyrthe pyramide strategy based on coinrule script
the strategy is based on OBV scalper that i publish in past
seems very proftible for btc but the question is if this is because it bullish now
if i remove the filter then it will lose but the filter make it very profitable
wish all members best new year
this script work best for 1-5 min chart

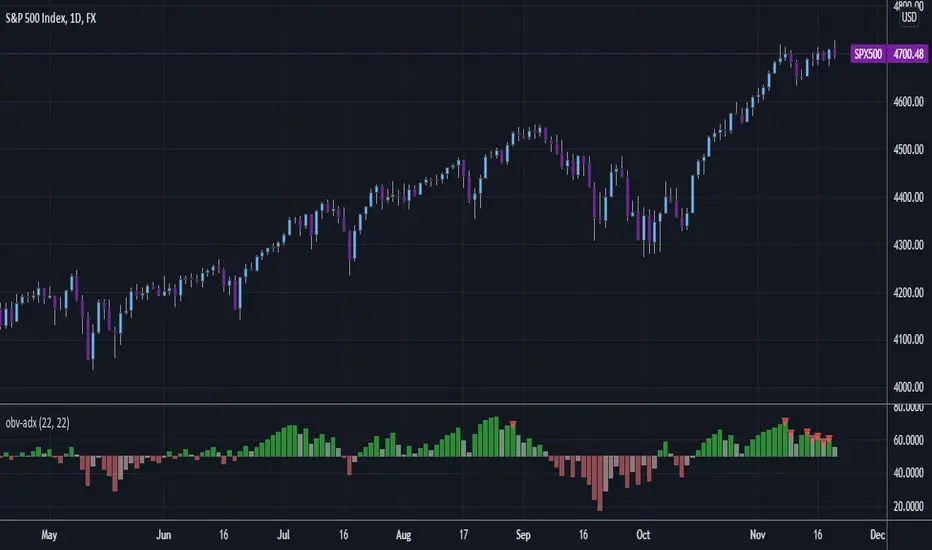
OBV - ADX and DI+/-This is the ADX and DI+/- indicator applied to OBV!
This really clearly shows up and down, but using VOLUME! Don't ignore it, there is too much information captured in the OBV.
If you just love the ADX/DI format, it is included in a checkbox.
Want some excellent background highlighting, turn in on in a checkbox.
Shout out to some inspirations
csw-dmi
unRekt-KISS-Addie
OBV OscillatorHello traders, today I've decided to add another OBV oscillator. I hope you all like it. Peace, and may the force be with you all.


[OBV] [MACD] [Accelerator/Awesome Oscillator] + PivDiv 2Here is an indicator with 4 options:
- OBV
- MACD (uses default EMA, you can change this to SMA)
- AC
- AO
All accompanied with my "Divergences (Pivots)" with 3 settings:
- 'Long Period', default checks 19 bars to the Left (="History") and 1 bar to the Right (="Future")
- 'Medium Period', default checks 14 bars to the Left (="History") and 1 bar to the Right (="Future")
- 'Short Period', default checks 9 bars to the Left (="History") and 1 bar to the Right (="Future")
When choosing an indicator, it comes with their accompanying "Divergences"!
Each Bar checks an amount of Bars at the Left (="History") and Bars to the Right (="Future"), insuring this particular Bar is the Highest or Lowest of them all at "close",
this is compared to the or or and so we have our Divergences.
There is always a slight delay (number of Bar(s) at the Right side (="Future")
If you like a setting, where the amount of “RightBars” equals the ”LeftBars” you can enable the " > Only change 'LeftBars'" button.
Then you only have to adjust the amount of “LeftBars” and the amount of “RightBars” automatically will be the same.
Bullish divergences are "Green"
- 'Short' - 'Medium' "period" > "▲"
- 'Long' "period" > "⇧"
Bearish divergences are "Red"
- 'Short' - 'Medium' "period" > "▼"
- 'Long' "period" > "⇩"
Hidden divergences ( Bullish and Bearish ) are:
- 'Short' - 'Medium' "period" > "▲▼" - "White"
- 'Long' "period" > "⬆︎⬇︎" - "Yellow"
Since for me, at this moment, it is impossible to let this indicator work as our eyes work, it will miss sometimes. I've tried to solve this by putting 3 different "Periods",
but it is not perfect, so look at it as an aiding tool, a "hint" so you can look in detail if there is something of importance or not.
What also helps is to switch timeframes.
For example on a 1 hour chart a "Highest" point can be missed sometimes, but could be perfectly visible on a 2 or 4 hour chart.
Also, try to change the numbers in a way that suits you the best.
Enjoy!
OBV EMA X BF 🚀Credit to Lancelot_Augur for the idea of EMAs of On Balance Volume.
The signals are generated when the faster OBV EMA crosses the slower one.
BACKGROUND COLORS:
Green = go long
Red = go short
White = you have been stopped out
This strategy uses a 3% stop loss.

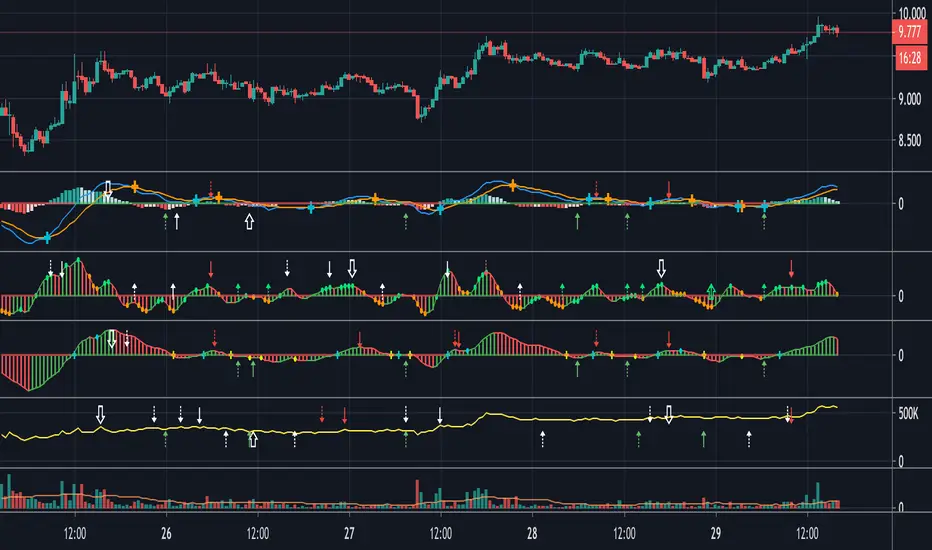
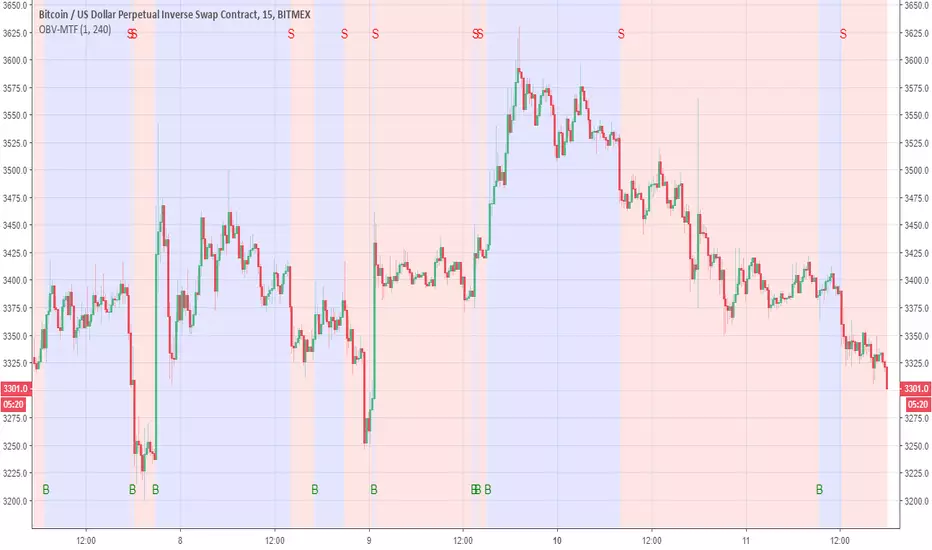
OBV-MTFUsing modified OBV volume equetion and using our modified MTF length (not need to use security so no repaint )
the Buy and Sell reresent in B and S and by the colors of bullish compare to bearish
You change the MTF by changing int2
in this example is set to 240 min MTF over 15 min charts
alerts inside
OBV based OscillatorHello World,
This is my first indicator born from my trading ideas.
This is basically an OBV based Osciallator.
Here are my advices for the users,
I generally use this indicator for day trading for 1 min and 5 min timeframes (Higher timeframes can be used)
Use this indicator for currencies with high volume and high volatility (Take some high risks!..)
There may be several trading strategies using this indicator. But, I prefer this risky strategy;
Enter when indicator passes OS line upwards
Wait until indicator passes OB level
Exit when slope of the indicator changes at the OB level
Happy trading,

OBV Daily ResetJust a quick OBV indicator for intraday trading that resets to 0 at the start of each new session (based on dayofmonth changes). I saw someone looking for this in chat and jotted it down for him.

Indicator: CCI coded OBVOBV is colored green if CCI > threshold, red if CCI < threshold.
Both "threshold" and "CCI Length" can be customized using the options page.
Indicator also displays a 13EMA (length can be changed) over OBV.

Intraday vs Overnight OBV🔍 Purpose
This indicator provides a volume-weighted cumulative flow model that mimics On-Balance Volume (OBV) logic but splits the volume impact into intraday vs. overnight sessions. It allows traders to track how volume contributes to price movement in each session and identify whether buying/selling pressure is stronger during or outside of regular trading hours.
This indicator attempts to alleviate some of the downfalls of the standard OBV indicator, which only looks at total volume and total direction. The price of stocks generally behaves extremely differently during market hours and outside market hours, and many of the large moves happen outside of regular market hours on low volume.
⚙️ Core Features
1) OBV-style calculation:
If price increases → volume is added to the OBV stream.
If price decreases → volume is subtracted.
If price is flat → OBV remains unchanged.
2) Session splitting:
Intraday session: movement from today's open to close.
Overnight session: movement from yesterday’s close to today’s open.
Volume is split proportionally between these two periods based on user input.
3) Four visualization modes:
"Intraday" — plots only OBV from intraday price movement.
"Overnight" — plots only OBV from overnight price movement.
"Aggregate" — plots the sum of intraday and overnight OBV for a holistic view.
"Both Intraday and Overnight" — plots intraday and overnight OBV separately on the same chart.
📐 Inputs
1) Synthetic OBV Type:
"Intraday" — Show OBV from open to close only.
"Overnight" — Show OBV from prior close to today's open only.
"Aggregate" — Show a single line combining both.
"Both Intraday and Overnight" — Show both lines on the same chart.
2) Estimated Overnight Volume %:
Percentage of total daily volume assumed to occur during extended hours.
The rest is allocated to regular session (intraday).
Default: 20% overnight, 80% intraday.
🧮 How It Works
Volume Splitting:
Total bar volume is split into overnight Volume and intraday Volume:
Intraday change is the difference between today’s close and open.
Overnight change is the difference between today’s open and yesterday’s close.
Session OBV Calculations:
OBV is incremented/decremented by the session's allocated volume, depending on whether the session’s price change was positive or negative.
Aggregate OBV:
Combines both session deltas for a holistic volume flow view.
📊 Interpretation
Rising OBV (any stream) suggests accumulation; falling OBV suggests distribution.
Divergences between price and OBV lines (especially overnight vs. intraday) can reveal where hidden buying/selling is occurring.
Comparing intraday vs overnight OBV can help:
Spot whether institutional demand is building off-hours.
Detect retail vs. institutional behavior (retail trades often dominate intraday; institutional may prefer after-hours).
💡 Use Cases
Identify whether overnight gaps are supported by overnight volume momentum.
Detect accumulation in low-volume overnight sessions.
Compare intraday and overnight strength during earnings season or news events.
Complement traditional OBV by seeing session-based breakdowns.

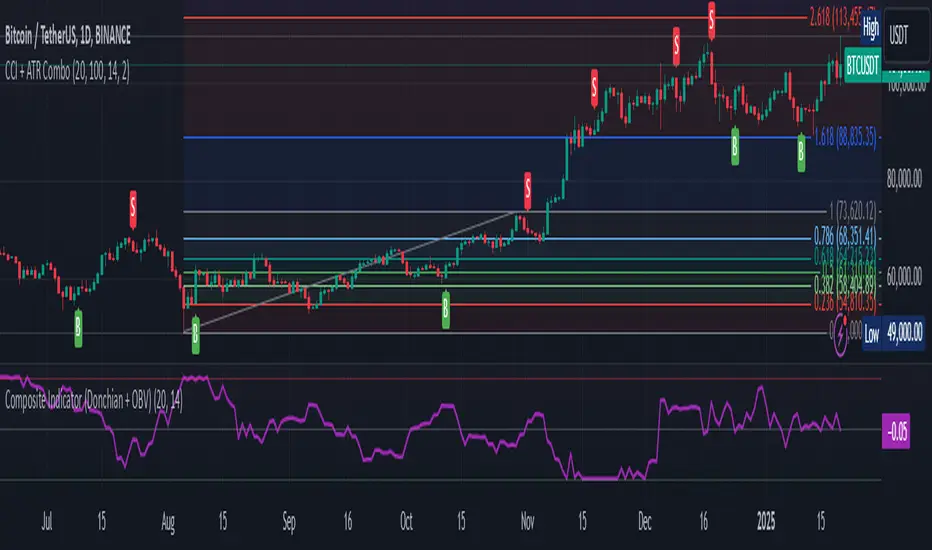
Composite Indicator (Donchian + OBV)Composite Indicator (Donchian + OBV)
The Composite Indicator (Donchian + OBV) is a powerful tool designed to evaluate the strength of market breakouts and momentum trends , offering traders a comprehensive perspective on price action. This indicator combines the Donchian Channel with On-Balance Volume (OBV) to create a dynamic and easy-to-interpret metric scaled between -1 and 1 .
Key Features
Breakout Strength Analysis:
- The indicator assesses the strength of price breakouts relative to the upper and lower bounds of the Donchian Channel.
- Positive values close to 1 indicate a strong bullish breakout.
- Negative values close to -1 indicate a strong bearish breakout.
Momentum Detection with OBV:
- On-Balance Volume (OBV) tracks the cumulative buying and selling volume to gauge market momentum.
- The smoothed OBV trend ensures the momentum component aligns with price action, reducing noise.
Integrated Composite Value:
- Combines breakout strength and OBV momentum into a single metric for enhanced clarity.
- The final composite value highlights whether the market is bullish, bearish, or neutral.
Divergence Detection:
- Spot bullish divergences when the indicator rises while price falls, suggesting a potential upward reversal.
- Identify bearish divergences when the indicator falls while price rises, hinting at a potential downward reversal.
How It Works
Donchian Channel Analysis:
- Calculates the highest high and lowest low over a user-defined period to establish the upper and lower channels .
- Breakouts beyond these channels contribute to the breakout strength component.
OBV Momentum:
- Measures cumulative volume trends to validate price movements.
- Momentum is derived from the rate of change in smoothed OBV values.
Composite Calculation:
- Combines breakout strength and OBV momentum, normalized and scaled to -1 to 1 for clarity.
How to Use
Bullish Breakout:
- When the indicator value approaches 1 , it signals a strong upward breakout supported by positive OBV momentum.
- Example Action: Consider a Buy if price breaks the upper Donchian Channel with increasing OBV.
Bearish Breakout:
- When the indicator value approaches -1 , it indicates a strong downward breakout supported by negative OBV momentum.
- Example Action: Consider a Sell if price breaks the lower Donchian Channel with decreasing OBV.
Neutral Market:
- When the value is near 0 , the market is likely balanced with no significant breakout or momentum detected.
Divergence Opportunities:
- Bullish Divergence: Price makes lower lows, but the indicator trends upward → Potential upward reversal.
- Bearish Divergence: Price makes higher highs, but the indicator trends downward → Potential downward reversal.
Customization Options
Donchian Channel Length: Adjust the period for the upper and lower bounds.
OBV Smoothing Length: Modify the smoothing period for OBV to fine-tune momentum detection.
Scaling Adjustments: The composite value is automatically normalized for consistency across timeframes.
Ideal Use Cases
Breakout Trading: Identify and confirm strong breakouts in volatile markets.
Momentum Confirmation: Validate price movements with volume-based momentum.
Reversal Detection: Leverage divergences to spot potential market reversals.
Example Applications
Strong Bullish Signal:
- Price breaks the upper channel , and OBV shows increasing volume → Composite value near 1 .
- Action: Enter a Buy position and set a Stop Loss below the upper channel.
Strong Bearish Signal:
- Price breaks the lower channel , and OBV shows decreasing volume → Composite value near -1 .
- Action: Enter a Sell position and set a Stop Loss above the lower channel.
Neutral Market:
- Composite value near 0 suggests indecision or consolidation. Wait for a breakout.
Limitations
Best used alongside additional tools like RSI or MACD for filtering noise and improving decision-making.
Requires careful parameter tuning based on the asset and timeframe.
Final Thoughts
The Composite Indicator (Donchian + OBV) offers traders a versatile tool to navigate complex markets. By blending breakout analysis with volume-based momentum, this indicator provides an actionable edge for identifying high-probability opportunities and potential reversals.
MADALGO`s Enhanced OBV DivergencesDescription:
MADALGO's Enhanced OBV Divergences indicator is a unique tool designed for traders to visualize the divergences between price action and On Balance Volume (OBV), a fundamental aspect often indicative of underlying strength or weakness in the market. By keenly identifying these divergences, traders are better positioned to anticipate potential trend reversals or trend continuations, making this script an invaluable addition to their technical analysis toolkit.
This script meticulously scans for both regular and hidden bullish/bearish divergences, providing a comprehensive view of market sentiment. The core of this indicator is built around the OBV, which cumulatively adds or subtracts volume based on the price movement per period, thus providing a running total of volume and portraying the force behind the price movements.
The regular divergences are classic indicators of a potential reversal in the current trend, while hidden divergences are often indicative of trend continuation. These divergences are pinpointed based on the relative positions of the OBV and price highs/lows, over customizable lookback periods and within specified lookback ranges.
Features:
Regular and Hidden Divergences: Clearly marked bullish and bearish divergences provide insights into potential market turning points.
On Balance Volume (OBV) Line: Visualize the continuous flow of buying and selling pressure, enabling the identification of accumulation or distribution phases essential for understanding the market's strength or weakness.
Moving Average of OBV: An optional feature to smooth the OBV line, aiding in the identification of the overarching trend.
Dynamic Statistics Label: A floating label provides real-time updates on essential statistics like the Rate of Percentage Change (RPC) of OBV, the last divergences, and bars since the last divergences.
Inputs:
Pivot Lookback Right and Pivot Lookback Left: Define the lookback periods for identifying pivot points in the OBV line.
Max of Lookback Range and Min of Lookback Range: Define the range for considering divergences.
RPC Period: Defines the period for calculating the Rate of Percentage Change of the OBV.
MA Period: Defines the period for the optional moving average of the OBV.
Plot Bullish, Plot Hidden Bullish, Plot Bearish, Plot Hidden Bearish: Toggle visibility of respective divergences.
Plot Moving Average: Toggle visibility of the OBV moving average.
Usage:
Add the script to your TradingView chart.
Tailor the input parameters in the settings panel to align with your analysis requirements.
The divergences, OBV line, and optional moving average will be plotted on your chart, with a dynamic label displaying real-time statistics.
Set up alerts to be notified of identified divergences, enabling timely decision-making.
Alerts:
Regular bullish/bearish divergence in OBV found: Triggered when a regular bullish or bearish divergence is identified.
Hidden bullish/bearish divergence in OBV found: Triggered when a hidden bullish or bearish divergence is identified.
Underlying Concepts:
The OBV Divergences indicator is rooted in the principle that volume precedes price movement. When prices are rising with increased volume, it suggests that buying pressure is prevailing and may lead to continued upward momentum. Conversely, rising prices with decreasing volume might indicate a lack of buying conviction and could signal a potential price reversal. The identification of divergences between price and OBV can therefore serve as a powerful signal for traders. These examples can be seen below in the image
The Moving Average of the OBV further aids in understanding the prevailing trend by smoothing out the OBV line, providing a clearer picture of the market's longer-term momentum. The Rate of Percentage Change (RPC) provides insight into the momentum of volume, offering an additional layer of analysis. Together, these additional features enhance the core OBV analysis, enabling a more nuanced understanding of volume dynamics fundamental for making more informed trading decisions.
License:
This Source Code Form is subject to the terms of the Mozilla Public License, v. 2.0. If a copy of the MPL was not distributed with this file, you can obtain one at Mozilla Public License 2.0.
