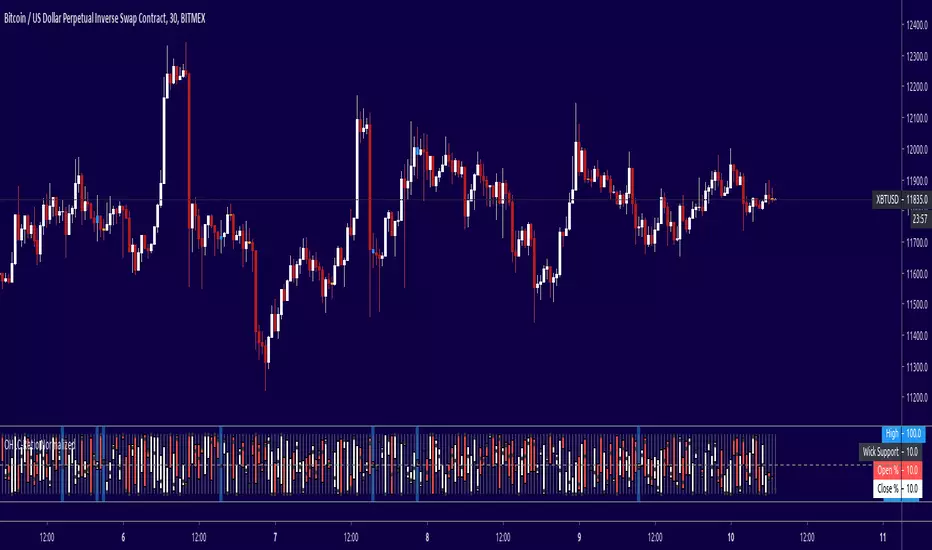
OHLC ToolOHLC Tool allows you to display Current or Historical OHLC Values as horizontal lines that extend to the right on your chart.
Features
Variable Lookback to display a specific historical bar's values. Default = 1 (Previous Candle)
Customizable Timeframe to view HTF Candle values.
Custom Line Colors, Styles, and Thicknesses.
Price Scale Value Display Capability.
For displaying the line values and labels on the price scale you will need to enable:
"Indicator and financials name labels"
and
"Indicator and financials value labels"
These options are found in the Price Scale Menu under Labels. Price Scale Menu > Labels
When you do this you will notice your other indicator values will also be on the price scale,
if you wish to disable these, go to the indicator settings under the "Style" Tab, Uncheck the "Labels on price scale" box.
Indicator Settings > Style > "Labels on price scale"
Enjoy!
Cari dalam skrip untuk "OHLC"

OHLC📕 LIBRARY OHLC
🔷 Introduction
This library is a custom library designed to work with real-time bars. It allows to easily calculate OHLC values for any source.
Personally, I use this library to accurately display the highest and lowest values on visual indicators such as my progress bars.
🔷 How to Use
◼ 1. Import the OHLC library into your TradingView script:
import cryptolinx/OHLC/1
- or -
Instead of the library namespace, you can define a custom namespace as alias.
import cryptolinx/OHLC/1 as src
◼ 2. Create a new OHLC source using the `new()` function.
varip mySrc = OHLC.new() // It is required to use the `varip` keyword to init your ``
- or -
If you has set up an alias before.
varip mySrc = src.new()
===
In that case, your `` needs to be `na`, define your object like that
varip mySrc = na
◼ 3. Call the `hydrateOHLC()` method on your OHLC source to update its values:
Basic
float rsi = ta.rsi(close, 14)
mySrc.hydrateOHLC(rsi)
- or -
Inline
rsi = ta.rsi(close, 14).hydrateOHLC(mySrc)
◼ 4. The data is accessible under their corresponding names.
mySrc.open
mySrc.high
mySrc.low
mySrc.close
🔷 Note: This library only works with real-time bars and will not work with historical bars.

Madrid Upper OHLCThis study displays the candlesticks of the upper timeframe, this provides a glance of the bigger picture in the current time frame by quickly and easily identifying the main OHLC levels.
In this example I am using the indicator twice on the 15 min chart, the first implementation displays the candles of the Daily timeframe and the second displays those of the weekly.

OHLC Daily Resolution BandsShout out to nPE- for the idea.
Bands made with stdev from 10 day OHLC.
Keeps resolution to daily, so you can use bands as daily pivots for day trading.
Upper band 1=yesterday close + 0.5 std(ohlc,10)
Upper band 1=yesterday close + 1 std(ohlc,10)
Mid=yesterday close
Lower band 1=yesterday close - 0.5 std(ohlc,10)
Lower band 2=yesterday close - 1 std(ohlc,1

OHLC [TFO]Keep higher timeframe OHLC in mind by watching the candle form on LTF charts. Inspired by ICT concepts, specifically concerning the daily OHLC.

OHLC Lines – Yesterday & Today (Minimalist Option)This indicator draws horizontal lines representing the Open, High, Low, and Close (OHLC) levels of yesterday and today directly on your chart. It automatically updates each day, showing only the lines for the previous day and the current day, keeping your chart clean and focused.
Features:
Display Yesterday’s OHLC levels.
Display Today’s OHLC levels.
Optional Minimalist Mode with customizable color, width, and line style.
Lines automatically update each day and remove old lines.
Fully customizable colors, visibility, and line width for each OHLC level.
Use Case:
Perfect for traders who want to monitor key daily price levels, identify support/resistance zones, or incorporate OHLC levels into intraday strategies.

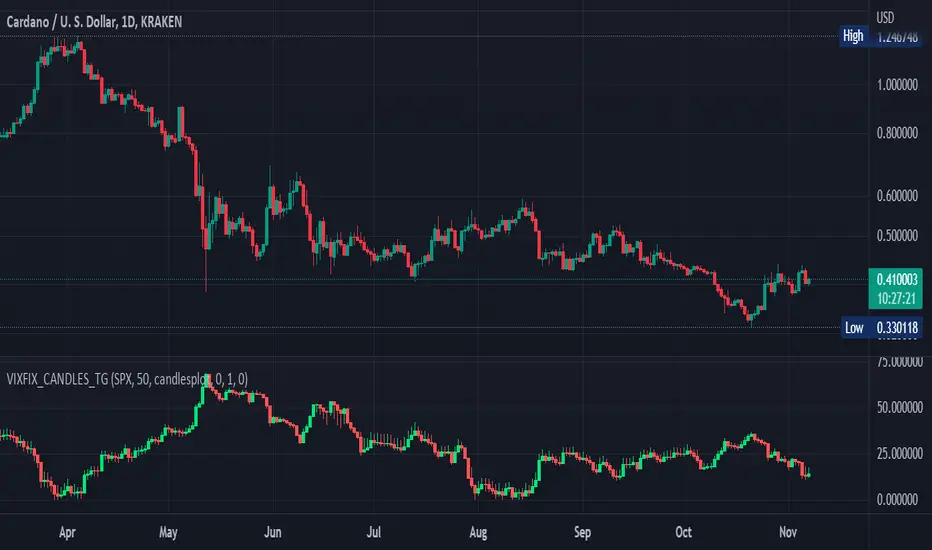
Williams Vix Fix OHLC candles plot indicator (Tartigradia)OHLC candles plot of the Williams VixFix indicator, which allows to draw trend lines.
Williams VixFix is a realized volatility indicator developed by Larry Williams, and can help in finding market bottoms.
Indeed, as Williams describe in his paper, markets tend to find the lowest prices during times of highest volatility, which usually accompany times of highest fear. The VixFix is calculated as how much the current low price statistically deviates from the maximum within a given look-back period.
The Williams VixFix indicator is usually presented as a curve or histogram. The novelty of this indicator is to present the data as a OHLC candles plot: whereas the original Williams VixFix calculation only involves the close value, we here use the open, high and low values as well. This led to some mathematical challenges because some of these calculations led to absurd values, so workarounds had to be found, but in the end I think the result was worth it, it reproduces the VIX chart quite well.
A great additional value of the OHLC chart is that it shows not just the close value, but all the values during the session: open, high and low in addition to close. This allows to draw trend lines and can provide additional information on momentum and sentiment. In addition, other indicators can be used on it, as if it was a price chart, such as RSI indicators (see RSI+ (alt) indicator for example).
For more information on the Vix Fix, which is a strategy published under public domain:
The VIX Fix, Larry Williams, Active Trader magazine, December 2007, web.archive.org
Fixing the VIX: An Indicator to Beat Fear, Amber Hestla-Barnhart, Journal of Technical Analysis, March 13, 2015, ssrn.com
Replicating the CBOE VIX using a synthetic volatility index trading algorithm, Dayne Cary and Gary van Vuuren, Cogent Economics & Finance, Volume 7, 2019, Issue 1, doi.org
This indicator includes only the Williams VixFix as an OHLC candles or bars plot, and price / vixfix candles plot, as well as the typical vixfix histogram. Indeed, it is much more practical for unbounded range indicators to be plotted in their own separate panel, hence why this indicator is released separately, so that it can work and be scaled adequately out of the box.
Note that the there are however no bottom buy signals. For a more complete indicator, which also includes the OHLC candles plots present here, but also bottom signals and Inverse VixFix (top signals), see:
Set Index symbol to SPX, and index_current = false, and timeframe Weekly, to reproduce the original VIX as close as possible by the VIXFIX (use the Add Symbol option, because you want to plot CBOE:VIX on the same timeframe as the current chart, which may include extended session / weekends). With the Weekly timeframe, off days / extended session days should not change much, but with lower timeframes this is important, because nights and weekends can change how the graph appears and seemingly make them different because of timing misalignment when in reality they are not when properly aligned.
OHLC MTFThe script allows you to plot the opening, highest, lowest and closing (ohlc) values of a previous candle.
Settings :
- "Time Frame" : allows you to choose the reference time frame;
- "Offset" : sets which candle to select the data from.
Ex : If you select "1 day" as the time frame and "1" as the offset, the OHLC values of yesterday's daily candle will be displayed (regardless of your current time frame).

OHLCVDataOHLCV Data Power Library
Multi-Timeframe Market Data with Mathematical Precision
📌 Overview
This Pine Script library provides structured OHLCV (Open, High, Low, Close, Volume) data across multiple timeframes using mathematically significant candle counts (powers of 3). Designed for technical analysts who work with fractal market patterns and need efficient access to higher timeframe data.
✨ Key Features
6 Timeframes: 5min, 1H, 4H, 6H, 1D, and 1W data
Power-of-3 Candle Counts: 3, 9, 27, 81, and 243 bars
Structured Data: Returns clean OHLCV objects with all price/volume components
Pine Script Optimized: Complies with all security() call restrictions
📊 Timeframe Functions
pinescript
f_get5M_3() // 3 candles of 5min data
f_get1H_27() // 27 candles of 1H data
f_get1D_81() // 81 candles of daily data
// ... and 27 other combinations
🚀 Usage Example
pinescript
import YourName/OHLCVData/1 as OHLCV
weeklyData = OHLCV.f_get1W_27() // Get 27 weekly candles
latestHigh = array.get(weeklyData, 0).high
plot(latestHigh, "Weekly High")
💡 Ideal For
Multi-timeframe analysis
Volume-profile studies
Fractal pattern detection
Higher timeframe confirmation
⚠️ Note
Replace "YourName" with your publishing username
All functions return arrays of OHLCV objects
Maximum lookback = 243 candles
📜 Version History
1.0 - Initial release (2024)

Multi Bar OHLC Compare Panel (Floating Grid)Multi Bar OHLC Compare Panel by RagingRocketBull 2019
version 1.0
This indicator lets you compare OHLCV values from several specified bars. Bars can be dynamic/persistent.
You can also use it as an alternate OHLC panel if you don't like small font of the native TradingView panel.
It uses Pinescript v4 to output data dynamically as string labels in a horiz/vertical grid.
Features:
- Floating Panel with customizable horiz/vertical layout and grid spacing
- Support for up to 5 OHLC bars (highlighted with markers)
- Outputs Bar #/index, OHLCV, Bar Change Value/%, Exchange/Ticker, Timeframe, Timestamp strings
- Dynamic (fixed offset)/Persistent bars (fixed time)
- Show/Hide parts of strings
- Full output string customization, including text size, date/time format and delimiters
- 2 Anchor points for panel offset: cur bar high or range high
- Bar Change can change color
Usage:
- specify at least 1 bar index as OHLC source
- select anchor point to position the panel
- select horiz/vertical grid layout
- adjust horiz/vertical spacing
- customize output strings as needed
Notes:
- this indicator uses Pinescript v3 Compatibity Framework
- both bars 1,2 are required for log scale adjustment to work
- you can't attach the panel to screen's top/bottom and must use offset/anchor because, unlike plotshape, string labels don't support yloc=yloc.top/bottom, only yloc.above/belowbar
- you can't precisely align strings in a grid because there's no label.get_width/height to calculate mid/left points, only get_x/y/text. Alignment will break depending on string length, zoom and change color option on/off
- bar change is rendered as a separate label when change color is enabled (2 panels total) and merged into the main panel when disabled (single panel)
- you can't change the order of strings as playing with the natural order of things isn't the best of ideas
- you can modify the script to compare up to 50 OHLC bars, but do you need that much power? Of course, you do.
- you can't set color/style for string labels in Style UI, so a few extra settings were added.
- bar index is limited to 5000 for free accounts (10000 for paid), will show an error when exceeded, also when it exceeds the total number of bars in history
- in persistent bars mode all bars with index > 0 are considered persistent, bar 0 always remains a dynamic bar
- persistent bars' offset is reset: in replay mode on exit or when price reaches cur bar, or when panel layout is changed from h to v in both replay/realtime modes
- initial pos of each persistent bar relative to the first realtime bar anchor doesn't change during session - new persistent bars introduced during session are attached to the most recent cur bar anchor
P.S. Everything is proceeding as I have foreseen

Price Displacement - Candlestick (OHLC) CalculationsA Magical little helper friend for Candle Math.
When composing scripts, it is often necessary to manipulate the math around the OHLC. At times, you want a scalar (absolute) value others you want a vector (+/-). Sometimes you want the open - close and sometimes you want just the positive number of the body size. You might want it in ticks or you might want it in points or you might want in percentages. And every time you try to put it together you waste precious time and brain power trying to think about how to properly structure what you're looking for. Not to mention it's normally not that aesthetically pleasing to look at in the code.
So, this fixes all of that.
Using this library. A function like 'pd.pt(_exp)' can call any kind of candlestick math you need. The function returns the candlestick math you define using particular expressions.
Candle Math Functions Include:
Points:
pt(_exp) Absolute Point Displacement. Point quantity of given size parameters according to _exp.
vpt(_exp) Vector Point Displacement. Point quantity of given size parameters according to _exp.
Ticks:
tick(_exp) Absolute Tick Displacement. Tick quantity of given size parameters according to _exp.
vtick(_exp) Vector Tick Displacement. Tick quantity of given size parameters according to _exp.
Percentages:
pct(_exp, _prec) Absolute Percent Displacement. (w/rounding overload). Percent quantity of bar range of given size parameters according to _exp.
vpct(_exp, _prec) Vector Percent Displacement (w/rounding overload). Percent quantity of bar range of given size parameters according to _exp.
Expressions You Can Use with Formulas:
The expressions are simple (simple strings that is) and I did my best to make them sensible, generally using just the ohlc abreviations. I also included uw, lw, bd, and rg for when you're just trying to pull a candle component out. That way you don't have to think about which of the ohlc you're trying to get just use pd.tick("uw") and now the variable is assigned the length of the upper wick, absolute value, in ticks. If you wanted the vector in pts its pd.vpt("uw"). It also makes changing things easy too as I write it out.
Expression List:
Combinations
"oh" = open - high
"ol" = open - low
"oc" = open - close
"ho" = high - open
"hl" = high - low
"hc" = high - close
"lo" = low - open
"lh" = low - high
"lc" = low - close
"co" = close - open
"ch" = close - high
"cl" = close - low
Candle Components
"uw" = Upper Wick
"bd" = Body
"lw" = Lower Wick
"rg" = Range
Pct() Only
"scp" = Scalar Close Position
"sop" = Scalar Open Position
"vcp" = Vector Close Position
"vop" = Vector Open Position
The attributes are going to be available in the pop up dialogue when you mouse over the function, so you don't really have to remember them. I tried to make that look as efficient as possible. You'll notice it follows the OHLC pattern. Thus, "oh" precedes "ho" (heyo) because "O" would be first in the OHLC. Its a way to help find the expression you're looking for quickly. Like looking through an alphabetized list for traders.
There is a copy/paste console friendly helper list in the script itself.
Additional Notes on the Pct() Only functions:
This is the original reason I started writing this. These concepts place a rating/value on the bar based on candle attributes in one number. These formulas put a open or close value in a percentile of the bar relative to another aspect of the bar.
Scalar - Non-directional. Absolute Value.
Scalar Position: The position of the price attribute relative to the scale of the bar range (high - low)
Example: high = 100. low = 0. close = 25.
(A) Measure price distance C-L. How high above the low did the candle close (e.g. close - low = 25)
(B) Divide by bar range (high - low). 25 / (100 - 0) = .25
Explaination: The candle closed at the 25th percentile of the bar range given the bar range low = 0 and bar range high = 100.
Formula: scp = (close - low) / (high - low)
Vector = Directional.
Vector Position: The position of the price attribute relative to the scale of the bar midpoint (Vector Position at hl2 = 0)
Example: high = 100. low = 0. close = 25.
(A) Measure Price distance C-L: How high above the low did the candle close (e.g. close - low = 25)
(B) Measure Price distance H-C: How far below the high did the candle close (e.g. high - close = 75)
(C) Take Difference: A - B = C = -50
(D) Divide by bar range (high - low). -50 / (100 - 0) = -0.50
Explaination: Candle close at the midpoint between hl2 and the low.
Formula: vcp = { / (high - low) }
Thank you for checking this out. I hope no one else has already done this (because it took half the day) and I hope you find value in it. Be well. Trade well.
Library "PD"
Price Displacement
pt(_exp) Absolute Point Displacement. Point quantity of given size parameters according to _exp.
Parameters:
_exp : (string) Price Parameter
Returns: Point size of given expression as an absolute value.
vpt(_exp) Vector Point Displacement. Point quantity of given size parameters according to _exp.
Parameters:
_exp : (string) Price Parameter
Returns: Point size of given expression as a vector.
tick(_exp) Absolute Tick Displacement. Tick quantity of given size parameters according to _exp.
Parameters:
_exp : (string) Price Parameter
Returns: Tick size of given expression as an absolute value.
vtick(_exp) Vector Tick Displacement. Tick quantity of given size parameters according to _exp.
Parameters:
_exp : (string) Price Parameter
Returns: Tick size of given expression as a vector.
pct(_exp, _prec) Absolute Percent Displacement (w/rounding overload). Percent quantity of bar range of given size parameters according to _exp.
Parameters:
_exp : (string) Expression
_prec : (int) Overload - Place value precision definition
Returns: Percent size of given expression as decimal.
vpct(_exp, _prec) Vector Percent Displacement (w/rounding overload). Percent quantity of bar range of given size parameters according to _exp.
Parameters:
_exp : (string) Expression
_prec : (int) Overload - Place value precision definition
Returns: Percent size of given expression as decimal.

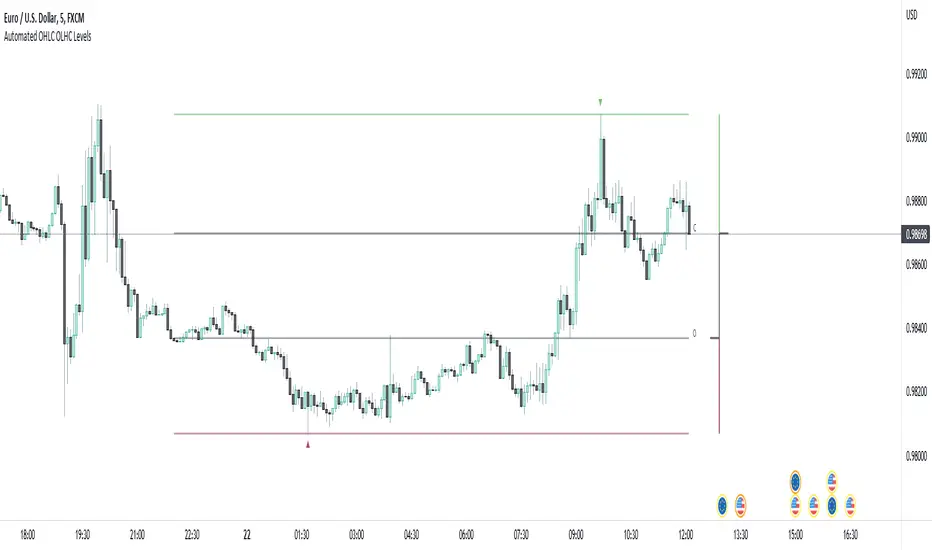
Clean OHLC Lines | BaksPlots clean, non-repainting OHLC lines from higher timeframes onto your chart. Ideal for tracking key price levels (open, high, low, close) with precision and minimal clutter.
Core Functionality
Clean OHLC Lines = Historical Levels + Non-Repainting Logic
• Uses lookahead=on to anchor historical lines, ensuring no repainting.
• Displays OHLC lines for customizable timeframes (15min to Monthly).
• Optional candlestick boxes for visual context.
Key Features
• Multi-Timeframe OHLC:
Plot lines from 15min, 30min, 1H, 4H, Daily, Weekly, or Monthly timeframes.
• Non-Repainting Logic:
Historical lines remain static and never recalculate.
• Customizable Styles:
Adjust colors, line widths (1px-4px), and transparency for high/low/open/close lines.
• Candle Display:
Toggle candlestick boxes with bull/bear colors and adjustable borders.
• Past Lines Limit:
Control how many historical lines are displayed (1-500 bars).
User Inputs
• Timeframe:
Select the OHLC timeframe (e.g., "D" for daily).
• # Past Lines:
Limit historical lines to avoid overcrowding (default: 10).
• H/L Mode:
Draw high/low lines from the current or previous period.
• O/C Mode:
Anchor open/close lines to today’s open or yesterday’s close.
• Line Styles:
Customize colors, transparency, and styles (solid/dotted/dashed).
• Candle Display:
Toggle boxes/wicks and adjust bull/bear colors.
Important Notes
⚠️ Alignment:
• Monthly/weekly timeframes use fixed approximations (30d/7d).
• For accuracy, ensure your chart’s timeframe ≤ the selected OHLC timeframe (e.g., use 1H chart for daily lines).
⚠️ Performance:
• Reduce # Past Lines on low-end devices for smoother performance.
Risk Disclaimer
Trading involves risk. OHLC lines reflect historical price levels and do not predict future behavior. Use with other tools and risk management.
Open-Source Notice
This script is open-source under the Mozilla Public License 2.0. Modify or improve it freely, but republishing must follow TradingView’s House Rules.
📈 Happy trading!

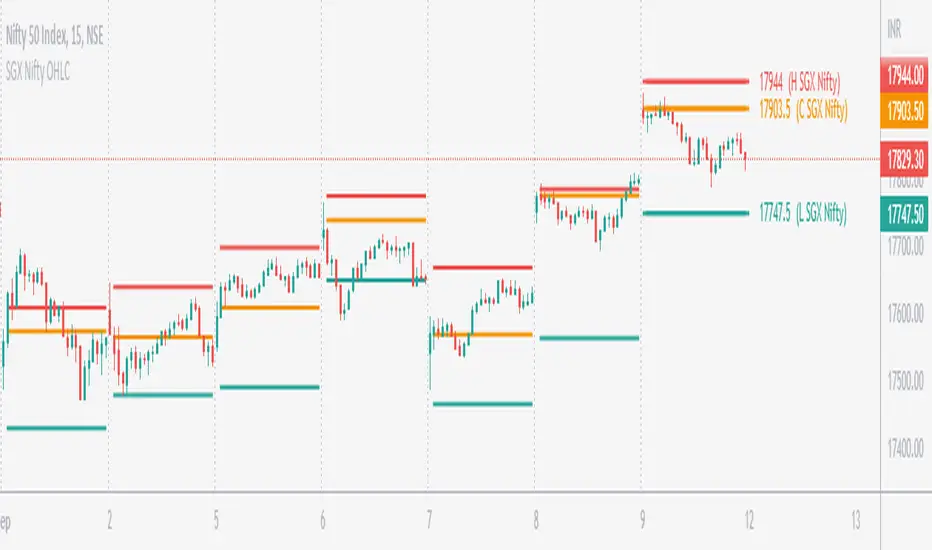
SGX Nifty OHLC for Nifty 50 IndexSGX Nifty OHLC for Nifty 50 Index
What is this Indicator?
• This indicator calculates the OHLC levels of SGX Nifty.
How does SGX Nifty impact NIFTY and the Indian Market?
• Helps in predicting NIFTY50 Index behavior.
• The closing price of today's 9.14 am (IST) SGX Nifty will be the Open of today's Nifty50 Open. This helps to determine the opening Gap of Nifty50.
• SGX Nifty OHLC levels can act as support and resistance in Nifty50.
Who to use?
• Beneficial for Day Traders, who trade in NIFTY Index.
What timeframe to use?
• Use 1 minute for better accuracy.
• Other timeframes will also work.
Important Note
• Use 1 min timeframe for accurate OHLC.
• In other timeframes OHLC will have negligible difference, it won't be huge.
• This indicator will appear only on NIFTY Index and Futures chart.
• To hide the warning label go to the indicator Menu.
Previous OHLCThe scripts places horizontal levels on your charts indicating the previous Daily, Weekly or Monthly OHLC values over the current timeframe.
Slightly modified version of Nanda86's "Previous OHLC" script. I corrected a couple of bugs and added more control over colors and labels in general. I also removed the hourly OHLCs.

Automated OHLC OLHC LevelsA simple, clean, effective visualization tool, for the OHLC or OLHC of a chosen candle/timeframe.
Apply this indicator using a higher timeframe, in conjunction with other levels and the directional bias, to easily recognize trading opportunities at lower timeframes.
Yesterday's RTH&ON sessions OHLCsThe indicator plots the OHLC levels of both trading sessions of the day before: the overnight session and the Regular Trading Hours.

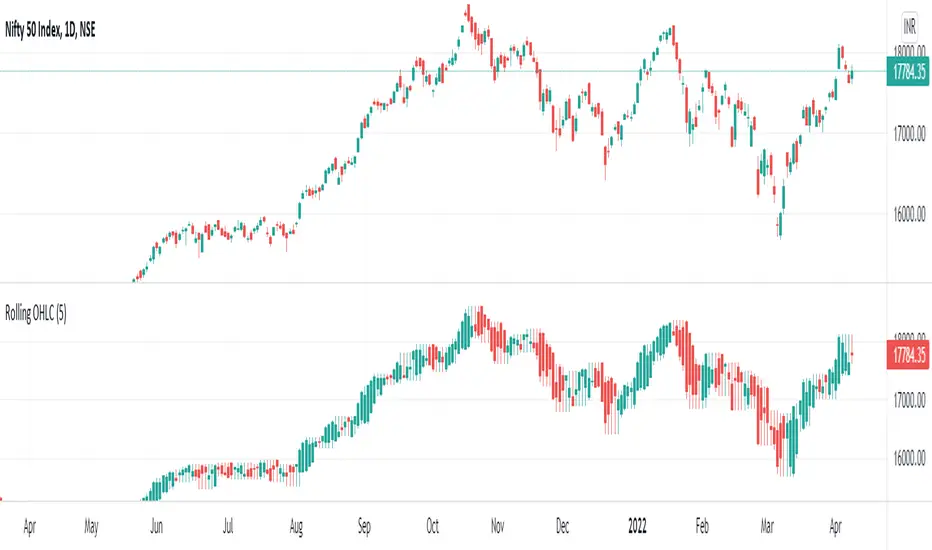
Rolling OHLC Candles█ OVERVIEW
This indicator displays a Rolling OHLC Bars for a given timeframe Multiplier. Contrary to OHLC Charts, if the timeframe Multiplier is "5", this indicator plot OHLC of the last 5 Candles.
█ WHAT IS THE NEED FOR IT
Let's see if we want to use a Higher timeframe OHLC Data using security function or resolution options. The indicator repaints until the higher timeframe OHLC Candle closes, leading to a repainting strategy or indicator using higher-timeframe data. So we can use Rolling OHLC Candles in these cases.
█ USES
To Pull out higher timeframe OHLC Data to build a non-repainting strategy or indicator.
Prominently, traders use Heikin Ashi Candles to locate trends or trading opportunities easier than traditional candlesticks. But the OHLC in those Heikin Ashi candles doesn't match with conventional candlesticks. We can use these Rolling OHLC Candles as an alternative for Heikin Ashi Candles because Here we can locate trends or trading opportunities easier than traditional candlesticks, and also close of these candles matches the close of the standard candlesticks, which can help us to take trades based on the close of the candles.
█ WHY I AM BUILDING THIS SIMPLE INDICATOR
There is no doubt higher timeframe analysis is a critical study to mastering the markets.
I found a necessity for an indicator that analyses multiple higher timeframes and gives us a cumulative or average trend direction. I already built the indicator; I will release it soon. The Indicator I am building is wholly based on my understanding and perspective of Market Structure. Please use this indicator idea to remove the repainting issue when you make an indicator that utilises higher timeframe data.
I am using this in my upcoming indicators. Felt to share before head.
Stay Tuned...
If you have any recommendations or alternative ideas, then please drop a comment under the script ;)
OHLC/4 Daily vs Quarterly CrossOHLC/4 Daily vs Quarterly Cross
The "OHLC/4 Daily vs Quarterly Cross" indicator is a powerful tool designed to provide traders with insights into trend alignment and potential market turning points. By calculating the average of the open, high, low, and close prices (OHLC/4), this script compares the daily average price action with the quarterly average to identify significant crossover events.
This indicator features two distinct lines: the Daily OHLC/4 and the Quarterly OHLC/4, each plotted in different colors for easy differentiation. A crossover occurs when the daily OHLC/4 moves above the quarterly average, potentially signaling bullish momentum or a shift in market direction. Conversely, a crossunder marks the daily OHLC/4 moving below the quarterly level, indicating potential bearish sentiment or a reversal.
With real-time plotting and built-in alert conditions, this script enables traders to stay ahead of critical market movements by setting automated notifications for crossover events. Whether you're seeking to confirm trends or identify new opportunities, the "OHLC/4 Daily vs Quarterly Cross" delivers clarity and actionable insights for more informed decision-making.

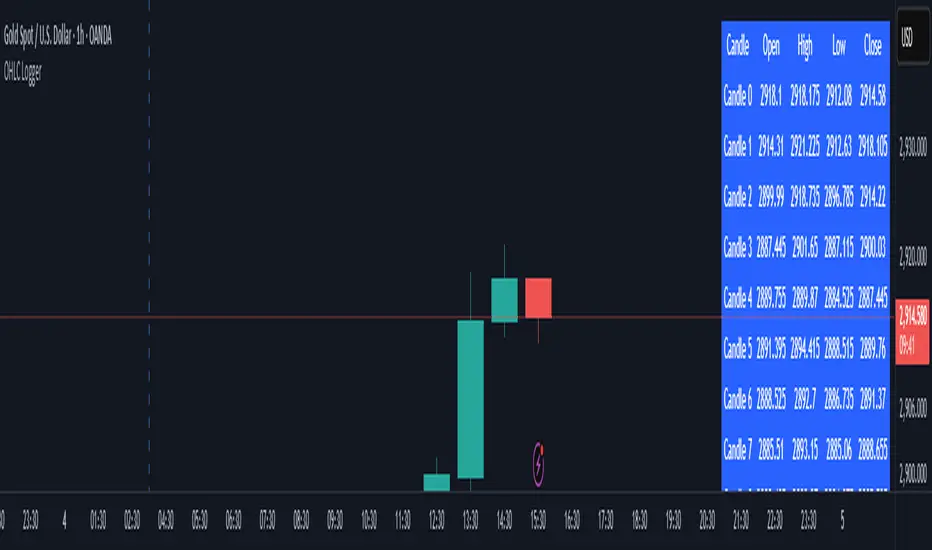
OHLC LoggerOHLC OG - 10 Candles
The OHLC OG - 10 Candles indicator provides a clear visualization of price action by analyzing the Open, High, Low, and Close (OHLC) data of the last 10 candles. Designed for traders who rely on structured price patterns, this indicator helps in identifying market trends, key support and resistance zones, and potential breakout points.
Features:
✅ Tracks the last 10 candles to highlight significant price movements.
✅ Visualizes Open, High, Low, and Close levels for improved market analysis.
✅ Customizable settings for enhanced adaptability to different strategies.
✅ Works across all timeframes and assets (forex, stocks, crypto, etc.).
✅ Ideal for price action traders looking for structured market insights.
This indicator is perfect for traders who prefer clean and reliable price action analysis without unnecessary complexity. Whether you trade breakouts, trend reversals, or continuation patterns, OHLC OG - 10 Candles helps you stay ahead of the market.
🔹 How to Use:
Apply the indicator to your chart and observe how the OHLC levels react to price movements.
Use it to confirm trends, identify potential breakout zones, or refine entry/exit points.
Combine it with other indicators or strategies for a more comprehensive trading approach.
📌 Disclaimer: This indicator is for educational purposes only. Always conduct proper risk management before trading.
Structures OHLCThis will mark the:
Previous month OHLC
Last week OHLC
Current week open
Yesterday OHLC
2 days ago OHLC

Simple OHLC Custom Range Interactive█ OVERVIEW
This indicator show lines of OHLC which can be commonly used as support and resistance zones.
OHLC can be shown table with candlestick visual.
Color of candlestick depends on direction of bullish / bearish of the chosen candlestick.
█ INSPIRATION
Inspired by design, code and usage of CAGR . Basic usage of custom range / interactive, pretty much explained here . Credits to TradingView .
█ FEATURES
Table can positioned by any position and font size can be resized.
OHLC can be in full or simple name.
Lines can be extend either right, left, both or none.
█ HOW TO USE
Only 1 point is required.
Dont worry about magnet, point will attached depends on High or Low of the candle.
█ USAGE / TIPS EXAMPLES (Description explained in each image)

Weekly OHLC LevelsWeekly OHLC Levels Indicator
This indicator plots the previous week's open, high, low, and close (OHLC) levels on the chart for the entire duration of the current week. These levels can be critical for identifying key support and resistance zones, as they often represent psychological levels that traders watch closely.
Features:
Plots previous week’s High (green), Low (red), Open (blue), and Close (purple).
Levels remain visible throughout the current week, providing consistent reference points.
Helps in visualizing how current price action interacts with last week’s important levels.
How to Use:
Use these levels to gauge potential support and resistance areas.
Monitor price reactions around these levels, especially during the beginning of the week, as they can serve as pivot points.
This indicator is suitable for all markets and timeframes, providing valuable insight into price structure relative to weekly market behavior.
