Money Flow ExtendedMoney Flow Extended (MF)
Definition
The Money Flow Extended (MF) indicator brings together the functionality of the Money Flow Index indicator (MFI) , a tool created by Gene Quong and Avrum Soudack and used in technical analysis for measuring buying and selling pressure, and The Relative Strength Index (RSI) , a well versed momentum based oscillator created by J.Welles Wilder Jr., which is used to measure the speed (velocity) as well as the change (magnitude) of directional price movements.
History
As the Money Flow Index (MFI) is quite similar to The Relative Strength Index (RSI), essentially the RSI with the added aspect of volume, adding a Moving Average, divergence calculation, oversold and overbought gradients, facilitates the transition from RSI, making the use of MFI pretty similar.
What to look for
Overbought/Oversold
When momentum and price rise fast enough, at a high enough level, eventual the security will be considered overbought. The opposite is also true. When price and momentum fall far enough, they can be considered oversold. Traditional overbought territory starts above 80 and oversold territory starts below 20. These values are subjective however, and a technical analyst can set whichever thresholds they choose.
Divergence
MF Divergence occurs when there is a difference between what the price action is indicating and what MF is indicating. These differences can be interpreted as an impending reversal. Specifically, there are two types of divergences, bearish and bullish.
Bullish MFI Divergence – When price makes a new low but MF makes a higher low.
Bearish MFI Divergence – When price makes a new high but MF makes a lower high.
Failure Swings
Failure swings are another occurrence which can lead to a price reversal. One thing to keep in mind about failure swings is that they are completely independent of price and rely solely on MF. Failure swings consist of four steps and are considered to be either Bullish (buying opportunity) or Bearish (selling opportunity).
Bullish Failure Swing
MF drops below 20 (considered oversold).
MF bounces back above 20.
MF pulls back but remains above 20 (remains above oversold)
MF breaks out above its previous high.
Bearish Failure Swing
MF rises above 80 (considered overbought)
MF drops back below 80
MF rises slightly but remains below 80 (remains below overbought)
MF drops lower than its previous low.
Summary
The Money Flow Extended (MF) can be a very valuable technical analysis tool. Of course, MF should not be used alone as the sole source for a trader’s signals or setups. MF can be combined with additional indicators or chart pattern analysis to increase its effectiveness.
Inputs
Length
The time period to be used in calculating the MF. 14 is the default.
Pivot Loopback
After how many bars you want the divergence to show, on the scale of 1-5. 5 is the default.
Calculate Divergence
Calculating divergences is needed in order for divergence alerts to fire.
Moving Average section
You can learn more about the inputs in the "Moving Average" section in this Help Center article .
Style
MF
Can toggle the visibility of the MF as well as the visibility of a price line showing the actual current value of the MF. Can also select the MF Line's color, line thickness and visual style.
MF-based MA
Can toggle the visibility of the MF-based MA as well as the visibility of a price line showing the actual current MA value. Can also select its color, line thickness and line style.
MF Upper Band
Can toggle the visibility of the Upper Band as well as sets the boundary, on the scale of 1-100, for the Upper Band (80 is the default). The color, line thickness and line style can also be determined.
MF Middle Band
Can toggle the visibility of the Middle Band as well as sets the boundary, on the scale of 1-100, for the Middle Band (50 is the default). The color, line thickness and line style can also be determined.
MF Lower Band
Can toggle the visibility of the Lower Band as well as sets the boundary, on the scale of 1-100, for the Lower Band (20 is the default). The color, line thickness and line style can also be determined.
MF Background Fill
Toggles the visibility of a Background color within the MF's boundaries. Can also change the Color itself as well as the opacity.
Overbought Gradient Fill
Can toggle the visibility of the Overbought Gradient Fill. Can also select its colors combination.
Oversold Gradient Fill
Can toggle the visibility of the Oversold Gradient Fill. Can also select its colors combination.
Precision
Sets the number of decimal places to be left on the indicator's value before rounding up. The higher this number, the more decimal points will be on the indicator's value.
Cari dalam skrip untuk "Relative"

RS Cycles [QuantVue]The RS Cycles indicator is a technical analysis tool that expands upon traditional relative strength (RS) by incorporating Beta-based adjustments to provide deeper insights into a stock's performance relative to a benchmark index. It identifies and visualizes positive and negative performance cycles, helping traders analyze trends and make informed decisions.
Key Concepts:
Traditional Relative Strength (RS):
Definition: A popular method to compare the performance of a stock against a benchmark index (e.g., S&P 500).
Calculation: The traditional RS line is derived as the ratio of the stock's closing price to the benchmark's closing price.
RS=Stock Price/Benchmark Price
Usage: This straightforward comparison helps traders spot periods of outperformance or underperformance relative to the market or a specific sector.
Beta-Adjusted Relative Strength (Beta RS):
Concept: Traditional RS assumes equal volatility between the stock and benchmark, but Beta RS accounts for the stock's sensitivity to market movements.
Calculation:
Beta measures the stock's return relative to the benchmark's return, adjusted by their respective volatilities.
Alpha is then computed to reflect the stock's performance above or below what Beta predicts:
Alpha=Stock Return−(Benchmark Return×β)
Significance: Beta RS highlights whether a stock outperforms the benchmark beyond what its Beta would suggest, providing a more nuanced view of relative strength.
RS Cycles:
The indicator identifies positive cycles when conditions suggest sustained outperformance:
Short-term EMA (3) > Mid-term EMA (10) > Long-term EMA (50).
The EMAs are rising, indicating positive momentum.
RS line shows upward movement over a 3-period window.
EMA(21) > 0 confirms a broader uptrend.
Negative cycles are marked when the opposite conditions are met:
Short-term EMA (3) < Mid-term EMA (10) < Long-term EMA (50).
The EMAs are falling, indicating negative momentum.
RS line shows downward movement over a 3-period window.
EMA(21) < 0 confirms a broader downtrend.
This indicator combines the simplicity of traditional RS with the analytical depth of Beta RS, making highlighting true relative strength and weakness cycles.

two_leg_spread_returns_zscoreThis script helps assess the relative returns of each leg in a two-legged spread. It shows the z-score of each period's returns, along with a moving average of the difference between the two returns. A negative moving average implies that the second leg is strengthening, on a relative return basis, against the first leg, and vice versa. The inputs are:
- timeframe: the timeframe for the calculations. the default is five minutes.
- leg1_sym: the symbol for the first leg
- leg2_sym: the symbol for the second leg
- ma_length: the length of the moving average. by default it is 48, or the previous four hours, given the default timeframe.
The default symbols are RB and HO, simply as an example of an intercommodity spread.

Poly Cycle [Loxx]This is an example of what can be done by combining Legendre polynomials and analytic signals. I get a way of determining a smooth period and relative adaptive strength indicator without adding time lag.
This indicator displays the following:
The Least Squares fit of a polynomial to a DC subtracted time series - a best fit to a cycle.
The normalized analytic signal of the cycle (signal and quadrature).
The Phase shift of the analytic signal per bar.
The Period and HalfPeriod lengths, in bars of the current cycle.
A relative strength indicator of the time series over the cycle length. That is, adaptive relative strength over the cycle length.
The Relative Strength Indicator, is adaptive to the time series, and it can be smoothed by increasing the length of decreasing the number of degrees of freedom.
Other adaptive indicators based upon the period and can be similarly constructed.
There is some new math here, so I have broken the story up into 5 Parts:
Part 1:
Any time series can be decomposed into a orthogonal set of polynomials .
This is just math and here are some good references:
Legendre polynomials - Wikipedia, the free encyclopedia
Peter Seffen, "On Digital Smoothing Filters: A Brief Review of Closed Form Solutions and Two New Filter Approaches", Circuits Systems Signal Process, Vol. 5, No 2, 1986
I gave some thought to what should be done with this and came to the conclusion that they can be used for basic smoothing of time series. For the analysis below, I decompose a time series into a low number of degrees of freedom and discard the zero mode to introduce smoothing.
That is:
time series => c_1 t + c_2 t^2 ... c_Max t^Max
This is the cycle. By construction, the cycle does not have a zero mode and more physically, I am defining the "Trend" to be the zero mode.
The data for the cycle and the fit of the cycle can be viewed by setting
ShowDataAndFit = TRUE;
There, you will see the fit of the last bar as well as the time series of the leading edge of the fits. If you don't know what I mean by the "leading edge", please see some of the postings in . The leading edges are in grayscale, and the fit of the last bar is in color.
I have chosen Length = 17 and Degree = 4 as the default. I am simply making sure by eye that the fit is reasonably good and degree 4 is the lowest polynomial that can represent a sine-like wave, and 17 is the smallest length that lets me calculate the Phase Shift (Part 3 below) using the Hilbert Transform of width=7 (Part 2 below).
Depending upon the fit you make, you will capture different cycles in the data. A fit that is too "smooth" will not see the smaller cycles, and a fit that is too "choppy" will not see the longer ones. The idea is to use the fit to try to suppress the smaller noise cycles while keeping larger signal cycles.
Part 2:
Every time series has an Analytic Signal, defined by applying the Hilbert Transform to it. You can think of the original time series as amplitude * cosine(theta) and the transformed series, called the quadrature, can be thought of as amplitude * sine(theta). By taking the ratio, you can get the angle theta, and this is exactly what was done by John Ehlers in . It lets you get a frequency out of the time series under consideration.
Amazon.com: Rocket Science for Traders: Digital Signal Processing Applications (9780471405672): John F. Ehlers: Books
It helps to have more references to understand this. There is a nice article on Wikipedia on it.
Read the part about the discrete Hilbert Transform:
en.wikipedia.org
If you really want to understand how to go from continuous to discrete, look up this article written by Richard Lyons:
www.dspguru.com
In the indicator below, I am calculating the normalized analytic signal, which can be written as:
s + i h where i is the imagery number, and s^2 + h^2 = 1;
s= signal = cosine(theta)
h = Hilbert transformed signal = quadrature = sine(theta)
The angle is therefore given by theta = arctan(h/s);
The analytic signal leading edge and the fit of the last bar of the cycle can be viewed by setting
ShowAnalyticSignal = TRUE;
The leading edges are in grayscale fit to the last bar is in color. Light (yellow) is the s term, and Dark (orange) is the quadrature (hilbert transform). Note that for every bar, s^2 + h^2 = 1 , by construction.
I am using a width = 7 Hilbert transform, just like Ehlers. (But you can adjust it if you want.) This transform has a 7 bar lag. I have put the lag into the plot statements, so the cycle info should be quite good at displaying minima and maxima (extrema).
Part 3:
The Phase shift is the amount of phase change from bar to bar.
It is a discrete unitary transformation that takes s + i h to s + i h
explicitly, T = (s+ih)*(s -ih ) , since s *s + h *h = 1.
writing it out, we find that T = T1 + iT2
where T1 = s*s + h*h and T2 = s*h -h*s
and the phase shift is given by PhaseShift = arctan(T2/T1);
Alas, I have no reference for this, all I doing is finding the rotation what takes the analytic signal at bar to the analytic signal at bar . T is the transfer matrix.
Of interest is the PhaseShift from the closest two bars to the present, given by the bar and bar since I am using a width=7 Hilbert transform, bar is the earliest bar with an analytic signal.
I store the phase shift from bar to bar as a time series called PhaseShift. It basically gives you the (7-bar delayed) leading edge the amount of phase angle change in the series.
You can see it by setting
ShowPhaseShift=TRUE
The green points are positive phase shifts and red points are negative phase shifts.
On most charts, I have looked at, the indicator is mostly green, but occasionally, the stock "retrogrades" and red appears. This happens when the cycle is "broken" and the cycle length starts to expand as a trend occurs.
Part 4:
The Period:
The Period is the number of bars required to generate a sum of PhaseShifts equal to 360 degrees.
The Half-period is the number of bars required to generate a sum of phase shifts equal to 180 degrees. It is usually not equal to 1/2 of the period.
You can see the Period and Half-period by setting
ShowPeriod=TRUE
The code is very simple here:
Value1=0;
Value2=0;
while Value1 < bar_index and math.abs(Value2) < 360 begin
Value2 = Value2 + PhaseShift ;
Value1 = Value1 + 1;
end;
Period = Value1;
The period is sensitive to the input length and degree values but not overly so. Any insight on this would be appreciated.
Part 5:
The Relative Strength indicator:
The Relative Strength is just the current value of the series minus the minimum over the last cycle divided by the maximum - minimum over the last cycle, normalized between +1 and -1.
RelativeStrength = -1 + 2*(Series-Min)/(Max-Min);
It therefore tells you where the current bar is relative to the cycle. If you want to smooth the indicator, then extend the period and/or reduce the polynomial degree.
In code:
NewLength = floor(Period + HilbertWidth+1);
Max = highest(Series,NewLength);
Min = lowest(Series,NewLength);
if Max>Min then
Note that the variable NewLength includes the lag that comes from the Hilbert transform, (HilbertWidth=7 by default).
Conclusion:
This is an example of what can be done by combining Legendre polynomials and analytic signals to determine a smooth period without adding time lag.
________________________________
Changes in this one : instead of using true/false options for every single way to display, use Type parameter as following :
1. The Least Squares fit of a polynomial to a DC subtracted time series - a best fit to a cycle.
2. The normalized analytic signal of the cycle (signal and quadrature).
3. The Phase shift of the analytic signal per bar.
4. The Period and HalfPeriod lengths, in bars of the current cycle.
5. A relative strength indicator of the time series over the cycle length. That is, adaptive relative strength over the cycle length.

Non-Rescaled RSI█ OVERVIEW
Relative Strength Index is a momentum oscillator developed by J. Wilder. The original version of RSI rescaled the relative strength measurement to range. While the rescaling is useful for readability, This non-rescaled version tells the exact average relative strength of the movement for the past period, and give another way to put the relative strength reading into context of current market condition.
█ Description & How To Use
1. The (+/-) in relative strength value indicates the direction
Example 1: Relative Strength of 2.33 means average gain is 2.33 bigger than average loss for the past period (Equivalent to RSI 70)
Example 2: Relative Strength of -2.33 means average loss is 2.33 bigger than average gain for the past period (Equivalent to RSI 30)
Example 3: Relative Strength of 0 means average gain is equal to average loss for the past period (Equivalent to RSI 50)
Look at comparison below:
2. You can use it exactly how you would use RSI: Overbought/Oversold state, Divergence, Trend identification, Failure Swings etc..
█ Features
- Overbought/Oversold line still maintainable as standard RSI level (70,30) in user input screen. The script will recalculate and plot the ob/os level accordingly
- Value Label to indicate the RSI and RS value
- Custom Gradient Color Scheme
█ Limitation
The Relative Strength absolute value is capped at 20 to avoid ratio value too big(or too small). This is enough to get accurate equivalent of RSI reading between 5-95
█ Disclaimer
Past performance is not an indicator of future results.
My opinions and research are my own and do not constitute financial advice in any way whatsoever.
Nothing published by me constitutes an investment/trading recommendation, nor should any data or Content published by me be relied upon for any investment/trading activities.
I strongly recommends that you perform your own independent research and/or speak with a qualified investment professional before making any financial decisions.

Multi-Chart Widget [LuxAlgo]The Multi-Chart Widget tool is a comprehensive solution crafted for traders and investors looking to analyze multiple financial instruments simultaneously. With the capability to showcase up to three additional charts, users can customize each chart by selecting different financial instruments, and timeframes.
Users can add various widely used technical indicators to the charts such as the relative strength index, Supertrend, moving averages, Bollinger Bands...etc.
🔶 USAGE
The tool offers traders and investors a comprehensive view of multiple charts simultaneously. By displaying up to three additional charts alongside the primary chart, users can analyze assets across different timeframes, compare their performance, and make informed decisions.
Users have the flexibility to choose from various customizable chart types, including the recently added "Volume Candles" option.
This tool allows adding to the chart some of the most widely used technical indicators, such as the Supertrend, Bollinger Bands, and various moving averages.
In addition to the charting capabilities, the tool also features a dynamic statistic panel that provides essential metrics and key insights into the selected assets. Users can track performance indicators such as relative strength, trend, and volatility, enabling them to identify trends, patterns, and trading opportunities efficiently.
🔶 DETAILS
A brief overview of the indicators featured in the statistic panel is given in the sub-section below:
🔹Dual Supertrend
The Dual Supertrend is a modified version of the Supertrend indicator, which is based on the concept of trend following. It generates buy or sell signals by analyzing the asset's price movement. The Dual Supertrend incorporates two Supertrend indicators with different parameters to provide potentially more accurate signals. It helps traders identify trend reversals and establish trend direction in a more responsive manner compared to a single Supertrend.
🔹Relative Strength Index
The Relative Strength Index is a momentum oscillator that measures the speed and change of price movements. RSI oscillates between 0 and 100 and is typically used to identify overbought or oversold conditions in a market. Traditionally, RSI values above 70 are considered overbought, suggesting that the asset may be due for a reversal or correction, while RSI values below 30 are considered oversold, indicating potential buying opportunities.
🔹Volatility
Volatility in trading refers to the degree of variation or fluctuation in the price of a financial instrument, such as a stock, currency pair, or commodity, over a certain period of time. It is a measure of the speed and magnitude of price changes and reflects the level of uncertainty or risk in the market. High volatility implies that prices are experiencing rapid and significant movements, while low volatility suggests that prices are relatively stable and are not changing much. Traders often use volatility as an indicator to assess the potential risk and return of an investment and to make informed decisions about when to enter or exit trades.
🔹R-Squared (R²)
R-squared, also known as the coefficient of determination, is a statistical measure that indicates the proportion of the variance in the dependent variable that is predictable from the independent variable(s). In other words, it quantifies the goodness of fit of a regression model to the observed data. R-squared values range from %0 to %100, with higher values indicating a better fit of the model to the data. An R-squared of 100% means that all movements of a security are completely explained by movements in the index, while an R-squared value of %0 indicates that the model does not explain any of the variability in the dependent variable.
In simpler terms, in investing, a high R-squared, from 85% to 100%, indicates that the stock’s or fund’s performance moves relatively in line with the index. Conversely, a low R-squared (around 70% or less) indicates that the fund's performance tends to deviate significantly from the movements of the index.
🔶 SETTINGS
🔹Mini Chart(s) Generic Settings
Mini Charts Separator: This option toggles the visibility of the separator lines.
Number Of Bars: Specifies the number of bars to be displayed for each mini chart.
Horizontal Offset: Determines the distance at which the mini charts will be displayed from the primary chart.
🔹Mini Chart Settings: Top - Middle - Bottom
Mini Chart Top/Middle/Bottom: Toggle the visibility of the selected mini chart.
Symbol: Choose the financial instrument to be displayed in the mini chart. If left as an empty string, it will default to the current chart instrument.
Timeframe: This option determines the timeframe used for calculating the mini charts. If a timeframe lower than the chart's timeframe is selected, the calculations will be based on the chart's timeframe.
Chart Type: Selection from various chart types for the mini charts, including candles, volume candles, line, area, columns, high-low, and Heikin Ashi.
Chart Size: Determines the size of the mini chart.
Technical Indicator: Selection from various technical indicators to be displayed on top of the mini charts.
Note : Chart sizing is relative to other mini charts. For example, If all the mini charts are sized to x5 relative to each other, the result will be the same as if they were all sized as x1. This is because the relative proportions between the mini charts remain consistent regardless of their absolute sizes. Therefore, their positions and sizes relative to each other remain unchanged, resulting in the same visual representation despite the differences in absolute scale.
🔹Supertrend Settings
ATR Length: is the lookback length for the ATR calculation.
Factor: is what the ATR is multiplied by to offset the bands from price.
Color: color customization option.
🔹Moving Average Settings
Type: is the type of the moving average, available types of moving averages include SMA (Simple Moving Average), EMA (Exponential Moving Average), RMA (Root Mean Square Moving Average), HMA (Hull Moving Average), WMA (Weighted Moving Average), and VWMA (Volume Weighted Moving Average).
Source: Determines what data from each bar will be used in calculations.
Length: The time period to be used in calculating the Moving Average.
Color: Color customization option.
🔹Bollinger Bands Settings
Basis Type: Determines the type of Moving Average that is applied to the basis plot line.
Source: Determines what data from each bar will be used in calculations.
Length: The time period to be used in calculating the Moving Average which creates the base for the Upper and Lower Bands.
StdDev: The number of Standard Deviations away from the Moving Average that the Upper and Lower Bands should be.
Color: Color customization options for basis, upper and lower bands.
🔹Mini Chart(s) Panel Settings
Mini Chart(s) Panel: Controls the visibility of the panel containing the mini charts.
Dual Supertrend: Toggles the display of the evaluated dual super trend, based on the super trend settings provided below the option. The definitions for the options are the same as stated above for the super trend.
Relative Strength Index: Toggles the display of the evaluated RSI, based on the source and length settings provided below the option.
Volatility: Toggles the display of the calculated Volatility, based on the length settings provided below the option.
R-Squared: Toggles the display of the calculated R-Squared (R²), based on the length settings provided below the option.
🔶 LIMITATIONS
The tool allows users to display mini charts featuring various types of instruments alongside the primary chart instrument. However, there's a limitation: the selected primary chart instrument must have an ACTIVE market status. Alternatively, if the primary chart instrument is not active, the mini chart instruments must belong to the same exchange and have the same type as the primary chart instrument.

Korneev Reverse RSIRethinking the Legendary Relative Strength Index by John Welles Wilder
The essence of the new approach lies in the reverse use of the so-called "overbought" and "oversold" zones. In his 1978 book, "New Concepts in Technical Trading Systems," where the RSI mechanism was thoroughly described, Wilder writes that one way to use the oscillator is to open a long position when the RSI drops into oversold territory (below 30) and to open a short position when the RSI rises to overbought levels (above 70). However, backtesting this strategy with such inputs yields rather mediocre results.
Based on the calculation formula, the RSI calculates the rate of price change over a certain period. Therefore, overbought and oversold zones will have relative significance (relative to the set calculation period). It is no coincidence that the word "relative" was added to the name of the oscillator. It is worth accepting as an axiom the assertion that the price of an asset is fair at every moment in time.
Essentially, the RSI calculates the strength of a trend. If the oscillator value is above 70, it is highly likely that an upward movement is occurring in the market. Therefore, in the current strategy, a long position is opened precisely at the moment of greatest buyer strength (when RSI > 80), i.e., in the direction of the trend, since counter-trend trading with the RSI has proven to be ineffective. The position is closed after the buyers lose their advantage and the RSI drops to 40.
The strategy is recommended to be used only with long positions, as short positions show negative results. The strategy uses a moving average for the RSI with a period of 14 to smooth the oscillator data.
--------------------------------------------------------------------------------------------
Переосмысление легендарного осциллятора Relative strength index Джона Уэллса Уайлдера
Суть нового подхода заключается в реверсивном использовании так называемых зон "перекупленности" и "перепроданности". В своей книге от 1978 года "New concepts in tecnical trading systems", в которой был подробно описан механизм работы RSI, Уайлдер пишет, что один из способов использования осциллятора - открытие длинной позиции при снижении RSI в перепроданность (ниже 30) и открытие короткой позиции при повышении RSI до перекупленности (выше 70). Однако бэктест стратегии с такими вводными дает весьма посредственные результаты.
Исходя из формулы расчета, RSI рассчитывает скорость изменения цены за определенный период. Поэтому зоны перекупленности и перепроданности будут иметь относительное значение (относительно установленного периода расчета). Не зря ведь в названии осциллятора было добавлено слово "относительной". Стоит принять за аксиому утверждение, что цена актива справедлива в каждый момент времени.
По сути, RSI рассчитывает силу тренда. Если значение осциллятора выше 70, то на рынке с высокой долей вероятности происходит восходящее движение. Поэтому в текущей стратегии открытие лонга происходит именно в момент наибольшей силы покупателей (когда RSI > 80), то есть в сторону тренда, поскольку контртрендовая торговля по RSI показала свою несостоятельность. Закрытие позиции происходит после того, как покупатели теряют преимущество и RSI снижается до 40.
Стратегию рекомендуется использовать только с длинными позициями, поскольку короткие позиции показывают отрицательный результат. В стратегии используется скользящая средняя для RSI с периодом 14 для сглаживания данных осциллятора.

KRX RS OverlayKRX RS Overlay (Manual, Pine v6) (한국어 설명 아래에)
What it does
Plots a Relative Strength (RS) line of the current symbol versus a selected Korean market index on the price chart (overlay). RS is computed as Close(symbol) / Close(benchmark) and rebased to 100 N bars ago for easy comparison. An SMA of RS is included for signal smoothing.
Benchmarks (manual selection only)
• KOSPI (KRX:KOSPI) — default
• KOSDAQ (KRX:KOSDAQ)
• KOSPI200 (KRX:KOSPI200)
• KOSDAQ150 (KRX:KOSDAQ150)
Inputs
• Benchmark: choose one of the four indices above (default: KOSPI)
• Rebase N bars ago to 100: sets the normalization point (e.g., 252 ≈ 1 trading year on daily)
• RS SMA length: smoothing period for the RS line
• Show 100 base line: toggle the reference line at 100
How to read
• RS rising → the symbol is outperforming the selected index.
• RS above RS-SMA and sloping up → strengthening leadership vs. the benchmark.
• RS crossing above RS-SMA → momentum-style confirmation (an alert is provided).
Tips
• Works on any timeframe; the benchmark is requested on the same timeframe.
• If the RS line scale conflicts with price, place the indicator on the Left scale (Chart Settings → Scales) or set the series to use the left axis.
Notes
• This script is manual only (no auto index detection).
• Educational use; not financial advice.
⸻
KRX RS 오버레이 (수동, Pine v6)
기능
현재 종목을 선택한 한국 지수와 비교한 상대강도(RS) 라인을 가격 차트 위(오버레이)에 표시합니다. RS는 종목 종가 / 지수 종가로 계산하며, 비교를 쉽게 하기 위해 N봉 전 = 100으로 리베이스합니다. 신호 완화를 위해 RS의 SMA도 함께 제공합니다.
벤치마크(수동 선택만 지원)
• KOSPI (KRX:KOSPI) — 기본값
• KOSDAQ (KRX:KOSDAQ)
• KOSPI200 (KRX:KOSPI200)
• KOSDAQ150 (KRX:KOSDAQ150)
입력값
• Benchmark: 위 4개 지수 중 선택(기본: KOSPI)
• Rebase N bars ago to 100: 리베이스 기준(일봉 252 ≈ 1년)
• RS SMA length: RS 스무딩 기간
• Show 100 base line: 100 기준선 표시 여부
해석 가이드
• RS 상승 → 선택 지수 대비 초과성과.
• RS가 RS-SMA 위 & 우상향 → 벤치마크 대비 리더십 강화.
• RS가 RS-SMA 상향 돌파 → 모멘텀 확인(알림 제공).
팁
• 모든 타임프레임에서 동작하며, 지수도 동일 타임프레임으로 요청됩니다.
• 가격 축과 스케일이 겹치면 왼쪽 스케일로 표시하도록 설정하세요(차트 설정 → Scales).
유의사항
• 자동 지수 판별 기능은 포함하지 않았습니다(수동 전용).
BTC/Fiat Divergence & Spread Monitor📄 BTC/Fiat Divergence & Spread Monitor
This indicator visualizes Bitcoin’s relative performance across multiple fiat currencies and highlights periods of unusual divergence. It helps traders assess which fiat pairs BTC has outperformed or underperformed over a configurable lookback period and monitor the dynamic spread between the strongest and weakest pairs.
Features:
Relative Performance Matrix:
Ranks BTC returns in 6 fiat pairs, displaying a color-coded table of percentage changes and ranks.
Divergence Spread Oscillator:
Calculates the spread between the top and bottom performing pairs and normalizes this using a Z-Score. The oscillator helps identify when fiat pricing divergence is unusually high or compressed.
Dynamic Smoothing:
Optional Hull Moving Average smoothing to reduce noise in the spread signal.
Customizable Inputs:
Lookback period for percent change.
Z-Score normalization window.
Smoothing length.
Symbol selection for each fiat pair.
Visual Mode Toggle:
Switch between relative performance lines and spread oscillator view.
Potential Use Cases:
Fiat Rotation:
Identify which fiat is relatively weak or strong to optimize your exit currency when taking BTC profits.
Volatility Detection:
Use the spread Z-Score to detect periods of high divergence across fiat pairs, signaling macro FX volatility or dislocations.
Regime Analysis:
Track when fiat spreads are converging or expanding, potentially signaling market regime shifts.
Risk Management:
When divergence is extreme (Z-Score > +1), consider reducing position sizing or waiting for reversion.
Disclaimer:
This indicator is provided for educational and informational purposes only. It does not constitute financial advice or a recommendation to buy or sell any security or asset. Always do your own research and consult a qualified financial professional before making trading decisions. Use at your own risk.
Tip:
Experiment with different lookback periods and smoothing settings to adapt the indicator to your timeframe and trading style.

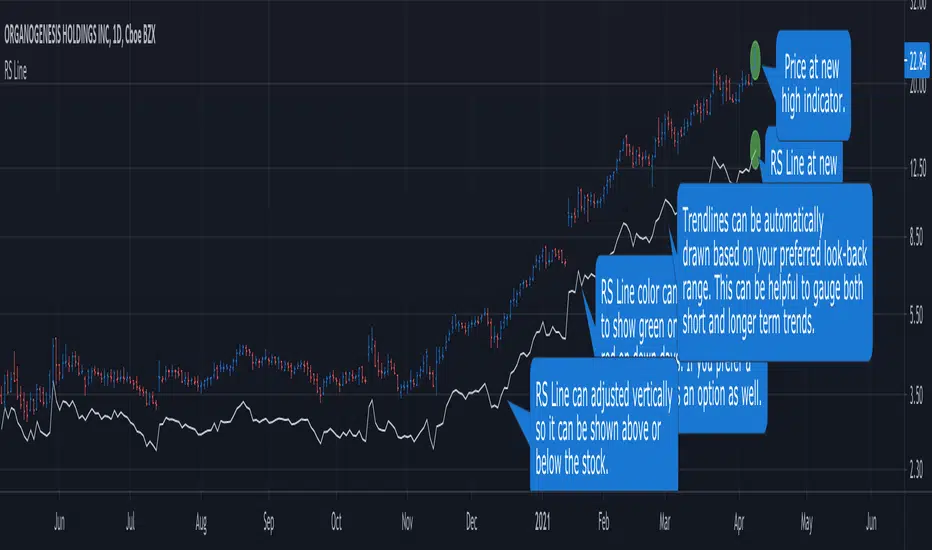
RS Line - Relative Strength Line [LevelUp]Overview:
This implementation of the RS Line mimics how Investor's Business Daily and CANSLIM investors measure growth stock performance versus the S&P 500.
If you are looking at a weekly chart, the RS Line is the performance of the stock over the past week versus the S&P 500 over that same time frame. The same logic applies to the daily and monthly charts, only the time frames are different.
If a stock moves up for the day/week/month and the S&P 500 does not, the RS Line will move up. If a stock ends the day/week/month flat, yet the S&P 500 moves up, the RS Line will go down.
Usage:
- Look for an upward sloping line.
- The steeper the line, the better.
- Can be used for viewing long-term trend.
Zaree - RSI Gradient FillDescription:
The "Zaree - RSI Gradient Fill" (RGF) indicator is a technical analysis tool designed to enhance the interpretation of the Relative Strength Index (RSI) by incorporating visual cues through gradient fill. This indicator aids traders in identifying potential overbought and oversold conditions in the market using the RSI as a key reference.
Details of the Indicator:
The indicator calculates the RSI of a selected source based on user-defined settings for length and source.
Traders have the option to choose from various types of moving averages (SMA, EMA, SMMA, WMA) to calculate the RSI.
RSI values and their corresponding moving average values are plotted on the chart for visual analysis.
The indicator offers customization through input settings for RSI length, RSI source, and moving average type and length.
Upper and lower bands for the RSI are displayed on the chart, providing visual cues for potential overbought and oversold conditions.
A center line is plotted on the chart to help traders identify the equilibrium point of the RSI.
The gradient fill feature enhances the visualization by coloring the space between the RSI plot and the center line based on RSI levels.
How to Use the Indicator:
Specify the RSI length and source for calculation.
Choose the desired moving average type and set the length for the moving average.
Observe the RSI values, moving average lines, and the center line plotted on the chart.
Pay attention to the position of the RSI values relative to the upper and lower bands. Values above the upper band suggest potential overbought conditions, while values below the lower band indicate potential oversold conditions.
Interpret the gradient fill between the RSI plot and the center line. The color changes provide additional visual cues about the RSI's strength compared to the center line.
Example of Usage:
As an experienced swing trader, you can leverage the RGF indicator to fine-tune your trading decisions. Here's an example of how you might use the indicator:
Select your preferred RSI length and source, such as the closing price.
Choose "SMA" as the moving average type and set the length to 14.
Observe the RSI values plotted on the chart along with the upper and lower bands.
Pay special attention to the gradient fill between the RSI plot and the center line. This coloring offers valuable insights into the RSI's position relative to equilibrium.
Look for instances where the RSI values cross above or below the upper and lower bands. These crossings can signal potential trend shifts or reversals.
Use the gradient fill colors to quickly assess the strength of the RSI's deviation from the center line.
Remember that the RGF indicator is a powerful tool to complement your trading strategy. Consider combining its insights with other technical and fundamental analyses for well-informed trading decisions.
Feel free to adjust the indicator settings according to your trading preferences and style. While the RGF indicator provides valuable visual cues, always consider the broader context of the market before making trading choices.

Ultimate RSI [LuxAlgo]The Ultimate RSI indicator is a new oscillator based on the calculation of the Relative Strength Index that aims to put more emphasis on the trend, thus having a less noisy output. Opposite to the regular RSI, this oscillator is designed for a trend trading approach instead of a contrarian one.
🔶 USAGE
While returning the same information as a regular RSI, the Ultimate RSI puts more emphasis on trends, and as such can reach overbought/oversold levels faster as well as staying longer within these areas. This can avoid the common issue of an RSI regularly crossing an overbought or oversold level while the trend makes new higher highs/lower lows.
The Ultimate RSI crossing above the overbought level can be indicative of a strong uptrend (highlighted as a green area), while an Ultimate RSI crossing under the oversold level can be indicative of a strong downtrend (highlighted as a red area).
The Ultimate RSI crossing the 50 midline can also indicate trends, with the oscillator being above indicating an uptrend, else a downtrend. Unlike a regular RSI, the Ultimate RSI will cross the midline level less often, thus generating fewer whipsaw signals.
For even more timely indications users can observe the Ultimate RSI relative to its signal line. An Ultimate RSI above its signal line can indicate it is increasing, while the opposite would indicate it is decreasing.
🔹 Smoothing Methods
Users can return more reactive or smoother results depending on the selected smoothing method used for the calculation of the Ultimate RSI. Options include:
Exponential Moving Average (EMA)
Simple Moving Average (SMA)
Wilder's Moving Average (RMA)
Triangular Moving Average (TMA)
These are ranked by the degree of reactivity of each method, with higher ones being more reactive (but less smooth).
Users can also select the smoothing method used by the signal line.
🔶 DETAILS
The RSI returns a normalized exponential average of price changes in the range (0, 100), which can be simply calculated as follows:
ema(d) / ema(|d|) × 50 + 50
where d represent the price changes. In order to put more emphasis on trends we can put higher weight on d . We can perform this on the occurrence of new higher highs/lower lows, and by replacing d with the rolling range instead (the rolling period used to detect the higher highs/lower lows is equal to the length setting).
🔶 SETTINGS
Length: Calculation period of the indicator
Method: Smoothing method used for the calculation of the indicator.
Source: Input source of the indicator
🔹 Signal Line
Smooth: Degree of smoothness of the signal line
Method: Smoothing method used to calculation the signal line.

MACD & RSI Overlay (Expo)█ Overview
The MACD & RSI Overlay (Expo) trading indicator is a technical analysis tool that combines two popular indicators, the Relative Strength Index (RSI ) and the Moving Average Convergence Divergence (MACD ), and overlays them onto the price chart. The indicator oscillates relative to price, so it plots the RSI and MACD around price while still displaying the same insights as the regular MACD and RSI indicators. This feature gives traders a unique perspective, allowing them to see the relationship between price, momentum, and trend in a single chart.
This indicator is a valuable addition to any trader's technical analysis toolkit, whether they are a beginner or an experienced trader.
█ MACD
█ RSI
The RSI comes with overbought and oversold areas, which can be set by the trader.
█ MACD & RSI
█ Trend Feature
What sets the MACD & RSI Overlay indicator apart is its ability to factor in the underlying trend. This feature makes the indicator more useful than ever before, as traders can use it to filter trades in the direction of the trend. By considering the underlying trend, traders can gain valuable insights into market trends.
█ Benefits
One of the primary benefits of having the MACD and RSI plotted directly on the price chart is that it provides a more intuitive understanding of the relationship between price, momentum, and trend. Traders can quickly identify the direction of the trend by observing the price movement relative to the MACD and RSI lines. In addition, by having these indicators plotted on the chart, traders can quickly identify potential buy and sell signals and develop new trading strategies.
█ How to use
One of the most popular strategies is to use the MACD & RSI Overlay indicator to look for crossings. A crossing occurs when the MACD and RSI lines cross over each other or when they cross over the signal line. These crossings can signal potential trend reversals and momentum shifts. For example, if the MACD line crosses over the signal line from below, it could indicate a bullish signal, while a cross from above could indicate a bearish signal.
-----------------
Disclaimer
The information contained in my Scripts/Indicators/Ideas/Algos/Systems does not constitute financial advice or a solicitation to buy or sell any securities of any type. I will not accept liability for any loss or damage, including without limitation any loss of profit, which may arise directly or indirectly from the use of or reliance on such information.
All investments involve risk, and the past performance of a security, industry, sector, market, financial product, trading strategy, backtest, or individual's trading does not guarantee future results or returns. Investors are fully responsible for any investment decisions they make. Such decisions should be based solely on an evaluation of their financial circumstances, investment objectives, risk tolerance, and liquidity needs.
My Scripts/Indicators/Ideas/Algos/Systems are only for educational purposes!
RSI Full Forecast [Titans_Invest]RSI Full Forecast
Get ready to experience the ultimate evolution of RSI-based indicators – the RSI Full Forecast, a boosted and even smarter version of the already powerful: RSI Forecast
Now featuring over 40 additional entry conditions (forecasts), this indicator redefines the way you view the market.
AI-Powered RSI Forecasting:
Using advanced linear regression with the least squares method – a solid foundation for machine learning - the RSI Full Forecast enables you to predict future RSI behavior with impressive accuracy.
But that’s not all: this new version also lets you monitor future crossovers between the RSI and the MA RSI, delivering early and strategic signals that go far beyond traditional analysis.
You’ll be able to monitor future crossovers up to 20 bars ahead, giving you an even broader and more precise view of market movements.
See the Future, Now:
• Track upcoming RSI & RSI MA crossovers in advance.
• Identify potential reversal zones before price reacts.
• Uncover statistical behavior patterns that would normally go unnoticed.
40+ Intelligent Conditions:
The new layer of conditions is designed to detect multiple high-probability scenarios based on historical patterns and predictive modeling. Each additional forecast is a window into the price's future, powered by robust mathematics and advanced algorithmic logic.
Full Customization:
All parameters can be tailored to fit your strategy – from smoothing periods to prediction sensitivity. You have complete control to turn raw data into smart decisions.
Innovative, Accurate, Unique:
This isn’t just an upgrade. It’s a quantum leap in technical analysis.
RSI Full Forecast is the first of its kind: an indicator that blends statistical analysis, machine learning, and visual design to create a true real-time predictive system.
⯁ SCIENTIFIC BASIS LINEAR REGRESSION
Linear Regression is a fundamental method of statistics and machine learning, used to model the relationship between a dependent variable y and one or more independent variables 𝑥.
The general formula for a simple linear regression is given by:
y = β₀ + β₁x + ε
β₁ = Σ((xᵢ - x̄)(yᵢ - ȳ)) / Σ((xᵢ - x̄)²)
β₀ = ȳ - β₁x̄
Where:
y = is the predicted variable (e.g. future value of RSI)
x = is the explanatory variable (e.g. time or bar index)
β0 = is the intercept (value of 𝑦 when 𝑥 = 0)
𝛽1 = is the slope of the line (rate of change)
ε = is the random error term
The goal is to estimate the coefficients 𝛽0 and 𝛽1 so as to minimize the sum of the squared errors — the so-called Random Error Method Least Squares.
⯁ LEAST SQUARES ESTIMATION
To minimize the error between predicted and observed values, we use the following formulas:
β₁ = /
β₀ = ȳ - β₁x̄
Where:
∑ = sum
x̄ = mean of x
ȳ = mean of y
x_i, y_i = individual values of the variables.
Where:
x_i and y_i are the means of the independent and dependent variables, respectively.
i ranges from 1 to n, the number of observations.
These equations guarantee the best linear unbiased estimator, according to the Gauss-Markov theorem, assuming homoscedasticity and linearity.
⯁ LINEAR REGRESSION IN MACHINE LEARNING
Linear regression is one of the cornerstones of supervised learning. Its simplicity and ability to generate accurate quantitative predictions make it essential in AI systems, predictive algorithms, time series analysis, and automated trading strategies.
By applying this model to the RSI, you are literally putting artificial intelligence at the heart of a classic indicator, bringing a new dimension to technical analysis.
⯁ VISUAL INTERPRETATION
Imagine an RSI time series like this:
Time →
RSI →
The regression line will smooth these values and extend them n periods into the future, creating a predicted trajectory based on the historical moment. This line becomes the predicted RSI, which can be crossed with the actual RSI to generate more intelligent signals.
⯁ SUMMARY OF SCIENTIFIC CONCEPTS USED
Linear Regression Models the relationship between variables using a straight line.
Least Squares Minimizes the sum of squared errors between prediction and reality.
Time Series Forecasting Estimates future values based on historical data.
Supervised Learning Trains models to predict outputs from known inputs.
Statistical Smoothing Reduces noise and reveals underlying trends.
⯁ WHY THIS INDICATOR IS REVOLUTIONARY
Scientifically-based: Based on statistical theory and mathematical inference.
Unprecedented: First public RSI with least squares predictive modeling.
Intelligent: Built with machine learning logic.
Practical: Generates forward-thinking signals.
Customizable: Flexible for any trading strategy.
⯁ CONCLUSION
By combining RSI with linear regression, this indicator allows a trader to predict market momentum, not just follow it.
RSI Full Forecast is not just an indicator — it is a scientific breakthrough in technical analysis technology.
⯁ Example of simple linear regression, which has one independent variable:
⯁ In linear regression, observations ( red ) are considered to be the result of random deviations ( green ) from an underlying relationship ( blue ) between a dependent variable ( y ) and an independent variable ( x ).
⯁ Visualizing heteroscedasticity in a scatterplot against 100 random fitted values using Matlab:
⯁ The data sets in the Anscombe's quartet are designed to have approximately the same linear regression line (as well as nearly identical means, standard deviations, and correlations) but are graphically very different. This illustrates the pitfalls of relying solely on a fitted model to understand the relationship between variables.
⯁ The result of fitting a set of data points with a quadratic function:
_________________________________________________
🔮 Linear Regression: PineScript Technical Parameters 🔮
_________________________________________________
Forecast Types:
• Flat: Assumes prices will remain the same.
• Linreg: Makes a 'Linear Regression' forecast for n periods.
Technical Information:
ta.linreg (built-in function)
Linear regression curve. A line that best fits the specified prices over a user-defined time period. It is calculated using the least squares method. The result of this function is calculated using the formula: linreg = intercept + slope * (length - 1 - offset), where intercept and slope are the values calculated using the least squares method on the source series.
Syntax:
• Function: ta.linreg()
Parameters:
• source: Source price series.
• length: Number of bars (period).
• offset: Offset.
• return: Linear regression curve.
This function has been cleverly applied to the RSI, making it capable of projecting future values based on past statistical trends.
______________________________________________________
______________________________________________________
⯁ WHAT IS THE RSI❓
The Relative Strength Index (RSI) is a technical analysis indicator developed by J. Welles Wilder. It measures the magnitude of recent price movements to evaluate overbought or oversold conditions in a market. The RSI is an oscillator that ranges from 0 to 100 and is commonly used to identify potential reversal points, as well as the strength of a trend.
⯁ HOW TO USE THE RSI❓
The RSI is calculated based on average gains and losses over a specified period (usually 14 periods). It is plotted on a scale from 0 to 100 and includes three main zones:
• Overbought: When the RSI is above 70, indicating that the asset may be overbought.
• Oversold: When the RSI is below 30, indicating that the asset may be oversold.
• Neutral Zone: Between 30 and 70, where there is no clear signal of overbought or oversold conditions.
______________________________________________________
______________________________________________________
⯁ ENTRY CONDITIONS
The conditions below are fully flexible and allow for complete customization of the signal.
______________________________________________________
______________________________________________________
🔹 CONDITIONS TO BUY 📈
______________________________________________________
• Signal Validity: The signal will remain valid for X bars .
• Signal Sequence: Configurable as AND or OR .
📈 RSI Conditions:
🔹 RSI > Upper
🔹 RSI < Upper
🔹 RSI > Lower
🔹 RSI < Lower
🔹 RSI > Middle
🔹 RSI < Middle
🔹 RSI > MA
🔹 RSI < MA
📈 MA Conditions:
🔹 MA > Upper
🔹 MA < Upper
🔹 MA > Lower
🔹 MA < Lower
📈 Crossovers:
🔹 RSI (Crossover) Upper
🔹 RSI (Crossunder) Upper
🔹 RSI (Crossover) Lower
🔹 RSI (Crossunder) Lower
🔹 RSI (Crossover) Middle
🔹 RSI (Crossunder) Middle
🔹 RSI (Crossover) MA
🔹 RSI (Crossunder) MA
🔹 MA (Crossover) Upper
🔹 MA (Crossunder) Upper
🔹 MA (Crossover) Lower
🔹 MA (Crossunder) Lower
📈 RSI Divergences:
🔹 RSI Divergence Bull
🔹 RSI Divergence Bear
📈 RSI Forecast:
🔹 RSI (Crossover) MA Forecast
🔹 RSI (Crossunder) MA Forecast
🔹 RSI Forecast 1 > MA Forecast 1
🔹 RSI Forecast 1 < MA Forecast 1
🔹 RSI Forecast 2 > MA Forecast 2
🔹 RSI Forecast 2 < MA Forecast 2
🔹 RSI Forecast 3 > MA Forecast 3
🔹 RSI Forecast 3 < MA Forecast 3
🔹 RSI Forecast 4 > MA Forecast 4
🔹 RSI Forecast 4 < MA Forecast 4
🔹 RSI Forecast 5 > MA Forecast 5
🔹 RSI Forecast 5 < MA Forecast 5
🔹 RSI Forecast 6 > MA Forecast 6
🔹 RSI Forecast 6 < MA Forecast 6
🔹 RSI Forecast 7 > MA Forecast 7
🔹 RSI Forecast 7 < MA Forecast 7
🔹 RSI Forecast 8 > MA Forecast 8
🔹 RSI Forecast 8 < MA Forecast 8
🔹 RSI Forecast 9 > MA Forecast 9
🔹 RSI Forecast 9 < MA Forecast 9
🔹 RSI Forecast 10 > MA Forecast 10
🔹 RSI Forecast 10 < MA Forecast 10
🔹 RSI Forecast 11 > MA Forecast 11
🔹 RSI Forecast 11 < MA Forecast 11
🔹 RSI Forecast 12 > MA Forecast 12
🔹 RSI Forecast 12 < MA Forecast 12
🔹 RSI Forecast 13 > MA Forecast 13
🔹 RSI Forecast 13 < MA Forecast 13
🔹 RSI Forecast 14 > MA Forecast 14
🔹 RSI Forecast 14 < MA Forecast 14
🔹 RSI Forecast 15 > MA Forecast 15
🔹 RSI Forecast 15 < MA Forecast 15
🔹 RSI Forecast 16 > MA Forecast 16
🔹 RSI Forecast 16 < MA Forecast 16
🔹 RSI Forecast 17 > MA Forecast 17
🔹 RSI Forecast 17 < MA Forecast 17
🔹 RSI Forecast 18 > MA Forecast 18
🔹 RSI Forecast 18 < MA Forecast 18
🔹 RSI Forecast 19 > MA Forecast 19
🔹 RSI Forecast 19 < MA Forecast 19
🔹 RSI Forecast 20 > MA Forecast 20
🔹 RSI Forecast 20 < MA Forecast 20
______________________________________________________
______________________________________________________
🔸 CONDITIONS TO SELL 📉
______________________________________________________
• Signal Validity: The signal will remain valid for X bars .
• Signal Sequence: Configurable as AND or OR .
📉 RSI Conditions:
🔸 RSI > Upper
🔸 RSI < Upper
🔸 RSI > Lower
🔸 RSI < Lower
🔸 RSI > Middle
🔸 RSI < Middle
🔸 RSI > MA
🔸 RSI < MA
📉 MA Conditions:
🔸 MA > Upper
🔸 MA < Upper
🔸 MA > Lower
🔸 MA < Lower
📉 Crossovers:
🔸 RSI (Crossover) Upper
🔸 RSI (Crossunder) Upper
🔸 RSI (Crossover) Lower
🔸 RSI (Crossunder) Lower
🔸 RSI (Crossover) Middle
🔸 RSI (Crossunder) Middle
🔸 RSI (Crossover) MA
🔸 RSI (Crossunder) MA
🔸 MA (Crossover) Upper
🔸 MA (Crossunder) Upper
🔸 MA (Crossover) Lower
🔸 MA (Crossunder) Lower
📉 RSI Divergences:
🔸 RSI Divergence Bull
🔸 RSI Divergence Bear
📉 RSI Forecast:
🔸 RSI (Crossover) MA Forecast
🔸 RSI (Crossunder) MA Forecast
🔸 RSI Forecast 1 > MA Forecast 1
🔸 RSI Forecast 1 < MA Forecast 1
🔸 RSI Forecast 2 > MA Forecast 2
🔸 RSI Forecast 2 < MA Forecast 2
🔸 RSI Forecast 3 > MA Forecast 3
🔸 RSI Forecast 3 < MA Forecast 3
🔸 RSI Forecast 4 > MA Forecast 4
🔸 RSI Forecast 4 < MA Forecast 4
🔸 RSI Forecast 5 > MA Forecast 5
🔸 RSI Forecast 5 < MA Forecast 5
🔸 RSI Forecast 6 > MA Forecast 6
🔸 RSI Forecast 6 < MA Forecast 6
🔸 RSI Forecast 7 > MA Forecast 7
🔸 RSI Forecast 7 < MA Forecast 7
🔸 RSI Forecast 8 > MA Forecast 8
🔸 RSI Forecast 8 < MA Forecast 8
🔸 RSI Forecast 9 > MA Forecast 9
🔸 RSI Forecast 9 < MA Forecast 9
🔸 RSI Forecast 10 > MA Forecast 10
🔸 RSI Forecast 10 < MA Forecast 10
🔸 RSI Forecast 11 > MA Forecast 11
🔸 RSI Forecast 11 < MA Forecast 11
🔸 RSI Forecast 12 > MA Forecast 12
🔸 RSI Forecast 12 < MA Forecast 12
🔸 RSI Forecast 13 > MA Forecast 13
🔸 RSI Forecast 13 < MA Forecast 13
🔸 RSI Forecast 14 > MA Forecast 14
🔸 RSI Forecast 14 < MA Forecast 14
🔸 RSI Forecast 15 > MA Forecast 15
🔸 RSI Forecast 15 < MA Forecast 15
🔸 RSI Forecast 16 > MA Forecast 16
🔸 RSI Forecast 16 < MA Forecast 16
🔸 RSI Forecast 17 > MA Forecast 17
🔸 RSI Forecast 17 < MA Forecast 17
🔸 RSI Forecast 18 > MA Forecast 18
🔸 RSI Forecast 18 < MA Forecast 18
🔸 RSI Forecast 19 > MA Forecast 19
🔸 RSI Forecast 19 < MA Forecast 19
🔸 RSI Forecast 20 > MA Forecast 20
🔸 RSI Forecast 20 < MA Forecast 20
______________________________________________________
______________________________________________________
🤖 AUTOMATION 🤖
• You can automate the BUY and SELL signals of this indicator.
______________________________________________________
______________________________________________________
⯁ UNIQUE FEATURES
______________________________________________________
Linear Regression: (Forecast)
Signal Validity: The signal will remain valid for X bars
Signal Sequence: Configurable as AND/OR
Condition Table: BUY/SELL
Condition Labels: BUY/SELL
Plot Labels in the Graph Above: BUY/SELL
Automate and Monitor Signals/Alerts: BUY/SELL
Linear Regression (Forecast)
Signal Validity: The signal will remain valid for X bars
Signal Sequence: Configurable as AND/OR
Condition Table: BUY/SELL
Condition Labels: BUY/SELL
Plot Labels in the Graph Above: BUY/SELL
Automate and Monitor Signals/Alerts: BUY/SELL
______________________________________________________
📜 SCRIPT : RSI Full Forecast
🎴 Art by : @Titans_Invest & @DiFlip
👨💻 Dev by : @Titans_Invest & @DiFlip
🎑 Titans Invest — The Wizards Without Gloves 🧤
✨ Enjoy!
______________________________________________________
o Mission 🗺
• Inspire Traders to manifest Magic in the Market.
o Vision 𐓏
• To elevate collective Energy 𐓷𐓏

RSI Full [Titans_Invest]RSI Full
One of the most complete RSI indicators on the market.
While maintaining the classic RSI foundation, our indicator integrates multiple entry conditions to generate more accurate buy and sell signals.
All conditions are fully configurable, allowing complete customization to fit your trading strategy.
⯁ WHAT IS THE RSI❓
The Relative Strength Index (RSI) is a technical analysis indicator developed by J. Welles Wilder. It measures the magnitude of recent price movements to evaluate overbought or oversold conditions in a market. The RSI is an oscillator that ranges from 0 to 100 and is commonly used to identify potential reversal points, as well as the strength of a trend.
⯁ HOW TO USE THE RSI❓
The RSI is calculated based on average gains and losses over a specified period (usually 14 periods). It is plotted on a scale from 0 to 100 and includes three main zones:
Overbought: When the RSI is above 70, indicating that the asset may be overbought.
Oversold: When the RSI is below 30, indicating that the asset may be oversold.
Neutral Zone: Between 30 and 70, where there is no clear signal of overbought or oversold conditions.
⯁ ENTRY CONDITIONS
The conditions below are fully flexible and allow for complete customization of the signal.
______________________________________________________
🔹 CONDITIONS TO BUY 📈
______________________________________________________
• Signal Validity: The signal will remain valid for X bars .
• Signal Sequence: Configurable as AND/OR .
📈 RSI Conditions:
🔹 RSI > Upper
🔹 RSI < Upper
🔹 RSI > Lower
🔹 RSI < Lower
🔹 RSI > Middle
🔹 RSI < Middle
🔹 RSI > MA
🔹 RSI < MA
📈 MA Conditions:
🔹 MA > Upper
🔹 MA < Upper
🔹 MA > Lower
🔹 MA < Lower
📈 Crossovers:
🔹 RSI (Crossover) Upper
🔹 RSI (Crossunder) Upper
🔹 RSI (Crossover) Lower
🔹 RSI (Crossunder) Lower
🔹 RSI (Crossover) Middle
🔹 RSI (Crossunder) Middle
🔹 RSI (Crossover) MA
🔹 RSI (Crossunder) MA
🔹 MA (Crossover) Upper
🔹 MA (Crossunder) Upper
🔹 MA (Crossover) Lower
🔹 MA (Crossunder) Lower
📈 RSI Divergences:
🔹 RSI Divergence Bull
🔹 RSI Divergence Bear
______________________________________________________
______________________________________________________
🔸 CONDITIONS TO SELL 📉
______________________________________________________
• Signal Validity: The signal will remain valid for X bars .
• Signal Sequence: Configurable as AND/OR .
📉 RSI Conditions:
🔸 RSI > Upper
🔸 RSI < Upper
🔸 RSI > Lower
🔸 RSI < Lower
🔸 RSI > Middle
🔸 RSI < Middle
🔸 RSI > MA
🔸 RSI < MA
📉 MA Conditions:
🔸 MA > Upper
🔸 MA < Upper
🔸 MA > Lower
🔸 MA < Lower
📉 Crossovers:
🔸 RSI (Crossover) Upper
🔸 RSI (Crossunder) Upper
🔸 RSI (Crossover) Lower
🔸 RSI (Crossunder) Lower
🔸 RSI (Crossover) Middle
🔸 RSI (Crossunder) Middle
🔸 RSI (Crossover) MA
🔸 RSI (Crossunder) MA
🔸 MA (Crossover) Upper
🔸 MA (Crossunder) Upper
🔸 MA (Crossover) Lower
🔸 MA (Crossunder) Lower
📉 RSI Divergences:
🔸 RSI Divergence Bull
🔸 RSI Divergence Bear
______________________________________________________
______________________________________________________
🤖 AUTOMATION 🤖
• You can automate the BUY and SELL signals of this indicator.
______________________________________________________
______________________________________________________
⯁ UNIQUE FEATURES
______________________________________________________
Signal Validity: The signal will remain valid for X bars
Signal Sequence: Configurable as AND/OR
Condition Table: BUY/SELL
Condition Labels: BUY/SELL
Plot Labels in the Graph Above: BUY/SELL
Automate and Monitor Signals/Alerts: BUY/SELL
Signal Validity: The signal will remain valid for X bars
Signal Sequence: Configurable as AND/OR
Condition Table: BUY/SELL
Condition Labels: BUY/SELL
Plot Labels in the Graph Above: BUY/SELL
Automate and Monitor Signals/Alerts: BUY/SELL
______________________________________________________
📜 SCRIPT : RSI Full
🎴 Art by : @Titans_Invest & @DiFlip
👨💻 Dev by : @Titans_Invest & @DiFlip
🎑 Titans Invest — The Wizards Without Gloves 🧤
✨ Enjoy the Spell!
______________________________________________________
o Mission 🗺
• Inspire Traders to manifest Magic in the Market.
o Vision 𐓏
• To elevate collective Energy 𐓷𐓏

Dynamic RSI Bollinger Bands with Waldo Cloud
TradingView Indicator Description: Dynamic RSI Bollinger Bands with Waldo Cloud
Title: Dynamic RSI Bollinger Bands with Waldo Cloud
Short Title: Dynamic RSI BB Waldo
Overview:
Introducing an experimental indicator, the Dynamic RSI Bollinger Bands with Waldo Cloud, designed for adventurous traders looking to explore new dimensions in technical analysis. This indicator overlays on your chart, providing a unique perspective by integrating the Relative Strength Index (RSI) with Bollinger Bands, creating a dynamic trading tool that adapts to market conditions through the lens of momentum and volatility.
What is it?
This innovative indicator combines the traditional Bollinger Bands with the RSI in a way that hasn't been commonly explored. Here's a breakdown:
RSI Integration: The RSI is calculated with customizable length settings, and its values are used not just for momentum analysis but as the basis for the Bollinger Bands. This means the position and width of the bands are directly influenced by the RSI, offering a visual representation of momentum within the context of price volatility.
Dynamic Bollinger Bands: Instead of using price directly, the Bollinger Bands are calculated using a scaled version of the RSI. This scaling is done to fit the RSI values into the price range, ensuring the bands are relevant to the actual price movement. The standard deviation for these bands is also scaled accordingly, providing a unique volatility measure that's momentum-driven.
Waldo Cloud: Named after a visual representation concept, the 'Waldo Cloud' refers to the colored area between the Bollinger Bands, which changes based on various conditions:
Purple when RSI is overbought.
Blue when RSI is oversold.
Green for bullish conditions, defined by the fast-moving average crossing above the slow one, RSI is bullish, and the price is above the slow MA.
Red for bearish conditions, when the fast MA crosses below the slow MA, the RSI is bearish, and the price is below the slow MA.
Gray for neutral market conditions.
Moving Averages: Two simple moving averages (Fast MA and Slow MA) are included, which can be toggled on or off, offering additional trend analysis through crossovers.
How to Use It:
Given its experimental nature, this indicator should be used with caution and in conjunction with other analysis methods:
Identifying Market Conditions: Use the color of the Waldo Cloud to gauge market sentiment. A green cloud might suggest a good time to consider long positions, while a red cloud could indicate potential shorting opportunities. Purple and blue clouds highlight extreme conditions that might precede reversals.
Volatility and Momentum: The dynamic nature of the Bollinger Bands based on RSI provides insight into how momentum is affecting price volatility. When the bands are wide, it might indicate high momentum and potential trend continuation or reversal, depending on the RSI's position relative to its overbought/oversold levels.
Trend Confirmation: The moving average crossovers can act as confirmation signals. For instance, a bullish crossover (fast MA over slow MA) within a green cloud might strengthen a buy signal, whereas a bearish crossover in a red cloud might reinforce a sell decision.
Customization: Adjust the RSI length, overbought/oversold levels, and moving average lengths to suit different trading styles or market conditions. Experiment with these settings to find what works best for your strategy.
Combining with Other Indicators: Since this is an experimental tool, it's advisable to use it alongside established indicators like traditional Bollinger Bands, MACD, or trend lines to validate signals.
Conclusion:
The Dynamic RSI Bollinger Bands with Waldo Cloud is an experimental venture into combining momentum with volatility visually and interactively. It's designed for traders who are open to exploring new methods of market analysis.
Remember, due to its experimental status, this indicator should be part of a broader trading strategy, and backtesting or paper trading is recommended before applying it in live trading scenarios. Keep an eye on how the market reacts to the signals provided by this indicator and always consider risk management practices.

Super 6x: RSI, MACD, Stoch, Loxxer, CCI, & Velocity [Loxx]Super 6x: RSI , MACD , Stoch , Loxxer, CCI , & Velocity is a combination of 6 indicators into one histogram. This includes the option to allow repainting.
What is MACD?
Moving average convergence divergence ( MACD ) is a trend-following momentum indicator that shows the relationship between two moving averages of a security’s price. The MACD is calculated by subtracting the 26-period exponential moving average ( EMA ) from the 12-period EMA .
What is CCI?
The Commodity Channel Index ( CCI ) measures the current price level relative to an average price level over a given period of time. CCI is relatively high when prices are far above their average. CCI is relatively low when prices are far below their average. Using this method, CCI can be used to identify overbought and oversold levels.
What is RSI?
The relative strength index is a technical indicator used in the analysis of financial markets. It is intended to chart the current and historical strength or weakness of a stock or market based on the closing prices of a recent trading period. The indicator should not be confused with relative strength .
What is Stochastic?
The stochastic oscillator, also known as stochastic indicator, is a popular trading indicator that is useful for predicting trend reversals. It also focuses on price momentum and can be used to identify overbought and oversold levels in shares, indices, currencies and many other investment assets.
What is Loxxer?
The Loxxer indicator is a technical analysis tool that compares the most recent maximum and minimum prices to the previous period's equivalent price to measure the demand of the underlying asset.
What is Velocity?
In simple words, velocity is the speed at which something moves in a particular direction. For example as the speed of a car travelling north on a highway, or the speed a rocket travels after launching.
How to use
Long signal: All 4 indicators turn green
Short signal: All 4 indicators turn red
Included
Bar coloring
Alerts

Price Volume Strength ComparatorBollinger bands says whether price or any source is relatively high or low at any particular point of time. We can apply Bollinger bands on RSI and volume indicator Price Volume Trend to identify if RSI movement or PVT movement is relatively high or low.
By calculating Bollinger %B, we can define the variation in a range between 0 to 1. By applying Bollinger %B on price, volume and strength, we are trying to compare how much they differ relative to each other.
For example, if Bollinger %B of volume is higher than Bollinger %B of price, which may mean, we can still expect continuation of upward movement. If volume %B is lesser, we can interpret this as price has moved more than the volume and may retrace back.
Note: I tried adding multiple volume/strength indicators as input choice. But, if condition did not work with simple string. Have no idea why. I will try adding that later if more people show interest.

Multi-Exchange Volume (30 Tickers) by kurtsmock + BV + rVolauthor: kurtsmock
Fully Customizable ticker set. Up to 30 Tickers. Bitcoin set as default.
-- IMPORTANT NOTE: --
30 Exchanges are a lot. It can take a while to load. You can fully customize this indicator to your liking. Here's how:
1. Load indicator
2. Open Settings
3. Uncheck the switch box for exchanges you want unincluded
4. At the bottom of the settings menu click "Defaults" and hit "Save as Default"
5. To turn them all back on, hit "Reset Settings" in that same "Defaults" menu and click "Save as Default" again.
Also, you don't have to use this with Bitcoin. This works with any asset, just change the ticker in the settings.
There's a lot going on with this indicator so the following is descriptions and instructions to help you better understand what's going on here. Thanks!
Goal:
- To provide a mechanism for assets on multiple exchanges to have their volume evaluated together
Edge:
- Having better and more complete volume information
Notes:
- The Default Exchanges for this indicator are highest volume bitcoin exchanges, but may contain "fake volume"
- Indicator is set for Bitcoin by default. However, you can change the tickers to reflect any asset you want
////// rVol //////
Goal:
- To understand how much volume is being executed relative to the same candle on previous days/periods
Edge:
- Higher rVol implies higher volatility and market interest.
- High rVol = higher than average volume . Markets move on volume so higher than average volume indicates increased market activity/volatility
- rVol is an indirect measure of active or anticipated volatility
Definitions:
- rVol: The volume of a period compared to the Average Volume of that same period in past sessions
- Important to note it does NOT add up the last 10 (default) candles, but rather the last 10 candles at session intervals.
- Example:
-- On a Tuesday, 1h chart it will add up the last ten Tuesday, 9:00 am candles, not including the current, active candle.
-- It then averages those lookback candles.
-- It then plots the percentage relationship between the most recent candle and the average of the lookback candles
-- Avg Vol of Lookback candles = 5000,
-- Volume of most recent candle = 4000: Output = rVol = 80:
-- Volume of most recent candle was 80% of the average volume in the 9 am time period of the last ten Tuesdays in the 9 am, 1h period
Notes:
- rVol does not add current candle volume into lookback sum. So, you set lookback to be: (not including the current day)
- rVol is on a switch. So, if you want to see rVol instead of volume, hit the switch in the settings
- If you want to see both, load 2 instances of the indicator.
////// Better-er Volume //////
Goal:
To Identify:
- When a candle closes at the highest volume * range relative to the lookback period and close > open
- When a candle closes at the highest volume * range relative to the lookback period and close < open
- When a candle closes at the highest volume / price relative to the lookback period
Edge:
- Identifies beginnings of price expansion, climax of price expansion, breakouts, pivots, and take profit points on the volume chart
Notes:
- Based generally on Barry Taylor's "Better Volume" indicator and ideas from Pascal Willain's book "Value in Time."
- Better-er Volume rules are applied to both Total Volume or rVol.
-- When rVol is displayed Better-er Volume is applied to rVol
-- When Total Volume is displayed Better-er Volume is applied to Total Volume
// Plot Key: //
Green Triangle Up = Often marks the beginning and/or end of price expansion to the upside
Red Triangle Up = Often marks the beginning and/or end of price expansion to the downside
Yellow Square = High Volume but Tight Range. Implies a Battle of Bulls and Bears. High Liquidity area. Provided Liquidity is not enough to move price. Thick Limit Order Book.
Purple Triangle Up or Down = Implies high market participation. Typically at the end of expansion when very significant s/r is hit
category: volume Volatility
tags: Volume rVol relativevolume Bitcoin cryptocurrency bettervolume
Many More Volume Indicators Coming Out Soon!

RS Proxy Suite (Sector-Weighted) - by kuokkuokIndicator Description
RS Proxy Suite (Sector-Weighted) is a Pine Script indicator for TradingView, designed for stock traders to calculate a stock's Relative Strength (RS) proxy score. This indicator simulates a market proxy universe by weighting multiple sector ETFs, evaluating a stock's strength relative to a benchmark like the SPX. Inspired by the M.E.T.S. (Multiple Edge Trading Strategy) system, it helps users identify market-leading stocks, potential breakout opportunities, and low-risk entry points.
Key Features and Benefits:
RS Proxy Rating (1–99 Score): Computes the stock's RS score (higher is stronger), aiding in screening super-strong stocks. A score above 80 indicates the stock outperforms most peers, making it a prime buy candidate.
RS Line and Blue Dot Divergence: Displays the RS line trend and marks RS-leading new high divergences. This acts like an "early warning light," signaling potential low-risk entries (e.g., when RS hits a new high but price hasn't caught up yet).
Sector-Weighted Design: Integrates Growth, Cyclical, Defensive, and Policy ETFs to simulate a comprehensive market environment. Weights are adjustable for flexibility across market phases.
Dashboard Display: A concise panel shows RS Rating, RS Trend, and Blue Dot status for quick decision-making.
Application Scenarios: Ideal for technical analysts to screen leaders, spot trend reversals, or confirm breakouts with VCP patterns (Volatility Contraction Patterns). Its strength lies in avoiding single-index bias for more stable RS assessments.
This indicator avoids subjective judgments, relying on quantitative momentum calculations to help traders "go with the flow" and reduce false breakout risks. Shared for community use—feedback welcome for improvements.
User Manual -
This manual guides you on installing and using the RS Proxy Suite (Sector-Weighted) indicator on TradingView. It's suited for daily or weekly charts, applicable to US stocks or markets correlated with SPX. Ensure your TradingView account supports Pine Script v6.
1. Installation Steps
Step 1: Log in to TradingView and open the Chart page.
Step 2: Click the "Indicators" button in the top toolbar, search for "RS Proxy Suite (Sector-Weighted)" (or paste the Pine Script code into the Pine Editor and add it).
Step 3: If installing from the Community Scripts library, click "Add to Chart"; for custom code, save and add to the chart.
Step 4: The indicator will appear below the chart (overlay=false). Confirm no error messages.
2. Parameter Adjustment Guide
The indicator offers multiple input parameters in TradingView's "Settings" panel. Defaults are optimized, but adjust based on market conditions. Here's a grouped breakdown:
Data Source:
Market Index SPX: Default "SP:SPX", changeable to other indices (e.g., "TVC:NDX").
Calculation Price: Default close (closing price), switch to high/low/open for sensitivity tweaks.
RS Momentum Periods (Adjustable):
Short Term (Default 63 days): Short-term momentum; larger values smooth it out.
Medium Term (Default 126 days): Mid-term momentum.
Long Term (Default 252 days): Long-term momentum for capturing major trends.
Momentum Weights:
Short Term Weight: Default 0.4, emphasizes recent performance.
Medium Term Weight: Default 0.2.
Long Term Weight: Default 0.4. Sum doesn't need to be 1; system normalizes automatically.
Sector Weights: Each ETF weight is independently adjustable (step 0.1). Defaults reflect sector importance, e.g., higher for growth ETFs.
XLK Weight (Technology): Default 1.5.
SOXX Weight (Semiconductors): Default 1.3.
XLY Weight (Consumer Discretionary): Default 1.2.
XLC Weight (Communication Services): Default 1.1.
XLG Weight (Large Cap Growth): Default 1.3.
XLI Weight (Industrials): Default 1.0.
XLF Weight (Financials): Default 1.0.
XLB Weight (Materials): Default 0.9.
XLE Weight (Energy): Default 0.9.
XLV Weight (Health Care): Default 0.8.
XLP Weight (Consumer Staples): Default 0.8.
XLU Weight (Utilities): Default 0.7.
XLRE Weight (Real Estate): Default 0.7.
PPA Weight (Aerospace & Defense): Default 0.9.
Adjustment Tips: Boost XLK/SOXX for tech-favorable markets; increase XLV/XLP for defensive phases.
Visualization Settings:
Show RS Line: Displays RS line (black) and 50-day MA (gray).
Show Blue Dot Divergence (Blue Dot): Marks divergence signals.
Show Dashboard: Enables the dashboard.
Dashboard Position: Choose locations like "Bottom Right".
3. Output Interpretation
RS Line: Black line shows stock strength vs. SPX; upward trend means outperforming. Gray line is 50-day MA—breaking above signals strength.
Blue Dot: Blue circle appears for RS leading price new highs (like a "coiled spring"), indicating potential low-risk entries. Confirm with: RS > 50-day MA and volume surge.
Dashboard:
RS Rating: Score 1–99; green (>80) for strong, yellow (50–80) neutral, red (<50) weak.
RS Trend: Green "Strong" or red "Weak".
Blue Dot: Blue "Present" or red "None".
Interpretation Analogy: RS Rating is like a stock's "health score"—above 80 is an "athlete" worth tracking for breakouts; Blue Dot is a "green light," but pair with volume to confirm true breakouts (avoid fakes).
4. Usage Examples
Screening Leaders: Add to AAPL chart—if RS Rating > 85 and Blue Dot appears, check if price nears VCP pivot; this is a low-risk buy setup.
Trend Judgment: Rising RS line with M.E.T.S. Stage 2 (uptrend) confirms trend-following trades.
Weight Tweaks: For defensive markets, raise XLV/XLU weights and recalculate RS Proxy.
5. Common Issues and Warnings
Q: Indicator not showing? A: Verify ETF symbols (e.g., AMEX:XLK) or switch timeframes.
Q: Inaccurate scores? A: Adjust periods/weights and backtest on historical data.
Q: Avoiding false breakouts? A: Combine with volume and support/resistance; Blue Dot is a alert, not a buy signal.
Warnings: Based on historical data; markets are volatile—use with other tools. Results are for reference only, not investment advice. Test in a demo account.

RSI DeviationAn oscillator which de-trends the Relative Strength Index. Rather, it takes a moving average of RSI and plots it's standard deviation from the MA, similar to a Bollinger %B oscillator. This seams to highlight short term peaks and troughs, Indicating oversold and overbought conditions respectively. It is intended to be used with a Dollar Cost Averaging strategy, but may also be useful for Swing Trading, or Scalping on lower timeframes.
When the line on the oscillator line crosses back into the channel, it signals a trade opportunity.
~ Crossing into the band from the bottom, indicates the end of an oversold condition, signaling a potential reversal. This would be a BUY signal.
~ Crossing into the band from the top, indicates the end of an overbought condition, signaling a potential reversal. This would be a SELL signal.
For ease of use, I've made the oscillator highlight the main chart when Overbought/Oversold conditions are occurring, and place fractals upon reversion to the Band. These repaint as they are calculated at close. The earliest trade would occur upon open of the following day.
I have set the default St. Deviation to be 2, but in my testing I have found 1.5 to be quite reliable. By decreasing the St. Deviation you will increase trade frequency, to a point, at the expense of efficiency.
Cheers
DJSnoWMan06

RSI AcceleratorThe Relative Strength Index (RSI) is like a fitness tracker for the underlying time series. It measures how overbought or oversold an asset is, which is kinda like saying how tired or energized it is.
When the RSI goes too high, it suggests the asset might be tired and due for a rest, so it could be a sign it's gonna drop. On the flip side, when the RSI goes too low, it's like the asset is pumped up and ready to go, so it might be a sign it's gonna bounce back up. Basically, it helps traders figure out if a stock is worn out or revved up, which can be handy for making decisions about buying or selling.
The RSI Accelerator takes the difference between a short-term RSI(5) and a longer-term RSI(14) to detect short-term movements. When the short-term RSI rises more than the long-term RSI, it typically refers to a short-term upside acceleration.
The conditions of the signals through the RSI Accelerator are as follows:
* A bullish signal is generated whenever the Accelerator surpasses -20 after having been below it.
* A bearish signal is generated whenever the Accelerator breaks 20 after having been above it.

Easy RSI by nnamWhat Does this Indicator Do?
The Easy RSI Indicator color codes candles based on their RSI Value vs. Open / Close (Red / Green). It plots the current price and current RSI value on the chart in real-time. Additionally, when the RSI Value is in an oversold or overbought condition, it plots that signal on the chart in real-time.
The initial candle color is the standard Red / Green Tradingview color, but a Gradient is added to the color which either darkens or lightens the color based on the RSI Value.
As seen in the screenshot below, the higher the RSI Value, the brighter the Green Color is. The lower the RSI Value, the brighter the Red Color is.
The current Price and current RSI Value are both plotted on the chart by default, but can be optionally switched off by the trader.
As seen in the screenshot below, the prices and RSI Values are easily seen while visually tracking the price in real-time.
RSI Overbought Values are plotted when the Overbought condition is triggered. The Default is RED for Overbought and GREEN for Oversold.
As seen in the screenshot below, with all three labels turned on under the input settings (these are ON by default) you can see the overbought condition, the current RSI Value, and current price all in one centralized area. Oversold Values are also plotted when turned on under the input settings.
As shown in the screenshot below, the candle is GREEN (as evident by the green candle outline) but the RSI Value is low and shows lower than average relative strength. This turns the bar color ORANGE vs, GREEN showing that the relative strength of the move is subpar.
As shown on the screenshot below, if the trader has the standard Tradingview Price label switched on (in the Tradingview Chart Settings), the color of the bar is also translated to the price are for an easy to recognize RSI Value just by looking at the price. Even if the current candle is RED, when the RSI is higher than lower, the color will be green / greenish and even if the current candle is GREEN, when the RSI Value is lower than higher, the color will be red-ish / orange in color giving the user a quick view of RSI Value.
If you have any questions or feature requests for this Indicator please do not hesitate to reach out and ask.
GOOD LUCK trading!!
~nnamdert