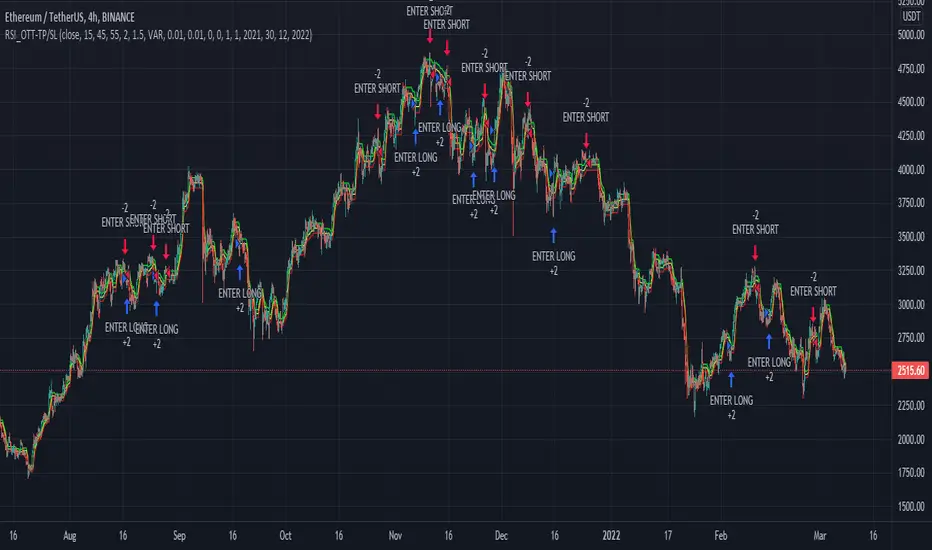
RSI_OTT - TP/SLWhile creating this strategy, I was inspired by "ott(by Anıl Özekşi)" and "RSI + Bollinger Double Strategy(by ChartArt)".
Basically, the strategy uses ott bands instead of bollinger bands in the "RSI+Bollinger Double Strategy".
User can select take profit, stop loss, position direction(long, short or both) and the other ott parameters via interface.
Cari dalam skrip untuk "TAKE"
Anna-LysaEspecially useful when using it for stocks in intraday screening for daytrading.
This gives you quick information about the volatility at the moment when you look at the stock.
The current range of the last candles (adjustable) is calculated so that you can stop based on the Vola.
In addition, the daily volume and daily range are calculated in the table and what is left of the average.
So that you can adjust your ideas for the movement in order to take profit. No matter what the timeframe, you can see how the volume compares to that of the previous few candles and thus anticipate the most likely breakout.
Then the most relevant day trading levels ( Premarkets, Lastday high/lows and some Ma´s ) are shown so that you can get a very fast overview of the stock at the moment.
All levels and labels and colors are adjustable or hidden in the settings.

Levels Of Greed
The Levels Of Greed indicator is based on the same idea as the Levels Of Fear one and was suggested by several traders in the comment section. It helps analyze price advances to find the best levels for closing a long position in an asset after a quick surge or longer up-trend. In finance, volatility is a term that describes the degree of variation of an asset price over time. It is usually denoted by the letter σ (sigma) and estimated as the standard deviation of the asset price or price returns. The Levels Of Greed indicator helps measure the current price advance in the standard deviation units. It plots seven levels at distances of 1, 2, 3, 4, 5, 6, and 7 standard deviations (sigmas) above the base price (the recent lowest price or lower bound of the established range). In what follows, we will refer to these levels as levels of greed.
HOW TO USE
When the price in its surge reaches a certain level of greed, it means that it has surged from its recent lowest value by a corresponding number of standard deviations. The indicator helps traders see the maximum levels to which the price may rise and estimate the potential height of the current surge. Five-seven sigma surges are relatively rare events and correspond to significant market exuberance. Careful traders and shorter-term ones would not want to participate in the bandwagon effect and herd behavior that drive market bubbles. They prefer to take their profits when the market is not exceedingly overbought.
SETTINGS
Window : the averaging window or period of the indicator. The algorithm uses this parameter to calculate the base level and standard deviations. Higher values are better for measuring deeper and longer surges.
Levels Stability : the parameter used in the up-move detection. The higher the value is, the more stable and long the greed levels are, but at the same time, the lag increases. The lower it is, the faster the indicator responds to the price changes, but the greed levels are recalculated more frequently and are less stable. This parameter is mostly for fine-tuning. It does not change the overall picture much.
Mode : the parameter that defines the style for the labels. In the Cool Guys Mode, the indicator displays the labels as emojis. In the Serious Guys Mode, labels show the distance from the base level measured in standard deviation units or sigmas.

Levels Of Greed [AstrideUnicorn]The Levels Of Greed indicator is based on the same idea as the Levels Of Fear one and was suggested by several traders in the comment section. It helps analyze price advances to find the best levels for closing a long position in an asset after a quick surge or longer up-trend. In finance, volatility is a term that describes the degree of variation of an asset price over time. It is usually denoted by the letter σ (sigma) and estimated as the standard deviation of the asset price or price returns. The Levels Of Greed indicator helps measure the current price advance in the standard deviation units. It plots seven levels at distances of 1, 2, 3, 4, 5, 6, and 7 standard deviations (sigmas) above the base price (the recent lowest price or lower bound of the established range). In what follows, we will refer to these levels as levels of greed.
HOW TO USE
When the price in its surge reaches a certain level of greed, it means that it has surged from its recent lowest value by a corresponding number of standard deviations. The indicator helps traders see the maximum levels to which the price may rise and estimate the potential height of the current surge. Five-seven sigma surges are relatively rare events and correspond to significant market exuberance. Careful traders and shorter-term ones would not want to participate in the bandwagon effect and herd behavior that drive market bubbles. They prefer to take their profits when the market is not exceedingly overbought.
SETTINGS
Window : the averaging window or period of the indicator. The algorithm uses this parameter to calculate the base level and standard deviations. Higher values are better for measuring deeper and longer surges.
Levels Stability : the parameter used in the up-move detection. The higher the value is, the more stable and long the greed levels are, but at the same time, the lag increases. The lower it is, the faster the indicator responds to the price changes, but the greed levels are recalculated more frequently and are less stable. This parameter is mostly for fine-tuning. It does not change the overall picture much.
Mode : the parameter that defines the style for the labels. In the Cool Guys Mode , the indicator displays the labels as emojis. In the Serious Guys Mode , labels show the distance from the base level measured in standard deviation units or sigmas.

%-[Guz] Vortex Indicator Custom// Custom Vortex Strategy (backtester)
// Custom version of the Vortex indicators that adds many features:
// -Triggers trades after a threshold is reached instead of the normal vortex lines cross (once the difference between the 2 lines is important enough)
// -Smooths the Vortex lines with an EMA
// -Adds Take Profit and Stop Loss selection
// -Adds the possibility to go Long only, Short only or both of them
// ! notice that it uses 10% position size and 0.04% trade fee, found on some crypto exchanges futures contracts
// Allows testing leverage with position size modification (values above 100% position size, to be done with caution)
// Not an investment advice

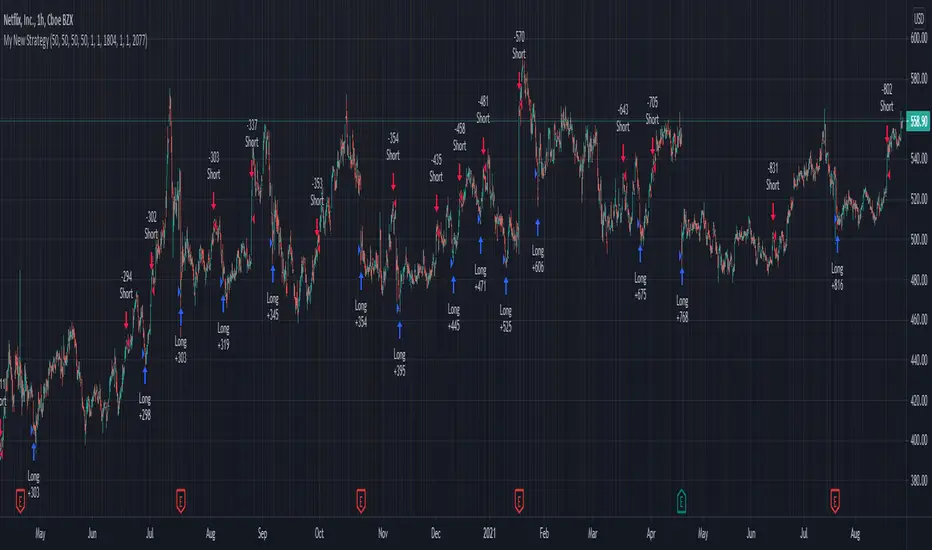
Strategy TemplateThis is the fastest way to create a Trading View strategy. The template I have created includes stoploss and take profit enabling and plotting, date range, and strategy buy and sell conditions. I believe this will benefit the people in the Trading View community by creating a strategy faster and more efficiently than just repeating pine script code. All that needs to be done by the person using this script is to add their own indicators, and create their own buy and sell signals. Then they can immediately start back testing their new strategy!
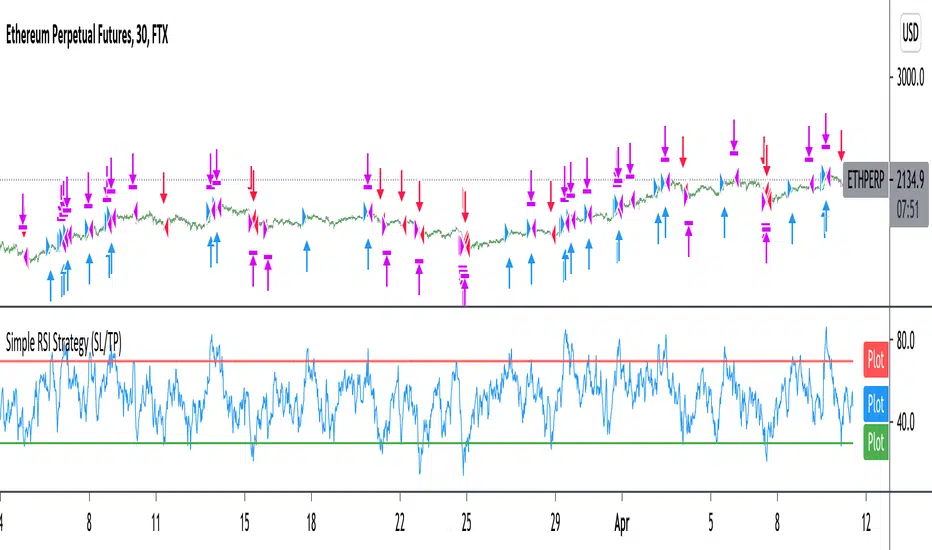
Improved simple RSI Buy/Sell at a level (SL/TP)Improved Simple Strategy based on RSI, using overbought or oversold levels.
Backtest: ETHPERP (FTX) - 30m
Set STOP LOSS and GET PROFIT as a percentage (2% and 10% by default).
If strategy.position_size != 0 algorithm convert percentages into points and set stop loss and take profit limit orders.
Indicator - ATR Profit Loss - DGHi Traders,
This is an on chart indicator that can be used for setting take profit and stop losses very easily using the Average True Range Indicator (ATR). Using a volatility adjusted TP and SL will allow you to set your targets and losses based on market conditions. In the settings, you are able to adjust how much of a multiplier you require depending on your risk tolerance and strategy. For those that follow the NNFX method, the defult settings are preset to 1xATR TP and 1.5xATR SL.
How to use:
- For longs, 'isLong' box must be ticked, for shorts, this box is unticked
- For longs, green line is TP, red line is SL
- For shorts, red line is TP, green line is SL
Regards,
Dillon Grech

Trend trader StrategyFirst I would like to thank to @JustUncleL since this strategy started from one of his scalper strategies
This strategy can be adapted to all time charts .
First it has the session where we want to trade, for this example I choosed the EURUSD so I only take in consideration london/neywork session.
Its made from 3 EMA :
normal
slow
ultra slow
It has has the capacity to use HA candles into consideration if its needed.
At the same time we have a price channel made from faster MAs, that act like a bollinger band .
Together with all of them, we establish which trend we have if its uptrend or downtrend
Then we check the candles if they are below or above the MA , and based on the condition if they crossed recently we can suggest if its a buy or a long condition
At the same time we have 2 options of stop conditions:
Through a trailing stop made from ATR or % based
And second, a SL/TP made from pip points or % based.
For this example I used % based.
Let me know what you think about it, and if you found some nice settings for it. So far I only adapted to EURUSD 1 min time.

Daily RangeHey traders,
at first thanks to the one and only Master Educator Stefan Kassing for sharing his legendary system with us!
And also credit to Mortdiggiddy , RootDuk and PineCoders for helping me with the script =)
This script is calculating the daily range (in pips) of the current market you are in, in relation to the last 70 days (10 weeks) .
It is used for a possible Take Profit in Stefan Kassing's System .
How to add the script to your chart:
1. Click " Add to Favorite Scripts "
-> i.imgur.com
2. Go in the Chart & click the little arrow in the upper bar and then click " Daily Range ", then the Daily Range appears in the top left corner
-> i.imgur.com
To avoid errors make sure to right-click the Y-Axis on the right side of the chart and then left-click "Scale Price Chart Only" .
-> i.imgur.com
Also be aware that the daily range is only showing up , if you are in the daily time interval or below and you are not hovering with the cursor over the past candles respectively above or below them .
If you are using this script in exotic currencypairs or uncommon other markets , the daily range can be incorrect or not showing up .
So don't hesitate contacting me , then I will try to add the markets that you want to.
To change the color or the decimal places of the number, you can click the gear in the upper left corner.
-> i.imgur.com
Happy Pips

SUPERTREND ATR WITH TRAILING STOP LOSS## THIS SCRIPT IS ON GITHUB
## MORE BACKTEST
SuperTrend is a moving stop and reversal line based on the volatility (ATR).
The strategy will ride up your stop loss when price moviment 1%.
The strategy will close your operation when the market price crossed the stop loss.
The strategy will close operation when the line based on the volatility will crossed
The strategy has the following parameters:
+ **ATR PERIOD** - To select number of bars back to execute calculation
+ **ATR MULTPLIER** - To add a multplier factor on volatility
+ **INITIAL STOP LOSS** - Where can isert the value to first stop.
+ **POSITION TYPE** - Where can to select trade position.
+ **BACKTEST PERIOD** - To select range.
## DISCLAIMER
1. I am not licensed financial advisors or broker dealers. I do not tell you when or what to buy or sell. I developed this software which enables you execute manual or automated trades multiple trades using TradingView. The software allows you to set the criteria you want for entering and exiting trades.
2. Do not trade with money you cannot afford to lose.
3. I do not guarantee consistent profits or that anyone can make money with no effort. And I am not selling the holy grail.
4. Every system can have winning and losing streaks.
5. Money management plays a large role in the results of your trading. For example: lot size, account size, broker leverage, and broker margin call rules all have an effect on results. Also, your Take Profit and Stop Loss settings for individual pair trades and for overall account equity have a major impact on results. If you are new to trading and do not understand these items, then I recommend you seek education materials to further your knowledge.
**YOU NEED TO FIND AND USE THE TRADING SYSTEM THAT WORKS BEST FOR YOU AND YOUR TRADING TOLERANCE.**
**I HAVE PROVIDED NOTHING MORE THAN A TOOL WITH OPTIONS FOR YOU TO TRADE WITH THIS PROGRAM ON TRADINGVIEW.**
## NOTE
I accept suggestions to improve the script.
If you encounter any problems i will be happy to share with me.
+ Authors: @exit490
+ Revision: v1.0.0
+ Date: 5-Aug-2019
+ Pinescript version: 4
## LICENSE
Copyright 2019 Mauricio Pimenta / exit490
SuperTrend with Trailing Stop Loss script may be freely distributed under the (../LICENSE).

lamBOTghini-ALERTador & SL/TP V3I publish the code again in case someone is interested in learning. I am not an expert, I learned from others who published their scripts and for this reason I do the same.
If someone tries to sell you a script it is because they do not make money with it in trading and they need to sell it to earn something.
It is a simple combination algorithm of 3 EMA with stop loss and Take profit and with alerts.
Enjoy!
¡Mucho ánimo a los Venezolanos!
¡Saludos desde España!

Stupid strategyStrategy with simple stop-loss and take-profit in percentage. If last trade was a successful one then repeat it. If not successful - do a reversal trade.

SL/TP assistantThis is a simple script to quickly see changes in % in each candle.
In blue open/close variation. In red Histogram with range between high and low.
This helps me understand very quickly what's the typical change in % for a specific timeframe/pair, so I can fine tune my Stop Losses and Take Profits.

RSI and MA with Trailing Stop Loss and Take Profit (by Coinrule)The relative strength index is a momentum indicator used in technical analysis. It measures the speed and magnitude of a coin's recent price changes to evaluate overvalued or undervalued conditions in the price of that coin. The RSI is displayed as an oscillator (a line graph essentially) on a scale of zero to 100. When the RSI reaches oversold levels, it can provide a signal to go long. When the RSI reaches overbought levels, it can mark a good exit point or alternatively, an entry for a short position. Traditionally, an RSI reading of 70 or above indicates an overbought situation. A reading of 30 or below indicates an oversold condition.
A moving average (MA) calculates the average of a selected range of prices, usually closing prices, by the number of periods in that range. Essentially it is used to help smooth out price data by creating a constantly updated average price.
The Strategy enters and closes trades when the following conditions are met:
Entry Conditions:
RSI is greater than 50
MA9 is greater than MA50
RSI increases by 5
Exit Conditions:
Price increases by 1% trailing
Price decreases by 2% trailing
This strategy is back-tested from 1 January 2022 to simulate how the strategy would work in a bear market. The strategy provides good returns.
The strategy assumes each order is using 30% of the available coins to make the results more realistic and to simulate you only ran this strategy on 30% of your holdings. A trading fee of 0.1% is also taken into account and is aligned to the base fee applied on Binance.

FVG + Bollinger + Toggles + Swing H&L (Taken/Close modes)This indicator combines multiple advanced market-structure tools into one unified system.
It detects A–C Fair Value Gaps (FVG) and plots them as dynamic boxes projected a fixed number of bars forward.
Each bullish or bearish FVG updates in real time and “closes” once price breaks through the opposite boundary.
The indicator also includes Bollinger Bands based on EMA-50 with adjustable deviation settings for volatility context.
Swing Highs and Swing Lows are identified using pivot logic and are drawn as dynamic lines that change color once taken out.
You can choose whether swings end on a close break or on any touch/violation of the level.
All visual elements—FVGs, Bollinger Bands, and Swing Lines—can be individually toggled on or off from the settings panel.
A time-window session box is included, allowing you to highlight a custom intraday window based on your selected timezone.
The session box automatically tracks the high and low of the window and locks the final range once the window closes.
Overall, the tool is designed for traders who want a structured, multi-layered view of liquidity, volatility, and intraday timing.

Stop Loss / Take Profit Table// (\_/)
// ( •.•)
// (")_(")
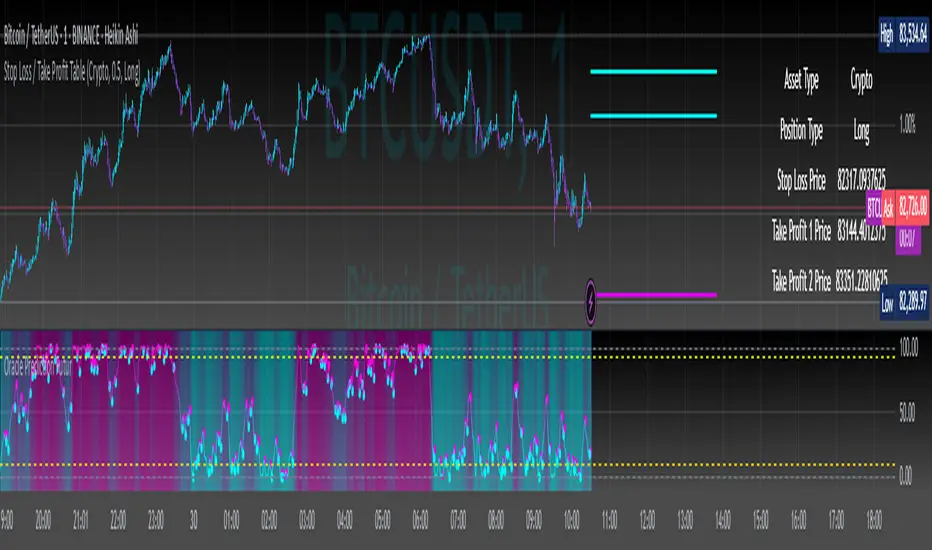
📈 Introducing the Stop Loss / Take Profit Table Indicator! 📈
Enhance your trading strategy with our powerful Stop Loss / Take Profit Table indicator, designed for traders in the Crypto, Stock, and Forex markets. This easy-to-use tool helps you manage risk and maximize profits by clearly displaying your Stop Loss and Take Profit levels based on your trading position.
Key Features:
Custom Asset Types: Choose between Crypto, Stock, or Forex to tailor the indicator to your specific trading style.
Dynamic Stop Loss & Take Profit Calculation: Set your desired Stop Loss percentage, and the indicator will automatically calculate your Stop Loss and two Take Profit levels based on different timeframes (1 min to 240 min).
Position Type Flexibility: Whether you're trading Long or Short, the indicator adjusts the calculations accordingly, providing you with precise price levels for effective risk management.
Visual Representation: Stop Loss and Take Profit levels are marked directly on the chart with distinctive horizontal lines in vibrant colors for easy reference.
Informative Table Display: A dedicated table displayed on the chart shows your asset type, position type, and calculated prices for Stop Loss and Take Profit levels, ensuring you have all critical data at a glance.
Alert Notifications: Stay informed with optional alerts that signal when your Stop Loss or Take Profit levels are hit, allowing you to react swiftly in fast-moving markets.
Why Use This Indicator?
Managing your trades is critical for success in the financial markets. With our Stop Loss / Take Profit Table, you can easily set your parameters and visually track your risk and reward levels, making it a practical addition to any trader's toolkit.
Get started today and take control of your trading strategy! ✨
Happy trading! 📊🚀
Dynamic Stop Loss & Take ProfitDynamic Stop Loss & Take Profit is a versatile risk management indicator that calculates dynamic stop loss and take profit levels based on the Average True Range (ATR). This indicator helps traders set adaptive exit points by using a configurable ATR multiplier and defining whether they are in a Long (Buy) or Short (Sell) trade.
How It Works
ATR Calculation – The indicator calculates the ATR value over a user-defined period (default: 14).
Stop Loss and Take Profit Multipliers – The ATR value is multiplied by a configurable factor (ranging from 1.5 to 4) to determine volatility-adjusted stop loss and take profit levels.
Trade Type Selection – The user can specify whether they are in a Long (Buy) or Short (Sell) trade.
Long (Buy) Trade:
Stop Loss = Entry Price - (ATR × Stop Loss Multiplier)
Take Profit = Entry Price + (ATR × Take Profit Multiplier)
Short (Sell) Trade:
Stop Loss = Entry Price + (ATR × Stop Loss Multiplier)
Take Profit = Entry Price - (ATR × Take Profit Multiplier)
Features
Configurable ATR length and multipliers
Supports both long and short trades
Clearly plotted Stop Loss (red) and Take Profit (green) levels on the chart
Helps traders manage risk dynamically based on market volatility
This indicator is ideal for traders looking to set adaptive stop loss and take profit levels without relying on fixed price targets.

MA Crossover with Demand/Supply Zones + Stop Loss/Take ProfitStop Loss and Take Profit Inputs:
Added stopLossPerc and takeProfitPerc as inputs to allow the user to define the stop loss and take profit levels as a percentage of the entry price.
Stop Loss and Take Profit Calculation:
For long positions, the stop loss is calculated as strategy.position_avg_price * (1 - stopLossPerc), and the take profit is calculated as strategy.position_avg_price * (1 + takeProfitPerc).
For short positions, the stop loss is calculated as strategy.position_avg_price * (1 + stopLossPerc), and the take profit is calculated as strategy.position_avg_price * (1 - takeProfitPerc).
Exit Strategy:
Added strategy.exit to define the stop loss and take profit levels for each trade. The from_entry parameter ensures that the exit is tied to the specific entry order.
Flexibility:
The stop loss and take profit levels are dynamic and adjust based on the entry price of the trade.
How It Works:
When a buy signal is generated (MA crossover near a demand zone), the strategy enters a long position and sets a stop loss and take profit level based on the input percentages.
When a sell signal is generated (MA crossunder near a supply zone), the strategy enters a short position and sets a stop loss and take profit level based on the input percentages.
The trade will exit automatically if either the stop loss or take profit level is hit.
Example:
If the entry price for a long position is $100, and the stop loss is set to 1% while the take profit is set to 2%:
Stop loss level =
100
∗
(
1
−
0.01
)
=
100∗(1−0.01)=99
Take profit level =
100
∗
(
1
+
0.02
)
=
100∗(1+0.02)=102
Notes:
You can adjust the stopLossPerc and takeProfitPerc inputs to suit your risk management preferences.
Always backtest the strategy to ensure the stop loss and take profit levels are appropriate for your trading instrument and timeframe.

Moving Average Crossover Strategy with Take Profit and Stop LossThe Moving Average Crossover Strategy is a popular trading technique that utilizes two moving averages (MAs) of different periods to identify potential buy and sell signals. By incorporating take profit and stop loss levels, traders can effectively manage their risk while maximizing potential returns. Here’s a detailed explanation of how this strategy works:
Overview of the Moving Average Crossover Strategy
Moving Averages:
A short-term moving average (e.g., 50-day MA) reacts more quickly to price changes, while a long-term moving average (e.g., 200-day MA) smooths out price fluctuations over a longer period.
The strategy generates trading signals based on the crossover of these two averages:
Buy Signal: When the short-term MA crosses above the long-term MA (often referred to as a "Golden Cross").
Sell Signal: When the short-term MA crosses below the long-term MA (known as a "Death Cross").
Implementing Take Profit and Stop Loss
1. Setting Take Profit Levels
Definition: A take profit order automatically closes a trade when it reaches a specified profit level.
Strategy:
Determine a realistic profit target based on historical price action, support and resistance levels, or a fixed risk-reward ratio (e.g., 2:1).
For instance, if you enter a buy position at $100, you might set a take profit at $110 if you anticipate that level will act as resistance.
2. Setting Stop Loss Levels
Definition: A stop loss order limits potential losses by closing a trade when the price reaches a specified level.
Strategy:
Place the stop loss just below the most recent swing low for buy orders or above the recent swing high for sell orders.
Alternatively, you can use a percentage-based method (e.g., 2-3% below the entry point) to define your stop loss.
For example, if you enter a buy position at $100 with a stop loss set at $95, your maximum loss would be limited to $5 per share.
Example of Using Moving Average Crossover with Take Profit and Stop Loss
Entry Signal:
You observe that the 50-day MA crosses above the 200-day MA at $100. You enter a buy position.
Setting Take Profit and Stop Loss:
You analyze historical price levels and set your take profit at $110.
You place your stop loss at $95 based on recent swing lows.
Trade Management:
If the price rises to $110, your take profit order is executed, securing your profit.
If the price falls to $95, your stop loss is triggered, limiting your losses.

Post-Open Long Strategy with ATR-based Stop Loss and Take ProfitThe "Post-Open Long Strategy with ATR-Based Stop Loss and Take Profit" is designed to identify buying opportunities after the German and US markets open. It combines various technical indicators to filter entry signals, focusing on breakout moments following price lateralization periods.
Key Components and Their Interaction:
Bollinger Bands (BB):
Description: Uses BB with a 14-period length and standard deviation multiplier of 1.5, creating narrower bands for lower timeframes.
Role in the Strategy: Identifies low volatility phases (lateralization). The lateralization condition is met when the price is near the simple moving average of the BB, suggesting an imminent increase in volatility.
Exponential Moving Averages (EMA):
10-period EMA: Quickly detects short-term trend direction.
200-period EMA: Filters long-term trends, ensuring entries occur in a bullish market.
Interaction: Positions are entered only if the price is above both EMAs, indicating a consolidated positive trend.
Relative Strength Index (RSI):
Description: 7-period RSI with a threshold above 30.
Role in the Strategy: Confirms the market is not oversold, supporting the validity of the buy signal.
Average Directional Index (ADX):
Description: 7-period ADX with 7-period smoothing and a threshold above 10.
Role in the Strategy: Assesses trend strength. An ADX above 10 indicates sufficient momentum to justify entry.
Average True Range (ATR) for Dynamic Stop Loss and Take Profit:
Description: 14-period ATR with multipliers of 2.0 for Stop Loss and 4.0 for Take Profit.
Role in the Strategy: Adjusts exit levels based on current volatility, enhancing risk management.
Resistance Identification and Breakout:
Description: Analyzes the highs of the last 20 candles to identify resistance levels with at least two touches.
Role in the Strategy: A breakout above this level signals a potential continuation of the bullish trend.
Time Filters and Market Conditions:
Trading Hours: Operates only during the opening of the German market (8:00 - 12:00) and US market (15:30 - 19:00).
Panic Candle: The current candle must close negative, leveraging potential emotional reactions in the market.
Avoiding Entry During Pullbacks:
Description: Checks that the two previous candles are not both bearish.
Role in the Strategy: Avoids entering during a potential pullback, improving trade success probability.
Post-Open Long Strategy with ATR-Based Stop Loss and Take Profit
The "Post-Open Long Strategy with ATR-Based Stop Loss and Take Profit" is designed to identify buying opportunities after the German and US markets open. It combines various technical indicators to filter entry signals, focusing on breakout moments following price lateralization periods.
Key Components and Their Interaction:
Bollinger Bands (BB):
Description: Uses BB with a 14-period length and standard deviation multiplier of 1.5, creating narrower bands for lower timeframes.
Role in the Strategy: Identifies low volatility phases (lateralization). The lateralization condition is met when the price is near the simple moving average of the BB, suggesting an imminent increase in volatility.
Exponential Moving Averages (EMA):
10-period EMA: Quickly detects short-term trend direction.
200-period EMA: Filters long-term trends, ensuring entries occur in a bullish market.
Interaction: Positions are entered only if the price is above both EMAs, indicating a consolidated positive trend.
Relative Strength Index (RSI):
Description: 7-period RSI with a threshold above 30.
Role in the Strategy: Confirms the market is not oversold, supporting the validity of the buy signal.
Average Directional Index (ADX):
Description: 7-period ADX with 7-period smoothing and a threshold above 10.
Role in the Strategy: Assesses trend strength. An ADX above 10 indicates sufficient momentum to justify entry.
Average True Range (ATR) for Dynamic Stop Loss and Take Profit:
Description: 14-period ATR with multipliers of 2.0 for Stop Loss and 4.0 for Take Profit.
Role in the Strategy: Adjusts exit levels based on current volatility, enhancing risk management.
Resistance Identification and Breakout:
Description: Analyzes the highs of the last 20 candles to identify resistance levels with at least two touches.
Role in the Strategy: A breakout above this level signals a potential continuation of the bullish trend.
Time Filters and Market Conditions:
Trading Hours: Operates only during the opening of the German market (8:00 - 12:00) and US market (15:30 - 19:00).
Panic Candle: The current candle must close negative, leveraging potential emotional reactions in the market.
Avoiding Entry During Pullbacks:
Description: Checks that the two previous candles are not both bearish.
Role in the Strategy: Avoids entering during a potential pullback, improving trade success probability.
Entry and Exit Conditions:
Long Entry:
The price breaks above the identified resistance.
The market is in a lateralization phase with low volatility.
The price is above the 10 and 200-period EMAs.
RSI is above 30, and ADX is above 10.
No short-term downtrend is detected.
The last two candles are not both bearish.
The current candle is a "panic candle" (negative close).
Order Execution: The order is executed at the close of the candle that meets all conditions.
Exit from Position:
Dynamic Stop Loss: Set at 2 times the ATR below the entry price.
Dynamic Take Profit: Set at 4 times the ATR above the entry price.
The position is automatically closed upon reaching the Stop Loss or Take Profit.
How to Use the Strategy:
Application on Volatile Instruments:
Ideal for financial instruments that show significant volatility during the target market opening hours, such as indices or major forex pairs.
Recommended Timeframes:
Intraday timeframes, such as 5 or 15 minutes, to capture significant post-open moves.
Parameter Customization:
The default parameters are optimized but can be adjusted based on individual preferences and the instrument analyzed.
Backtesting and Optimization:
Backtesting is recommended to evaluate performance and make adjustments if necessary.
Risk Management:
Ensure position sizing respects risk management rules, avoiding risking more than 1-2% of capital per trade.
Originality and Benefits of the Strategy:
Unique Combination of Indicators: Integrates various technical metrics to filter signals, reducing false positives.
Volatility Adaptability: The use of ATR for Stop Loss and Take Profit allows the strategy to adapt to real-time market conditions.
Focus on Post-Lateralization Breakout: Aims to capitalize on significant moves following consolidation periods, often associated with strong directional trends.
Important Notes:
Commissions and Slippage: Include commissions and slippage in settings for more realistic simulations.
Capital Size: Use a realistic trading capital for the average user.
Number of Trades: Ensure backtesting covers a sufficient number of trades to validate the strategy (ideally more than 100 trades).
Warning: Past results do not guarantee future performance. The strategy should be used as part of a comprehensive trading approach.
With this strategy, traders can identify and exploit specific market opportunities supported by a robust set of technical indicators and filters, potentially enhancing their trading decisions during key times of the day.

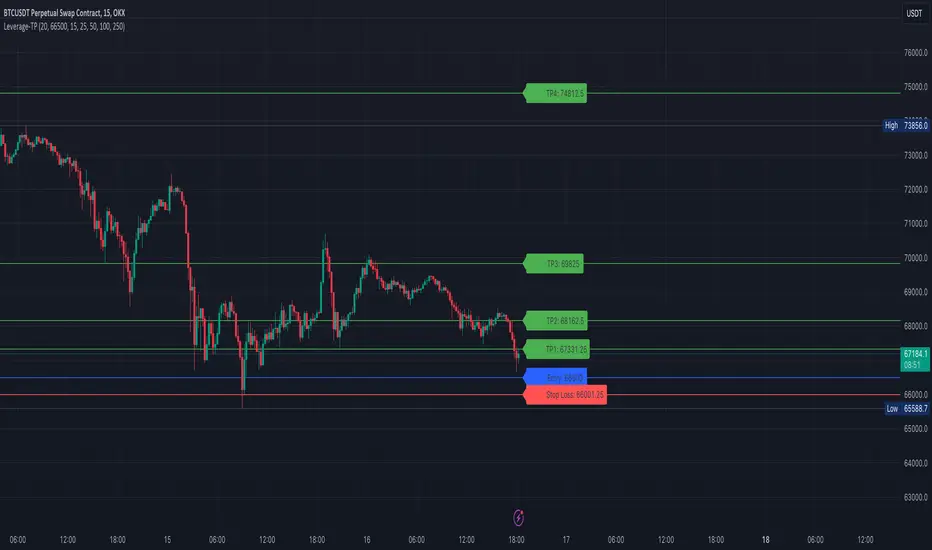
[S1B] Leverage Take-Profit-LinesShort Description:
The Leverage Take-Profit-Lines indicator assists traders in setting take-profit and stop-loss levels based on leverage, entry price, and risk percentage. It draws horizontal lines representing various take-profit levels and the stop-loss level on the chart, aiding traders in visually identifying potential exit points and managing risk.
Detailed Description:
The Leverage Take-Profit-Lines indicator is designed to provide traders with a visual representation of take-profit and stop-loss levels tailored to their leverage, entry price, and risk preferences.
Key Features:
Customizable Parameters: Traders can adjust parameters such as leverage, entry price, risk percentage, and whether to extend lines to suit their trading strategy.
Take-Profit Levels: The indicator calculates and draws horizontal lines representing different take-profit levels based on the specified percentage of leverage-adjusted entry price.
Stop-Loss Level: It calculates and displays the stop-loss level based on the specified risk percentage and leverage, helping traders manage risk effectively.
Visual Representation: The indicator visually highlights take-profit and stop-loss levels on the chart, facilitating quick decision-making for traders.
Usage Guide:
Setting Parameters: Adjust the input parameters including leverage, entry price, risk percentage, and other settings according to your trading strategy.
Interpreting Lines: Horizontal lines are drawn on the chart representing take-profit levels (TP1, TP2, TP3, TP4) and the stop-loss level. These lines indicate potential exit points and risk management levels.
As an example the TP1 can be used to sell 10% of position size, TP2 20%, TP3 20% and TP4 20-40%.
The Leverage Take-Profit-Lines indicator empowers traders with valuable insights into setting profit targets and managing risk effectively, contributing to more informed trading decisions.
ATR + Momentum Shifts w/Take ProfitThis script is a technical analysis indicator designed to assist in identifying potential entry points and setting take profit levels in trading. It combines the Average True Range (ATR) indicator, momentum shifts, and customizable take profit levels to provide insights into potential market movements.
Differences from Currently Published Ones:
This script is unique due to its use of a combination of elements:
ATR and Momentum: The script combines the ATR indicator to provide dynamic support and resistance levels with the momentum indicator to identify shifts in the underlying momentum.
Customizable Take Profit Levels: It offers the ability to set take profit levels based on customizable multipliers of the ATR, helping traders manage potential profits.
How to Use:
ATR Bands: The script plots upper and lower ATR bands as potential dynamic support and resistance levels.
Shift Arrows: Arrows are plotted below bars for potential long entry opportunities (green triangle) and above bars for potential short entry opportunities (yellow triangle).
Take Profit Levels: The script also plots take profit levels both above and below the source price based on the ATR multipliers set in the inputs.
Markets and Conditions:
This script can be used across various financial markets, including stocks, forex, commodities, and cryptocurrencies. It's most effective in trending markets where momentum shifts can signal potential reversals or continuation of trends. Traders should consider the following conditions:
Trend Confirmation: Look for momentum shifts in the direction of the prevailing trend for higher probability setups.
Volatility: Higher volatility can amplify ATR movements and subsequently affect the placement of ATR bands and take profit levels.
Risk Management: Always implement proper risk management strategies to protect your capital.
Additional Considerations:
Customization: Traders can adjust input parameters like ATR length, momentum length, and take profit multipliers to match their trading style and market conditions.
Combining with Other Indicators: Consider using this indicator in conjunction with other technical indicators or chart patterns for confirmation.
