Mastering ATR for Smart Stop Loss and Take Profit PlacementUsing the ATR indicator to set Stop Loss and Take Profit levels provides a dynamic and flexible way to manage risk based on the volatility of the market. This method ensures that your SL and TP are always in tune with current market conditions, preventing unnecessary stop-outs while maximizing the potential for profit. The table in the script makes it easy to view your calculated levels directly on the chart, improving your trading efficiency.
If you're looking for a more automated way to manage your trades, integrating ATR-based SL and TP can be a powerful tool in your strategy.
Happy Trading!
Cari dalam skrip untuk "TAKE"

ATR Band, Stop loss , Take Profit Lines, and Pip Distance# ATR Band, Take Profit Lines, and Pip Distance Indicator
This indicator helps traders identify potential stop loss and take profit levels using Average True Range (ATR) bands and custom multipliers. It provides a visual representation of these levels and calculates the pip distance to stop loss, aiding in risk management and trade planning.
## Key Features:
- ATR-based upper and lower bands for potential stop loss levels
- Two take profit levels above and below the ATR bands
- Customizable ATR period and multipliers for bands and take profit levels
- Pip distance calculation to stop loss levels
- Adjustable colors for all elements
## How to Use:
1. The ATR bands (blue and red lines) suggest potential stop loss levels.
2. Take profit levels are shown as green lines above and below the ATR bands.
3. Labels display the pip distance from the current or last close to the stop loss levels.
## Customization:
- Adjust the ATR period and multipliers to fit your trading style
- Customize colors for better visibility on your chart
- Choose between current candle or last close for pip distance calculation
Remember, this indicator is for informational purposes only. Always manage your risk carefully and consider using it in conjunction with other analysis tools and your trading strategy.
Good luck with your trading!

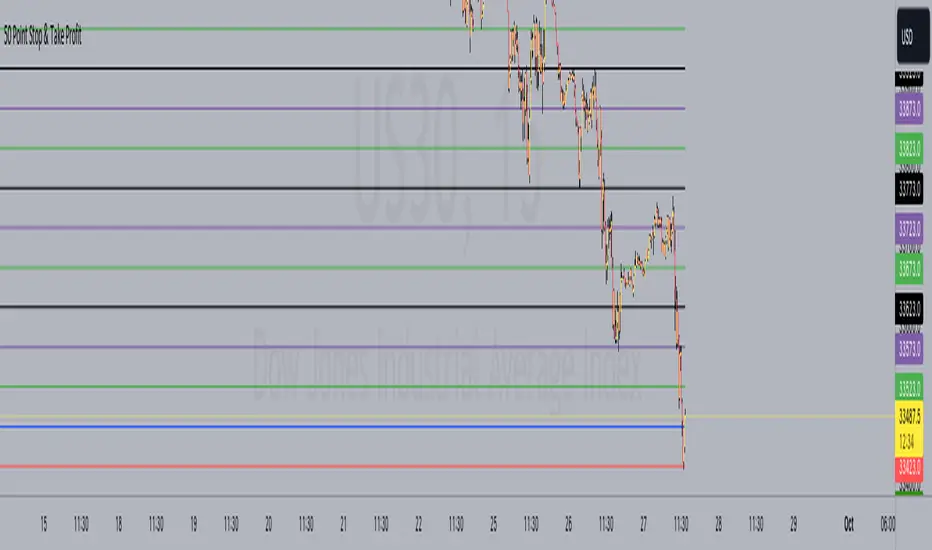
50 Point Stop & Take Profit**50 Point Stop & Take Profit**
This custom TradingView indicator is designed for instruments like US30 or any asset following a point system. It assists traders in setting precise stop-loss and take-profit levels based on different risk-reward ratios. It calculates and plots horizontal lines at various price levels above and below your specified entry price, with a 50-point difference between each ratio.
**How It Benefits Your Strategy:**
- Each risk-reward ratio, whether it's 1:1, 2:1, 3:1, and so on, is separated by precisely 50 points. This deliberate spacing is tailored to provide you with clear and consistent reference points for managing trades in instruments using a point-based system.
- The 50-point increments make it easy to adjust your positions, ensuring that your risk and reward levels align with your trading strategy and objectives.
**Usage:**
1. Set your desired entry price using the "Entry Price" input.
2. The indicator is ideally suited for instruments like US30, where each point represents a distinct price movement. It will automatically calculate and plot multiple lines at the following levels, both for Long (L) and Short (S) positions:
- 1:1 Risk-Reward Ratio (±50 points)
- 2:1 Risk-Reward Ratio (±100 points)
- 3:1 Risk-Reward Ratio (±150 points)
- 4:1 Risk-Reward Ratio (±200 points)
- 5:1 Risk-Reward Ratio (±250 points)
- 6:1 Risk-Reward Ratio (±300 points)
- 7:1 Risk-Reward Ratio (±350 points)
- 8:1 Risk-Reward Ratio (±400 points)
- 9:1 Risk-Reward Ratio (±450 points)
- 10:1 Risk-Reward Ratio (±500 points)
**Customization Options:**
- **Alerts:** You can set alerts for each level to receive notifications when the price reaches a specific risk-reward ratio.
- **Color Customization:** Customize the colors of the plotted lines to suit your chart preferences.
- **Toggle Ratios:** Easily toggle on/off different risk-reward ratios to focus on specific levels that align with your trading strategy.
**How to Use:**
- Use the plotted lines as reference points for setting stop-loss and take-profit orders at your preferred risk-reward ratios.
- The blue horizontal line represents your specified entry price.
This indicator simplifies your trading strategy by providing clear visual cues for managing risk and reward levels, with each level thoughtfully spaced 50 points apart to cater to your strategy's precision.
*Note: Always use risk management and proper trade sizing in your trading strategy.*
**Version:** Pine Script version 5
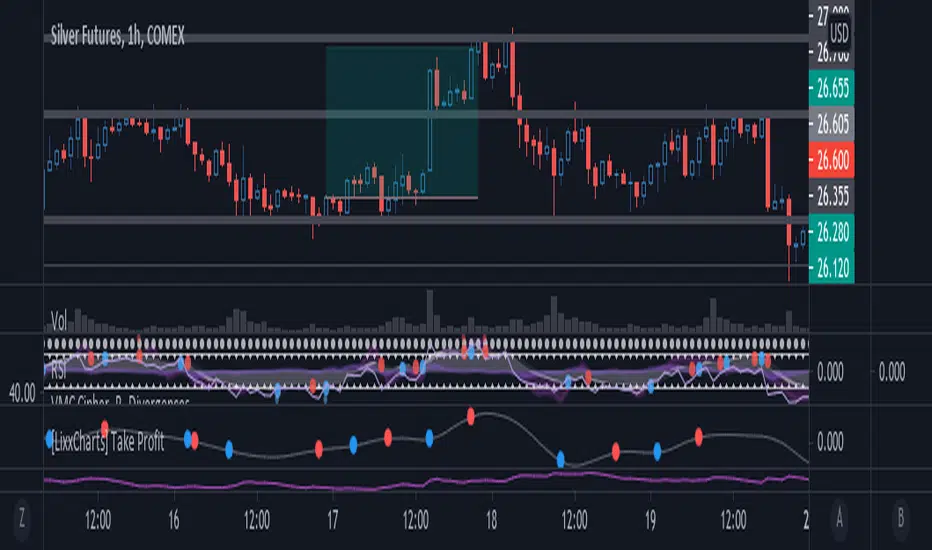
EMA + ATR Support and Resistance + Take Profit SignalThe 'EMA+ ATR Support Resistance Take Profit signal' indicator is a technical analysis tool designed to help traders identify potential support and resistance levels, using the Exponential Moving Average (EMA) and the Average True Range (ATR) indicators. This indicator not only tracks the EMA and ATR but also plots these levels as support and resistance lines, providing useful insights into potential buy and sell points.
The indicator allows you to set the lengths for both the EMA and ATR, with default values set to 20 and 14, respectively. Moreover, you can specify the multiplier for the ATR in the Support/Resistance (S/R) length setting, which defaults to 2. The line width for the plotted lines can also be adjusted according to your preference.
The EMA line in center is invisible by default but you can change that by going to the setting of the indicator. The support and resistance lines are plotted in green and red, respectively. When the price hits the support or resistance levels, the indicator provides a visual signal with a cross shape below or above the respective bars, in lime and red, respectively. If you do not need the take profit signals you can disable them in the setting.
How to Use:
1. Define the EMA and ATR lengths according to your trading strategy. Higher lengths will provide smoother lines but may also lag the current price action.
2. Set the S/R length to determine the distance of the support and resistance lines from the EMA line. Higher values will place these lines further away from the EMA.
3. Monitor the chart for instances when the price hits the support or resistance levels. This is indicated by a cross shape below (for support hit) or above (for resistance hit) the price bar. These points may be considered as potential take profit points or entry/exit points, depending on your strategy.
4. Use the indicator in conjunction with other tools and indicators to confirm signals and reduce the risk of false signals. So the assumption is you enter a trade using your other indicators but you can rely on this indicator to remind you to take profit if you are long by a red cross of the resistance line and if you are short reminds you by a green cross on the support line.
Disclaimer: This indicator should not be used as the sole determinant for any investment decision. Always conduct thorough research and consider multiple factors before trading.

Parabolic Scalp Take Profit[ChartPrime]Indicators can be a great way to signal when the optimal time is for taking profits. However, many indicators are lagging in nature and will get market participants out of their trades at less than optimal price points. This take profit indicator uses the concept of slope and exponential gain to calculate when the optimal time is to take profits on your trades, thus making this a leading indicator.
Usage:
In essence the indicator will draw a parabolic line that starts from the market participants entry point and exponentially grows the slope of the line eventually intersecting with the price action. When price intersects with the parabolic line a take profit signal will appear in the form of an x. We have found that this take profit indicator is especially useful for scalp trades on lower timeframes.
How To Use:
Add the indicator to the chart. Click on the candle which the trade is on. Click on either the price which the trade will be at, or at the bottom of the candle in a long, or the top of a candle in a short. Select long or short. Open the settings of the indicator and adjust the aggressiveness to the desired value.
Settings:
- Start Time -- This is the bar in which your entry will be at, or occured at and the script will ask you to click on the bar with your mouse upon first adding the script.
- Start Price -- This is the price in which the entry will be at, or was at and the script will ask you to click on the price with your mouse upon first adding the script.
- Long/Short -- This is a setting which lets the script know if it is a long or a short trade, and the script will ask you to confirm this upon first adding it to the chart.
- Aggressiveness -- This directly affects how aggressive the exponential curve is. A value of 101 is the lowest possible setting, indicating a very non-aggressive exponential buildup. A value of 200 is the highest and most aggressive setting, indicating a doubling effect per bar on the slope.

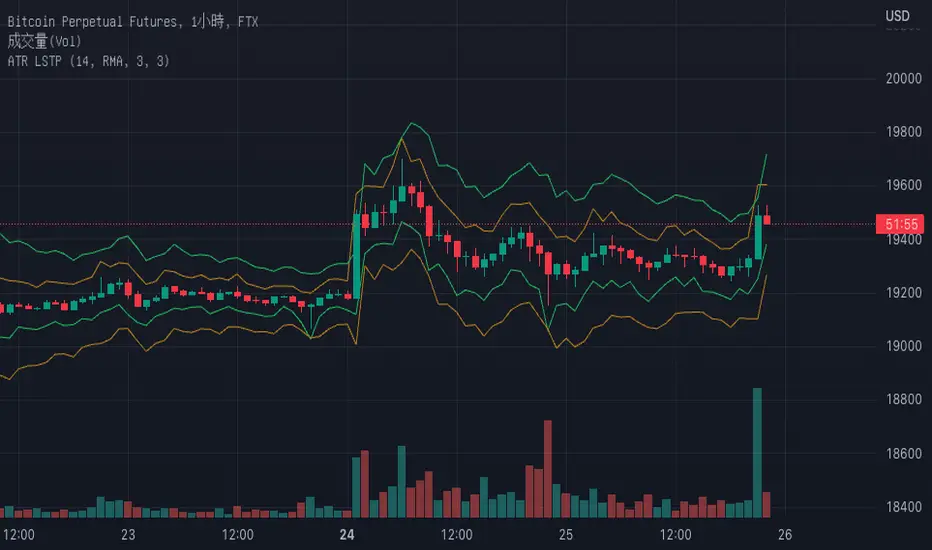
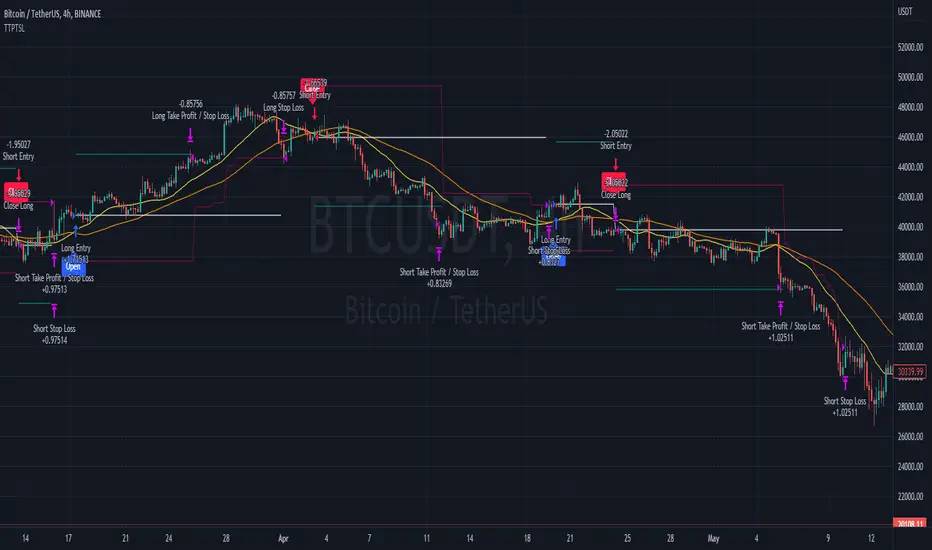
Average True Range with stop loss and take profit finderBased on the official original average true volatility (ATR), two functions have been extended.
Users can see the suggested stop loss and take profit parameters when entering a long or short order with each K-line.
Part of the settings:
Length: The preset is 14 K lines, which can help you grab the suggested stop loss point.
Long-short single profit-loss ratio: After entering the value of the profit-loss ratio (floating point) you want, it will automatically convert and calculate the past take-profit point.
The five values displayed on the chart are from left to right: ATR, Short Stop Loss, Long Stop Loss, Short Take Profit, and Long Take Profit.
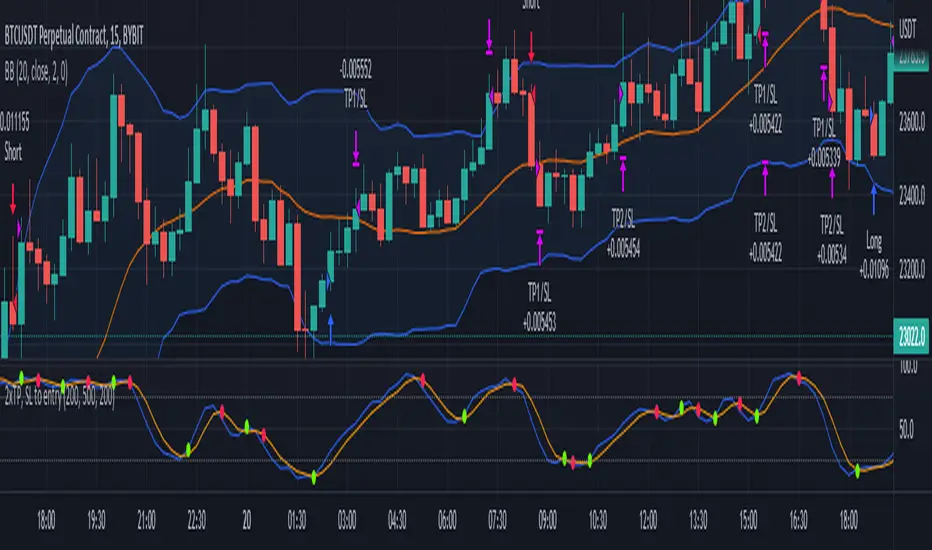
2x take profit, move stop loss to entryTwo take profit targets moving stop loss to entry after first take profit hit
This strategy shows a method to achieve the following trade management:
1) Open a position with two take profit targets
2) When first take profit is hit, move the stop loss to entry price
3) Position is closed when either second take profit is hit or position is stopped out at entry
Trading Conditions
The trading conditions used in this script are for illustrative purposes only and are not meant to be profitable.
Bollinger Bands
Used to show areas where price is moving outside of the normal range
Stochastic
Used to show overbought and oversold conditions.
Green dots are plotted when the K line crosses over its SMA. Red dots are plotted when the K line crosses under its SMA.
The option to use overbought/oversold thresholds is again illustrative.
Parabolic SAR Strategy With take profit and stop lossDo not make it too difficult!
This is my first strategy! I took the Parabolic SAR Strategy and added Stop Loss and Take profit, and I can see some fantastic results in 2h-3h-4h on some of the Crypto coins.
This is for training only, and I do not recommend using it as part of a trading bot, however, I do myself.

[Lixx] MESA(EMA/SMA) and ROC(ROC/MESA) Take Profit TriggersThis script uses the MESA EMA and SMA as well as the ROC/MESA cross to help find the take profit areas when trading divergences using market cipher or wavetrend. It is inspired by jordanfungs MESA indicator, however this one is different because it is not lagging in the signals.
Hope you enjoy it, and make sure to backtest any strategy before you use it.
Trailing Take Profit Trailing Stop LossThis script demonstrated a dual trailing take profit and stop loss strategy. Where you take 50% (configurable) of the profit when a price level is reached and then you get the rest when a trailing stop loss is hit.
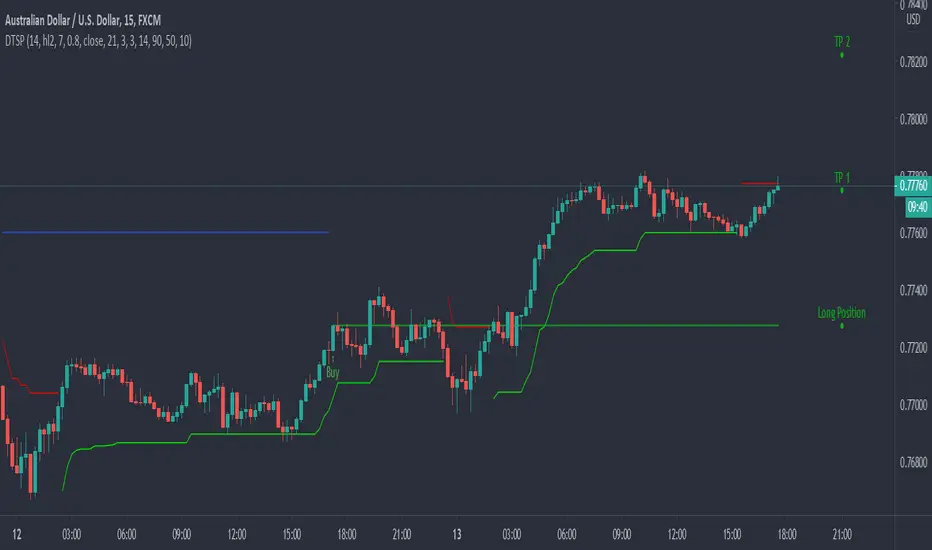
Dynamic Take Profit & Signals (AussieBogan)Dynamic Take Profit & Signals (DTS) help us to dynamically place potential take profit levels. These levels are measured based on standard deviation in conjunction with swing high and low points. Head over to the settings to control your take profit and multiplicative factor setting.
In short, higher values of either setting will return more spread out between tp's. The logic behind using the standard deviation is that a low value of it will return tp closer to where you entered the trade, as such it will have higher chances of the price reaching them.
The Indicator also has alert features for buy and sell so any trader can be aware of every potential signal the indicator produces.
Buy - Take Profit OR Stop Loss % BasedScript looks back for a certain period of time and than enter when price close above that look back period ema. Once enter it does not care for how many times price cross above or below. Once entered, it will either hit percenatage based take profit of stop loss.

Bitlinc MARSI Study AST w/ Take Profit & Stop loss - beta 0.1This script is beta 0.1 - will update as soon as the script is tradable
This script is based on AST on a 10 minute timeframe. You can change the asset and the timeframe for any asset you want to trade, but for it to work correct ALL settings have to be testes in the Strategy section of the TradingView. Each assets and timeframe require a different mixture of settings. This is NOT a one settings fits all trading for all assets on any timeframe. Below are the settings and explanation on how it works.
How it fires a buy / sell:
The script will plot an RSI with upper and lower bands in a separate indicator window. The idea behind this script is to fire a LONG when MA crosses OVER lower band and fire a SHORT when the MA crosses under the lower band. Each order that fires is an OCO (Order Cancels Order) for pyramiding.
Settings:
You have full control of these settings as mentioned above, you must configure every part of this script for each asset and timeframe you trade.
- Length of MA
- Length
- Upper bands of RSI
- Lower bands of RSI
- Take profit percentage
- Stop loss percentage
- Month to start and end the strategy (within 2020)
- Day to start and end the strategy (within 2020)
- Quantity type
- Slippage
- Pyramiding
***Remember that after the signal to enter or exit a trade is fired, the alert will trigger AFTER the close of the candle that caused the tigger to fire

BEST Trailing Take Profit StrategyHello traders
Hope you enjoyed your weekend on my behalf. Was staying home working ... ^^
This is my first strategy educational post I'm doing ever
While I'm generally against posting strategies because it's very easy to fake performance numbers... I cannot prevent myself from sharing a few cool strategy snippets anyway.
So from now on, I'll be sharing a few strategies also - generally not to showcase performance but only to show what pinescript can do.
As once again strategy performance can be faked is so many ways... :)
What's on the menu?
We all know what a trailing-stop is. right? right? Ok... sharing the definition here :)
A trailing stop is designed to protect gains by enabling a trade to remain open and continue to profit as long as the price is moving in the investor's favor. The order closes the trade if the price changes direction by a specified percentage or dollar amount.
But...do you know what a trailing profit is?
Short definition : Well the same but with your profit limit order.
Long definition : A trailing profit is designed to increase your gains by enabling a trade to remain open and continue to profit as long as the price is moving in the investor's favor. The order closes the trade if the price hits the trailing profit level specified percentage or dollar amount.
Some trading strategies used both a trailing stop AND trailing profit. Not making any recommendation here - only sharing what's possible in the realm of trading and pinescripting
Trigger me I'm famous
I developed many trading strategies in my career and often I've been asked to trigger a trailing-stop or trailing-profit once a certain % move has been made.
I integrated here a Take Profit trigger - once hit, it will activate the trailing profit
On the screenshot below, the TP trigger is plotted in orange. Once the price goes past that level for the first time, I'll start trailing the profit level.
In other words, when we see a price makes an interesting move in percentage value - we decide to offset the profit as we concluded that once it reached such distance - then it leads often to more profit
Of course, using only a trailing profit without stop/trailing-stop/invalidation isn't smart and the surest way to kiss goodbye a trading capital and trading and your good mood
See you tomorrow for another strategy snippet
All the BEST
Dave

DEMARSIV1 alerts and take profitThis version is the same as DEMARSI with following differences
I add take profit to short and long when DEMA MTF 1 is crossing DEMA MTF 2 (they are calculated different that why when you increase int2 in min to longer time the difference between them increse)
if you want the TP to be on signal of fast and slow DEMA RSI 2 (just change the code inside) by putting the long cond to be as the buy cond
for any questions please ask

poki buy and sell Take profit and stop lossThis indicator is based on modelius model of lazy bear weis model with ATR for the buy=B sell =S
in addition there is Take profit and stop loss in % both for short and for long
next stage is to know the resistance level and support based on bollinger marked in blue and red dots
Also included Parabolic Sar (blue and red dots rising up or down)
The color of bulish or bearish zone is based on the cross of Hull avreage and linear regression ( for each time set may need different setting for accuracy )
So how to use this scrupt to better profit
1. if you have B signal and its on lower support level then its good starting place for buy. look at the Parabolic Sar if its in agreement. The exit can be either by S =sell, Take profit that you decide on % or by end of Parabolic SAR upward
2. exact the oposite for short
Play with setting for the desired results or change modify this script for your purpose

Hull modelius take profit and stop lossThis model has Hull moving average, fibs in form of Bollinger ,SMA and Modelius model with ATR for buy and sell power based on weis volume. Inside alerts for buy and sell. take profit and stop loss for both longs and shorts
so have fun
RSI with small Take Profit - Long-onlyThis script open a long position when RSI < 30 and close the position after a small take profit. No stop loss but if you analyse List of Trades then you'll see that several position are closed for unknow reason.

TK47 36 ChambersTK47 36 Chambers is a precision-crafted EMA (Exponential Moving Average) tool designed to help traders align with multi-timeframe trends while keeping price action clear and uncluttered. Built around the powerful 36 EMA, this script plots the current timeframe’s high, low, and median EMAs as a visual "chamber" or cloud, giving instant feedback on intrabar dynamics.
Shoutout to Insilico, who introduced the 36 EMA as a core trend-following tool — this indicator wouldn’t exist without that spark.
How It Works
Core EMA:
The central element is the 36-period EMA, applied to close, high, and low prices on your current chart.
These three EMAs form a channel or “chamber” that acts as a dynamic zone of control.
The cloud between the high and low EMA can optionally be filled to help visualize volatility.
Higher Timeframe EMAs (HTF EMAs):
Optionally displays Daily, Weekly, 4H, and 1H EMAs (all using the same configurable EMA length, default: 36).
These are interpolated smoothly between HTF candles, creating elegant transitions and avoiding jumpy plotting.
Helps traders spot broader trend bias directly on lower timeframe charts without switching views.
Customizations
Adjustable colors for each EMA layer (current + HTFs).
Toggle cloud fill on/off.
Toggle visibility of each HTF line.
Option to show labels at the edge of the chart (e.g., “W” for Weekly) for clarity.
Use Cases
Confirming trend direction across multiple timeframes.
Identifying pullback entries or mean reversion zones.
Combining with candlestick patterns, liquidity sweeps, or oscillator divergence for high-probability entries.
Notes
All EMAs use the same configurable length to keep things clean and consistent.
Interpolation ensures the HTF EMAs remain smooth and aligned with the LTF candles.
The fill between high and low EMA gives a visual representation of the market’s breathing room — useful for spotting expansions and contractions.

Mining Cash Flow LineTakes QUANDL Bitcoin blockchain difficulty data, three variables (hashrate in THs/sec, power consumption in kWh, and electricity costs in cents/kWh) and calculates the base line for cash flow in US dollars. The default is an AntMiner S15 at 10 cents/kWh.
When price is above this line, miners with the given conditions have positive cash flow (i.e. they make more money mining than their running costs), and when below the line, they would be better off turning their rigs off (if this simple model can be applied to their particular circumstance).
Assumptions:
1. All costs are consolidated into one "electricity cost" variable, including things like rent and wages for mining farms.
2. 12.5 BTC/block emission schedule (update source code upon next halving).
Warnings:
It is likely that actual costs to miners varies in complex ways. This indicator only shows a cash flow calculation for a very simple set of parameters that will generally apply to miners, but not necessarily all of them. (For example, a miner may be locked into a prepaid contract for cheap electricity, or sell exhaust heat in the winter for extra revenue.)
Positive cash flow is also different from ROI, as this model does not take into account the cost of acquiring an ASIC mining rig.

HPAS mean reversion strategy testerTakes Krown HPAS values hardcoded and simulates longs and short with configurable standard deviation multiplier TP/SL. Best used on lower timeframes

Yield Curve Regime Shading with LegendTakes two symbols (e.g. two futures contracts, two FX pairs, etc.) as inputs.
Calculates the “regime” as the sign of the change in their difference over an n‑period lookback.
Lets you choose whether you want to color the bars themselves or shade the background.
How it works
Inputs
symbolA, symbolB: the two tickers you’re comparing.
n: lookback in bars to measure the change in the spread.
mode: pick between “Shading” or “Candle Color”.
Data fetching
We use request.security() to pull each series at the chart’s timeframe.
Regime calculation
spread = priceA – priceB
spreadPrev = ta.valuewhen(not na(spread), spread , 0) (i.e. the spread n bars ago)
If spread > spreadPrev → bullish regime
If spread < spreadPrev → bearish regime
Plotting
Shading: apply bgcolor() in green/red.
Candle Color: use barcolor() to override the bar color.
