Cognitive Echo IndexCognitive Echo Index – User Guide
Overview
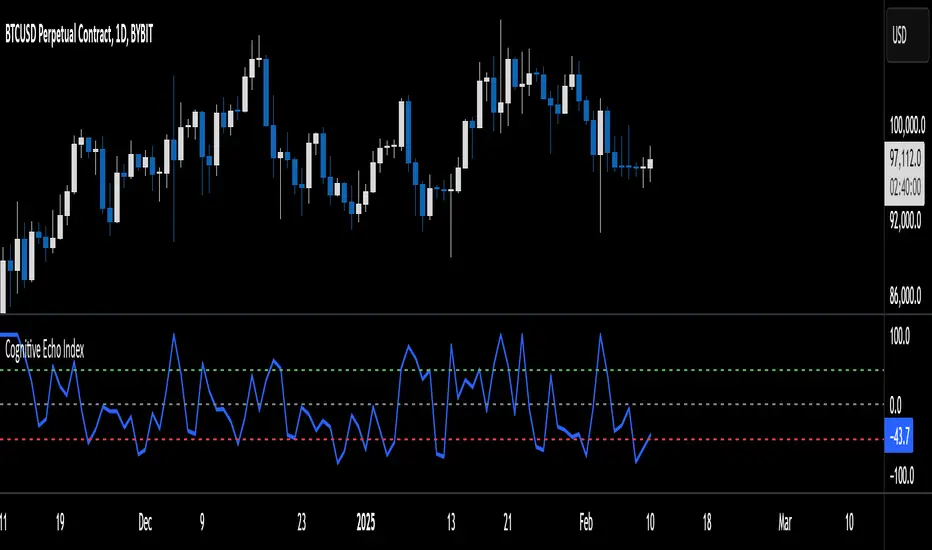
The Cognitive Echo Index is a composite indicator that combines several technical aspects—including price deviation from a moving average, normalized volatility (via ATR), and volume variations—to create a single numeric value. The output is scaled between -100 and +100, offering insights into market momentum and potential trend reversals.
How It Works
Price Component:
The indicator calculates the percentage change between the current price and its 14-period simple moving average (SMA). This helps identify how far the price deviates from its recent trend.
Volatility Component:
Using the Average True Range (ATR) over a 14-period, the script normalizes current ATR against its 14-period SMA. This shows relative volatility, highlighting unusual market activity.
Volume Component:
It computes the percentage change between the current volume and its 14-period SMA to detect spikes or drops in trading activity.
Composite Calculation:
The three components are summed together to produce the final index value, which is then clipped to remain between -100 and +100.
Interpreting the Indicator
Indicator Value Scale:
Positive Values (0 to +100):
Suggest that bullish forces are stronger. Higher values (e.g., above +50) could indicate a strong bullish sentiment.
Negative Values (0 to -100):
Indicate bearish pressures. Lower values (e.g., below -50) may signal strong bearish conditions.
Zero Level:
The midline indicates a balanced market condition with no dominant trend.
Key Horizontal Levels:
+50 Level:
When the indicator crosses above +50, it can be interpreted as a strong bullish signal.
-50 Level:
When the indicator crosses below -50, it can be considered a strong bearish signal.
Usage Tips
Confirmation Tool:
Use the Cognitive Echo Index as an additional confirmation tool in conjunction with other technical indicators or chart patterns to make more informed trading decisions.
Parameter Adjustments:
The script uses a 14-period setting for the moving average, ATR, and volume SMA by default. Depending on your trading timeframe or asset, consider tweaking these periods for better sensitivity.
Trend Analysis:
Watch how the indicator behaves during major price moves. A divergence between the index and the price trend (e.g., price rises while the index falls) may suggest a potential reversal or a false breakout.
Risk Management:
Always incorporate sound risk management practices. Use stop losses and position sizing rules, and consider the indicator as one part of your overall trading strategy.
Customization
Adjusting the Weights:
Although the current version gives equal weight to all three components, advanced users can modify the script to apply different weights to the price, volatility, and volume components based on historical performance or specific market conditions.
Adding Additional Inputs:
Future versions could incorporate external sentiment data or other technical factors if accessible. For now, the indicator focuses on technical inputs available directly within TradingView.
By following this guide, traders can integrate the Cognitive Echo Index into their TradingView platform to gain a unique perspective on market momentum and potential turning points. Enjoy testing and refining the indicator to better suit your trading style!
Cari dalam skrip untuk "TradingView+手机版"
Moving Average Crossover StrategyCertainly! Below is an example of a professional trading strategy implemented in Pine Script for TradingView. This strategy is a simple moving average crossover strategy, which is a common approach used by many traders. It uses two moving averages (a short-term and a long-term) to generate buy and sell signals.
Input Parameters:
shortLength: The length of the short-term moving average.
longLength: The length of the long-term moving average.
Moving Averages:
shortMA: The short-term simple moving average (SMA).
longMA: The long-term simple moving average (SMA).
Conditions:
longCondition: A buy signal is generated when the short-term MA crosses above the long-term MA.
shortCondition: A sell signal is generated when the short-term MA crosses below the long-term MA.
Trade Execution:
The strategy enters a long position when the longCondition is met.
The strategy enters a short position when the shortCondition is met.
Plotting:
The moving averages are plotted on the chart.
Buy and sell signals are plotted as labels on the chart.
How to Use:
Copy the script into TradingView's Pine Script editor.
Adjust the shortLength and longLength parameters to fit your trading style.
Add the script to your chart and apply it to your desired timeframe.
Backtest the strategy to see how it performs on historical data.
This is a basic example, and professional traders often enhance such strategies with additional filters, risk management rules, and other indicators to improve performance.

Currency ComparatorIndicator Description
This script helps you compare the price changes of various cryptocurrencies against each other.
While TradingView provides some pairs like ETH/BTC or BNB/BTC, it lacks support for comparing lower-market-cap coins against BTC or other currencies. That’s where this script comes in, allowing you to easily view ratios like DOGS/BTC, LSD/BTC, and more.
You can also analyze the relationship between two high-market-cap assets, such as ETH/SOL, which is often not available directly on TradingView.
Additionally, this indicator enables you to view the changes of two cryptocurrencies alongside a base currency. For example, you can observe how Bitcoin's rise impacts LSD and whether it strengthens or weakens relative to BTC.
Features
Maximized View: You can open the indicator in a maximized chart view and use it like any other chart for your technical analysis.
Customizable Comparisons: Compare any two assets with ease by configuring the indicator inputs.
Important Notes
1.Preserving Drawings:
Drawings and tools applied to the indicator chart are not tied to the indicator’s settings. This means changing the inputs won’t affect them. To avoid losing your work:
Open the chart of the base asset (e.g., LSD/USDT) where you want to analyze a specific pair (e.g., LSD/BTC).
Use the indicator there. This way, whenever you want to revisit your analysis, you only need to open the base chart (e.g., LSD/USDT) and update the indicator inputs to the desired pair (e.g., LSD/BTC).
2.Deleting the Indicator:
Removing the indicator from the chart will also delete all your drawings. If you need to keep them, do not delete the indicator.
3.Precision Settings:
By default, the indicator displays up to 12 decimal places (precision). For pairs where such precision isn’t required, you can adjust it in the settings under the "Style" section to your preferred value. If you need higher precision again, simply reset it to the default value.

Kamal 5 Tick Trading SetupKamal 5 Tick Trading Setup
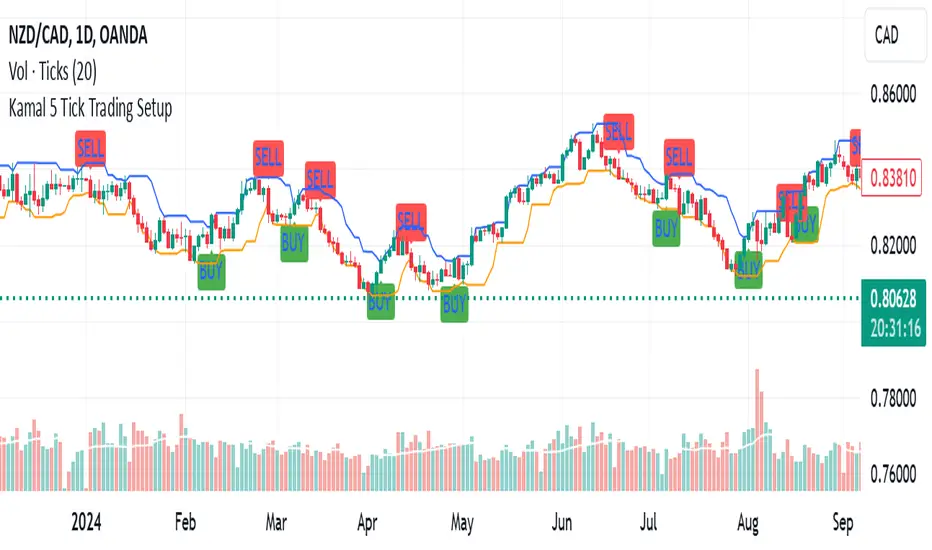
The "Kamal 5 Tick Trading Setup" is a custom indicator designed by Kamal Preet Singh Trader for TradingView to identify potential Buy and Sell signals on daily forex charts. This indicator helps traders make informed decisions based on the price action of the previous five daily candles.
Indicator Logic:
Buy Signal: A Buy signal is generated when the closing price of the current candle exceeds the highest high of the previous five daily candles.
Sell Signal: A Sell signal is generated when the closing price of the current candle falls below the lowest low of the previous five daily candles.
Features:
Lookback Period: The indicator uses a lookback period of five candles to determine the highest high and lowest low.
Visual Signals: Buy signals are plotted as green "BUY" labels below the candles, while Sell signals are plotted as red "SELL" labels above the candles.
Debugging Plots: The highest high and lowest low of the previous five candles are plotted as blue and orange lines, respectively, to help verify the conditions for Buy and Sell signals.
Non-Repetitive Signals: The indicator ensures that once a Buy signal is given, no further Buy signals are generated until a Sell signal is given, and vice versa.
Usage:
Apply the indicator to your daily forex chart in TradingView.
Observe the plotted Buy and Sell signals to identify potential entry and exit points.
Use the debugging plots to ensure the conditions for the signals are being met correctly.
This indicator provides a straightforward approach to trading based on recent price action, helping traders capitalize on potential breakout and breakdown opportunities.
SufinBDThis TradingView script combines RSI, Stochastic RSI, MACD, and Bollinger Bands to generate Buy and Sell signals on two different timeframes: 4-hour (4H) and Daily (1D). The strategy aims to provide entry and exit points based on a multi-indicator confirmation approach, helping traders make more informed decisions.
Features:
RSI (Relative Strength Index):
Measures the speed and change of price movements.
The script looks for oversold conditions (RSI below 30) for buy signals and overbought conditions (RSI above 70) for sell signals.
Stochastic RSI:
Measures the level of RSI relative to its high-low range over a given period.
A Stochastic RSI below 0.2 indicates oversold conditions, and a value above 0.8 indicates overbought conditions.
It helps identify overbought and oversold conditions in a more precise manner than regular RSI.
MACD (Moving Average Convergence Divergence):
A trend-following momentum indicator that shows the relationship between two moving averages of a security's price.
The MACD line crossing above the Signal line generates bullish signals, and vice versa for bearish signals.
Bollinger Bands:
A volatility indicator that consists of a middle band (SMA of price), an upper band, and a lower band.
When the price is below the lower band, it signals potential buy opportunities, while prices above the upper band signal potential sell opportunities.
Timeframe Usage:
The script calculates indicators for both the 4-hour (4H) and Daily (1D) timeframes.
The combined signals from these two timeframes are used to generate Buy and Sell alerts.
Buy Signal:
A Buy signal is generated when all of the following conditions are met:
RSI on both 4H and 1D is below 30 (oversold conditions).
Stochastic RSI on both timeframes is below 0.2.
The MACD line is above the Signal line on both timeframes.
The price is below the lower Bollinger Band on both the 4H and 1D charts.
Sell Signal:
A Sell signal is generated when all of the following conditions are met:
RSI on both 4H and 1D is above 70 (overbought conditions).
Stochastic RSI on both timeframes is above 0.8.
The MACD line is below the Signal line on both timeframes.
The price is above the upper Bollinger Band on both the 4H and 1D charts.
Visuals:
Buy signals are marked with green labels below the bars.
Sell signals are marked with red labels above the bars.
Bollinger Bands are displayed on the chart with the upper and lower bands marked in blue (for 4H) and orange (for 1D).
Purpose:
This script aims to provide more reliable buy/sell signals by combining indicators across multiple timeframes. It is ideal for traders who want to use multiple confirmation points before entering or exiting a trade.
How to Use:
Apply the script to any chart on TradingView.
Look for Buy and Sell signals that meet the conditions above.
You can adjust the timeframe (e.g., 4H or 1D) based on your trading strategy.
This script can be used for intraday trading, swing trading, or position trading depending on your preferred timeframes.
Example of Signal Interpretation:
Buy Signal:
If all conditions are met (e.g., RSI is under 30, Stochastic RSI is under 0.2, MACD is bullish, and price is below the lower Bollinger Band on both the 4-hour and daily charts), the script will show a green "BUY" label below the price bar.
Sell Signal:
If all conditions are met (e.g., RSI is over 70, Stochastic RSI is over 0.8, MACD is bearish, and price is above the upper Bollinger Band on both timeframes), the script will show a red "SELL" label above the price bar.
This combination of indicators offers a multi-layered confirmation approach, which aims to reduce the risk of false signals and increase the reliability of your trading decisions.

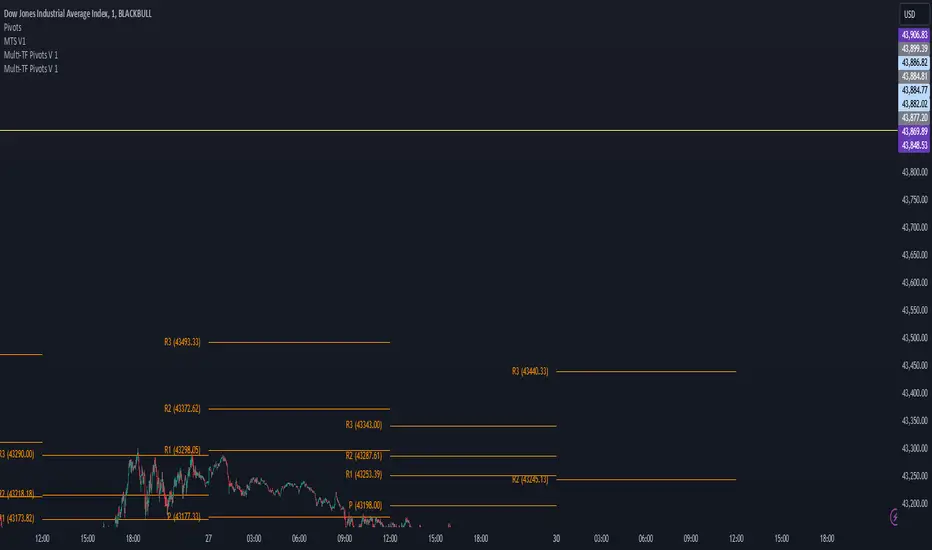
Multi-TF Pivots V1The Multi-TF Pivots Indicator is a powerful and customizable pivot point tool for TradingView. This script allows traders to calculate and display pivot points on a wide range of timeframes, from 1-minute to weekly intervals. It supports both Classic and Fibonacci pivot styles and includes options to customize line colors, label positions, and price visibility. The indicator is ideal for traders who rely on pivot points for intraday and swing trading strategies, offering a clear visual representation of key support and resistance levels. With its flexibility and comprehensive features, this indicator is an essential tool for precise technical analysis.
اندیکاتور Multi-TF Pivots یک ابزار قدرتمند و قابل تنظیم برای محاسبه و نمایش پیوت پوینتها در پلتفرم TradingView است. این اسکریپت به معاملهگران امکان میدهد پیوت پوینتها را در طیف گستردهای از تایمفریمها، از ۱ دقیقه تا هفتگی، محاسبه و نمایش دهند. این اندیکاتور از سبکهای پیوت Classic و Fibonacci پشتیبانی میکند و گزینههایی برای شخصیسازی رنگ خطوط، موقعیت برچسبها و نمایش قیمتها دارد. این ابزار برای معاملهگرانی که به پیوت پوینتها برای استراتژیهای معاملاتی روزانه و نوسانی متکی هستند ایدهآل است و نمایش بصری واضحی از سطوح کلیدی حمایت و مقاومت ارائه میدهد. با انعطافپذیری و ویژگیهای جامع خود، این اندیکاتور یک ابزار ضروری برای تحلیل تکنیکال دقیق است
ForecastPro by BinhMyco1. Overview:
This Pine Script implements a custom forecasting tool on TradingView, labeled "BinhMyco." It provides a method to predict future price movements based on historical data and a comparison with similar historical patterns. The script supports two types of forecasts: **Prediction** and **Replication**, where the forecasted price can be either based on price peaks/troughs or an average direction. The script also calculates a confidence probability, showing how closely the forecasted data aligns with historical trends.
2. Inputs:
- Source (`src`): The input data source for forecasting, which defaults to `open`.
- Length (`len`): The length of the training data used for analysis (fixed at 200).
- Reference Length (`leng`): A fixed reference length for comparing similar historical patterns (set to 70).
- Forecast Length (`length`): The length of the forecast period (fixed at 60).
- Multiplier (`mult`): A constant multiplier for the forecast confidence cone (set to 4.0).
- Forecast Type (`typ`): Type of forecast, either **Prediction** or **Replication**.
- Direction Type (`dirtyp`): Defines how the forecast is calculated — either based on price **peaks/troughs** or an **average direction**.
- Forecast Divergence Cone (`divcone`): A boolean option to enable the display of a confidence cone around the forecast.
3. Color Constants:
- Green (`#00ffbb`): Color used for upward price movements.
- Red (`#ff0000`): Color used for downward price movements.
- Reference Data Color (`refcol`): Blue color for the reference data.
- Similar Data Color (`simcol`): Orange color for the most similar data.
- Forecast Data Color (`forcol`): Yellow color for forecasted data.
4. Error Checking:
- The script checks if the reference length is greater than half the training data length, and if the forecast length exceeds the reference length, raising errors if either condition is true.
5. Arrays for Calculation:
- Correlation Array (`c`): Holds the correlation values between the data source (`src`) and historical data points.
- Index Array (`index`): Stores the indices of the historical data for comparison.
6. Forecasting Logic:
- Correlation Calculation: The script calculates the correlation between the historical data (`src`) and the reference data over the given reference length. It then identifies the point in history most similar to the current data.
- Forecast Price Calculation: Based on the type of forecast (Prediction or Replication), the script calculates future prices either by predicting based on similar bars or by replicating past data. The forecasted prices are stored in the `forecastPrices` array.
- Forecast Line Drawing: The script draws lines to represent the forecasted price movements. These lines are color-coded based on whether the forecasted price is higher or lower than the current price.
7. Divergence Cone (Optional):
- If the **divcone** option is enabled, the script calculates and draws a confidence cone around the forecasted prices. The upper and lower bounds of the cone are calculated using a standard deviation factor, providing a visual representation of forecast uncertainty.
8. Probability Table:
- A table is displayed on the chart, showing the probability of the forecast being accurate. This probability is calculated using the correlation between the current data and the most similar historical pattern. If the probability is positive, the table background turns green; if negative, it turns red. The probability is presented as a percentage.
9. Key Functions:
- `highest_range` and `lowest_range`: Functions to find the highest and lowest price within a range of bars.
- `ftype`: Determines the forecast type (Prediction or Replication) and adjusts the forecasting logic accordingly.
- `ftypediff`: Computes the difference between the forecasted and actual prices based on the selected forecast type.
- `ftypelim`, `ftypeleft`, `ftyperight`: Additional functions to adjust the calculation of the forecast based on the forecast type.
10. Conclusion:
The "ForecastPro" script is a unique tool for forecasting future price movements on TradingView. It compares historical price data with similar historical trends to generate predictions. The script also offers a customizable confidence cone and displays the probability of the forecast's accuracy. This tool provides traders with valuable insights into future price action, potentially enhancing decision-making in trading strategies.
---
This script provides advanced functionality for traders who wish to explore price forecasting, and can be customized to fit various trading styles.

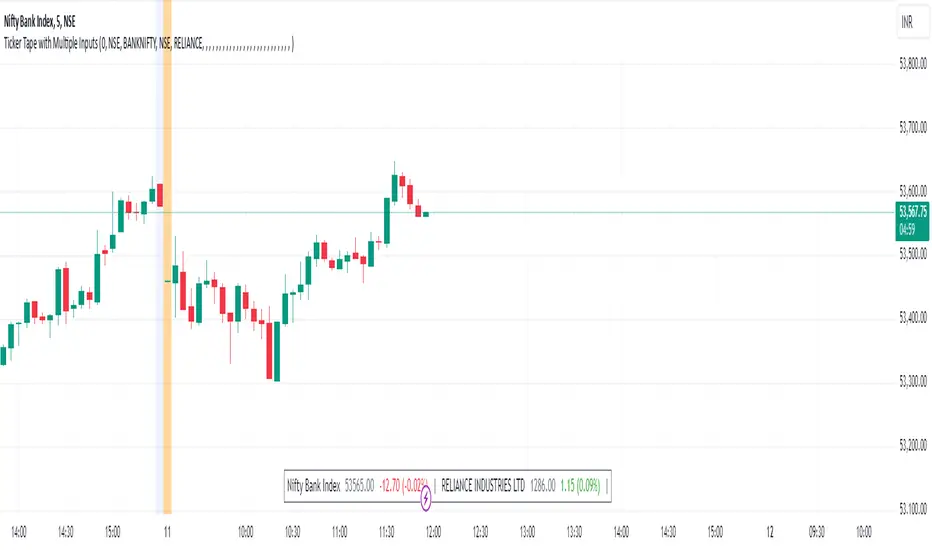
Ticker Tape with Multiple Inputs# Ticker Tape
A customizable multi-symbol price tracker that displays real-time price information in a scrolling ticker format, similar to financial news tickers.
This indicator is inspired from Tradingciew's default tickertape indicator with changes in the way inputs are given.
### Overview
This indicator allows you to monitor up to 15 different symbols simultaneously across any supported exchanges on TradingView. It displays essential price information including current price, price change, and percentage change in an easy-to-read format at the bottom of your chart.
### Features
• Monitor up to 15 different symbols simultaneously
• Support for any exchange available on TradingView
• Real-time price updates
• Color-coded price changes (green for increase, red for decrease)
• Smooth scrolling animation (can be disabled)
• Customizable scroll speed and position offset
### Input Parameters
#### Ticker Tape Controls
• Running: Enable/disable the scrolling animation
• Offset: Adjust the starting position of the ticker tape
#### Symbol Settings
• Exchange (1-15): Enter the exchange name (e.g., NSE, BINANCE, NYSE)
• Symbol (1-15): Enter the symbol name (e.g., BANKNIFTY, RELIANCE, BTCUSDT)
### Display Format
For each symbol, the ticker shows:
1. Symbol Name
2. Current Price
3. Price Change (Absolute and Percentage)
### Example Usage
Input Settings:
Exchange 1: NSE
Symbol 1: BANKNIFTY
Exchange 2: NSE
Symbol 2: RELIANCE
The ticker tape will display:
`NIFTY BANK 46750.00 +350.45 (0.75%) | RELIANCE 2456.85 -12.40 (-0.50%) |`
### Use Cases
1. Multi-Market Monitoring: Track different markets simultaneously without switching between charts
2. Portfolio Tracking: Monitor all your positions in real-time
### Tips for Best Use
1. Group related symbols together for easier monitoring
2. Use the offset parameter to position important symbols in your preferred viewing area
3. Disable scrolling if you prefer a static display
4. Leave exchange field empty for default exchange symbols
### Notes
• Price updates occur in real-time during market hours
• Color coding helps quickly identify price direction
• The indicator adapts to any chart timeframe
• Empty input pairs are automatically skipped
### Performance Considerations
The indicator is optimized for efficiency, but monitoring too many high-frequency symbols might impact chart performance. It's recommended to use only the symbols you actively need to monitor.
Version: 2.0 Stock_Cloud
Last Updated: December 2024
Confluence ChecklistHOW DOES IT WORK?
The "Confluence Checklist" indicator helps you to stick to your trading plan with your set rules. You have a total of 8 rules that can be set up manually. Using the checkbox, you can check during trading whether your rules are followed or not. You can change the colors of the table on the one hand, and the size and width of the table columns on the other.
█ WHAT MAKES IT UNIQUE?
It is the only checklist indicator on Tradingview that has an integrated checkbox. Thus, you can always check your trading plan.
█ HOW TO USE IT?
The best way to start is to create your personal trading plan based on your trading strategy. Then you can display the trading plan digitally in Tradingview. This way you don't have to write and check your rules on paper anymore. This is very important for scalping, because sometimes you only have a few seconds left for the execution. After creating the trading plan, you can integrate it into the checklist. Before placing an order, you can check the checklist to see if the trade is really valid.
Daily Moving Averages on Intraday ChartsThis moving average script displays the chosen 5 daily moving averages on intraday (minute) charts. It automatically adjusts the intervals to show the proper moving averages.
In a day there are 375 trading minutes from 9:15 AM to 3:30PM in Indian market. In 5 days there are 1875 minutes. For other markets adjust this data accordingly.
If 5DMA is chosen on a five minute chart the moving average will use 375 interval values (1875/5 = 375) of 5minute chart to calculate moving average. Same 5DMA on 25minute chart will use 75 interval values (1875/25 = 75).
On a 1minute chart the 5DMA plot will use 1875 interval values to arrive at the moving average.
Since tradingview only allows 5000 intervals to lookback, if a particular daily moving average on intraday chart needs more than 5000 candle data it won't be shown. E.g 200DMA on 5minute chart needs 15000 candles data to plot a correct 200DMA line. Anything less than that would give incorrect moving average and hence it won't be shown on the chart.
MA crossover for the first two MAs is provided. If you want to use that option, make sure you give the moving averages in the correct order.
You can enhance this script and use it in any way you please as long as you make it opensource on TradingView. Feedback and improvement suggestions are welcome.
Special thanks to @JohnMuchow for his moving averages script for all timeframes.

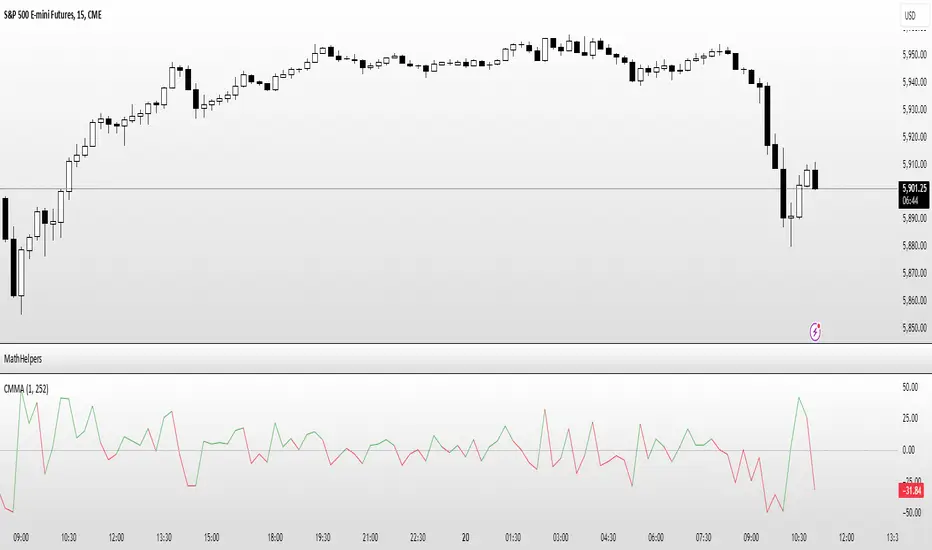
Close Minus Moving Average█ OVERVIEW
The Close Minus Moving Average (CMMA) is a statistically robust mean reversion indicator designed to identify potential reversal points in the market. By analyzing the relationship between the closing price and its moving average, CMMA provides traders with actionable insights to enhance their trading strategies.
Important
This indicator requires the use of the MathHelpers library published by HuntGatherTrade
█ CONCEPTS
The CMMA indicator operates by calculating the logarithmic difference between the current closing price and its simple moving average (SMA). This difference is then normalized using the Average True Range (ATR) to account for market volatility. The resulting value is transformed using the Cumulative Distribution Function (CDF) to produce a standardized metric that oscillates around zero.
Key Steps :
Logarithmic Calculation: Computes the natural logarithm of the closing prices.
Moving Average: Applies a simple moving average to the logarithmic closing prices.
ATR Normalization: Utilizes ATR to normalize the difference, ensuring the indicator adapts to varying market conditions.
CDF Transformation: Transforms the normalized difference to a scale that highlights mean reversion tendencies.
Mean Reversion
Mean reversion is a financial theory suggesting that asset prices and historical returns eventually return to the long-term mean or average level of the entire dataset. The CMMA leverages this concept to signal potential entry and exit points based on deviations from the moving average.
█ FEATURES
Adaptive Normalization: Utilizes ATR to adjust for market volatility, ensuring consistent performance across different market conditions.
Statistical Robustness: Built upon methodologies from Timothy Masters, ensuring reliable mean reversion signals.
Clear Visuals: Differentiates positive and negative deviations with distinct color coding for easy interpretation.
Customizable Parameters: Allows users to adjust lookback periods and ATR lengths to tailor the indicator to their specific trading needs
.
█ HOW TO USE
Add the Indicator :
Navigate to the Pine Script editor on TradingView.
Paste the CMMA script and add it to your chart.
Adjust Parameters :
Lookback Period: Determines the number of periods for calculating the moving average of the logarithmic close. Default is 1.
ATR Length: Sets the number of periods for ATR calculation. Default is 252.
Interpret Signals :
Green Plot: Indicates that the closing price is above the moving average, suggesting bullish momentum.
Red Plot: Indicates that the closing price is below the moving average, suggesting bearish momentum.
Zero Line: Serves as a reference point for mean reversion signals.
Trading Strategy :
Buy Signal: When CMMA crosses above the zero line, indicating a potential upward reversal.
Sell Signal: When CMMA crosses below the zero line, indicating a potential downward reversal.
█ LIMITATIONS
Lagging Indicator: As with all moving averages, CMMA is based on historical data and may lag during rapid market movements.
Parameter Sensitivity: The effectiveness of CMMA can vary based on the chosen lookback and ATR periods. Users should optimize these parameters based on the specific asset and timeframe.
Market Conditions: Best suited for mean-reverting markets and may underperform in trending or highly volatile environments.
█ NOTES
Version Compatibility: The CMMA script is written in Pine Script™ version 6. Ensure your TradingView environment supports this version.
License: This Pine Script™ code is subject to the terms of the Mozilla Public License 2.0. Read the license here.
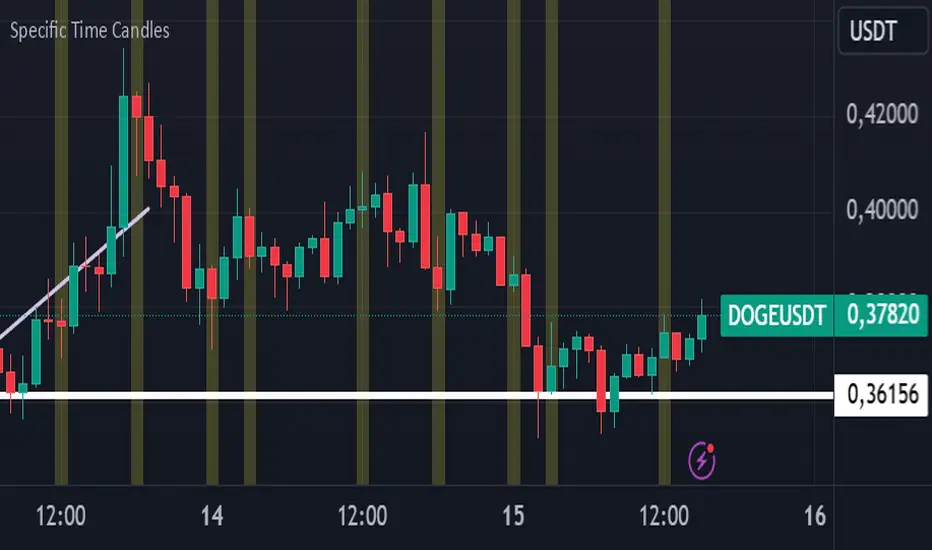
Specific Time CandlesSpecific Time Candles Indicator
The Specific Time Candles indicator is a powerful tool designed for traders who want to focus on specific time intervals within their charts. This custom indicator allows you to highlight and analyze price action during user-defined time periods, providing clarity and precision in your trading strategy.
Key Features:
Custom Time Intervals: Select any start and end time to create candles that focus on your preferred trading hours. This is particularly useful for traders who want to concentrate on market sessions, such as the London or New York session, or any other specific time frame relevant to their trading plan.
Enhanced Visualization: By isolating specific time periods, this indicator helps reduce noise and provides a clearer view of market movements during key trading hours. This can be beneficial for identifying trends, reversals, and potential breakout opportunities.
Flexible Configuration: Easily adjust the indicator settings to match your trading schedule. Whether you are a day trader, swing trader, or scalper, you can customize the time frames to suit your needs.
Compatibility: The indicator is compatible with multiple asset classes, including forex, stocks, commodities, and cryptocurrencies, making it a versatile tool for any trader.
User-Friendly Interface: Designed with simplicity in mind, the Specific Time Candles indicator is easy to set up and use, even for those who are new to TradingView.
How to Use:
Add the indicator to your chart from the TradingView library.
Set your desired start and end times in the indicator settings.
Observe the newly formed candles that represent the specified time intervals.
Use these candles to make informed trading decisions based on the focused analysis of market activity during your chosen periods.
Benefits:
Precision Trading: Focus on the most relevant market data, eliminating distractions from other time periods.
Improved Decision-Making: Gain insights into market behavior during critical times, enhancing your ability to make strategic trades.
Time Management: Efficiently manage your trading by concentrating on specific times, allowing for better planning and execution.
The Specific Time Candles indicator is a must-have for traders looking to refine their strategies by concentrating on precise market windows. Whether you are targeting high-volatility periods or specific trading sessions, this indicator provides the tools you need to succeed.
Granular Candle-by-Candle VWAPGranular Candle-by-Candle VWAP is a customizable Volume Weighted Average Price (VWAP) indicator designed for TradingView. Unlike traditional VWAP indicators that operate on the chart's primary timeframe, this script enhances precision by incorporating lower timeframe (e.g., 1-minute) data into VWAP calculations. This granular approach provides traders with a more detailed and accurate representation of the average price, accounting for intra-bar price and volume movements. The indicator dynamically adjusts to the chart's current timeframe and offers a range of customization options, including price type selection, visual styling, and alert configurations.
Customizable Features
Users have extensive control over various aspects of the Granular Candle-by-Candle VWAP indicator. Below are the key features that can be customized to align with individual trading preferences:
🎛️ Customizable Features
Users have extensive control over various aspects of the Granular Candle-by-Candle VWAP indicator. Below are the key features that can be customized to align with individual trading preferences:
🔢 Lookback Period
Description: Defines the number of lower timeframe bars used in the VWAP calculation.
Customization:
Input: VWAP Lookback Period (Number of Lower Timeframe Bars)
Default Value: 20 bars
Range: Minimum of 1 bar
Purpose: Allows traders to adjust the sensitivity of the VWAP. A smaller lookback period makes the VWAP more responsive to recent price changes, while a larger period smoothens out fluctuations.
📈 Price Type Selection
Description: Determines which price metric is used in the VWAP calculation.
Customization:
Input: Price Type for VWAP Calculation
Options:
Open: Uses the opening price of each lower timeframe bar.
High: Uses the highest price of each lower timeframe bar.
Low: Uses the lowest price of each lower timeframe bar.
Close: Uses the closing price of each lower timeframe bar.
OHLC/4: Averages the Open, High, Low, and Close prices.
HL/2: Averages the High and Low prices.
Typical Price: (High + Low + Close) / 3
Weighted Close: (High + Low + 2 × Close) / 4
Default Value: Close
Purpose: Offers flexibility in how the average price is calculated, allowing traders to choose the price metric that best fits their analysis style.
🕒 Lower Timeframe Selection
Description: Specifies the lower timeframe from which data is fetched for granular VWAP calculations.
Customization:
Input: Lower Timeframe for Granular Data
Default Value: 1 minute ("1")
Options: Any valid TradingView timeframe (e.g., "1", "3", "5", "15", etc.)
Purpose: Enables traders to select the granularity of data used in the VWAP calculation, enhancing the indicator's precision on higher timeframe charts.
🎨 VWAP Line Customization
Description: Adjusts the visual appearance of the VWAP line based on price position relative to the VWAP.
Customizations:
Color When Price is Above VWAP:
Input: VWAP Color (Price Above)
Default Value: Green
Color When Price is Below VWAP:
Input: VWAP Color (Price Below)
Default Value: Red
Line Thickness:
Input: VWAP Line Thickness
Default Value: 2
Range: Minimum of 1
Line Style:
Input: VWAP Line Style
Options: Solid, Dashed, Dotted
Default Value: Solid
Purpose: Enhances visual clarity, allowing traders to quickly assess price positions relative to the VWAP through color coding and line styling.
🔔 Alerts and Notifications
Description: Provides real-time notifications when the price crosses the VWAP.
Customizations:
Enable/Disable Alerts:
Input: Enable Alerts for Price Crossing VWAP
Default Value: Enabled (true)
Alert Conditions:
Price Crossing Above VWAP:
Trigger: When the closing price crosses from below to above the VWAP.
Alert Message: "Price has crossed above the Granular VWAP."
Price Crossing Below VWAP:
Trigger: When the closing price crosses from above to below the VWAP.
Alert Message: "Price has crossed below the Granular VWAP."
Purpose: Keeps traders informed of significant price movements relative to the VWAP, facilitating timely trading decisions.
📊 Plotting and Visualization
Description: Displays the calculated Granular VWAP on the chart with user-defined styling.
Customization Options:
Color, Thickness, and Style: As defined in the VWAP Line Customization section.
Track Price Feature:
Parameter: trackprice=true
Function: Ensures that the VWAP line remains visible even when the price moves far from the VWAP.
Purpose: Provides a clear and persistent visual reference of the VWAP on the chart, aiding in trend analysis and support/resistance identification.
⚙️ Performance Optimizations
Description: Ensures the indicator runs efficiently, especially on higher timeframes with large datasets.
Strategies Implemented:
Minimized Security Calls: Utilizes two separate request.security calls to fetch necessary data, balancing functionality and performance.
Efficient Calculations: Employs built-in functions like ta.sum for rolling calculations to reduce computational load.
Conditional Processing: Alerts are processed only when enabled, preventing unnecessary computations.
Purpose: Maintains smooth chart performance and responsiveness, even when using lower timeframe data for granular calculations.

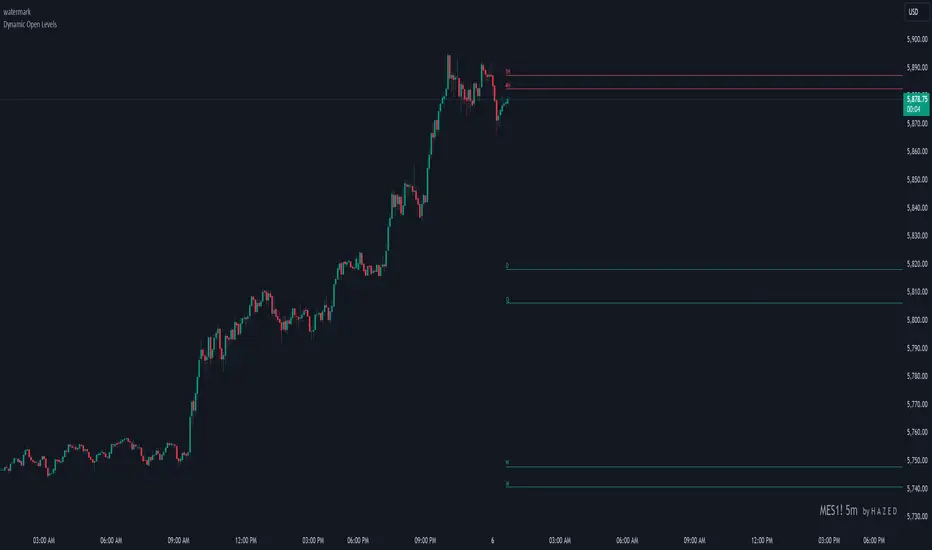
Dynamic Open Levels# Dynamic Open Levels Indicator v1.0
Release Date: November 5, 2024
Introducing the Dynamic Open Levels indicator on TradingView! This tool helps traders visualize and analyze key opening price levels across multiple timeframes, making your market analysis more effective.
---
### Key Features
- Multiple Timeframes : Yearly, Quarterly, Monthly, Weekly, Daily, 4H, and 1H levels available.
- Visibility Controls : Easily toggle visibility for each timeframe to suit your trading style.
- Line Customization : Set custom thickness and colors for lines, making charts easy to interpret.
- Monthly: Purple
- Weekly: Blue
- Daily: Green
- 4H: Red
- 1H: Orange
- Dynamic Coloring : Lines adjust color based on market conditions—teal for bullish (`rgb(34, 171, 148)`) and coral for bearish (`rgb(247, 82, 95)`).
### Labels & Customization
- Real-Time Labels : Each level is labeled for easy identification (e.g., Y for Yearly, Q for Quarterly).
- Label Settings : Customize opacity, text color, size, and position for clarity without cluttering your chart.
- Sizes : Choose from tiny, small, normal, large, to huge.
- Offset : Set labels from 1 to 10 to position them precisely.
- Color Management : Organize all colors under a dedicated Line Colors group for easy adjustments.
### Advanced Plotting & Performance
- Real-Time Updates : Levels are updated dynamically with the latest open prices.
- Extended Lines : Lines extend to the right, offering a consistent reference for future price movement.
- Optimized Performance : Handles up to 500 lines efficiently to maintain smooth performance.
---
### Installation Instructions
1. Add to Chart :
- Go to the Indicators section in TradingView.
- Search for Dynamic Open Levels and add it to your chart.
2. Customize Settings :
- Line Thickness : Adjust to suit your preference.
- Visibility : Toggle timeframes like Yearly, Monthly, Weekly, etc., as needed.
- Labels : Configure opacity, text color, size, and offset under the Label Settings group.
---
### Documentation & Support
For guidance on using the Dynamic Open Levels indicator, visit our Documentation (#). If you need assistance, check out our Support Channel (#).
---
Thank you for choosing Dynamic Open Levels . Stay tuned for future updates that will continue to improve your trading experience!
H A Z E D
MA Touch Alert SystemThis is a alert system This Pine Script creates an alert system in TradingView to notify you whenever the price touches a specified moving average. With adjustable settings, you can set your preferred moving average period, such as 50 or 200. The script calculates this moving average and triggers an alert if the price crosses it from above or below, enabling you to stay informed about important trend reversals. A visual on-chart label marks these points, and the alert condition ensures you receive notifications through TradingView. Perfect for traders looking to automate key level monitoring, this script supports trend-following and reversal strategies.

DSL Strategy [DailyPanda]
Overview
The DSL Strategy by DailyPanda is a trading strategy that synergistically combines the idea from indicators to create a more robust and reliable trading tool. By integrating these indicators, the strategy enhances signal accuracy and provides traders with a comprehensive view of market trends and momentum shifts. This combination allows for better entry and exit points, improved risk management, and adaptability to various market conditions.
Combining ideas from indicators adds value by:
Enhancing Signal Confirmation : The strategy requires alignment between trend and momentum before generating trade signals, reducing false entries.
Improving Accuracy : By integrating price action with momentum analysis, the strategy captures more reliable trading opportunities.
Providing Comprehensive Market Insight : The combination offers a better perspective on the market, considering both the direction (trend) and the strength (momentum) of price movements.
How the Components Work Together
1. Trend Identification with DSL Indicator
Dynamic Signal Lines : Calculates upper and lower DSL lines based on a moving average (SMA) and dynamic thresholds derived from recent highs and lows with a specified offset. These lines adapt to market conditions, providing real-time trend insights.
ATR-Based Bands : Adds bands around the DSL lines using the Average True Range (ATR) multiplied by a width factor. These bands account for market volatility and help identify potential stop-loss levels.
Trend Confirmation : The relationship between the price, DSL lines, and bands determines the current trend. For example, if the price consistently stays above the upper DSL line, it indicates a bullish trend.
2. Momentum Analysis
RSI Calculation : Computes the RSI over a specified period to measure the speed and change of price movements.
Zero-Lag EMA (ZLEMA) : Applies a ZLEMA to the RSI to minimize lag and produce a more responsive oscillator.
DSL Application on Oscillator : Implements the DSL concept on the oscillator by calculating dynamic upper and lower levels. This helps identify overbought or oversold conditions more accurately.
Signal Generation : Detects crossovers between the oscillator and its DSL lines. A crossover above the lower DSL line signals potential bullish momentum, while a crossover below the upper DSL line signals potential bearish momentum.
3. Integrated Signal Filtering
Confluence Requirement : A trade signal is generated only when both the DSL indicator and oscillator agree. For instance, a long entry requires both an uptrend confirmation from the DSL indicator and a bullish momentum signal from the oscillator.
Risk Management Integration : The strategy uses the DSL indicator's bands for setting stop-loss levels and calculates take-profit levels based on a user-defined risk-reward ratio. This ensures that every trade has a predefined risk management plan.
--------------------------------------------------------------------------------------------
Originality and Value Added to the Community
Unique Synergy : While both indicators are available individually, this strategy is original in how it combines them to enhance their strengths and mitigate their weaknesses, offering a novel approach not present in existing scripts.
Enhanced Reliability : By requiring confirmation from both trend and momentum indicators, the strategy reduces false signals and increases the likelihood of successful trades.
Versatility : The customizable parameters allow traders to adapt the strategy to different instruments, timeframes, and trading styles, making it a valuable tool for a wide range of trading scenarios.
Educational Contribution : The script demonstrates an effective method of combining indicators for improved trading performance, providing insights that other traders can learn from and apply to their own strategies.
--------------------------------------------------------------------------------------------
How to Use the Strategy
Adding the Strategy to Your Chart
Apply the DSL Strategy to your desired trading instrument and timeframe on TradingView.
--------------------------------------------------------------------------------------------
Configuring Parameters
DSL Indicator Settings :
Length (len) : Adjusts the sensitivity of the DSL lines (default is 34).
Offset : Determines the look-back period for threshold calculations (default is 30).
Bands Width (width) : Changes the distance of the ATR-based bands from the DSL lines (default is 1).
DSL-BELUGA Oscillator Settings :
Beluga Length (len_beluga) : Sets the period for the RSI calculation in the oscillator (default is 10).
DSL Lines Mode (dsl_mode) : Chooses between "Fast" (more responsive) and "Slow" (smoother) modes for the oscillator's DSL lines.
Risk Management :
Risk Reward (risk_reward) : Defines your desired risk-reward ratio for calculating take-profit levels (default is 1.5).
--------------------------------------------------------------------------------------------
Interpreting Signals
Long Entry Conditions :
Trend Confirmation : Price is above the upper DSL line and the upper DSL band (dsl_up1 > dsl_dn).
Price Behavior : The last three candles have both their opens and closes above the upper DSL line.
Momentum Signal : The DSL-BELUGA oscillator crosses above its lower DSL line (up_signal), indicating bullish momentum.
Short Entry Conditions :
Trend Confirmation : Price is below the lower DSL line and the lower DSL band (dsl_dn < dsl_up1).
Price Behavior : The last three candles have both their opens and closes below the lower DSL band.
Momentum Signal : The DSL-BELUGA oscillator crosses below its upper DSL line (dn_signal), indicating bearish momentum.
Exit Conditions :
Stop-Loss : Automatically set at the DSL indicator's band level (upper band for longs, lower band for shorts).
Take-Profit : Calculated based on the risk-reward ratio and the initial risk determined by the stop-loss distance.
Visual Aids
Signal Arrows : Upward green arrows for long entries and downward blue arrows for short entries appear on the chart when conditions are met.
Stop-Loss and Take-Profit Lines : Red and green lines display the calculated stop-loss and take-profit levels for active trades.
Background Highlighting : The chart background subtly changes color to indicate when a signal has been generated.
Backtesting and Optimization
Use TradingView's strategy tester to backtest the strategy over historical data.
Adjust parameters to optimize performance for different instruments or market conditions.
Regularly review backtesting results to ensure the strategy remains effective.

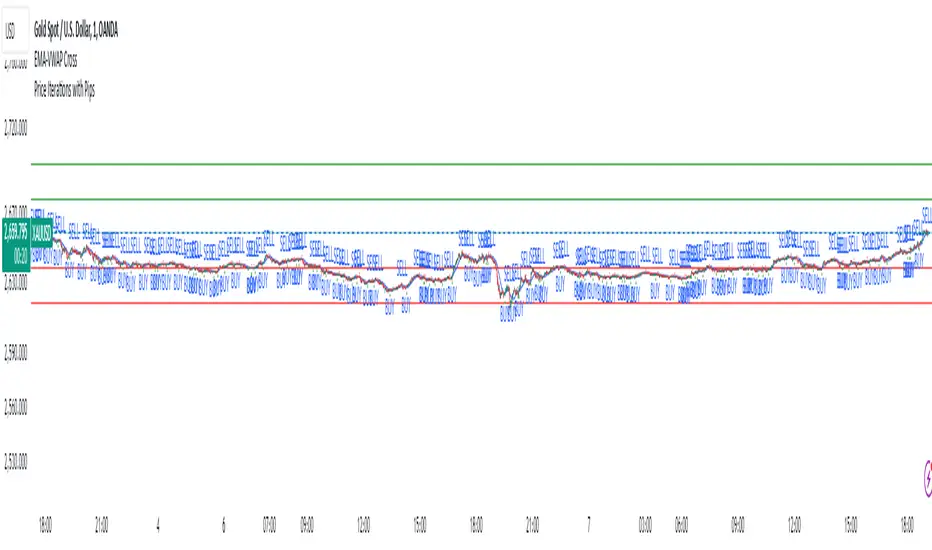
Price Iterations with Pips*Script Name:* Price Iterations with Pips
*Description:* This script plots horizontal lines above and below a user-defined initial price, representing price iterations based on a specified number of pips.
*Functionality:*
1. Asks for user input:
- Initial Price
- Pips per Iteration
- Number of Iterations
2. Calculates the price change per pip.
3. Plots horizontal lines:
- Above the initial price (green)
- Below the initial price (red)
4. Extends lines dynamically to both sides.
*Use Cases:*
1. *Support and Resistance Levels:* Use the script to visualize potential support and resistance levels based on price iterations.
2. *Price Targets:* Set the initial price as a target and use the iterations to estimate potential profit/loss levels.
3. *Risk Management:* Utilize the script to visualize risk levels based on pip iterations.
4. *Technical Analysis:* Combine the script with other technical indicators to identify potential trading opportunities.
*Trading Platforms:* This script is designed for TradingView.
*How to Use:*
1. Add the script to your TradingView chart.
2. Set the initial price, pips per iteration, and number of iterations.
3. Adjust the colors and line styles as needed.
4. Zoom in/out and pan to see the lines adjust.
*Benefits:*
1. Visualize price iterations and potential support/resistance levels.
2. Simplify risk management and price target estimation.
3. Enhance technical analysis with customizable price levels.
Supertrend Scanner on ChartThis Indicator is Used to scan 10 stock on chart.
Supertrend is widely used indicator on tradingview. So we have used the originals indicator codes of supertrend by tradingview here. Background color has been changed as per supertrend trrend.
Problem : Sometime trader wants to track multiple stocks supertrend at a time. Mostly those stock are of same sector. To track all the stocks of same sector in one chart , trader has to open multiple charts for that.
Solution : This indicator pointout where other stocks has changed the trend. Like if you see "SBIN" written in GEREEN at bottom of the candle , that means on that particular candle SBIN supertrend has changed to positive. Similarly if you see "KOTAK" written in RED at top of the candle the means supertrend has changed to Negative on that particular candle. Its so easy to trace 10 stock on same chart which stocks labelling.
How to use :
When you trade on any index , then apply all the index constituents stock on this indicator. When Index changes the trend and that change in trend is confirmed by other constituents ( like 7/10 confirmed ) then that is confirmed trend. If all the constituents are on same direction than that's the confirmed trend.
Disclamer : This indicator is for education purpose , for any profit or loss , we are not responsible. Trade on your own risk.

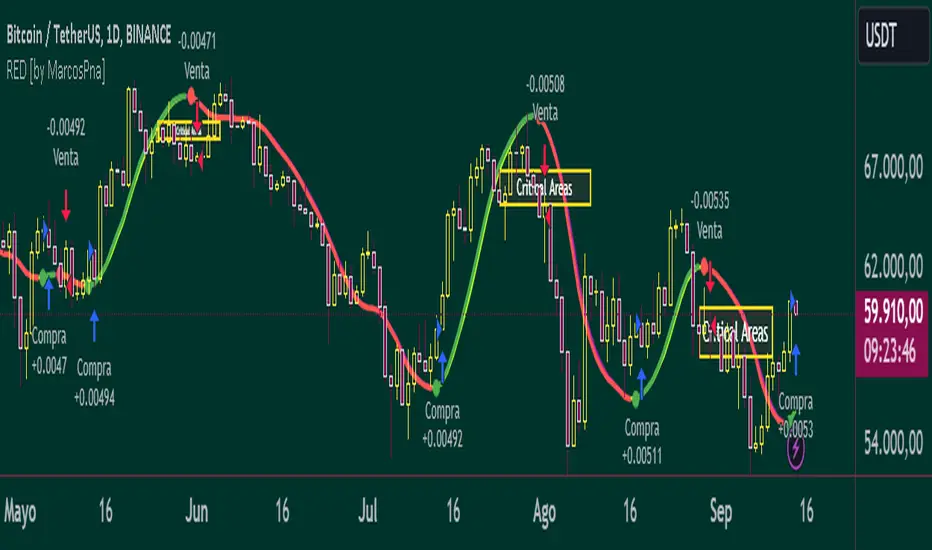
Reflected ema Difference (RED) This script, titled "Reflected EMA Difference (RED)," is based on the logic of evaluating the percentage of convergence and divergence between two moving averages, specifically the Hull Moving Averages (HMA), to make price-related decisions. The Hull Moving Average, created by Alan Hull, is used as the foundation of this strategy, offering a faster and more accurate way to analyze market trends. In this script, the concept is employed to measure and reflect price variations.
Script Functionality Overview:
Hull Moving Averages (HMA): The script utilizes two HMAs, one short-term and one long-term. The main idea is to compute the Delta Difference between these two moving averages, which represents how much they are converging or diverging from each other. This difference is key to identifying potential market trend changes.
Reflected HMA Value: Using the Delta Difference between the HMAs, the value of the short-term HMA is reflected, creating a visual reference point that helps traders see the relationship between price and HMAs on the chart.
Percentage Change Index: The second key parameter is the percentage change index. This determines when a trend is reversing, allowing buy or sell orders to be established based on significant changes in the relationship between the HMAs and the price.
Delta Multiplier: The script comes with a default Delta multiplier of 2 for calculating the difference between HMAs, allowing traders to adjust the sensitivity of the analysis based on the time frame being analyzed.
Trend Reversal Signals: When the price crosses the thresholds defined by the percentage change index, buy or sell signals are triggered, based on the detection of a potential trend reversal.
Visual Cues with Boxes: Boxes are drawn on the chart when the HullMA crosses the reflected HMA value, providing a visual aid to identify critical moments where risk should be evaluated.
Alerts for Receiving Signals:
This script allows you to set up buy and sell alerts via TradingView's alert system. These alerts are triggered when trend changes are detected based on the conditions coded in the script. Traders can receive instant notifications, allowing them to make decisions without needing to constantly monitor the chart.
Additional Considerations:
The percentage change parameter is adjustable and should be configured based on the time frame you are trading on. For longer time frames, it's advisable to use a larger percentage change to avoid false signals.
The use of Hull Moving Averages (HMA) provides a faster and more reactive approach to trend evaluation compared to other moving averages, making it a powerful tool for traders seeking quick reversal signals.
This approach combines the power of Hull Moving Averages with an alert system to improve the trader’s response to trend changes.
Spanish
Este script, titulado "Reflected EMA Difference (RED)", está fundamentado en la lógica de evaluar el porcentaje de acercamiento y distancia entre dos medias móviles, específicamente las medias móviles de Hull (HMA), para tomar decisiones sobre el valor del precio. El creador de la media móvil de Hull, Alan Hull, diseñó este indicador para ofrecer una forma más rápida y precisa de analizar tendencias de mercado, y en este script se utiliza su concepto como base para medir y reflejar las variaciones de precio.
Descripción del funcionamiento:
Medias Móviles de Hull (HMA): Se utilizan dos HMAs, una de corto plazo y otra de largo plazo. La idea principal es calcular la diferencia Delta entre estas dos medias móviles, que representa cuánto se están alejando o acercando entre sí. Esta diferencia es clave para identificar cambios potenciales en la tendencia del mercado.
Valor Reflejado de la HMA: Con la diferencia Delta calculada entre las HMAs, se refleja el valor de la HMA corta, creando un punto de referencia visual que ayuda a los traders a observar la relación entre el precio y las HMAs en el gráfico.
Índice de Cambio de Porcentaje: El segundo parámetro clave del script es el índice de cambio porcentual. Este define el momento en que una tendencia está revirtiendo, permitiendo establecer órdenes de compra o venta en función de un cambio significativo en la relación entre las HMAs y el precio.
Multiplicador Delta: El script tiene un multiplicador predeterminado de 2 para el cálculo de la diferencia Delta, lo que permite ajustar la sensibilidad del análisis según la temporalidad del gráfico.
Señales de Reversión de Tendencia: Cuando el precio cruza los límites definidos por el índice de cambio porcentual, se emiten señales para comprar o vender, basadas en la detección de una posible reversión de tendencia.
Visualización con Cajas: Se dibujan cajas en el gráfico cuando el indicador HullMA cruza el valor reflejado de la HMA, ayudando a identificar visualmente los momentos críticos en los que se debe evaluar el riesgo de las operaciones.
Alertas para Recibir Señales:
Este script permite configurar alertas de compra y venta desde el apartado de alertas de TradingView. Estas alertas se activan cuando se detectan cambios de tendencia en función de las condiciones establecidas en el código. El trader puede recibir notificaciones instantáneas, lo que facilita la toma de decisiones sin necesidad de estar constantemente observando el gráfico.
Consideraciones adicionales:
El porcentaje de cambio es un parámetro ajustable y debe configurarse según la temporalidad que se esté operando. En temporalidades más largas, es recomendable usar un porcentaje de cambio mayor para evitar señales falsas.
La utilización de las medias móviles de Hull (HMA) proporciona un enfoque más rápido y reactivo para evaluar tendencias en comparación con otras medias móviles, lo que lo convierte en una herramienta poderosa para traders que buscan señales rápidas de reversión.
Este enfoque combina la potencia de las medias móviles de Hull con un sistema de alertas que mejora la reactividad a cambios de tendencia.
Solar System in 3D [Astro Tool w/ Zodiac]Hello Traders and Developers,
I am excited to announce my latest Open Source indicator. At the core, this is a demonstration of PineScript’s capabilities in Rendering 3D Animations, while at the same time being a practical tool for Financial Astrologists.
This 3D Engine dynamically renders all the major celestial bodies with their individual orbits, rotation speeds, polar inclinations and astrological aspects, all while maintaining accurate spatial relationships and perspective.
This is a Geocentric model of the solar system (viewed from the perspective of Earth), since that is what most Astrologists use. Thanks to the AstroLib Library created by @BarefootJoey, this model uses the real coordinates of cosmic bodies for every timestamp.
This script truly comes to life when using the “Bar Replay” mode in TradingView, as you can observe the relationships between planets and price action as time progresses, with the full animation capabilities as mentioned above.
In addition to what I have described, this indicator also displays the orbital trajectories for each cosmic body, and has labels for everything. I have also added the ability to hover on all the labels, and see a short description of what they imply in Astrology.
Optional Planetary Aspect Computation
This indicator supports all the Major Planetary Aspects, with an accuracy defined by the user (1° by default).
Conjunction: 0° Alignment. This draws a RED line starting from the center, and going through both planets.
Sextile: 60° Alignment. This draws three YELLOW lines, connecting the planets to each other and to the center.
Square: 90° Alignment. This draws three BLUE lines, connecting the planets to each other and to the center.
Trine: 120° Alignment. This draws three PURPLE lines, connecting the planets to each other and to the center.
Opposition: 180° Alignment. This draws a GREEN line starting from one planet, passing through the center and ending on the second planet.
The below image depicts a Top-Down view of the system, with the Moon in Opposition to Venus and with Mars in Square with Neptune .
Retrograde Computation
This indicator also displays when a planet enters Retrograde (Apparent Backward Motion) by making its orbital trajectory dashed and the planet name getting a red background.
The image below displays an example of Jupiter, Saturn, Neptune and Pluto in Retrograde Motion, from the camera perspective of a 65 degree inclination.
Optional Zodiac Computation (Tropical and Sidereal)
Zodiac represents the relatively stationary star formations that rest along the ecliptic plane, with planets transitioning from one to the next, each with a 30° separation (making 12 in total). I have implemented the option to switch between Tropical mode (where these stars were 2,000 years ago) and Sidereal (where these stars are today).
The image below displays the Zodiac labels with clear lines denoting where each planet falls into.
While this indicator is deployed in a separate pane, it is trivial to transfer it onto your price chart, just by clicking and dragging the graphics. After that, you can adjust the visuals by dragging the scale on the side, or optimizing model settings. You can also drag the model above or below the price, as shown in the following image:
Of course, there are a lot of options to customize this planetary model to your tastes and analytical needs. Aside from visual changes for the labels, colors or resolution you can also disable certain planets that don’t meet your needs as shown below:
Once can also infer the current lunar phases using the Aspects between the Sun and Moon. When the Moon is Opposite the Sun that is a Full Moon, while when they are Conjunct that is a New Moon (and sometimes Eclipse).
—---------------------------------------------------------------------------
I have made this indicator open source to help PineScript programmers understand how to approach 3D graphics rendering, enabling them to develop ever more capable scripts and continuously push the boundaries of what's possible on TradingView.
The code is well documented with comments and has a clear naming convention for functions and variables, to aid developers understand how everything operates.
For financial astrologists, this indicator offers a new way to visualize and correlate planetary movements, adding depth and ease to astrological market analysis.
Regards,
Hawk

First Candle High Low LevelsDescription
The "First Candle High Low Levels" Pine Script indicator is designed to highlight the high and low levels of the first candle of the day on your TradingView chart. It works across different timeframes and specifically handles the Indian stock market trading hours (9:15 AM to 3:30 PM IST). The script draws a box from the start to the end of the trading session, visually marking the price range defined by the first candle of the day. Traders can customize the box's border color, fill color, and line width.
Features
Customizable Timeframe: Users can select the desired timeframe for the first candle (e.g., 5-minute, 15-minute, etc.).
Custom Box Appearance: Options to adjust the border color, fill color, and line width of the drawn box.
Auto Reset for Each New Day: The high and low of the first candle are reset daily to mark the start of the next trading day.
Accurate Market Session Handling: The box is drawn from the start of the first candle to the end of the trading session (3:30 PM IST).
Usage
Adding to Chart: Apply the script by copying it into the Pine Script editor in TradingView. Once added, the script will automatically draw a box representing the high and low of the first candle of the day.
Select Timeframe: You can adjust the First Candle Timeframe input to define which timeframe candle will be used for marking the high and low. For example, if you choose a 5-minute timeframe, the high and low of the first 5-minute candle will be used.
Customization:
Adjust the Border Color and Box Fill Color through the input settings to match your chart's style.
Modify the Box Line Width to make the box lines more or less prominent.

Uptrick: Dual Moving Average Volume Oscillator
Title: Uptrick: Dual Moving Average Volume Oscillator (DPVO)
### Overview
The "Uptrick: Dual Moving Average Volume Oscillator" (DPVO) is an advanced trading tool designed to enhance market analysis by integrating volume data with price action. This indicator is specially developed to provide traders with deeper insights into market dynamics, making it easier to spot potential entry and exit points based on volume and price interactions. The DPVO stands out by offering a sophisticated approach to traditional volume analysis, setting it apart from typical volume indicators available on the TradingView platform.
### Unique Features
Unlike traditional indicators that analyze volume and price movements separately, the DPVO combines these two critical elements to offer a comprehensive view of market behavior. By calculating the Volume Impact, which involves the product of the exponential moving averages (EMAs) of volume and the price range (close - open), this indicator highlights significant trading activities that could indicate strong buying or selling pressure. This method allows traders to see not just the volume spikes, but how those spikes relate to price movements, providing a clearer picture of market sentiment.
### Customization and Inputs
The DPVO is highly customizable, catering to various trading styles and strategies:
- **Oscillator Length (`oscLength`)**: Adjusts the period over which the volume and price difference is analyzed, allowing traders to set it according to their trading timeframe.
- **Fast and Slow Moving Averages (`fastMA` and `slowMA`)**: These parameters control the responsiveness of the DPVO. A shorter `fastMA` coupled with a longer `slowMA` can help in identifying trends quicker or smoothing out market noise for more conservative approaches.
- **Signal Smoothing (`signalSmooth`)**: This input helps in reducing signal noise, making the crossover and crossunder points between the DVO and its smoothed signal line clearer and easier to interpret.
### Functionality Details
The DPVO operates through a sequence of calculated steps that integrate volume data with price movement:
1. **Volume Impact Calculation**: This is the foundational step where the product of the EMA of volume and the EMA of price range (close - open) is calculated. This metric highlights trading sessions where significant volume accompanies substantial price movements, suggesting a strong market response.
2. **Dynamic Volume Oscillator (DVO)**: The heart of the indicator, the DVO, is derived by calculating the difference between the fast EMA and the slow EMA of the Volume Impact. This result is then normalized by dividing by the EMA of the volume over the same period to scale the output, making it consistent across various trading environments.
3. **Signal Generation**: The final output is smoothed using a simple moving average of the DVO to filter out market noise. Buy and sell signals are generated based on the crossover and crossunder of the DVO with its smoothed version, providing clear cues for market entry or exit.
### Originality
The DPVO's originality lies in its innovative integration of volume and price movement, a novel approach not typically observed in other volume indicators. By analyzing the product of volume and price change EMAs, the DPVO captures the essence of market dynamics more holistically than traditional tools, which often only reflect volume levels without contextualizing them with price actions. This dual analysis provides traders with a deeper understanding of market forces, enabling them to make more informed decisions based on a combination of volume surges and significant price movements. The DPVO also introduces a unique normalization and smoothing technique that refines the oscillator's output, offering cleaner and more reliable signals that are adaptable to various market conditions and trading styles.
### Practical Application
The DPVO excels in environments where volume plays a crucial role in validating price movements. Traders can utilize the buy and sell signals generated by the DPVO to enhance their decision-making process. The signals are plotted directly on the trading chart, with buy signals appearing below the price bars and sell signals above, ensuring they are prominent and actionable. This setup is particularly useful for day traders and swing traders who rely on timely and accurate signals to maximize their trading opportunities.
### Best Practices
To maximize the effectiveness of the DPVO, traders should consider the following best practices:
- **Market Selection**: Use the DPVO in markets known for strong volume-price correlation such as major forex pairs, popular stocks, and cryptocurrencies.
- **Signal Confirmation**: While the DPVO provides powerful signals, confirming these signals with additional indicators such as RSI or MACD can increase trade reliability.
- **Risk Management**: Always use stop-loss orders to manage risks associated with trading signals. Adjust the position size based on the volatility of the asset to avoid significant losses.
### Practical Example + How to use it
Practical Example1: Day Trading Cryptocurrencies
For a day trader focusing on the highly volatile cryptocurrency market, the DPVO can be an effective tool on a 15-minute chart. Suppose a trader is monitoring Bitcoin (BTC) during a period of high market activity. The DPVO might show an upward crossover of the DVO above its smoothed signal line while also indicating a significant increase in volume. This could signal that strong buying pressure is entering the market, suggesting a potential short-term rally. The trader could enter a long position based on this signal, setting a stop-loss just below the recent support level to manage risk. If the DPVO later shows a crossover in the opposite direction with decreasing volume, it might signal a good exit point, allowing the trader to lock in profits before a potential pullback.
- **Swing Trading Stocks**: For a swing trader looking at stocks, the DPVO could be applied on a daily chart. If the oscillator shows a consistent downward trend along with increasing volume, this could suggest a potential sell-off, providing a sell signal before a significant downturn.
You can look for:
--> Increase in volume - You can use indicators like 24-hour-Volume to have a better visualization
--> Uptrend/Downtrend in the indicator (HH, HL, LL, LH)
--> Confirmation (Buy signal/Sell signal)
--> Correct Price action (Not too steep moves up or down. Stable moves.) (Optional)
--> Confirmation with other indicators (Optional)
Quick image showing you an example of a buy signal on SOLANA:
### Technical Notes
- **Calculation Efficiency**: The DPVO utilizes exponential moving averages (EMAs) in its calculations, which provides a balance between responsiveness and smoothing. EMAs are favored over simple moving averages in this context because they give more weight to recent data, making the indicator more sensitive to recent market changes.
- **Normalization**: The normalization of the DVO by the EMA of the volume ensures that the oscillator remains consistent across different assets and timeframes. This means the indicator can be used on a wide variety of markets without needing significant adjustments, making it a versatile tool for traders.
- **Signal Line Smoothing**: The final signal line is smoothed using a simple moving average (SMA) to reduce noise. The choice of SMA for smoothing, as opposed to EMA, is intentional to provide a more stable signal that is less prone to frequent whipsaws, which can occur in highly volatile markets.
- **Lag and Sensitivity**: Like all moving average-based indicators, the DPVO may introduce a slight lag in signal generation. However, this is offset by the indicator’s ability to filter out market noise, making it a reliable tool for identifying genuine trends and reversals. Adjusting the `fastMA`, `slowMA`, and `signalSmooth` inputs allows traders to fine-tune the sensitivity of the DPVO to match their specific trading strategy and market conditions.
- **Platform Compatibility**: The DPVO is written in Pine Script™ v5, ensuring compatibility with the latest features and functionalities offered by TradingView. This version takes advantage of optimized functions for performance and accuracy in calculations, making it well-suited for real-time analysis.
Conclusion
The "Uptrick: Dual Moving Average Volume Oscillator" is a revolutionary tool that merges volume analysis with price movement to offer traders a more nuanced understanding of market trends and reversals. Its ability to provide clear, actionable signals based on a unique combination of volume and price changes makes it an invaluable addition to any trader's toolkit. Whether you are managing long-term positions or looking for quick trades, the DPVO provides insights that can help refine any trading strategy, making it a standout choice in the crowded field of technical indicators.
Nothing from this indicator or any other Uptrick Indicators is financial advice. Only you are ultimately responsible for your choices.

Sniper Signal- Description
The Sniper Signal is a sophisticated technical indicator designed for traders seeking to maximize accuracy in identifying key turning points within a market. This indicator is built on a dual approach, combining the power of the Wave Trend Momentum Oscillator (WTMO) with the robustness of a long-term Simple Moving Average (SMA), making it an ideal tool for trading in dynamic and trending market environments.
The WTMO is known for its ability to capture momentum and underlying price direction, providing early signals of trend changes. By smoothing price movements using an exponential moving average (EMA), the WTMO accurately identifies when price is overextending in one direction, which may precede a reversal.
The 100-period SMA acts as a critical trend filter, ensuring that trades are only made in the direction of the prevailing market flow. This approach ensures that signals generated by the WTMO align with the long-term trend, filtering out false signals that can appear in sideways or low volatility markets.
The Sniper Signal is not just an indicator that marks entries and exits; it is a complete strategy in itself, designed for traders who understand the importance of trading in the direction of the prevailing trend. Buy signals are generated only when momentum is at its lowest point (WT1 < -5) and the price is supported by a confirmed uptrend (price above the SMA). Conversely, sell signals are only triggered when momentum is at extremely high levels (WT1 > 5) and the market shows clear signs of weakness (price below the SMA).
This combination of momentum and trend analysis creates a balanced approach that allows traders to capture significant moves in the market, while minimizing exposure to unnecessary risk. The Sniper Signal is particularly effective in markets with well-defined trends, where the key to success lies in entering the market at optimal points and exiting before a significant reversal occurs.
In summary, the Sniper Signal is an advanced tool designed for serious traders looking to take advantage of the combination of momentum and trend to execute high probability trades in moving markets.
- How to use the script?
The Sniper Signal indicator code is written in Pine Script, the native programming language of TradingView. To use this indicator, users must copy the code and paste it into the Pine Script editor within the TradingView platform. Once they have done this, they can save and add the script to their chart to begin displaying buy and sell signals directly on their price charts.
When using the Sniper Signal, traders should pay attention to the signals represented by the triangles on the chart: an upward-facing blue triangle indicates a possible buying opportunity, while a downward-facing red triangle suggests a possible selling opportunity. It is crucial that users also watch the 100-period Simple Moving Average (SMA), shown as a gray line on the chart, to ensure that trades align with the overall market trend. This helps filter out less reliable signals and improves the accuracy of trading decisions.
- Open-source reuse
The indicator code is based on common and widely used concepts in technical analysis, such as the Wave Trend Momentum Oscillator (WTMO) and the Simple Moving Average (SMA). These components are not proprietary and are part of the general knowledge in the trading community, which means that many developers can create their own versions based on these same principles.
