Volume Profile For All AccountsVolume Profile For All Accounts is displaying volume from price perspective. It’s done by summing volume by the “estimated” transaction price. This version is estimating it based on public volume data so it can be used with any account.
Volume Profile is a powerful tool commonly used by PRO users, to disseminate its use also by users who operate on basic volume data, we have prepared a set of scripts:
Volume Profile For All Accounts – Analyze last 50-20000 bars.
Volume Profile From Date For All Accounts – Analyze all bars since start date.
Volume Profile Range For All Accounts – Analyze bars in a range between start and end date.
Traiding View is supporting paid users with Volume Profile on extended volume dataset. We recommend to use it, because of access to more precise data.
Settings:
SCANNER VISUALIZATION
Limit – How many last bars should be taken into account during calculations. For small values, the estimation may differ significantly from the Volume Profile available for Paid Traiding View users.
Rows – Number of rows
Width – Width of the visualization.
Position – Position of the visualization:
S_DU – At START of the area, DOWN first
S_UD – At START of the area, UP first
BE_DU – At BEFORE END of the area, DOWN first
BE_UD – At BEFORE END of the area, UP first
E_DU – At END of the area, DOWN first
E_UD – At END of the area, UP first
Color Up – Color of volume classified as move Up, or Both if separation is off.
Color Down - Color of volume classified as move Down
Color Border – Border color.
Up/Down separate – Draw separate volume classified as Up and Down
Show values – Showing volume values of the bars.
Troubleshooting:
In case of any problems, send error details to the author of the script.
Cari dalam skrip untuk "Up down"
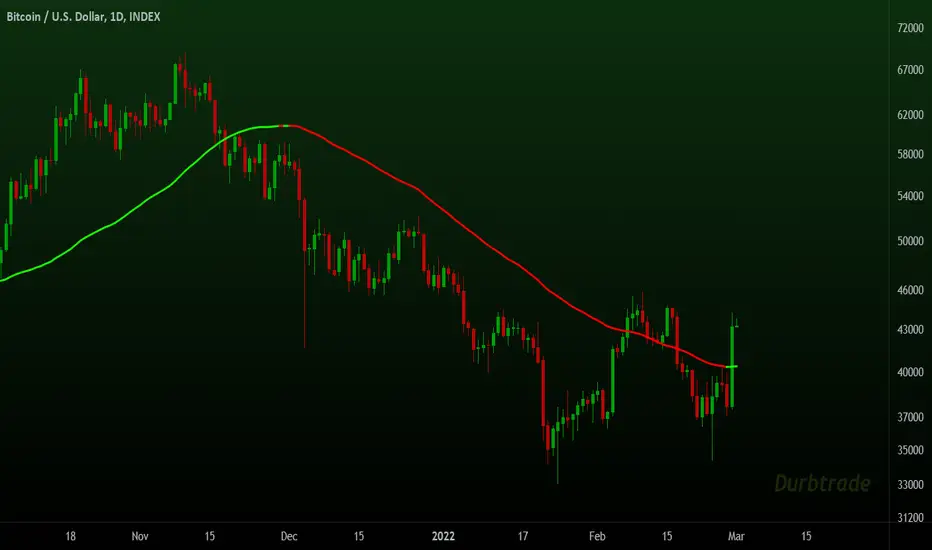
Moving Averages System - DurbtradeMoving Averages System - Durbtrade
1 indicator... customizable.
Displays up to 4 independent Moving Averages (MA's) at once.
Each MA can be 1 of 6 "MA Types" : SMA, EMA, WMA, VWMA, HMA, or DEMA.
There are 7 individual fills...
4 "MA/Source Fills" and 3 "MA/MA Fills".
The "Source" is selectable,
and there is a "Source Plot" option
to display a plot of the source.
No max value for MA "Length".
Each MA has what I call a "Length Multiplier",
and each MA has its own "Offset".
The colors of each MA,
as well as the Source Plot,
can be up/down "Color-Changing", or solid.
"Line Thickness" is unlimited.
Each of the 3 "MA/MA Fills" allow you to select which 2 of the 4 MA's to fill between!
All 7 fills are customizable by above/below colors, and opacity.
All 7 fills include a "Color Swap" option,
in the case that you need to switch the display of the above-color to the below-color,
and the below-color to the above-color!
All plots are scripted to be drawn visually in front of all fills!
Lastly, you can turn off the display of the MA plots and the Source Plot...
allowing the display of only fills!
--------------------------------------------
--------------------------------------------
Let's take a more detailed look!
First, let's go through the settings, and how to use the Moving Averages System.
You can divide the Inputs tab of the indicator settings into 3 main sections...
1 - Moving Averages
2 - Source Plot, and MA/Source Fills
3 - MA/MA fills
Let's discuss the first section, which is where we set up our MA's.
Here, we see the parameters for our 4 Moving Averages :
All 4 MA's can be customized here in the following ways...
- Toggle ON/OFF by checking the checkbox
- Length
- Length Multiplier
- Type (SMA, EMA, WMA, VWMA, HMA, or DEMA)
- Up/Down Color Change ON/OFF
- Line Thickness
- Offset
(The Plot Styles, Up/Down/Solid Colors, and Opacities of all 4 MA's
are customizable under the Style tab of the indicator settings)
There are no maximum value limitations for Length, Line Thickness, and Offset.
Of note, the "Length Multiplier" multiplies the "Length" value by a chosen integer.
This can be used to incrementally scan a wide spectrum of lengths very quickly.
Or it can be used to maintain ratios while increasing the MA display lengths...
just multiply all lengths by the same number.
It can also be used to easily create a moving average ribbon
by using multiple Moving Average Systems all at once.
Or, it can be another method to set up higher-timeframe MA's on a lower-timeframe chart...
for example, if both the chart and indicator are on the 1Hour timeframe,
you can multiply all of your set lengths by 24
to see the 1Day MA's of those same lengths on the 1Hour chart.
Next, lets look at the second section of the Inputs tab of the indicator settings,
where we edit the "Source Plot" and "MA/Source Fills".
We can turn ON/OFF the "Source Plot" -
which plots a line of the "Source" that you have selected -
and edit the parameters :
Checking the "Source Plot" box turns the "Source Plot" ON/OFF.
You can turn Up/Down Color Change ON/OFF,
and adjust Line Thickness and Offset.
(The Plot Style, Up/Down/Solid Colors, and all Opacities of the Source Plot
are customizable under the Style tab of the indicator settings.)
Next is where you can turn ON/OFF and edit each "MA/Source Fill".
Checking the "MA#1/Source Fill" box turns on the fill between MA#1 and the source.
You can choose the color and opacity for the above-color and the below-color.
Need to switch the display of the two colors?... turn on "Color Swap" to easily do just that.
The remaining 3 MA/Source Fills work in the same exact way...
turning on a fill between the associated MA#, and the source.
In total, there are 4 MA/Source Fills... 1 for each MA.
Note that neither the Source Plot, nor any of the MA's, need to be turned on
in order to use the MA/Source Fills.
Finally, lets look at the third section of the Inputs tab of the indicator settings.
This is where we can edit the 3 "MA/MA Fills".
An MA/MA Fill allows you to select any 2 of the 4 MA's that you have set,
and fill the space between them with color :
Checking the MA/MA Fill box turns ON/OFF the associated MA/MA Fill.
Below each ON/OFF switch are 2 boxes where you can select the 2 MA's that you want to fill between.
Select the 2 MA's that you want to use according to their MA#'s.
Next, you have the Above/Below Color/Opacity for the associated MA/MA Fill,
and lastly, the Color Swap option.
The numerical order of the MA#'s that you select here is of no concern,
because each MA/MA Fill has that "Color Swap" option...
and, as before, this swaps the display of the above-color and the below-color.
Note that the MA's do not need to be turned on
in order to use the MA/MA Fills.
--------------------------------------------
Additional Notes :
All colors and opacities of this indicator can be customized.
All fills can have above/below colors, and all plots can have up/down colors.
All fills and plots can be one static color, too.
All plots can be 1 of 10 plot styles:
Line, Line with Breaks, Step Line, Step Line with Diamonds, Histogram,
Cross, Area, Area with Breaks, Columns, or Circles.
All plots use the same single "Source", which is selectable.
And don't forget... you can try applying this indicator to other indicators!
--------------------------------------------
Now, let's take a look at some examples of the Durbtrade Moving Averages System in action!
All 4 MA's plots on, MA Type is SMA, color-changing on, lengths 50, 100, 150, and 200 :
Add the Source Plot, and all 4 MA/Source Fills :
Add the 3 MA/MA fills :
Turn off candles visibility, and turn off MA color-change :
Turn off the MA plots :
Turn off the Source Plot :
...
Here are some other images using the Multi Moving Average Tool :
Here it is on the 1Second :
Here it is on the 3Day :
Here is your 1Day SMA DeathCross :
Use 3 Moving Average Systems at once to build your own EMA Ribbon :
Compare 4 different MA types, all with the same length :
--------------------------------------------
Script Stats :
Pinescript Version : 5
Code Length : 149 Lines
Total Plots : 16
- Visible Plots : 5 (4 MA Plots, 1 Source Plot)
- Invisible Plots : 11 (4 MA Plots, 1 Source Plot, 6 MA/MA Fill Plots)
Total Fills : 7 (4 MA/Source Fills, 3 MA/MA Fills)
Total Colors/Opacities : 29
Total Unique Variables : 92
- Input Variables : 69
- Unique Output Variables : 23
--------------------------------------------
Final Thoughts :
I'm excited to share the Durbtrade Moving Averages System!
I think that this indicator has a wide range of MA-related applications,
an easy-to-use interface with maximum customization, and unique fill features...
all in one indicator.
I feel that it is a quick and useful tool
whether you are just plotting a few moving averages...
or you are creating intense kaleidoscopic tidal waves of colored data!
Either way, I think it is pretty awesome,
and so, I wanted to share it with you...
I hope that you enjoy it and find it useful!
- Please feel free to comment your thoughts, critiques, or suggestions. They are all very helpful!
- Also, please feel free to comment any positive feedback, or awesome screencaps/ideas of the indicator in action!
- Check out my other Pinescript indicators if you like this one... they work well together.
- I hope that you find this script useful.
- Enjoy!
--------------------------------------------
// Durbtrade
Close strength lineThe close strength line shows how much the strength in the current up/down trend actually present.
We calculate it by difference between High-Low and the way it moves with respect to Close moving averages.
You can change intervals from settings.
Use this in combination with any other moving average indicator e.g. EMA 13
when Close line is below other indicators/priceline, it is Uptrend and close line acts as support.
when Close line is above other indicators/priceline, it is Downtrend and close line acts as resistance.
You can also use Close line as potential Targets for Buy or Short trades depending on it's direction with respect to price line last Close.

Andy's Volatility Hunt IndicatorBuilt Volatility Hunt Indicator 1 year ago and backtested.
The purpose of this indicator is to IDENTIFY when a big move up/down is coming.
This indicator is best used for the 6 HR timeframe and results will be different if you apply it on other timeframes, as it was designed for the 6 hour timeframe.
When the signal "Pickup" occurs that means a big move is coming.
The big move can be going toward the upside or the downside.
As seen in the few previous "Pickup", FB has resulted in moves of 15%-20%.
It can also be used on multiple markets, a few that I have used were in tech stocks and BTC .
Moreover, you can set alert signals on the call when "Pickup" appears.
-Andy C

4-Way EMA Trend4 separate EMAs that are used to determine trend, colored appropriately to reflect the trend to make it easy to tell what the trend is. All 4 EMAs are not needed, you can turn each one on and off individually and the indicator will adjust itself accordingly. Having a single EMA will use the closing price to determine the trend. There are 2 different types of trend detection; EMA Flip and EMA Confluence. EMA Flip is dependent on all active EMAs rising or falling in the correct hierarchical order. The EMA Confluence option is if all EMAs are moving in the same direction. I've found that this second option, EMA Confluence, is more accurate in getting in early before strong movements because the EMAs will more often move in the same direction before they "flip".

Multi-Function RCI(strategic signal,alert and divergence)Japanese below / 日本語説明は下記
Overview
Multi-function RCI indicator with functions below.
1.Multiple signals according to conditions where 3 RCI lines cross
2.Alert when signals triggered
3.Auto divergence drawing
What is RCI?
RCI is one of the oscillator indicators such as RSI and stochastic, measuring overbought/oversold. While RSI and stochastic measures overbought/oversold by price axis, RCI measures by price and time axis.
Please see the details below.
Functions:
1.Multiple signals according to conditions where RCI 3 lines cross
There is two types of signals available in this indicator
A. Overbought/oversold signals
B. Strategic signals
A. Overbought/oversold signals
These signals are displayed when each RCI line crosses upperband/lowerband.
Conditions are as follows:
-RCI(Short) cross over/under upper band
-RCI(Short) cross over/under lower band
-RCI(Middle) cross over/under upper band
-RCI(Middle) cross over/under lower band
-RCI(Long) cross over/under upper band
-RCI(Long) cross over/under lower band
Upper band and lower band can be parameterized.
a. Cross over upper band/Cross under lower band:
These signal are good to judge trend maturity. Once trends get matured, market usually goes into sideways and lead to trend reversal.
b. Cross under upper band/Cross over lower band:
These signal are good to catch trend reversal.
The longer RCI period gets, the bigger price movement gets.
Sample chart
RCI(middle,dark blue) and RCI(Long, magenta) crosses over/under upper band/lower band
B. Strategic signals
Strategic signals are more appropriate to judge timing to enter a trade.
Signals will be appeared when conditions below met with option to select signal sensitivity.
-RCI(Short) crosses over RCI(Middle)
-RCI(Middle) crosses over RCI(Long) and RCI(Long) is below zero line
-RCI(Short) crosses over RCI(Long) and RCI(Long) is below zero line
-RCI(Short) crosses under RCI(Middle)
-RCI(Middle) crosses under RCI(Long) and RCI(Long) is below zero line
-RCI(Short) crosses under RCI(Long) and RCI(Long) is below zero line
With signal sensitivity “Advanced” selected, signals will be displayed when conditions above are met above upper band or below lower band.
Advanced mode is more suitable to aim bigger trend while standard mode is for short term up/down movement.
Signal sensitivity is designed for users to select depending on their trading style(Day trading, swing trading, scalping) and strategy.
Once strategic signals triggered, prepare for trend reversal, observing price action.
The two charts below describe how different signal sensitivity makes.
Sample chart(Standard)
RCI(middle, dark blue) and RCI(long,magenta) cross signals are displayed as an example
Sample chart(Advanced)
RCI(middle, dark blue) and RCI(long,magenta) cross signals are displayed as an example
As you can see, advanced mode is more suitable to aim big movement as RCI cross happens after maximum stretch, while standard is good to catch smaller wave.
2.Alert when signals triggered
Alert can be set with above-mentioned signal conditions.
3.Auto divergence drawing
Divergence line will be automatically drawn as per the logic below.
Also, users can select which RCI line(Short/middle/long) will be targeted to detect divergence.
Bearish : When two consecutive pivot highs go up but RCI values corresponding to each high go down.
Bullish: When two consecutive pivot lows go down but RCI values corresponding to each low go up.
Pivot highs(lows) are identified when those are preceded by n lower highs(lows) and proceeded by n lower highs(lows).
* n is parameterized.
See the diagram below.
How to access this indicator?
This indicator is paid and invited-only indicator.
Please see the instruction below.
Comment section is only for comments on the indicator or updates. Please refrain from contacting me using comments to follow TradingView house rules.
———————————————————————————————————————
多機能RCIインジケーターです。以下の機能が搭載されています。
1.複数タイプのシグナル表示(シグナル感度制御付き)
2.アラート設定
3.ダイバージェンス自動描画
RCIとは?
RCIはRSIやストキャスティクスと同様に買われすぎ・売られすぎを数値化するオシレーター系インジケーターの一つです。
RSIやストキャスティクスが価格軸だけを元に買われすぎ・売られすぎを数値化するのに対して、RCIは価格と時間軸の双方を考慮して買われすぎ・売られすぎを数値化するという違いがあります。
機能詳細は以下の通りです。
機能詳細
1.複数タイプのシグナル表示(シグナル感度制御付き)
3本のRCIとアッパーバンド・ロワーバンドとの交差条件で異なるシグナルを表示することができます。
このインジケーターには以下の2つのタイプのシグナルが存在します。
A. 買われすぎ/売られすぎシグナル
B. ストラテジーシグナル
A. 買われすぎ/売られすぎシグナル
RCIと買われすぎ・売られすぎの水準であるアッパーバンドとロワーバンドとのクロスでシグナルを表示します。
条件:
RCI(短期)がアッパーバンドを上抜いた時または下抜いた時
RCI(短期)がロワーバンドを下抜いた時または上抜いた時
RCI(中期)がアッパーバンドを上抜いた時または下抜いた時
RCI(中期)がロワーバンドを下抜いた時または上抜いた時
RCI(長期)がアッパーバンドを上抜いた時または下抜いた時
RCI(長期)がロワーバンドを下抜いた時または上抜いた時
アッパーバンドとロワーバンドはパラメータ設定可能です。(初期値は80と-80%)
<使い方>
A.アッパーバンドの上抜け/ロワーバンドの下抜け
トレンドの過熱感・成熟度の判断に使用。一般的にはトレンドが成熟しきった後に天井圏や底値圏を形成し、その後トレンド転換が発生します。
b.アッパーバンドの下抜け/ロワーバンドの上抜け
トレンド転換のタイミングを図るのに使用。
サンプルチャート
RCI中期(青)・長期(マゼンタ)が上下バンドを上抜いた時、下抜いた時
B. ストラテジーシグナル
3本のRCIの交差条件で発生するこのシグナルは相場の反転が期待できるシグナルということで、よりトレード機会の判断に向いています。
またシグナル発生の感度を、StandardとAdvancedの二つから選択することができます。
シグナル条件:
<シグナル感度: Standard>
<上昇示唆>
RCI(短期)がRCI(中期)を上抜いた時
RCI(中期)がRCI(長期)を上抜いた時かつ、RCI(長期)がゼロラインより下にある時※
RCI(短期)がRCI(長期)を上抜いた時かつ、RCI(長期)がゼロラインより下にある時
※ノイズを除去するため
<下落示唆>
RCI(短期)がRCI(中期)を下抜いた時
RCI(中期)がRCI(長期)を下抜いた時かつ、RCI(長期)がゼロラインより上にある時
RCI(短期)がRCI(長期)を下抜いた時かつ、RCI(長期)がゼロラインより上にある時
<シグナル感度: Advanced>
Advancedの場合は、RCIがアッパーバンドより上にある状態で上記の条件が満たされるか、ロワーバンドより下にある状態で上記条件が満たされた場合にのみシグナルが表示されます。
Advancedはよりトレンドの転換や大きな波を狙うのに適したものであるのに対し、Standardはより細かい動きを狙うためのシグナルとなるように設計しています。
この辺りの好みはトレードスタイルや狙いに応じて異なるため、トレーダーが各自選択できるように汎用的な作りとなっているのが特徴です。
ストラテジーシグナルが現れたらトレンド転換の可能性に備え、プライスアクションを見ながらトレードタイミングの判断を行います。
以下の二つのチャートでStandardとAdvancedモードで発せられるシグナルの違いが確認できます。
サンプルチャート(Standard モード)
中期RCI(青)と長期RCI(マゼンタ)の交差
サンプルチャート(Advanced モード)
中期RCI(青)と長期RCI(マゼンタ)の交差
AdvancedモードではRCIが最大限伸びたところからの交差を捉えているため、より大きな波を捉えられる一方で、Standardモードではより細かい波を捉えられることが確認できます。
3.ダイバージェンス自動描画機能
以下のロジックに基づきダイバージェンスを自動描画します。(初期表示:非表示)
下降示唆:2つの連続する高値(*)が切り上げられているが、 それぞれの高値に対応するRCIの値は切り下げている場合
上昇示唆:2つの連続する安値(*)が切り下がっているが、 それぞれの安値に対応するRCIは切り上がっている場合
*高値(安値)は、左右n本(**)ずつのローソク足の高値(安値)より高い(低い)高値(安値)をピボットハイ・ローとして算出しています。
** nはユーザ設定値です。
サンプルチャート
高値PL1はPL1の安値より左側にn個のより低い安値、右側にn個のより低い安値があった場合に安値として認識されます。
上記の例では安値がPL1>PL2と切り下がっていますが、対応するRCIの値はvalue1

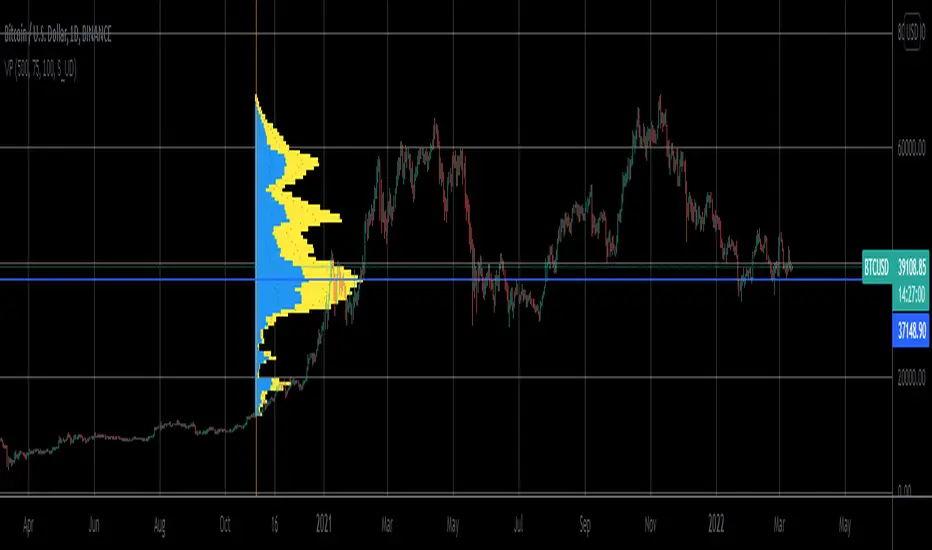
Realtime 5D Profile [LucF]█ OVERVIEW
This indicator displays a realtime profile that can be configured to visualize five dimensions: volume, price, time, activity and age. For each price level in a bar or timeframe, you can display total or delta volume or ticks. The tick count measures activity on a level. The thickness of each level's line indicates its age, which helps you identify the most recent levels.
█ WARNING
The indicator only works in real time. Contrary to TradingView's line of volume profile indicators , it does not show anything on historical bars or closed markets, and it cannot display volume information if none exists for the data feed the chart is using. A realtime indicator such as this one only displays information accumulated while it is running on a chart. The information it calculates cannot be saved on charts, nor can it be recalculated from historical bars. If you refresh the chart, or the script must re-execute for some reason, as when you change inputs, the accumulated information will be lost.
Because "Realtime 5D Profile" requires time to accumulate information on the chart, it will be most useful to traders working on small timeframes who trade only one instrument and do not frequently change their chart's symbol or timeframe. Traders working on higher timeframes or constantly changing charts will be better served by TradingView's volume profiles. Before using this indicator, please see the "Limitations" section further down for other important information.
█ HOW TO USE IT
Load the indicator on an active chart (see here if you don't know how).
The default configuration displays:
• A double-sided volume profile showing at what price levels activity has occurred.
• The left side shows "down" volume, the right side shows "up" volume.
• The value corresponding to each level is displayed.
• The width of lines reflects their relative value.
• The thickness of lines reflects their age. Four thicknesses are used, with the thicker lines being the most recent.
• The total value of down/up values for the profile appears at the top.
To understand how to use profiles in your trading, please research the subject. Searches on "volume profile" or "market profile" will yield many useful results. I provide you with tools — I do not teach trading. To understand more about this indicator, read on. If you choose not to do so, please don't ask me to answer questions that are already answered here, nor to make videos; I don't.
█ CONCEPTS
Delta calculations
Volume is slotted in up or down slots depending on whether the price of each new chart update is higher or lower than the previous update's price. When price does not move between chart updates, the last known direction is used. In a perfect world, Pine scripts would have access to bid and ask levels, as this would allow us to know for sure if market orders are being filled on upticks (at the ask) or downticks (at the bid). Comparing the price of successive chart updates provides the most precise way to calculate volume delta on TradingView, but it is still a compromise. Order books are in constant movement; in some cases, order cancellations can cause sudden movements of both the bid and ask levels such that the next chart update can occur on an uptick at a lower price than the previous one (or vice versa). While this update's volume should be slotted in the up slot because a buy market order was filled, it will erroneously be slotted in the down slot because the price of the chart's update is lower than that of the previous one. Luckily, these conditions are relatively rare, so they should not adversely affect calculations.
Levels
A profile is a tool that displays information organized by price levels. You can select the maximum quantity of levels this indicator displays by using the script's "Levels" input. If the profile's height is small enough for level increments to be less than the symbol's tick size, a smaller quantity of levels is used until the profile's height grows sufficiently to allow your specified quantity of levels to be displayed. The exact position of levels is not tethered to the symbol's tick increments. Activity for one level is that which happens on either side of the level, halfway between its higher or lower levels. The lowest/highest levels in the profile thus appear higher/lower than the profile's low/high limits, which are determined by the lowest/highest points reached by price during the profile's life.
Level Values and Length
The profile's vertical structure is dynamic. As the profile's height changes with the price range, it is rebalanced and the price points of its levels may be recalculated. When this happens, past updates will be redistributed among the new profile's levels, and the level values may thus change. The new levels where updates are slotted will of course always be near past ones, but keep this fluidity in mind when watching level values evolve.
The profile's horizontal structure is also dynamic. The maximum length of level lines is controlled by the "Maximum line length" input value. This maximum length is always used for the largest level value in the profile, and the length of other levels is determined by their value relative to that maximum.
Updates vs Ticks
Strictly speaking, a tick is the record of a transaction between two parties. On TradingView, these are detected on seconds charts. On other charts, ticks are aggregated to form a chart update . I use the broader "update" term when it names both events. Note that, confusingly, tick is also used to name an instrument's minimal price increment.
Volume Quality
If you use volume, it's important to understand its nature and quality, as it varies with sectors and instruments. My Volume X-ray indicator is one way you can appraise the quality of an instrument's intraday volume.
█ FEATURES
Double-Sided Profiles
When you choose one of the first two configuration selections in the "Configuration" field's dropdown menu, you are asking the indicator to display a double-sided profile, i.e., where the down values appear on the left and the up ones on the right. In this mode, the formatting options in the top section of inputs apply to both sides of the profile.
Single-Sided Profiles
The six other selections down the "Configuration" field's dropdown menu select single-sided profiles, where one side aggregates the up/down values for either volume or ticks. In this mode, the formatting options in the top section of inputs apply to the left profile. The ones in the following "Right format" section apply to the right profile.
Calculation Mode
The "Calculation" input field allows the selection of one of two modes which applies to single-sided profiles only. Values can represent the simple total of volume or ticks at each level, or their delta. The mode has no effect when a double-sided profile is used because then, the total is represented by the sum of the left and right sides. Note that when totals are selected, all levels appear in the up color.
Age
The age of each level is always displayed as one of four line thicknesses. Thicker lines are used for the youngest levels. The age of levels is determined by averaging the times of the updates composing that level. When viewing double-sided profiles, the age of each side is calculated independently, which entails you can have a down level on the left side of the profile appear thinner than its corresponding up side level line on the right side because the updates composing the up side are more recent. When calculating the age of single-sided profiles, the age of the up/down values aggregated to calculate the side are averaged. Since they may be different, the averaged level ages will not be as responsive as when using a double-sided profile configuration, where the age of levels on each side is calculated independently and follows price action more closely. Moreover, when displaying two single-sided profiles (volume on one side and ticks on the other), the age of both sides will match because they are calculated from the same realtime updates.
Profile Resets
The profile can reset on timeframes or trend changes. The usual timeframe selections are available, including the chart's, in which case the profile will reset on each new chart bar. One of two trend detection logics can be used: Supertrend or the one used by LazyBear in his Weis Wave indicator . Settings for the trend logics are in the bottommost section of the inputs, where you can also control the display of trend changes and states. Note that the "Timeframe" field's setting also applies to the trend detection mechanism. Whatever the timeframe used for trend detection, its logic will not repaint.
Format
Formatting a profile for charts is often a challenge for traders, and this one is no exception. Varying zoom factors on your chart and the frequency of profile resets will require different profile formats. You can achieve a reasonable variety of effects by playing with the following input fields:
• "Resets on" controls how frequently new profiles are drawn. Spacing out profiles between bars can help make them more usable.
• "Levels" determines the maximum quantity of levels displayed.
• "Offset" allows you to shift the profile horizontally.
• "Profile size" affects the global size of the profile.
• Another "Size" field provides control over the size of the totals displayed above the profile.
• "Maximum line length" controls how far away from the center of the bar the lines will stretch left and right.
Colors
The color and brightness of levels and totals always allows you to determine the winning side between up and down values. On double-sided profiles, each side is always of one color, since the left side is down values and the right side, up values. However, the losing side is colored with half its brightness, so the emphasis is put on the winning side. When there is no winner, the toned-down version of each color is used for both sides. Single-sided profiles use the up and down colors in full brightness on the same side. Which one is used reflects the winning side.
Candles
The indicator can color candle bodies and borders independently. If you choose to do so, you may want to disable the chart's bars by using the eye icon near the symbol's name.
Tooltips
A tooltip showing the value of each level is available. If they do not appear when hovering over levels, select the indicator by clicking on its chart name. This should get the tooltips working.
Data Window
As usual, I provide key values in the Data Window, so you can track them. If you compare total realtime volumes for the profile and the built-in "Volume" indicator, you may see variations at some points. They are due to the different mechanisms running each program. In my experience, the values from the built-in don't always update as often as those of the profile, but they eventually catch up.
█ LIMITATIONS
• The levels do not appear exactly at the position they are calculated. They are positioned slightly lower than their actual price levels.
• Drawing a 20-level double-sided profile with totals requires 42 labels. The script will only display the last 500 labels,
so the number of levels you choose affects how many past profiles will remain visible.
• The script is quite taxing, which will sometimes make the chart's tab less responsive.
• When you first load the indicator on a chart, it will begin calculating from that moment; it will not take into account prior chart activity.
• If you let the script run long enough when using profile reset criteria that make profiles last for a long time, the script will eventually run out of memory,
as it will be tracking unmanageable amounts of chart updates. I don't know the exact quantity of updates that will cause this,
but the script can handle upwards of 60K updates per profile, which should last 1D except on the most active markets. You can follow the number of updates in the Data Window.
• The indicator's nature makes it more useful at very small timeframes, typically in the sub 15min realm.
• The Weis Wave trend detection used here has nothing to do with how David Weis detects trend changes.
LazyBear's version was a port of a port, so we are a few generations removed from the Weis technique, which uses reversals by a price unit.
I believe the version used here is useful nonetheless because it complements Supertrend rather well.
█ NOTES
The aggregated view that volume and tick profiles calculate for traders is a good example of one of the most useful things software can do for traders: look at things from a methodical, mathematical perspective, and present results in a meaningful way. Profiles are powerful because, if the volume data they use is of good enough quality, they tell us what levels are important for traders, regardless of the nature or rationality of the methods traders have used to determine those levels. Profiles don't care whether traders use the news, fundamentals, Fib numbers, pivots, or the phases of the moon to find "their" levels. They don't attempt to forecast or explain markets. They show us real stuff containing zero uncertainty, i.e., what HAS happened. I like this.
The indicator's "VPAA" chart name represents four of the five dimensions the indicator displays: volume, price, activity and age. The time dimension is implied by the fact it's a profile — and I couldn't find a proper place for a "T" in there )
I have not included alerts in the script. I may do so in the future.
For the moment, I have no plans to write a profile indicator that works on historical bars. TradingView's volume profiles already do that, and they run much faster than Pine versions could, so I don't see the point in spending efforts on a poor ersatz.
For Pine Coders
• The script uses labels that draw varying quantities of characters to break the limitation constraining other Pine plots/lines to bar boundaries.
• The code's structure was optimized for performance. When it was feasible, global arrays, "input" and other variables were used from functions,
sacrificing function readability and portability for speed. Code was also repeated in some places, to avoid the overhead of frequent function calls in high-traffic areas.
• I wrote my script using the revised recommendations in the Style Guide from the Pine v5 User Manual.
█ THANKS
• To Duyck for his function that sorts an array while keeping it in synch with another array.
The `sortTwoArrays()` function in my script is derived from the Pine Wizard 's code.
• To the one and only Maestro, RicardoSantos , the creative volcano who worked hard to write a function to produce fixed-width, figure space-padded numeric values.
A change in design made the function unnecessary in this script, but I am grateful to you nonetheless.
• To midtownskr8guy , another Pine Wizard who is also a wizard with colors. I use the colors from his Pine Color Magic and Chart Theme Simulator constantly.
• Finally, thanks to users of my earlier "Delta Volume" scripts. Comments and discussions with them encouraged me to persist in figuring out how to achieve what this indicator does.

Jerry Romine Momentum Dream With Risk ManagementThe Momentum Dream Indicator with Risk Management is really two powerful indicators combined in one.
The Momentum Dream Indicator is a volatility and momentum indicator that measures the relationship between the Bollinger Bands and Keltner Channels to help identify consolidations and signal potential breakouts.
MOMENTUM DREAM INDICATOR:
SIGNALS AND ZONES:
Green Arrow = Post Squeeze Buy Triggered = GREEN ⇧ shows squeeze out on upward momentum (often a good time to buy)
Orange Arrow = Post Squeeze Sell Alert = ORANGE ⇩ shows squeeze out on downward momentum (often a good time to sell or NOT buy)
Green Dot on Chart - Day one of the buy zone
Green Shading - Buy Zone
Pink Dot on Chart - Day one of warning zone
Red Shading - Warning zone. Often a good time not to buy or to consider selling.
LABELS (Color Indicates Direction):
Momo Up / Down = Current momentum direction.
Squeeze = Squeeze is on and squeeze line dots are red.
Dots = number of day or bars the squeeze has been in red(on)
Squeeze Fired = Green or Orange arrow shows squeeze fired direction.
Stacked = Fibonacci 8, 21, 34, 55, 89 EMA are stacked up or down
SQUEEZE LINE COLOR DEFINITIONS:
Dark Red = Extra Squeeze (In & Out)
Red = Original Squeeze (In & Out)
Pink = Pre-Squeeze (In)
Yellow = Pre-Squeeze (Out)
Green = Bollinger Bands are officially outside of Keltner Channels
STRATEGY
There are multiple ways the Momentum Dream Indicator can be used.
1. Buy/Sell during the squeeze (generally lower volatility and lower option premiums)
2. Buy/Sell when the squeeze fires to catch the breakout (volume/volatility often increase)
3. Use Buy/Sell Zones with other signals for entering positions
4. Use Momentum to assist with position direction
5. Use fading momentum to tighten stops or close positions.
* The labels only show when certain criteria are met. For example if a squeeze fired the label only shows on that day but the indicator arrow will always show. For this reason the labels on the chart above will vary from day to day and only alert you when needed. :)
RISK MANAGEMENT INDICATOR
Risk management is a vital part of investing and this indicator provides 2 recommended positions sizes. One based on the classic 1-2% risk rule where you never risk more than X% of your account. A second based on position size not exceeding X% of your account.
The Risk Management Indicator does all of the hard math and provides you with a realistic trading plan, position size, and trail stop based on your customizable criteria. If you’ve ever wondered how much of a stock to buy, when to sell and when to take profits this indicator is for you!
Please Use the link below for more information or to purchase.

Footprint
What is it?
The classic Market Footprint chart for realtime bars (; at least the closest I could get it to anyway).
The tool has 3 modes, which display different volume data for the traded prices of each bar: (1) Up/Down Volume Footprint: At-price Up Volume and At-price Down Volume ; (2) Total Volume Footprint: Total volume transacted at each price; and, (3) Delta Volume Footprint: Difference between At-price Up Volume and At-price Down Volume . You can choose which mode you want from Settings. Each at-price value is color-coded based on its strength/weakness.
Maximum at-price volume for a bar can be chosen to be displayed in a separate color. This will serve (and be shown) as the VPOC ( Volume Point of Control). Note: This is not technically precise as VPOC is a slightly different concept. (But should be the same for most candles).
Below the bars (or above, depending on how you configure it), are displayed the following:(1) Net Delta Volume for the bar; (2) Total Volume for the bar; (3) Cumulative Delta Volume for bars plotted up till this point (i.e., from the time the tool started collecting realtime data); (4) Buy Volume for the bar as a percentage of the total volume for the bar; and, (5) Sell Volume for the bar as a percentage of the total volume for the bar. Each value here is color-coded as well.
In addition, a custom candle option has been provided. These are ON by default and displays 'thinner' candles for, arguably, good readability with Footprint in Up/Down Volume Mode. With custom candles, Tradingview's default candles will be rendered redundant and can be disabled. If you wish to switch to Tradingview's candles, it is recommended that you use either hollow candle mode or bar mode to view the footprint properly. (Filled-body candles will hide the values). Note that with the Footprint chart in either "Total Volume" or "Delta Volume" mode, you are better off using Tradingview's hollow candles or bars.
Almost all labels/colors etc. are configurable to suit your aesthetics.
All data are ONLY AVAILABLE FOR REAL-TIME BARS. The longer you keep a chart open with the study enabled, the more data it collects and displays, and the better your analysis can potentially be. Note that the data gets reset every time (a) any of the options is changed, (b) the market is switched, (c) the browser is refreshed, or (d) the script is reloaded
DATA ISN'T STORED. I.e., every time a new symbol is loaded, the previous symbol's data is lost. So if you intend to monitor a symbol closely, you would need to keep it loaded all the time (and without tinkering with any of the Settings in between).
Who is it for?
For ultra short term traders who are used to looking at short term auction orderflow (and price action) to catch buy/sell anomalies and accurate trade entries
For traders looking to get into footprint chart reading and who wish to give it a go and learn before investing in expensive platforms/tools.
For traders (, irrespective of their method of trading,) who wish to understand what is happening under the hood when a certain price action unfolds.
Who is in control, who got trapped, what does liquidity or the lack thereof look like, etc.
Mode 2: Total Volume Footprint. This also shows how Tradingvoew's hollow candles can be used with the tool.
Mode 3: Delta Volume Footprint

Market Trend using First Derivative of MAs + Volatility Based on Smooth First Derivative Indicator by tbiktag
Volatility also from another public TV script, forgot which one though, sorry if this is yours and I haven't credited your work, let me know if it is and I'll reference it properly.
About this indicator:
Estimates whether market is trending up, down or sideways by adding the slope (first derivatives) of a fast & slow MA. Uptrend = Green, Downtrend = Red, Sideways = Yellow
Uses a minimum slope percentile to determine threshold for uptrend, downtrend & sideways. Definitely adjust this when changing timeframes, for BTCUSD at 1 hour timeframe a value of 25 is decent
Also has a measure of Volatility if you're into that
Explanation of inputs:
Bandwidth - for derivative function
Fastma - period for fast Moving Average
Slowma - period for slow Moving Average
Derivmalength - smooths out the signal, reducing single contrasting bars, but delays the signal. Use 1 if don't want to use
V length - ema of volatility if you want to smooth it
Min Slope Percentile - slope should exceed this percentile to be classified as uptrend (green) or downtrend (red) anything in this bottom percentile will be considered sideways
Mine Slope Lookback Period - # of bars back to calculate Slope Percentile
Renko chartThis script displays the renko chart of the candlesticks chart
The color of the chart is green (red) if the trend is up (down).
The following settings are available:
Renko parameters:
Style = Box Size Assignment Method: 'ATR', 'Traditional'.
Parameter = ATR Length if `Style` is equal to 'ATR', or Box Size if `style` is equal to 'Traditional'.
Timeframe parameters:
Period = Resolution, e.g. 'm' - minutes, 'D' - daily, 'W' - weekly, 'M' - monthly, or same as chart
Multiplier = Multiplier of resolution, e.g. '60' - 60m if Period is 'm'
Alerts are also provided, to catch these conditions:
trend change = up to down or viceversa
bullish reversal = down to up
bearish reversal = up to down

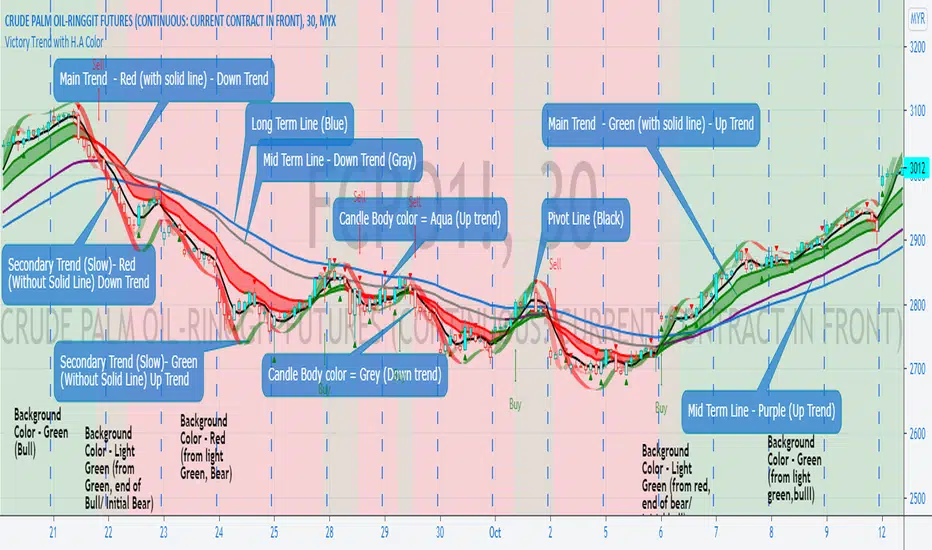
Iceberg Intraday LearningHOW TO USE?
A setup which contains Most Useful 14 indicators, that any Intraday Trader might require.
Below will see one by one-
1) Trend Following Icebergs - (3 Different Indicators to choose from)
--> The trend following indicators optionally.
--> Very simple to understand, yellow indicating sideways, green - going upside, and red - going downside.
--> Trend Indicator - 1st Iceberg is HMA Crossovers
--> Trend Indicator - 2nd Iceberg is SMA (20). It will change its color according to the trend of the market.
--> Trend Indicator - 3rd Iceberg is RSI(14) in EMA, will be plotted at the bottom of the screen.
2) Classic Pivot Points & Floor Pivot Points: - ( 2 Different Indicators to choose from )
--> Classic Pivot Points having 5 Supports & Resistances on the chart.
--> Floor Pivot Points, At the middle, it is pivot point (PP) level and multiple support and resistance levels
--> Floor Pivot Points is a very known indicator that indicates whether that helps in-stock selection.
--> This is a very crucial indicator as it shows the Floor Pivot Points levels for the next day.
--> One can make a learn by looking at next day's Floor Pivot Points that whether the stock is going to be trendy/sideways the next day.
3) Support/Resistance
--> This indicator is used for finding support and resistance levels on charts.
--> Helps in getting pullbacks and exit levels
--> Lines will change color automatically if any candle closes above the support/resistance line. It will change it's to green.
--> Similarly, it will change its color to red if the price is below the support
4) Highs/lows, SuperTrend Up Down ( 2 Different indicators to use )
--> Plots Highs / Lows in the selected time frame.
--> Added SuperTrend indicator with length 10 with source HL/2 and multiplier to be 2.
5) Dynamic ATR - Average True Range (14 Days)
--> It plots 2 important levels at the starting of the day.
--> 2 bands are plotted in the morning when the market opens, resembling strong support/resistance zones.
6) First Candle
--> This will highlight the first candle that is formed of the selected time interval.
7) Bollinger Band
--> Bollinger band is also added for better catching the momentum as seen on chart.
--> The Upper and Lower Bands are used as a way to measure volatility by watching the relationship between the Bands and price
8) VWAP
--> VWAP is useful for learning trend direction in any market conditions.
9) RSI & MACD
--> Plots label indicating the status of RSI and MACD.
This works for Intraday Trades - when the resolution is kept to less than 1 hour ( Say 3 , 5 , 10 , 15 Mins), This works well when the resolution is kept to 1 Day - Good for Swing Trades spanning over a few days, This works well when the resolution is kept to 1 Day or Week - Good for Investments.
Trend Indicator - 3rd Iceberg Is a repainted based on the hybrid RSI Logic
Stop Loss - That should be done by following ones risk appetite , Ideally the open/close of the previous candle should be the stop loss for the buy/sell but everyone has their own Risk Management Strategies based on the capital deployed.
If you like it and find it useful or if you find a defect or bug , Please let us know in the comments .. that would encouraging !! for us to develop it further
Coded for learning INDIAN Markets.
CAUTION:: There could be scenarios when the breakout/breakdown candle is rejected , especially when it is long one
so it is always recommended to have a confirmation candle that open-closes above the breakout candle / open-closes below the breakdown candle.
Disclaimer: No Investment Advice Provided , You should always understand that P AST PERFORMANCE IS NOT NECESSARILY INDICATIVE OF FUTURE RESULTS.
Inspiring to learn the Pine making market learnings easier.
Thanks & Regards,
Iceberg Intraday Learning.

[ADOL_]ARVIS 3ENG) This is version 3 of ARVIS BOT. ARVIS 3
Since it is a new version with a completely different identity from Trend Break, we do not use the name Trend Break.
It is a version made lighter in the existing version and newly created logic.
Existing ARVIS users can use versions 1, 2, 3 and 3R auxiliary tools to be added without additional rights.
Optional use is possible.
principle)
Features of the new core logic:
It was created considering the relative strength RSI and the ICHIMOKU moving average.
Identify the trend strength to generate a long and short reversal signal at the reversal of the trend.
By using HTF signal, it is possible to bring the signal of the upper time to the smaller time.
By using HTF, the candle splits and the standard maintains the flow of time.
A method was used to reduce the whipsaw of frequent signal appearances.
option)
A volatility warning notification has been included. A function that alerts you before volatility increases.
It is indicated in the form of ■ at the bottom of the chart.
You can optionally set the signal range.
Dynamic Fibonacci moving along the candlestick was applied. 0.5 is used as a criterion for determining a large trend.
By combining the RSI and the moving average, you can apply a background that utilizes the RSI as a sensitivity.
By combining RSI and Stochastic, the overbought/oversold section was output as the background.
You can output overbought/oversold at the desired time as a background.
Up/down divergence included as background.
Black is downward divergence and white is upward divergence.
In the lower right corner, an indicator for the probability of a long is added by combining the multiple moving averages and the figures analyzed for the convergence trend.
50% is used as a reference point for long/short conversion, 10~20% is considered oversold section, and 80~90% is considered overbought section.
It can be used as a reference point for counter-trend trading. Probability indicators allow you to increase your judgment with visualized numbers.
principle example)
time frame)
Recommended time frame: 15-minute peaks >> 1-hour peaks > 1.3-minute peaks = 4 hour peaks = daily
alarm)
Various alert functions are available. based on the alert signal
When trading, various signals help to set specific conditions.
- HTF Long Short , Alert
- Volatility warning alert
- Basic long and short alerts
- Up/down divergence alert
trading method)
1. Utilize SIGNAL1 L,S signals. It is a similar approach to the existing manual bot mode.
2.SIGNAL2's , signals can bring high-time signals to buy and sell. This is a similar approach to the existing autobot mode.
If you bring a high time signal to a small time, you can refine the hit point, so in this case, use SIGNAL2 of 15 minutes or longer.
SIGNAL2 15-minute view at 3-minute peak, SIGNAL 1 hour view at 15-minute peak, and SIGNAL 4 hour view at 1-hour peak are recommended values.
3-1. Entry criteria/stop loss criteria (when trading hands and bots)
- entry criteria; Follow the signal.
- Stop loss criteria;
Use fixed stop loss: Set 1% fixed stop loss section from signal generation. (% is set individually)
Use Candle Stop Loss: Set a stop loss when the low or high point of the signal generating bar collapses.
Use flow stop loss: Set the stop loss considering the flow of the wave.
3-2. Entry criteria/stop loss criteria (in case of signal-based bot trading)
- It is not recommended to use more than 3x magnification. The above entry requires manual intervention and risk management.
It switches every time the opposite signal appears after entering without setting the stop loss separately.
Example of using the 15-minute HTF signal in the 3-minute scale
4. Note
You are solely responsible for any trading decisions you make.
ARVIS 3R indicator will be updated. Required for use of ARVIS 3
This is an additional feature. It is created as an indicator at the bottom, not as a candle chart.
5. How to use
It is set to be available only to invited users. When invited,
Tap Add Indicator to Favorites at the bottom of the indicator.
If you click the indicator at the top of the chart screen and look at the left tab, there is a Favorites tab.
Add an indicator by clicking the indicator name in the Favorites tab.
KOR) ARVIS BOT의 3버전입니다. ARVIS 3
Trend Break와 정체성을 완전히 달리한 신버전이므로
더이상 Trend Break 의 명칭을 쓰지 않습니다.
기존버전을 경량화하고 로직을 새롭게 만든 버전입니다.
기존의 ARVIS 이용자는 추가 권한 없이 1,2,3버전과 추가될 3R보조도구의
선택 활용이 가능합니다.
원리)
새로운 핵심적인 로직의 기능 :
상대강도인 RSI와 ICHIMOKU 이평선을 고려하여 만들어졌습니다.
추세강도를 파악해 추세의 전환자리에서 롱과 숏의 전환 신호를 발생시키도록 합니다.
HTF신호를 이용하여 상위 시간의 신호를 작은 시간대로 가져올 수 있습니다.
HTF를 활용함으로써 캔들은 쪼개고 기준은 상위 시간의 흐름을 유지해
잦은 신호출현의 휩쏘를 줄이는 방법을 사용하였습니다.
옵션)
변동성 경고 알림이 포함되었습니다. 변동성이 커지기 전에 미리 알려주는 기능으로
차트하단에 ■ 형태로 표기됩니다.
시그널의 범위를 옵션으로 설정할 수 있습니다.
캔들을 따라 움직이는 동적 피보나치가 적용되었습니다. 0.5를 큰 추세 판단 기준으로 활용합니다.
RSI와 이평선을 결합하여 RSI를 민감도로 활용한 배경을 적용할 수 있습니다.
RSI와 스토캐스틱을 결합하여 과매수/과매도구간을 배경으로 출력하였습니다.
원하는 시간의 과매수/과매도를 배경으로 출력할 수 있습니다.
상승/하락 다이버전스가 배경으로 포함되었습니다.
검은색은 하락다이버전스, 흰색은 상승다이버전스입니다.
우측하단에 다중이평선과 수렴추세를 분석한 수치를 종합하여 롱의 확률에 대한 표시기가 추가되었습니다.
50%는 롱/숏의 전환 기준점으로 활용하며, 10~20%는 과매도 구간, 80~90%는 과매수 구간으로 간주하여
역추세 매매의 기준점으로 활용할 수 있습니다. 확률 표시기를 통해 가시화된 수치로 판단을 높일 수 있습니다.
원리 예시)
타임프레임)
추천타임프레임 : 15분봉 >> 1시간봉 > 1,3분봉 = 4시간봉 = 일봉
알람)
다양한 얼러트 기능을 사용할 수 있습니다. 얼러트 신호를 기반으로
매매시 다양한 신호는 구체적 조건 설정에 도움이 됩니다.
- HTF 롱숏🥵,🥶 얼러트
- 변동성 경고 얼러트
- 기본 롱,숏 얼러트
- 상승/하락 다이버전스 얼러트
매매방법)
1. SIGNAL1 L,S 신호를 활용합니다. 기존의 수동봇 모드와 비슷한 접근입니다.
2.SIGNAL2의 🥵,🥶 신호는 높은 시간의 신호를 가져와 매매할 수 있습니다. 기존의 자동봇 모드와 비슷한 접근입니다.
높은 시간대의 신호를 작은시간으로 가져오면 타점을 정교화 할 수 있으므로, 이와같은 경우 15분 이상의 SIGNAL2를 활용합니다.
3분봉에서 SIGNAL2 15분 보기, 15분봉에서 SIGNAL 1시간 보기, 1시간봉에서 SIGNAL 4시간 보기가 추천값입니다.
3-1. 진입기준/손절기준(손,봇 매매시)
- 진입기준; 시그널을 따릅니다.
- 손절기준;
고정손절가 이용 : 시그널 발생으로부터 1% 고정 손절가 구간을 설정합니다.(%는 개별로 설정)
캔들손절가 이용 : 시그널 발생봉의 저점이나 고점이 무너지면 손절을 설정합니다.
흐름손절가 이용 : 파동의 흐름을 고려하여 손절을 설정합니다.
3-2. 진입기준/손절기준(신호기반 봇 매매시)
- 3배율 이상을 권장하지 않습니다. 이상의 진입은 수동개입으로 리스크관리가 필요합니다.
손절가를 따로 설정하지 않고 진입후 반대신호가 뜰때마다 스위칭을 합니다.
3분봉에서 15분HTF 신호사용의 예시
4. 참고
귀하가 내리는 모든 거래 결정은 전적으로 귀하의 책임입니다.
ARVIS 3R 지표가 업데이트 예정입니다. ARVIS 3의 활용에 필요한
부가적인 기능입니다. 캔들차트가 아닌 하단의 지표로 생성됩니다.
5. 사용방법
초대된 사용자만 사용할 수 있도록 설정이 되어있습니다. 초대를 받을 경우,
지표 하단의 즐겨찾기에 인디케이터 넣기를 누릅니다.
차트화면 상단에 지표를 눌러서 왼쪽탭에 보면 즐겨찾기 탭이 있습니다.
즐겨찾기 탭에서 지표이름을 눌러서 지표를 추가합니다.

Using `varip` variables [PineCoders]█ OVERVIEW
The new varip keyword in Pine can be used to declare variables that escape the rollback process, which is explained in the Pine User Manual's page on the execution model . This publication explains how Pine coders can use variables declared with varip to implement logic that was impossible to code in Pine before, such as timing events during the realtime bar, or keeping track of sequences of events that occur during successive realtime updates. We present code that allows you to calculate for how much time a given condition is true during a realtime bar, and show how this can be used to generate alerts.
█ WARNINGS
1. varip is an advanced feature which should only be used by coders already familiar with Pine's execution model and bar states .
2. Because varip only affects the behavior of your code in the realtime bar, it follows that backtest results on strategies built using logic based on varip will be meaningless,
as varip behavior cannot be simulated on historical bars. This also entails that plots on historical bars will not be able to reproduce the script's behavior in realtime.
3. Authors publishing scripts that behave differently in realtime and on historical bars should imperatively explain this to traders.
█ CONCEPTS
Escaping the rollback process
Whereas scripts only execute once at the close of historical bars, when a script is running in realtime, it executes every time the chart's feed detects a price or volume update. At every realtime update, Pine's runtime normally resets the values of a script's variables to their last committed value, i.e., the value they held when the previous bar closed. This is generally handy, as each realtime script execution starts from a known state, which simplifies script logic.
Sometimes, however, script logic requires code to be able to save states between different executions in the realtime bar. Declaring variables with varip now makes that possible. The "ip" in varip stands for "intrabar persist".
Let's look at the following code, which does not use varip :
//@version=4
study("")
int updateNo = na
if barstate.isnew
updateNo := 1
else
updateNo := updateNo + 1
plot(updateNo, style = plot.style_circles)
On historical bars, barstate.isnew is always true, so the plot shows a value of "1". On realtime bars, barstate.isnew is only true when the script first executes on the bar's opening. The plot will then briefly display "1" until subsequent executions occur. On the next executions during the realtime bar, the second branch of the if statement is executed because barstate.isnew is no longer true. Since `updateNo` is initialized to `na` at each execution, the `updateNo + 1` expression yields `na`, so nothing is plotted on further realtime executions of the script.
If we now use varip to declare the `updateNo` variable, the script behaves very differently:
//@version=4
study("")
varip int updateNo = na
if barstate.isnew
updateNo := 1
else
updateNo := updateNo + 1
plot(updateNo, style = plot.style_circles)
The difference now is that `updateNo` tracks the number of realtime updates that occur on each realtime bar. This can happen because the varip declaration allows the value of `updateNo` to be preserved between realtime updates; it is no longer rolled back at each realtime execution of the script. The test on barstate.isnew allows us to reset the update count when a new realtime bar comes in.
█ OUR SCRIPT
Let's move on to our script. It has three parts:
— Part 1 demonstrates how to generate alerts on timed conditions.
— Part 2 calculates the average of realtime update prices using a varip array.
— Part 3 presents a function to calculate the up/down/neutral volume by looking at price and volume variations between realtime bar updates.
Something we could not do in Pine before varip was to time the duration for which a condition is continuously true in the realtime bar. This was not possible because we could not save the beginning time of the first occurrence of the true condition.
One use case for this is a strategy where the system modeler wants to exit before the end of the realtime bar, but only if the exit condition occurs for a specific amount of time. One can thus design a strategy running on a 1H timeframe but able to exit if the exit condition persists for 15 minutes, for example. REMINDER: Using such logic in strategies will make backtesting their complete logic impossible, and backtest results useless, as historical behavior will not match the strategy's behavior in realtime, just as using `calc_on_every_tick = true` will do. Using `calc_on_every_tick = true` is necessary, by the way, when using varip in a strategy, as you want the strategy to run like a study in realtime, i.e., executing on each price or volume update.
Our script presents an `f_secondsSince(_cond, _resetCond)` function to calculate the time for which a condition is continuously true during, or even across multiple realtime bars. It only works in realtime. The abundant comments in the script hopefully provide enough information to understand the details of what it's doing. If you have questions, feel free to ask in the Comments section.
Features
The script's inputs allow you to:
• Specify the number of seconds the tested conditions must last before an alert is triggered (the default is 20 seconds).
• Determine if you want the duration to reset on new realtime bars.
• Require the direction of alerts (up or down) to alternate, which minimizes the number of alerts the script generates.
The inputs showcase the new `tooltip` parameter, which allows additional information to be displayed for each input by hovering over the "i" icon next to it.
The script only displays useful information on realtime bars. This information includes:
• The MA against which the current price is compared to determine the bull or bear conditions.
• A dash which prints on the chart when the bull or bear condition is true.
• An up or down triangle that prints when an alert is generated. The triangle will only appear on the update where the alert is triggered,
and unless that happens to be on the last execution of the realtime bar, it will not persist on the chart.
• The log of all triggered alerts to the right of the realtime bar.
• A gray square on top of the elapsed realtime bars where one or more alerts were generated. The square's tooltip displays the alert log for that bar.
• A yellow dot corresponding to the average price of all realtime bar updates, which is calculated using a varip array in "Part 2" of the script.
• Various key values in the Data Window for each parts of the script.
Note that the directional volume information calculated in Part 3 of the script is not plotted on the chart—only in the Data Window.
Using the script
You can try running the script on an open market with a 30sec timeframe. Because the default settings reset the duration on new realtime bars and require a 20 second delay, a reasonable amount of alerts will trigger.
Creating an alert on the script
You can create a script alert on the script. Keep in mind that when you create an alert from this script, the duration calculated by the instance of the script running the alert will not necessarily match that of the instance running on your chart, as both started their calculations at different times. Note that we use alert.freq_all in our alert() calls, so that alerts will trigger on all instances where the associated condition is met. If your alert is being paused because it reaches the maximum of 15 triggers in 3 minutes, you can configure the script's inputs so that up/down alerts must alternate. Also keep in mind that alerts run a distinct instance of your script on different servers, so discrepancies between the behavior of scripts running on charts and alerts can occur, especially if they trigger very often.
Challenges
Events detected in realtime using variables declared with varip can be transient and not leave visible traces at the close of the realtime bar, as is the case with our script, which can trigger multiple alerts during the same realtime bar, when the script's inputs allow for this. In such cases, elapsed realtime bars will be of no use in detecting past realtime bar events unless dedicated code is used to save traces of events, as we do with our alert log in this script, which we display as a tooltip on elapsed realtime bars.
█ NOTES
Realtime updates
We have no control over when realtime updates occur. A realtime bar can open, and then no realtime updates can occur until the open of the next realtime bar. The time between updates can vary considerably.
Past values
There is no mechanism to refer to past values of a varip variable across realtime executions in the same bar. Using the history-referencing operator will, as usual, return the variable's committed value on previous bars. If you want to preserve past values of a varip variable, they must be saved in other variables or in an array .
Resetting variables
Because varip variables not only preserve their values across realtime updates, but also across bars, you will typically need to plan conditions that will at some point reset their values to a known state. Testing on barstate.isnew , as we do, is a good way to achieve that.
Repainting
The fact that a script uses varip does not make it necessarily repainting. A script could conceivably use varip to calculate values saved when the realtime bar closes, and then use confirmed values of those calculations from the previous bar to trigger alerts or display plots, avoiding repaint.
timenow resolution
Although the variable is expressed in milliseconds it has an actual resolution of seconds, so it only increments in multiples of 1000 milliseconds.
Warn script users
When using varip to implement logic that cannot be replicated on historical bars, it's really important to explain this to traders in published script descriptions, even if you publish open-source. Remember that most TradingViewers do not know Pine.
New Pine features used in this script
This script uses three new Pine features:
• varip
• The `tooltip` parameter in input() .
• The new += assignment operator. See these also: -= , *= , /= and %= .
Example scripts
These are other scripts by PineCoders that use varip :
• Tick Delta Volume , by RicadoSantos .
• Tick Chart and Volume Info from Lower Time Frames by LonesomeTheBlue .
Thanks
Thanks to the PineCoders who helped improve this publication—especially to bmistiaen .
Look first. Then leap.

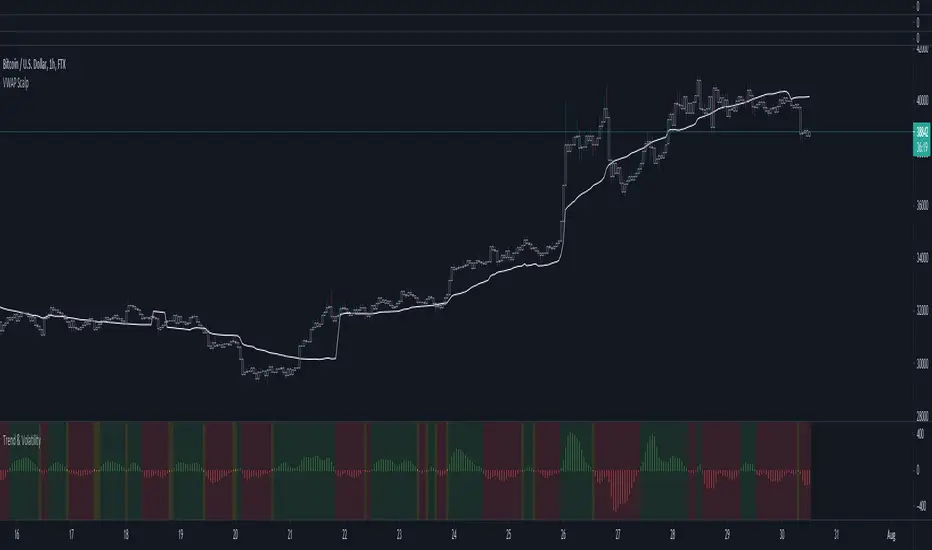
[astropark] Volume AnalyzerDear Followers,
today another awesome Analysis Tool, that you can use for day scalping: Volume Analyzer !
This indicator
works on every market, pair and timeframe
lets you see analysis of a different timeframes using the resolution parameter
has an optional trend colored background (I suggest to disable it if you use a different resolution)
integrates a tape profit strategy based on RSI (you can config it and enable/disable it)
lets you setup alarms on bull/bear signal as well as on TP RSI-based signals
I prefer to use this indicator in my day trading on low timeframes , like 5m - 15m - 1h, as you can have access to a more detailed volume information, but it works on high timeframes too as you can see in examples at the bottom of the description.
I truly think that Volume says a lot about future price action, as stated in my Cumulative Volume Delta (CVD) indicator, which you can find here below:
In this indicator, I'm much more interested in the bullish or bearish effect of volume generated by traders and following price action.
Be sure to understand that at current status this is not a complete automated strategy, but an analysis tool which aims to give you a positive bias, a profitable hedge in your trading journey.
As I always say, all tools are great if you use them correctly: this is not the "Holy Grail", so always use proper money and risk management strategies.
This indicator quite often calls bottoms and tops , most of the times it announces a coming reversals , sometimes it fails too of course.
Check this screenshot to have a clear idea of what I'm talking about:
You are supposed to discard signals of the same type that comes later and at a worse price (related to the trend) or you can use to re-fill your still-open position, using it as a re-entry.
You are supposed to act at first signals and average up/down if price goes against you when a new bear/bull signal appears at a better price.
Here it is another element you must consider: price action can deny a reversal stated by volume analysis .
In these cases, you must apply a stop loss in your trade and reverse your position. Don't average up/down your entry.
The reason in this screenshot below:
As you can see, the local downtrend was broken, as it was a simple pullback, previous bull trend was restored and price went up a lot!
The indicator here detected bears rejecting the run-up as much violently as they could, but that was a pullback, nothing more than that: main bull trend was still intact.
Another important advice: don't be greedy, always remember to take profits ! Avoid turning a winning trade into a losing one, which is a common mistake traders do.
That's why I decided to include an RSI based Take Profit algorithm inside:
when background is colored by green (and you can't see any bull signal), then you are in over bought region: start taking profits on you buy/long position or close it or set a trailing stop or a stop loss in profit!
when background is colored by red (and you can't see any bear signal), then you are in over sold region: start taking profits on you sell/short position or close it or set a trailing stop or a stop loss in profit!
when price is in a big overbought or oversold region, then you can see a "ob" label or a "os" label respectively
if you are in a bullish trend (you can see it from the trend colored green background as last signal was a "bull" one), "ob" becomes a clear "tp" - Take Profit advice
if you are in a bearish trend (you can see it from the trend colored red background as last signal was a "bear" one), "os" becomes a clear "tp" - Take Profit advice
Here some examples how you can use the signals produced by the indicator in order to be a successful trader.
I circled with pink signals you as supposed to take, then with a "$" pink backgrounded region where you are supposed to take profits, I finally put an X on failing signals, where you would theoretically have been stopped-out.
GBPUSD, 15m
ETHUSD, 1h
TSLA, 5m
BTCUSD, 15m
XAGUSD, 1h
EURUSD, 15m
SPX500, 1h
ETHUSD, 1D
ETHBTC, 6h
This is a premium indicator , so send me a private message in order to get access to this script.

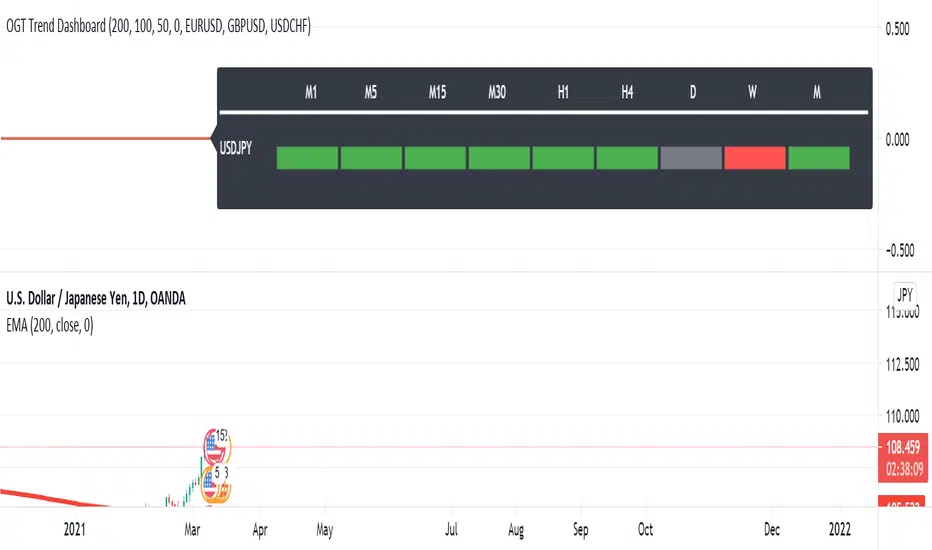
OGT Trend DashboardWhat Is The OGT Trend Dashboard?
The One Glance Trader (OGT) Trend Dashboard is a trend indicator that visualises if a stock, currency pair etc. is trending (up/down) on multiple time frames. The aim of the dashboard is to provide a "one glance" view for a custom list of symbols to show a clear trend bias. A green timeframe signals it is in a up trend, red for a down trend and grey for no clear trend direction. The indicator uses 3 EMAs (fast, medium slow) to define whether a symbol is trending or ranging. The 3 EMAs periods can be defined by the user.
Indicator Settings
- Fast, medium and slow EMA periods
- Symbols (up to 4 can be selected). First symbol will always be the chart the indicator is applied to
- Alerts - select for all symbols you want alerts so (historic alerts for the first symbol will be visually applied on the chart)
- Timeframes ( M1 to Monthly)
Alerts - You can create alerts for any of the 4 pairs when all timeframes selected are trending up (green) or down (red).
How To Use the OGT Trend Dashboard
- Entry Signal For Trends: When all desired timeframes are either trending up/down enter the market in the direction of the trend
- Determine Trend Bias: Use the dashboard to complement existing trend trading systems as added confirmation
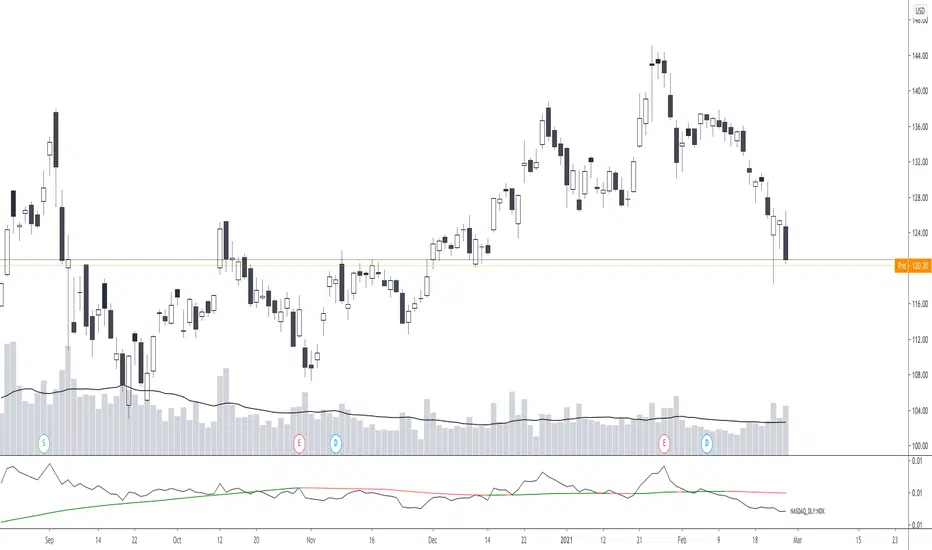
Relative Strength RatioAbout this indicator:
This indicator goes under many different names such as Relative Strength Ratio, Comparative Strength, Relative Strength Comparison (RSC) etc.
It compares the strength of the current asset to another asset of your choice and displays the relative strength of the current asset. (Not RSI)
There are several comparative indicators published already here on TV but I have added some unique features that I think is really useful.
When to use it:
This is useful when you want to compare for example a stock with its sector to find out if the stock is a leadership stock in that sector or main index.
You could also use it to compare the sector to its index etc.
If you want to compare for example a stock to both its index and its sector at the same time I suggest you add 2 instances of this indicator.
In many trading systems you are supposed find the strongest tickers by identifying "layers of strength" like 1. The strongest asset class that money is flowing into (like stocks, commodities, bonds, etc.) 2. Find the strongest sectors. 3. Find the stocks outperforming those sectors. 4. Find some kind of entry signal there.
How it works:
The indicator calculates an "RS line" (Relative Strength) by dividing the current ticker with a ticker of your choice. This creates a ratio or pair similar to how currencies are related to each others like USDGBP (dollar against pound). The RS line is black by default so you might want to change its color if you use a dark theme.
If the RS line is moving up it means your current asset is stronger than the asset you are comparing it with and vice versa.
Use the simple moving average to quickly see long term strength trends.
Features
RS line
Shows the relative strength of the current asset.
SMA
This Simple Moving Average has directional coloring; green when it is angled up and red when it is angled down. You can customise the period in the settings. If you don't want the color change just make both up/down color the same.
Relative market label
This displays the market you are currently comparing with as a label next to the last data point.
Because I tried stocks in 2 different countries I want to know which index I am comparing with and this label saves me from going into the settings to check. I find it to be a life saver!
Please let me know if you find any problems or if you have any ideas for improvement
Bitcoin Bulls and Bears by @dbtrBitcoin 🔥 Bulls & Bears 🔥
v1.0
This free-of-charge BTC market analysis indicator helps you better understand what's going with Bitcoin from a high-level perspective. At a glance, it will give you an immediate understanding of Bitcoin’s historic price channel dating back to 2011, past and current market cycles, as well as current key support levels.
Usage
Use this indicator with any BTCUSD pairs , ideally with a long price history (such as BNC:BLX )
We recommend to use this indicator in log mode, combined with Weekly or Monthly timeframe.
Features
🕵🏻♂️ Historic price channel curve since 2011
🚨 Bull & bear market cycles (dynamic)
🔥 All-time highs (dynamic)
🌟 Weekly support (dynamic, based on 20 SMA )
💪 Long-term support (channel bottom)
🔝 Potential future price targets (dynamic)
❎ Overbought RSI coloring
📏 Log/non-log support
🌚 Dark mode support
Remarks
With exception of the price channel curve, anything in this indicator is calculated dynamically , including bull/bear market cycles (based on a tweaked 20SMA), ATHs, and so on. As a result, historic market cycles may not be 100% accurately reflected and may also differ slightly in between various time-frames (closest result: Monthly). The indicator may even consider periods of heavy ups/downs as their own market cycles, even though they weren’t. Due to its dynamic nature, this indicator can however adapt to the future and helps you quickly identify potential changes in market structure, even if the indicator is no longer updated.
On top of that bullmarket cycles (colored in green) feature an ingrained RSI: the darker the green color, the more the RSI is overbought and close to a correction (darkest color in the chart = 90 Weekly RSI). In comparison with past bull cycles, it helps you easily spot potential reversal zones.
Thanks
Thanks to @quantadelic and @mabonyi which both have worked on the BTC "growth zones" indicator including the price channel, of which I have used parts of the code as well as the actual price channel data.
Follow me
Follow me here on TradingView to be notified as soon as new free and premium indicators and trading strategies are published. Inquire me for any other requests.
Enjoy & happy trading!

Bitcoin Bulls & Bears @dbtr
Bitcoin Bulls & Bears
The "Bitcoin Bulls & Bears" indicator helps you better understand Bitcoin with a high-level view on Bitcoin’s historic price channel, past and current market cycles, as well as current key support levels.
Usage
Use this indicator with any BTCUSD pairs , ideally with a long price history (such as BNC:BLX )
We recommend to use this indicator in log mode, combined with Weekly or Monthly timeframe.
Features
🕵🏻♂️ Historic price channel curve since 2011
🚨 Bull & bear market cycles (dynamic)
🔥 All-time highs (dynamic)
🌟 Weekly support (dynamic, based on 20 SMA)
💪 Long-term support (channel bottom)
🔝 Potential future price targets (dynamic)
📏 Log/non-log support
🌚 Dark mode support
Remarks
Except for the historic price channel curve, all of this indicator is calculated dynamically , including bull/bear market cycles (based on a tweaked 20SMA). Due to this, the historic market cycles may not be 100% accurate and may also differ slightly between time-frames. It may also consider short times of ups/downs to be their own market cycles, even though they weren’t. This dynamic nature allows this indicator to adapt to the future and quickly help you identify changes in market structure.
On top of the that, the bullmarket cycles (green background) feature an ingrained RSI information: the darker the green, the more the RSI is overbought and close to a correction. In combination with past bull cycles, it is easier to spot potential reversal zones.
Thanks
Thanks to @quantadelic and @mabonyi for their pre-work on the price channel information, which I have taken over here

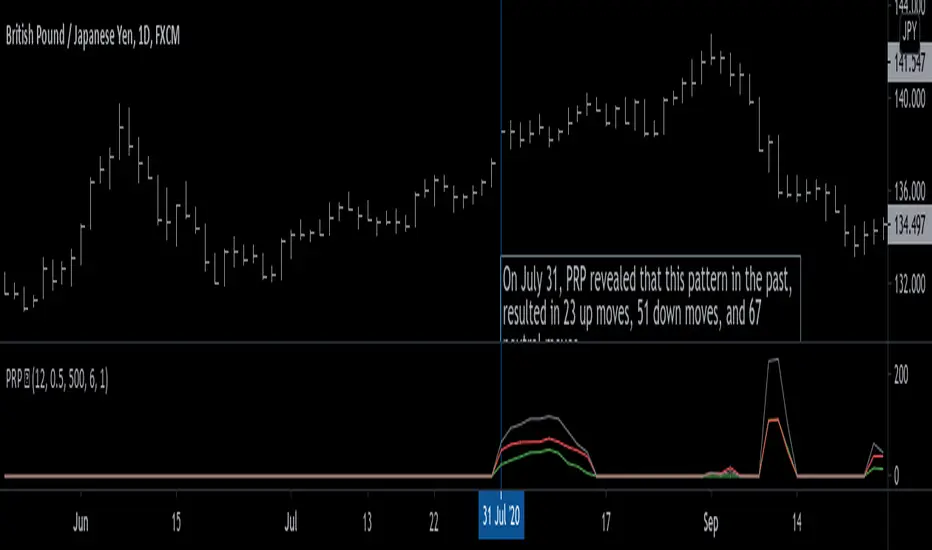
Pattern Recognition Probabilities [racer8]Brief 🌟
Pattern Recognition Probabilities (PRP) is a REALLY smart indicator. It uses the correlation coefficient formula to determine if the current set of bars resembles that of past patterns. It counts the number of times the current pattern has occurred in the past and looks at how it performed historically to determine the probability of an up move, down move, or neutral move.
I'd like to say, I'm proud of this indicator 😆🤙 This is the SMARTEST indicator I have ever made 🧠🧠🧠
Note: PRP doesn't give you actual probabilities, but gives you instead the historical occurrences of up, down, and neutral moves that resulted after the pattern. So you can calculate probabilities based on these valuable statistics. So for example, PRP can tell you this pattern has historically resulted in 55 up moves, 20 down moves, and 60 neutral moves.
Parameters 🌟
You can adjust the Pattern length, Minimum correlation, Statistics lookback, Exit after time, and Atr multiplier parameters.
Pattern length - determines how long the pattern is
Minimum correlation - determines the minimum correlation coefficient needed to pass as a similiar enough pattern.
Statistics lookback - lookback period for gathering all the patterns in the past.
Exit after time - determines when exit occurred (number of periods after pattern) ; is the point that represents the pattern's result.
Atr multiplier - determines minimum atr move needed to qualify whether result was an up/down move or a neutral move. If a particular historical pattern resulted in a move that was less than the min atr, then it is recorded as a neutral move in the statistics.
Thanks for reading! 🙏
Good luck 🍀 Stay safe 😷 Drink lots of water💧
Enjoy! 🥳 and Hit the like button! 👍
Relative Volume at Time█ OVERVIEW
This indicator calculates relative volume, which is the ratio of present volume over an average of past volume.
It offers two calculation modes, both using a time reference as an anchor.
█ CONCEPTS
Calculation modes
The simplest way to calculate relative volume is by using the ratio of a bar's volume over a simple moving average of the last n volume values.
This indicator uses one of two, more subtle ways to calculate both values of the relative volume ratio: current volume:past volume .
The two calculations modes are:
1 — Cumulate from Beginning of TF to Current Bar where:
current volume = the cumulative volume since the beginning of the timeframe unit, and
past volume = the mean of volume during that same relative period of time in the past n timeframe units.
2 — Point-to-Point Bars at Same Offset from Beginning of TF where:
current volume = the volume on a single chart bar, and
past volume = the mean of volume values from that same relative bar in time from the past n timeframe units.
Timeframe units
Timeframe units can be defined in three different ways:
1 — Using Auto-steps, where the timeframe unit automatically adjusts to the timeframe used on the chart:
— A 1 min timeframe unit will be used on 1sec charts,
— 1H will be used for charts at 1min and less,
— 1D will be used for other intraday chart timeframes,
— 1W will be used for 1D charts,
— 1M will be used for charts at less than 1M,
— 1Y will be used for charts at greater or equal than 1M.
2 — As a fixed timeframe that you define.
3 — By time of day (for intraday chart timeframes only), which you also define. If you use non-intraday chart timeframes in this mode, the indicator will switch to Auto-steps.
Relative Relativity
A relative volume value of 1.0 indicates that current volume is equal to the mean of past volume , but how can we determine what constitutes a high relative volume value?
The traditional way is to settle for an arbitrary threshold, with 2.0 often used to indicate that relative volume is worthy of attention.
We wanted to provide traders with a contextual method of calculating threshold values, so in addition to the conventional fixed threshold value,
this indicator includes two methods of calculating a threshold channel on past relative volume values:
1 — Using the standard deviation of relative volume over a fixed lookback.
2 — Using the highs/lows of relative volume over a variable lookback.
Channels calculated on relative volume provide meta-relativity, if you will, as they are relative values of relative volume.
█ FEATURES
Controls in the "Display" section of inputs determine what is visible in the indicator's pane. The next "Settings" section is where you configure the parameters used in the calculations. The "Column Coloring Conditions" section controls the color of the columns, which you will see in three of the five display modes available. Whether columns are plotted or not, the coloring conditions also determine when markers appear, if you have chosen to show the markers in the "Display" section. The presence of markers is what triggers the alerts configured on this indicator. Finally, the "Colors" section of inputs allows you to control the color of the indicator's visual components.
Display
Five display modes are available:
• Current Volume Columns : shows columns of current volume , with past volume displayed as an outlined column.
• Relative Volume Columns : shows relative volume as a column.
• Relative Volume Columns With Average : shows relative volume as a column, with the average of relative volume.
• Directional Relative Volume Average : shows a line calculated using the average of +/- values of relative volume.
The positive value of relative volume is used on up bars; its negative value on down bars.
• Relative Volume Average : shows the average of relative volume.
A Hull moving average is used to calculate the average used in the three last display modes.
You can also control the display of:
• The value or relative volume, when in the first three display modes. Only the last 500 values will be shown.
• Timeframe transitions, shown in the background.
• A reminder of the active timeframe unit, which appears to the right of the indicator's last bar.
• The threshold used, which can be a fixed value or a channel, as determined in the next "Settings" section of inputs.
• Up/Down markers, which appear on transitions of the color of the volume columns (determined by coloring conditions), which in turn control when alerts are triggered.
• Conditions of high volatility.
Settings
Use this section of inputs to change:
• Calculation mode : this is where you select one of this indicator's two calculation modes for current volume and past volume , as explained in the "Concepts" section.
• Past Volume Lookback in TF units : the quantity of timeframe units used in the calculation of past volume .
• Define Timeframes Units Using : the mode used to determine what one timeframe unit is. Note that when using a fixed timeframe, it must be higher than the chart's timeframe.
Also, note that time of day timeframe units only work on intraday chart timeframes.
• Threshold Mode : Five different modes can be selected:
— Fixed Value : You can define the value using the "Fixed Threshold" field below. The default value is 2.0.
— Standard Deviation Channel From Fixed Lookback : This is a channel calculated using the simple moving average of relative volume
(so not the Hull moving average used elsewhere in the indicator), plus/minus the standard deviation multiplied by a user-defined factor.
The lookback used is the value of the "Channel Lookback" field. Its default is 100.
— High/Low Channel From Beginning of TF : in this mode, the High/Low values reset at the beginning of each timeframe unit.
— High/Low Channel From Beginning of Past Volume Lookback : in this mode, the High/Low values start from the farthest point back where we are calculating past volume ,
which is determined by the combination of timeframe units and the "Past Volume Lookback in TF units" value.
— High/Low Channel From Fixed Lookback : In this mode the lookback is fixed. You can define the value using the "Channel Lookback" field. The default value is 100.
• Period of RelVol Moving Average : the period of the Hull moving average used in the "Directional Relative Volume Average" and the "Relative Volume Average".
• High Volatility is defined using fast and slow ATR periods, so this represents the volatility of price.
Volatility is considered to be high when the fast ATR value is greater than its slow value. Volatility can be used as a filter in the column coloring conditions.
Column Coloring Conditions
• Eight different conditions can be turned on or off to determine the color of the volume columns. All "ON" conditions must be met to determine a high/low state of relative volume,
or, in the case of directional relative volume, a bull/bear state.
• A volatility state can also be used to filter the conditions.
• When the coloring conditions and the filter do not allow for a high/low state to be determined, the neutral color is used.
• Transitions of the color of the volume columns determined by coloring conditions are used to plot the up/down markers, which in turn control when alerts are triggered.
Colors
• You can define your own colors for all of the oscillator's plots.
• The default colors will perform well on light or dark chart backgrounds.
Alerts
• An alert can be defined for the script. The alert will trigger whenever an up/down marker appears in the indicator's display.
The particular combination of coloring conditions and the display settings for up/down markers when you create the alert will determine which conditions trigger the alert.
After alerts are created, subsequent changes to the conditions controlling the display of markers will not affect existing alerts.
• By configuring the script's inputs in different ways before you create your alerts, you can create multiple, functionally distinct alerts from this script.
When creating multiple alerts, it is useful to include in the alert's message a reminder of the particular conditions you used for each alert.
• As is usually the case, alerts triggering "Once Per Bar Close" will prevent repainting.
Error messages
Error messages will appear at the end of the chart upon the following conditions:
• When the combination of the timeframe units used and the "Past Volume Lookback in TF units" value create a lookback that is greater than 5000 bars.
The lookback will then be recalculated to a value such that a runtime error does not occur.
• If the chart's timeframe is higher than the timeframe units. This error cannot occur when using Auto-steps to calculate timeframe units.
• If relative volume cannot be calculated, for example, when no volume data is available for the chart's symbol.
• When the threshold of relative volume is configured to be visible but the indicator's scale does not allow it to be visible (in "Current Volume Columns" display mode).
█ NOTES
For traders
The chart shown here uses the following display modes: "Current Volume Columns", "Relative Volume Columns With Average", "Directional Relative Volume Average" and "Relative Volume Average". The last one also shows the threshold channel in standard deviation mode, and the TF Unit reminder to the right, in red.
Volume, like price, is a value with a market-dependent scale. The only valid reference for volume being its past values, any improvement in the way past volume is calculated thus represents a potential opportunity to traders. Relative volume calculated as it is here can help traders extract useful information from markets in many circumstances, markets with cyclical volume such as Forex being one, obvious case. The relative nature of the values calculated by this indicator also make it a natural fit for cross-market and cross-sector analysis, or to identify behavioral changes in the different futures contracts of the same market. Relative volume can also be put to more exotic uses, such as in evaluating changes in the popularity of exchanges.
Relative volume alone has no directional bias. While higher relative volume values always indicate higher trading activity, that activity does not necessarily translate into significant price movement. In a tightly fought battle between buyers and sellers, you could theoretically have very large volume for many bars, with no change whatsoever in bid/ask prices. This of course, is unlikely to happen in reality, and so traders are justified in considering high relative volume values as indicating periods where more attention is required, because imbalances in the strength of buying/selling power during high-volume trading periods can amplify price variations, providing traders with the generally useful gift of volatility.
Be sure to give the "Directional Relative Volume Average" a try. Contrary to the always-positive ratio widely used in this indicator, the "Directional Relative Volume Average" produces a value able to determine a bullish/bearish bias for relative volume.
Note that realtime bars must be complete for the relative volume value to be confirmed. Values calculated on historical or elapsed realtime bars will not recalculate unless historical volume data changes.
Finally, as with all indicators using volume information, keep in mind that some exchanges/brokers supply different feeds for intraday and daily data, and the volume data on both feeds can sometimes vary quite a bit.
For coders
Our script was written using the PineCoders Coding Conventions for Pine .
The description was formatted using the techniques explained in the How We Write and Format Script Descriptions PineCoders publication.
Bits and pieces of code were lifted from the MTF Selection Framework and the MTF Oscillator Framework , also by PineCoders.
█ THANKS
Thanks to dgtrd for suggesting to add the channel using standard deviation.
Thanks to adolgov for helpful suggestions on calculations and visuals.
Look first. Then leap.

Linear Regression ChannelHello Traders,
There are several nice Linear Regression Channel scripts in the Public Library. and I tried to make one with some extra features too. This one can check if the Price breaks the channel and it shows where is was broken. Also it checks the momentum of the channel and shows it's increasing/decreasing/equal in a label, shape of the label also changes. The line colors change according to direction.
using the options, you can;
- Set the Source (Close, HL2 etc)
- Set the Channel length
- Set Deviation
- Change Up/Down Line colors
- Show/hide broken channels
- Change line width
meaning of arrows:
⇑ : Uptrend and moment incresing
⇗ : Uptrend and moment decreasing
⇓ : Downtrend and moment incresing
⇘ : Downtrend and moment decreasing
⇒ : No trend
An example for how color of lines, arrow direction and shape of label change.
Enjoy!

Victory Trend with H.A ColorDescription of Victory Trend With Heikin Ashi Color's items
VT Trend With Heikin Ashi Color indicator is formed by Green & Red Main Trend Band, Secondary Band, 4 days HLC Black color line, Mid Term line (Purple & Gray Color Line and Long Term Blue line. Green up arrow with "Buy" text and Red Down Arrow with "sell" text for alert the potential entry chances.
1) Green color Up Trend Main Trend Band with solid line : form by 2 moving average lines and in green color when fast moving average is above slow moving average line
2) Red Color Down Trend Main Trend Band with solid line form by 2 moving average lines and in red color when fast moving average is below slow moving average line
3) Green Up arrow with "buy" text appear : When red color down Trend Main Trend Band with solid line turn from red color to green color, mean potential buy entry
4) Red down arrow with "Sell" text appear : When green color up Trend Main Trend Band with solid line turn from Green color to red color, mean potential Sell entry
5) Black color line = 4 days HLC line
6) Mid term line = Purple color (when up) and gray color (when down)
7) Long term line = Coastal (Light blue) color
8) Stronger Up trend start = When Mid term line cross up Long term line
9) Stronger down trend start = When Mid term line cross down Long term line
10)Background color which represent the Up/down trend and stronger Up/down trend ,
a) lighten Green = Main trend in uptrend but Main trend's slow moving average line haven't cross up mid term line
b) Green =Main trend in uptrend and Main trend's slow moving average line had cross up mid term line
c) lighten Red = Main trend in down trend but Main trend's slow moving average line haven't cross down mid term line
d) Red = Main trend in down trend and Main trend's slow moving average line had cross down mid term line
11) When Up green color triangle appear: mean the candlestick closing price is cross up Black color line (4 days HLC line) & price have potential continue up in short term
When Down Red color triangle appear: mean the candlestick closing price is cross down Black color line (4 days HLC line) & price have potential continue down in short term
12) Green color Up Trend Secondary Trend Band with solid line : form by 2 moving average lines and in green color when fast moving average is above slow moving average line
13) Red Color Down Trend Secondary Trend Band with solid line form by 2 moving average lines and in red color when fast moving average is below slow moving average line
Buy entry strategy No.1:
When Green arrow with "Buy" text appear and wait for the candlestick closed, and enter buy position on next candlestick .
Cut Loss exit: When Main trend turn into red color with Red down Arrow with "sell" text appear.
Target price no.1 : For hold over night. To close position When for Main trend turn into red color band and Red down Arrow with "sell" text appear.
Target price no.2 : For Intraday trade. To close position When price close below the black line
Buy entry strategy No.2:
After green up arrow appear and to add more position when Mid term purple line cross up Long term Blue line.
Cut Loss exit: When Main trend turn into red color with Red down Arrow with "sell" text appear.
Target price no.1 : For hold over night. To close position When for Main trend turn into red color band and Red down Arrow with "sell" text appear.
Target price no.2 : For Intraday trade. To close position When price close below the black line
Sell entry strategy No.1:
When Red arrow with "Sell" text appear and wait for the candlestick closed, and enter sell position on next candlestick .
Cut Loss exit: When Main trend turn into green color with green Up Arrow with "buy" text appear.
Target price no.1 : For hold over night. To close position When for Main trend turn into green color band and green Up Arrow with "Buy" text appear.
Target price no.2 : For Intraday trade. To close position When price close up the black line
Sell entry strategy No.2:
After Red Down arrow appear and to add more position when Mid term Gray color line cross down Long term Blue line.
Cut Loss exit: When Main trend turn into green color with green Up Arrow with "buy" text appear.
Target price no.1 : For hold over night. To close position When for Main trend turn into green color band and green Up Arrow with "Buy" text appear.
Target price no.2 : For Intraday trade. To close position When price close up the black line
"Use the link below to contact Owner for obtain access to this indicator"