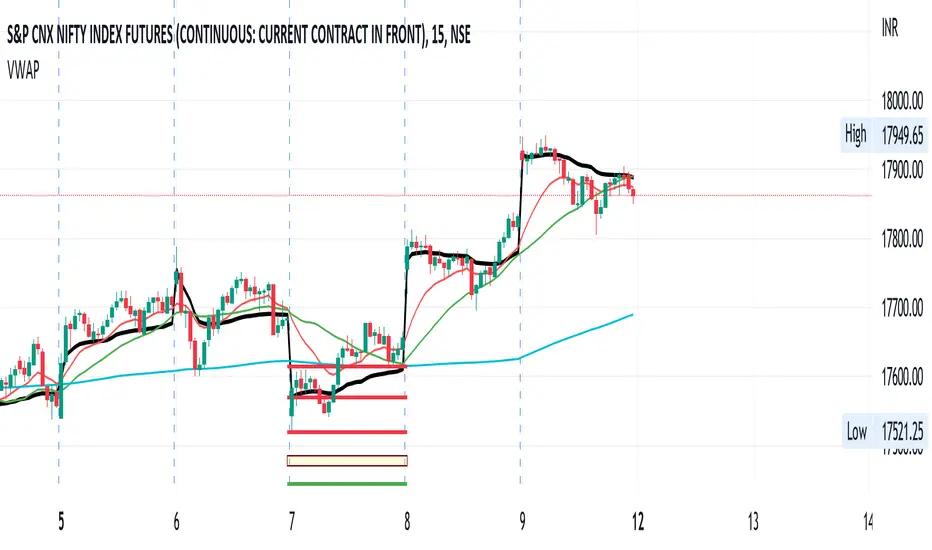
Intraday Direction Finder For Indices (Based On VWAP) Happy Independence Day..!!
------------------------------------------------------------------------
This indicator is based on the concept shared by "learntotrade365" to Find Intraday Direction for Index.
To decide the direction of Index we check whether the constituent Stocks are trading above VWAP or below VWAP.
Lets Consider Banknifty Example.
Banknifty Constituents are:
HDFC Bank
ICICI Bank
KOTAK Bank
SBI
AXIS Bank
IndusInd Bank
Based on concept, where above stocks are trading decides the direction as follows
Ratio Concept (Color)
6:0 Super Bullish (Lime)
5:1 Bullish(Green)
4:2 Mild Bullish (Aqua)
3:3 Sideways(Blue)
2:4 Mild Bearish ( Orange)
1:5 Bearish (Fuchsia)
0:6 Super Bearish (Red)
-------------------------------------------------------------------------
Features :-
1) Screener
In this Screener, we can clearly see which stock is trading above VWAP
& which is trading below VWAP along with ratio.
2) Chart Candle Colors
One can able to project candle colors according to Ratio colors.
3)Chart Background Color
One can set background color of chart if he is required.
------------------------------------------------------------------------
Same this can be used with other indices also like Nifty, Finnifty etc.
-------------------------------------------------------------------------
Thanks For Reading Till here...!!
------------------------------------------------------------------------
Kindly share your feedback or any suggestions.
------------------------------------------------------------------------
Cari dalam skrip untuk "VWAP"

VWAP Anchored Date with multiplierA modified version from the default VWAP indicator with 2 major enhancements:
1- Start date: instead of being limited to applying the indicator on the entire chart, this script allows you to select the start time to show the VWAP. You can also use this option to show VWAP on an instrument starting from a specific time, all time high for example.
2- Multiplier: You can choose a period multiplier for VWAP, like 2 days, 4 month, 3 years and so on
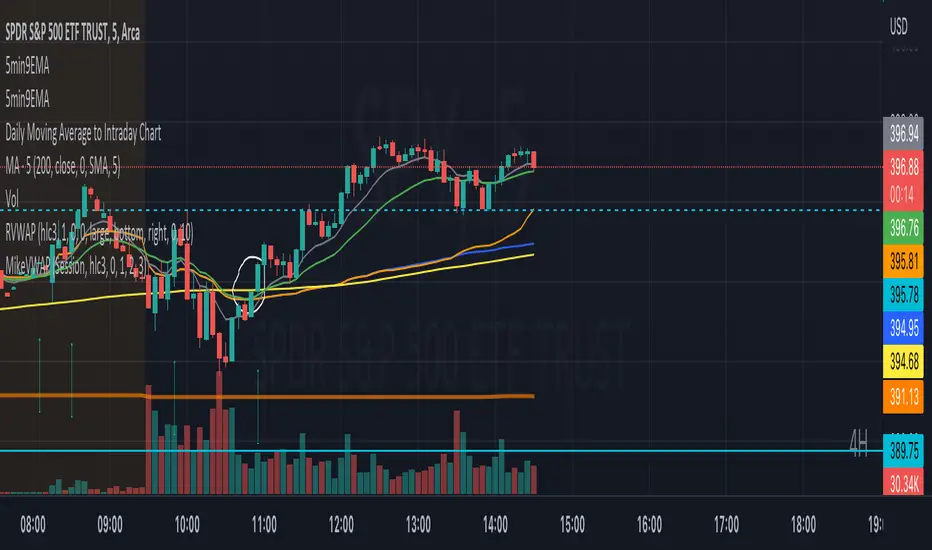
Mike's VWAP Pop/Crack StratWill signal based on the VWAP Pop and Crack strategy. You can change the time frame -- default is set to current chart -- to 5 minute if you wish to use 5 minute alerts on a 1 minute, 15-second, etc. chart.
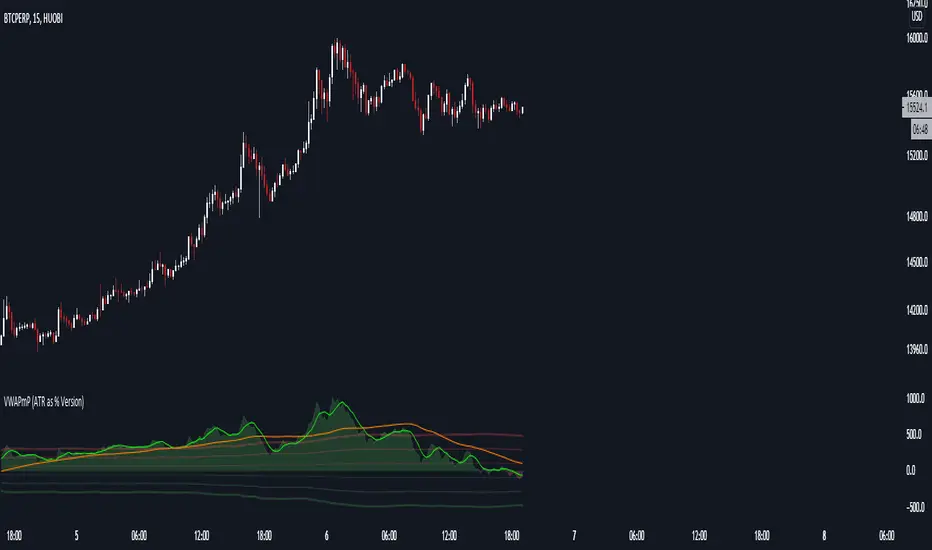
VWAPmP (ATR as % Version)This indicator displays a histogram for the distance of closing price from a VWAP value. The VWAP length is rolling and its value is user defined. Additionally, there are 3 bands which are based on the %-value of the underlying ATR. The ATR's length can be chosen by the user, and the distance multipliers may also be chosen. Lastly, there are two simple moving averages which have user-defined lengths and are based on the histograms value.
VWAP OscillatorToday I'm proposing a simple VWAP oscillator script to trade buy and sell waves more easily.
You trade this similar to how you trade Awesome Oscillator, so if you want an explanation just look up YT videos.
In addition to that, this will also show volume squeezes, please note that this is a makeshift way and not real volume squeeze phenomena of volume profile and tape. None the less, it is quite good at allowing you to ride out good trending waves and locate weak price action due to volume squeeze. You can turn off bar coloring from settings if you don't want this.
For ease of reading, I've also applied Allenstars Dynamic zones on this indicator so you can easily locate where the reading is entering in long and where it is in sell, this is compared to selected sample size. I've already selected the most common setting for that, so you don't really need to fiddle with it unless you find something better.
This indicator can be used to trade divergences as well, in fact, I feel it is better for that compared to RSI/MACD, the usual suspects.
Past performance is not assurance of future performance and this idea is published for only educational purposes, author taken no responsibility for your profit or loss.
VWAP Standard DeviationsVWAP Standard Deviations
VWAPSD is an indicator that can be used to identify Support & Resistance lines based on Volume per Price.
Such an indicator can be easily used to place a limit order on the SR levels

vwap pivotsThese levels keep track of the last periods VWAP open and close for the specified periods. It also tracks the high and low for the vwap during the current period. The fill color corresponds to trend estimations. I like to use it on a low timeframe for support and resistance levels.

VWAP Bands ProDisclaimer: This script is for educational purposes only and is not financial advice. Trading involves risk, and users are responsible for their own decisions.
VWAP Bands Pro is a professional volatility tool that anchors the Volume Weighted Average Price to a chosen timeframe and projects standard deviation bands to reveal stretched price zones.
Key Features
Anchored Precision : Calculates VWAP from a fixed anchor period (default: Daily) for a clean institutional reference point.
Standard Deviation Bands : Plots 1s, 2s, and 3s bands to show volatility. Moves into the outer bands often point to exhaustion or possible reversal areas.
Glowing Gradient Design : Uses a premium multi step gradient that fades outward, making extreme zones easy to spot.
Clean Visuals : Prioritizes smooth gradient fills instead of crowding the chart with heavy lines.
How to Use
Anchor Period : Select the timeframe you want the tool to follow. Daily works well for intraday setups, while Weekly or Monthly suits swing trades.
Strategy : Watch for mean reversion setups when price moves into the 2s to 3s outer zones and starts to reject, aiming for a return toward the central VWAP.

VWAP+SMA+EMAThis is the only indicator combing the results of VWAP + 2 SMAs + 2 EMAs.
This is a free indicator. Enjoy using it.
Kunal Jain
VWAP - Standard + 3 multi periodThis script combines the standard VWAP with 3 additional period-dependent VWAPs (originally coded by Neolao).

rth vwap and midMidpoint and VWAP are often important inflection points in daytrading. I managed to find a script providing me with a 24 hour session midline by NorthStarDayTrading and a RTH VWAP script by LDBC. So I decided to merge those two to get a RTH mid and vwap.

Rumpy's Donchian Anchored VWAPUses donchian points to anchor VWAPs (start a new VWAP interval). The defaults are set up for a 1H chart, with lookback periods of 1 day, 2 days, 1 week, 2 weeks and 4 weeks for the anchor points.
Green : upper donchian AVWAPs, Red : lower donchian AVWAPS, thin/1day to thickest/4 week.
Option to test whether a new point should be formed from a high or low exceeding the historical high/low over a lookback length or using a closes that exceed the historical high/low.
--------------------------------------
If you find it useful please consider a tip/donation :
BTC - 3BMEXEDyWJ58eXUEALYPadbn1wwWKmf6sA

Flunki Multi timeframe MTF VWAPsMultiple Timeframe VWAP plots.
Seven of them.
With colour flips and plot horizontal options.
Possibly more VWAP than you need... but you have an on / off option for each.
Enjoy.
Add me on Twitter @flunkimoku or find me in the OneX discord..

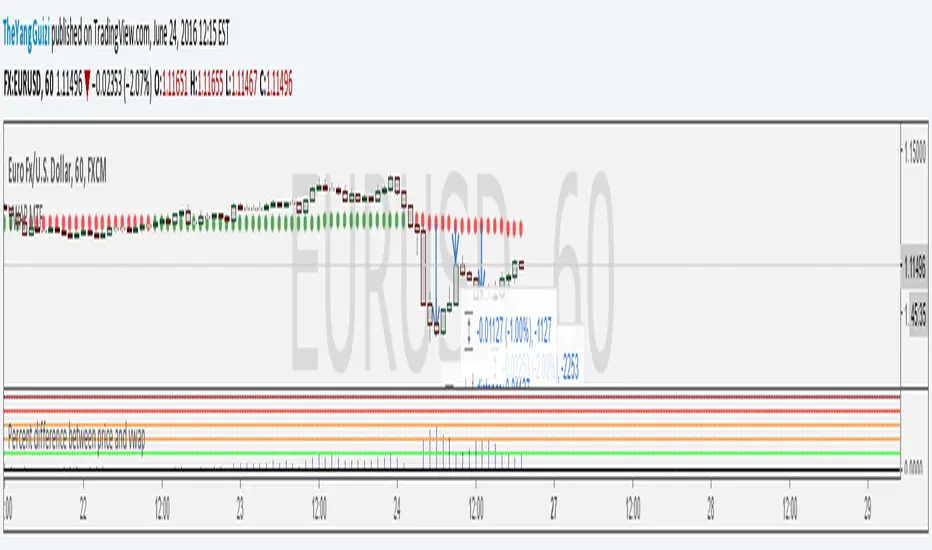
Percent Difference Between VWAP and Price MTFShows the difference between vwap and price in percent.
You can can choose between multiple timeframe vwap. Default is normal daily.
The levels on the indicator can be changed to whatever you want to.
In the chart above we can see eurusd reverting up at 3% below monthly vwap, after the brexit dip, It then turns down again at 1% from monthly and lastly it turns up again at 2% from monthly.
Script is a small modification of this:
Custom MTF VWAP 4x with IBI put this indicator together to have my main VWAP levels displayed on the chart easily with shaded areas when price is over extended. The IB I added to have the option to change futures based on an initial balance strategy combined with the daily and NY VWAP.

VWAP Session and NY CashAuto Anchored VWAPs with Label options
Session starts at 1800 EST
Cash Open or NY Session starts 0930 EST

Rolling Anchored VWAPRolling Anchored VWAP
This is my Rolling Anchored VWAP. Instead of being anchored to a fixed point of time, its anchored to a specific time-frame (ex. 24 hours to the minute) so the anchor point is constantly moving with time.
Enjoy


Nic's Anchored VWAP 4Poor mans anchored vwap. Allows you to identified the volume weighted average price from 4 specific points in time.
Best used on key pivot point high's and lows'
Difference % between PRICE and VWAP V2Shows difference between price and daily/weekly/monthly/hourly/whatever VWAP.
In v2:
option to color bars
average percentual difference of custom period
histogram changes color depending on which levels it's at
Levels/period/color etc can be customized.
Use these inputs in the timeframe box:
M - month
W - week
D - day
2D (or 3W or 2M or whatever) = 2 Days (or three week or 2 months and so on)
60= 1 H
240= 4 H
5 = 5 min
and so on.
btw, vaguely remembering reading somewhere that the big players like to make their entry at 4% difference.

VWAP-Anchored MACD [BOSWaves]VWAP-Anchored MACD - Volume-Weighted Momentum Mapping With Zero-Line Filtering
Overview
The VWAP-Anchored MACD delivers a refined momentum model built on volume-weighted price rather than raw closes, giving you a more grounded view of trend strength during sessions, weeks, or months.
Instead of tracking two EMAs of price like a standard MACD, this tool reconstructs the MACD engine using anchored VWAP as the core input. The result is a momentum structure that reacts to real liquidity flow, filters out weak crossovers near the zero line, and visualizes acceleration shifts with clear, high-contrast gradients.
This indicator acts as a precise momentum map that adapts in real time. You see how weighted price is accelerating, where valid crossovers form, and when trend conviction is strong enough to justify execution.
It uses gradient line coloring to show bullish or bearish momentum, histogram shading to highlight energy shifts, cross dots to mark valid crossovers, optional buy/sell diamonds for execution cues, and candle coloring to display trend strength at a glance.
Theoretical Foundation
Traditional MACD compares the difference between two exponential moving averages of price.
This variant replaces price with anchored VWAP, making the calculation sensitive to actual traded volume across your chosen period (Session, Week, or Month).
Three principles drive the logic:
Anchored VWAP Momentum : Price is weighted by volume and aggregated across the selected anchor. The fast and slow VWAP-EMAs then expose how liquidity-corrected momentum is expanding or contracting.
Zero-Line Distance Filtering : Crossover signals that occur too close to the zero line are removed. This eliminates the common MACD problem of generating weak, directionless signals in choppy phases.
Directional Visualization : MACD line, signal line, histogram, candle colors, and optional diamond markers all react to shifts in VWAP-momentum, giving you a clean structural read on market pressure.
Anchoring VWAP to session, weekly, or monthly resets creates a systematic framework for tracking how capital flow is driving momentum throughout each trading cycle.
How It Works
The core engine processes momentum through several mapped layers:
VWAP Aggregation : Price × volume is accumulated until the anchor resets. This creates a continuous, liquidity-corrected VWAP curve.
MACD Construction : Fast and slow VWAP-EMAs define the MACD line, while a smoothed signal line identifies edges where momentum shifts.
Zero-Line Distance Filter : MACD and signal must both exceed a threshold distance from zero for a crossover to count as valid. This prevents fake crossovers during compression.
Visual Momentum Layers : It uses gradient line coloring to show bullish or bearish momentum, histogram shading to highlight energy shifts, cross dots to mark valid crossovers, optional buy/sell diamonds for execution cues, and candle coloring to display trend strength at a glance.
This layered structure ensures you always know whether momentum is strengthening, fading, or transitioning.
Interpretation
You get a clean, structural understanding of VWAP-based momentum:
Bullish Phases : MACD > Signal, histogram expands, candles turn bullish, and crossovers occur above the threshold.
Bearish Phases : MACD < Signal, histogram drives lower, candles shift bearish, and downward crossovers trigger below the threshold.
Neutral/Compression : Both lines remain near the zero boundary, histogram flattens, and signals are suppressed to avoid noise.
This creates a more disciplined version of MACD momentum reading - less noise, more conviction, and better alignment with liquidity.
Strategy Integration
Trend Continuation : Use VWAP-MACD crossovers that occur far from the zero line as higher-conviction entries.
Zero-Line Rejection : Watch for histogram contractions near zero to anticipate flattening momentum and potential reversal setups.
Session/Week/Month Anchors : Session anchor works best for intraday flows. Weekly or monthly anchor structures create cleaner macro momentum reads for swing trading.
Signal-Only Execution : Optional buy/sell diamonds give you direct points to trigger trades without overanalyzing the chart.
This indicator slots cleanly into any momentum-following system and offers higher signal quality than classic MACD variants due to the volume-weighted core.
Technical Implementation Details
VWAP Reset Logic : Session (D), Week (W), or Month (M)
Dynamic Fast/Slow VWAP EMAs : Fully configurable lengths, smoothing and anchor settings
MACD/Signal Line Framework : Traditional structure with volume-anchored input
Zero-Line Filtering : Adjustable threshold for structural confirmation
Dual Visualization Layers : MACD body + histogram + crosses + candle coloring
Optimized Performance : Lightweight, fast rendering across all timeframes
Optimal Application Parameters
Timeframes:
1- 15 min : Short-term momentum scalping and rapid trend shifts
30- 240 min : Balanced momentum mapping with clear structural filtering
Daily : Macro VWAP regime identification
Suggested Configuration:
Fast Length : 12
Slow Length : 26
Signal Length : 9
Zero Threshold : 200 - 500 depending on asset range
These suggested parameters should be used as a baseline; their effectiveness depends on the asset volatility, liquidity, and preferred entry frequency, so fine-tuning is expected for optimal performance.
Performance Characteristics
High Effectiveness:
Assets with strong intraday or session-based volume cycles
Markets where volume-weighted momentum leads price swings
Trend environments with strong acceleration
Reduced Effectiveness:
Ultra-choppy markets hugging the VWAP axis
Sessions with abnormally low volume
Ranges where MACD naturally compresses
Disclaimer
The VWAP-Anchored MACD is a structural momentum tool designed to enhance directional clarity - not a guaranteed predictor. Performance depends on market regime, volatility, and disciplined execution. Use it alongside broader trend, volume, and structural analysis for optimal results.

VWAP Momentum Oscillator How It Works
Core Calculation Method
The oscillator combines four key market measurements into a single, normalized reading:
1. Price-VWAP Deviation: `(Close - VWAP) / VWAP × 100`
2. VWAP-MA Momentum: `(VWAP - MovingAverage) / MovingAverage × 100`
3. Anchored VWAP Strength: Average of high/low anchor deviations from rolling VWAP
4. Range Position: `(Close - PeriodLow) / (PeriodHigh - PeriodLow) × 100 - 50`
Dynamic Signal Line
The signal line uses an EMA that automatically adjusts its length based on your chart timeframe:
- Futures: Always covers 23 hours of trading (1,380 minutes)
- Stocks: Always covers 6.5 hours of trading (390 minutes)
- Examples: 276 periods on 5-min futures chart, 1,380 periods on 1-min futures chart
Trading Signals
🟢 Buy Signals
- Condition: Main oscillator crosses above signal line while below zero
- Logic: Momentum turning bullish from oversold conditions
- Visual: Green "BUY" label below price action
🔴 Sell Signals
- Condition: Main oscillator crosses below signal line while above zero
- Logic: Momentum turning bearish from overbought conditions
- Visual: Red "SELL" label above price action
⚠️ Extreme Warnings
- Extreme Overbought: Red triangle when oscillator crosses above +4.0
- Extreme Oversold: Green triangle when oscillator crosses below -4.0
- Purpose: Risk management alerts, not entry/exit signals
Oscillator Zones
Interpretation Guide
- Above +2.0: Strong bullish momentum zone (green background)
- 0 to +2.0: Mild bullish territory
- 0 to -2.0: Mild bearish territory
- Below -2.0: Strong bearish momentum zone (red background)
- Above +4.0: Extreme overbought (caution advised)
- Below -4.0: Extreme oversold (potential reversal zone)
Customization Options
Moving Average Settings
- EMA/SMA Toggle: Choose between exponential or simple moving average
- Color Customization: Adjust MA line color and width
Visual Controls
- Bullish/Bearish Colors: Customize momentum zone colors
- Signal Line: Toggle visibility and adjust color
- Line Widths: Control thickness of all plot lines
Anchor Modes
- NY Session Only: Anchors reset at NY market open (9:30 AM ET)
- 24H NY Day: Anchors reset at NY calendar day change (midnight ET)
Best Practices
Timeframe Selection
- Scalping: 1-5 minute charts for quick momentum changes
- Day Trading: 5-15 minute charts for clearer trend signals
- Swing Trading: 1-4 hour charts for major momentum shifts
Signal Confirmation
- Wait for crossovers: Don't trade on oscillator position alone
- Respect extreme levels: Exercise caution above +4 or below -4
- Use with price action: Combine with support/resistance levels
Risk Management
- Extreme zones: Reduce position size when oscillator is extended
- Failed signals: Exit quickly if momentum doesn't follow through
- Market context: Consider overall trend direction and market volatility
Technical Specifications
Calculation Components
- Base Length: 1,380 periods (futures) / 390 periods (stocks)
- Signal Line: Dynamic EMA covering one full trading day
- Smoothing: 3-period SMA on raw oscillator (adjustable)
- Update Frequency: Real-time on every price tick
Performance Notes
- Resource Efficient: Optimized calculations minimize CPU usage
- Memory Friendly: Uses incremental VWAP calculations
- Fast Loading: Minimal historical data requirements
Version History & Development
This oscillator evolved from advanced VWAP overlay strategies, transforming complex multi-line analysis into a single, actionable momentum gauge. The indicator maintains the sophistication of institutional VWAP analysis while providing the clarity needed for retail trading decisions.
Core Philosophy
Traditional VWAP indicators show where price is relative to volume-weighted averages, but they don't quantify momentum or provide clear entry/exit signals. This oscillator solves that problem by normalizing all VWAP relationships into a single, bounded indicator that works consistently across all timeframes and asset classes.
---
Open Source License: This indicator is provided free for the TradingView community. Feel free to modify and enhance according to your trading needs.

Anchored VWAP by Fin VirajSimple Anchored VWAP with Directional Colors
📊 Overview
A clean and efficient Anchored VWAP (Volume Weighted Average Price) indicator with dynamic directional coloring. This indicator provides traders with a reliable reference point for price action analysis based on volume-weighted calculations from specific anchor points.
✨ Key Features
🎯 Multiple Anchor Types
Session: Anchors to daily trading session start
Day: Resets at the beginning of each trading day
Week: Weekly anchor points for swing trading
Month: Monthly anchors for longer-term analysis
Manual Date: Set custom anchor date for specific events
🌈 Directional Color System
🟢 Green: Price above VWAP with upward momentum
🔴 Red: Price below VWAP with downward momentum
🔵 Blue: Neutral/transitional conditions
📏 Standard Deviation Bands
Customizable multipliers (default: 1.0 and 2.0)
Toggle on/off as needed
Support and resistance levels based on statistical deviation
Filled area between bands for better visualization
🔧 Settings & Customization
Input Parameters
Anchor Type: Choose from 5 different anchor methods
Manual Anchor Date: Set specific date for manual anchoring
Reset Anchor Point: Manual reset button
Show Standard Deviation Bands: Toggle bands visibility
Band Multipliers: Adjust band distance (1σ and 2σ)
VWAP Line Width: Customize line thickness (1-4)
Color Customization
Bullish Color: Customize uptrend color
Bearish Color: Customize downtrend color
Neutral Color: Customize neutral state color
Band Color: Customize standard deviation bands color
📈 How to Use
For Day Trading
Set anchor type to "Session" or "Day"
Use VWAP as dynamic support/resistance
Green color = bullish bias, Red color = bearish bias
For Swing Trading
Set anchor type to "Week" or "Month"
Longer-term VWAP acts as major S/R level
Standard deviation bands show potential reversal zones
For Event-Based Analysis
Set anchor type to "Manual Date"
Choose significant event date (earnings, news, etc.)
Analyze price behavior relative to that anchor point
🎨 Visual Interpretation
VWAP Line Colors
Bright Green: Strong bullish momentum (price above rising VWAP)
Bright Red: Strong bearish momentum (price below falling VWAP)
Blue: Neutral conditions or transitional phase
Standard Deviation Bands
Upper Bands: Potential resistance levels
Lower Bands: Potential support levels
Band Touches: Often indicate reversal or continuation points
💡 Trading Applications
Support & Resistance
VWAP acts as dynamic support in uptrends
VWAP acts as dynamic resistance in downtrends
Standard deviation bands provide additional S/R levels
Trend Analysis
Price consistently above VWAP = bullish trend
Price consistently below VWAP = bearish trend
Color changes help identify trend shifts
Entry & Exit Points
Use VWAP reclaims for potential long entries
Use VWAP breaks for potential short entries
Standard deviation bands for profit-taking levels
⚙️ Technical Details
Pine Script Version: v6
Overlay: Yes (plots on price chart)
Calculation: Volume-weighted average price from anchor point
Standard Deviation: Statistical measure of price dispersion
Performance: Optimized for real-time calculation
🔄 Anchor Reset Logic
The indicator automatically resets based on selected anchor type:
Session/Day: Resets at market open
Week: Resets at week start
Month: Resets at month start
Manual: Resets from chosen date
Manual Reset: Override button for immediate reset
📋 Best Practices
Choose appropriate timeframe for your anchor type
Combine with volume analysis for better confirmation
Use multiple timeframes for comprehensive analysis
Consider market context when interpreting signals
Test on demo before live trading
⚠️ Disclaimer
This indicator is for educational and informational purposes only. Always conduct your own analysis and risk management before making trading decisions.
