Adjustable Quad VWAPOverview
A powerful multi-timeframe VWAP indicator that displays four customizable rolling VWAPs with advanced features for comprehensive trend analysis and signal generation.
Key Features
🔧 Four Adjustable VWAPs
Fast VWAP: Default 7 days (1-365 adjustable)
Slow VWAP: Default 30 days (1-365 adjustable)
Medium VWAP: Default 90 days (1-365 adjustable)
Long VWAP: Default 365 days (1-365 adjustable)
Cari dalam skrip untuk "VWAP"
[GarufiCommunity] Multi Indicator: VWAPs, MA, Pivot PointsThis script provides a collection of indicators to help traders look at multiple trends while maintaining a consistent configuration, even when jumping around different timeframes and symbols.
Additionally, this collection is particularly useful when trading decisions involve looking at dozens of indicators and analyzing, in aggregate, their confluence.
With this collection of indicators you can configure anchored VWAPs, MA, and Pivot Points:
- Anchored VWAPs: For each you define a fixed time and date to anchor it in the graph, and it stays consistent even when you change the symbol. An example use case can be setting one of the VWAPs to always start on the first candle on January 1st 2021, and a second VWAP a decade prior, so you don’t need to keep manually adjusting/adding VWAPs to the graph. At the moment you can define up to 4 anchored VWAPs.
- MA and Pivot Points: For each you can set independent timeframes, periods, and types, while using a single configuration panel. This helps reduce the amount of clicking needed when trying different configurations, such as testing different MA and Pivot periods and comparing how each behave in the graph (this personally helps me build trust in indicators). Permits use of up to 3 MAs and 2 Pivot Points.
Lastly, this script leverages and reuses modified code from the sources below:
- Médias e Tempos-v.2.1 by VeraLucia (with permission);
- Multiple Anchored VWAP v1.0 by GuilhermeNogueira (with permission);
- Pivot Point by TradingView.

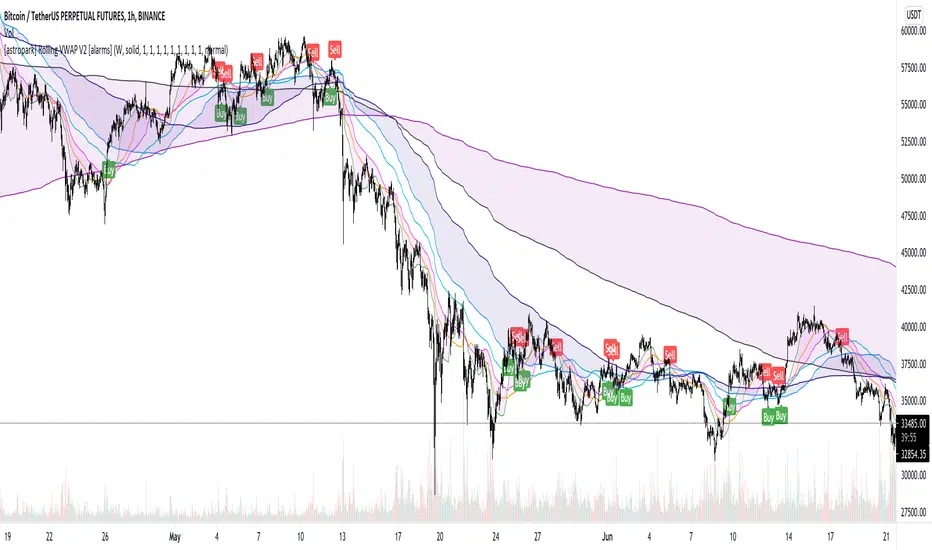
[astropark] Rolling VWAP V2 [alarms]Dear Followers,
today I'm glad to present you yet another awesome Analysis Tool and Strategy, that you may like to use in your trading journey: Rolling VWAP V2 !
This is an upgraded version of my "Progressive VWAP" analysis tool (progressive and rolling are synonymous for me), its description describes quite well what a progressive/rolling vwap is and why they are important to watch:
This indicator can print automatically for you many important Rolling VWAPs:
Daily (D)
2 days (2D)
3 days (3D)
4 days (5D)
Weekly (W)
2 weeks (2W)
Monthly (M)
Quarterly (Q)
Yearly (Y)
As an indicator it will let you:
enable/disable each rolling vwap, change its color and line style and thickness
enable/disable labels and/or price on labels, as well as change their size
As a strategy it will let you:
enable/disable buy/sell signals
choose which strategy to use (all based on rolling vwaps of course)
choose a starting date & time from which to start backtesting
enable/disable individually long and short setups in the backtesting
You should choose low timeframe rolling vwap strategy if you are on a low timeframe, while higher timeframe rolling vwaps are good on medium-high timeframes.
For example D-2D-3D rolling vwap strategies are good at 1h or below, the others on higher timeframes. Backtesting results will help you in understanting this point quite easily.
This indicator works on every timeframe, market and pair. By the way it must be said that, as a bot strategy it has been tested and designed mostly for Bitcoin trading and it works best on 1h or above.
As I always say, all tools are great if you use them correctly: this is not the "Holy Grail", so always use proper money and risk management strategies.
This indicator is the alarms version of the backtesting one you can see here below:
This is a premium indicator , so send me a private message in order to get access to this script.
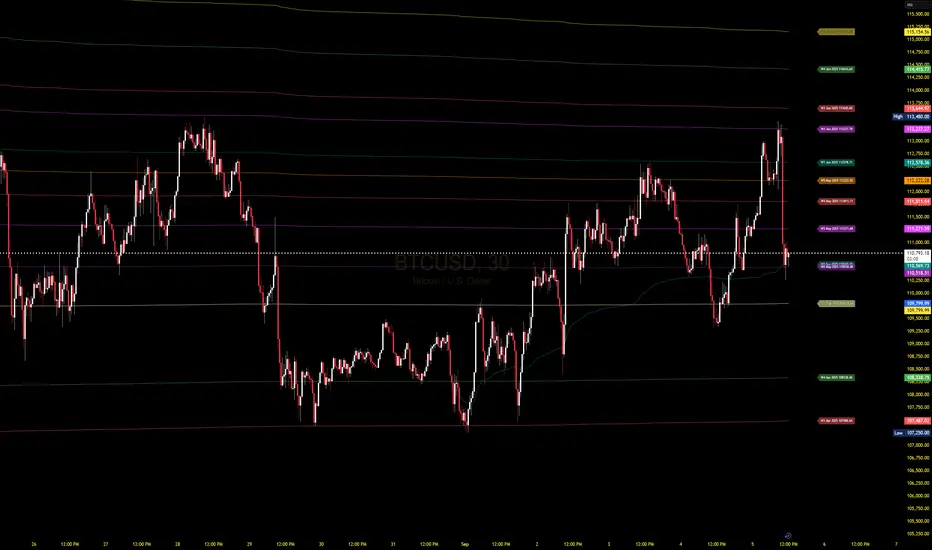
Weekly VwapsThe Weekly Vwaps indicator lets you plot weekly Volume-Weighted Average Price (VWAP) lines for up to six months of your choosing, with years ranging from 2020 to 2050. It’s a focused tool pulled straight from the weekly VWAP section of the Advanced VWAP Calendar indicator, keeping all the same controls and look but expanded to handle more months. You can use it alongside the original indicator if you need extra weekly VWAPs (up to 30 lines total) or run it on its own for a clean, dedicated setup.
How It Works: Six Month Groups: Pick any six months (e.g., Jan 2020, Sep 2025, or Jul 2040) and enable up to five weekly VWAPs per month (W1–W5), starting from Monday midnight.
Default Setup: Loads with September 2025 VWAPs turned on, with other months (August–April 2025) off but ready to enable. All default to 2025.
Customization: Toggle all weeks in a month or pick specific ones. Adjust label sizes (tiny to huge) and line widths (1–5). Colors are teal, fuchsia, red, green, and yellow/orange for weeks 1–5, with clear labels like “W1 Sep 2025 123.45”.
Label Control: A “Show All Labels” switch lets you hide labels to keep your chart tidy.
Intraday Only: Works on intraday timeframes (e.g., 5-minute, 1-hour) for accurate VWAPs.
Why Use It: Add to Advanced VWAP Calendar: If the original’s two-month limit isn’t enough, this adds six more months of weekly VWAPs for deeper analysis.
Standalone Option: Perfect if you only want weekly VWAPs without other features, with flexibility to pick any months and years.
User-Friendly: Ready to go with September 2025 enabled, easy to tweak for past or future data.
Get Started: Add it to your TradingView chart, and September 2025 VWAPs will show up instantly. Adjust months, years, or toggles in the settings to focus on what you need. Test it on intraday charts and use the label toggle to manage clutter. Great for traders wanting precise, customizable weekly VWAPs!
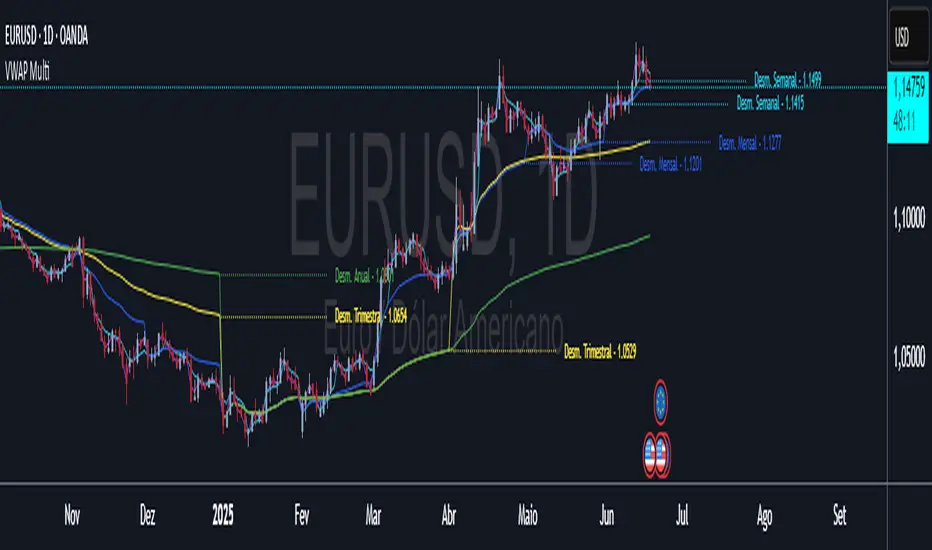
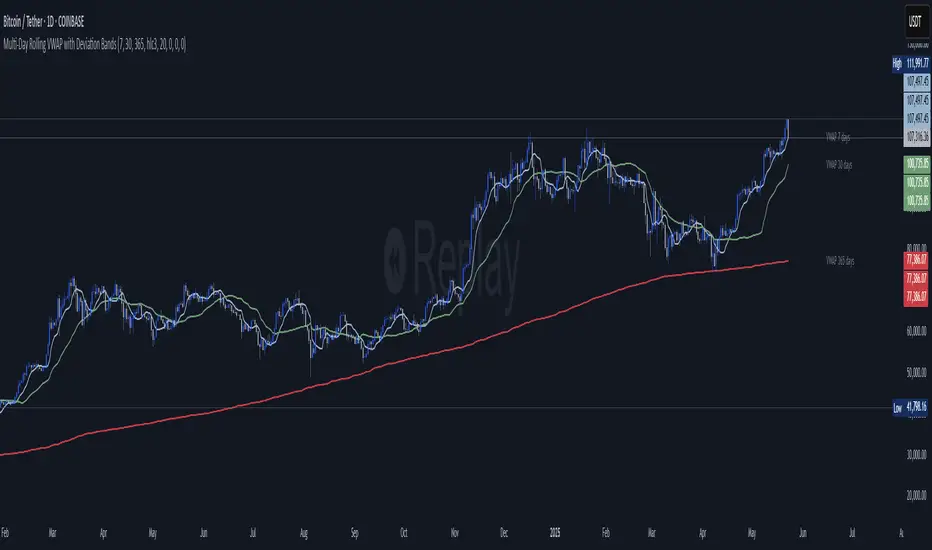
Multi‑Day Rolling VWAP with Deviation Bands📄 Description:
This script introduces a multi-day rolling VWAP (Volume-Weighted Average Price) indicator designed for traders who seek deeper structural insights beyond session-based VWAPs. It is particularly effective on intraday charts like 15m, 45m, 1H, and 4H, and is optimized for crypto swing, position, and trend exhaustion strategies.
Unlike traditional VWAPs that reset daily or weekly, this tool computes persistent VWAP levels by aggregating daily price-volume data across rolling windows such as the past 7, 30, or 365 days. These levels act as anchored support/resistance zones derived from real traded volume — helping traders identify where price is fair or stretched over time.
To enhance confluence and precision, each VWAP level optionally includes standard deviation bands, which act as dynamic volatility envelopes. These bands support custom multipliers, including Fibonacci levels like 0.272, 0.618, 1.0, and 1.618, providing flexible tools for identifying potential reversal or mean reversion zones.
✅ Key Features:
📊 Rolling VWAP over user-defined lookback windows (e.g. 7, 30, 365 days)
📐 Optional deviation bands based on volume-weighted standard deviation
🔢 Supports both traditional and Fibonacci multipliers for precise band tuning
⚙️ Independent configuration for up to 3 VWAP profiles (short/mid/long)
🔁 Auto-updates daily and tracks consistent volume-based anchoring
💼 Designed for crypto markets, especially high-volatility altcoins
🧠 How it Works:
At the start of each new day, the script logs cumulative volume and typical price values.
It maintains a rolling window of those daily values over configurable periods.
VWAPs are recalculated from the historical data each bar, ensuring persistence.
Deviation bands use a volume-weighted standard deviation formula, not naive price stddevs.
All inputs are optional — bands can be turned off by setting their multipliers to 0.
💡 Use Cases:
Identify long-term fair value zones in trending or consolidating markets
Spot overextended conditions using deviation confluence
Build trend continuation or exhaustion strategies around VWAP clusters
Anchor intraday decisions to multi-day volume context
🔒 Why Closed Source?
This script applies a proprietary method of rolling VWAP construction and deviation banding that goes beyond typical session or anchored VWAPs. The volume aggregation logic and smoothing techniques used are custom-built for tracking persistent volume-weighted structure — which is especially valuable in fragmented crypto markets. To protect this unique methodology, the code is published as closed-source.
Disclaimer: This indicator is a tool, not a guarantee. Always manage your risk.
For educational purposes only. Past performance does not guarantee future results.
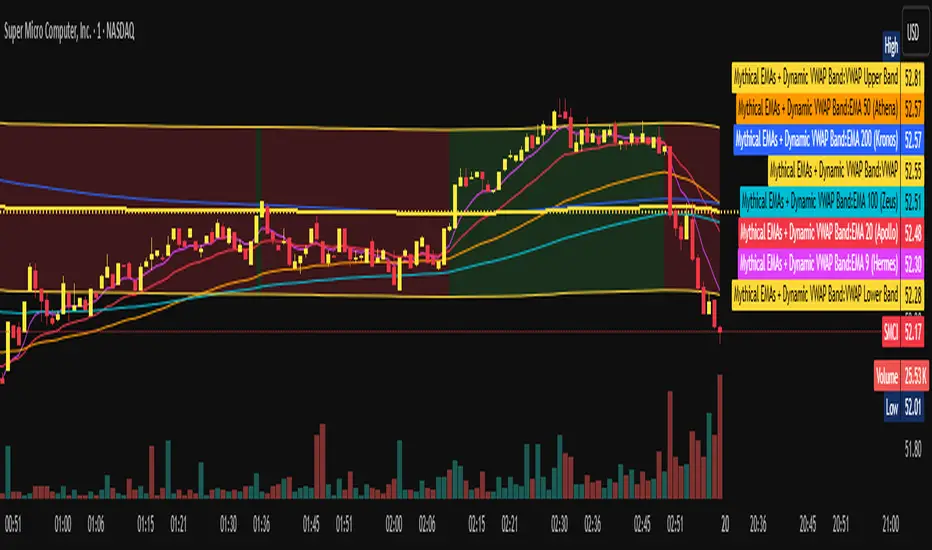
Mythical EMAs + Dynamic VWAP BandThis indicator titled "Mythical EMAs + Dynamic VWAP Band." It overlays several volatility-adjusted Exponential Moving Averages (EMAs) on the chart, along with a Volume Weighted Average Price (VWAP) line and a dynamic band around it.
Additionally, it uses background coloring (clouds) to visualize bullish or bearish trends, with intensity modulated by the price's position relative to the VWAP.
The EMAs are themed with mythical names (e.g., Hermes for the 9-period EMA), but this is just stylistic flavoring and doesn't affect functionality.
I'll break it down section by section, explaining what each part does, how it works, and its purpose in the context of technical analysis. This indicator is designed for traders to identify trends, momentum, and price fairness relative to volume-weighted averages, with volatility adjustments to make the EMAs more responsive in volatile markets.
### 1. **Volatility Calculation (ATR)**
```pine
atrLength = 14
volatility = ta.atr(atrLength)
```
- **What it does**: Calculates the Average True Range (ATR) over 14 periods (a common default). ATR measures market volatility by averaging the true range (the greatest of: high-low, |high-previous close|, |low-previous close|).
- **Purpose**: This volatility value is used later to dynamically adjust the EMAs, making them more sensitive in high-volatility conditions (e.g., during market swings) and smoother in low-volatility periods. It helps the indicator adapt to changing market environments rather than using static EMAs.
### 2. **Custom Mythical EMA Function**
```pine
mythical_ema(src, length, base_alpha, vol_factor) =>
alpha = (2 / (length + 1)) * base_alpha * (1 + vol_factor * (volatility / src))
ema = 0.0
ema := na(ema ) ? src : alpha * src + (1 - alpha) * ema
ema
```
- **What it does**: Defines a custom function to compute a modified EMA.
- It starts with the standard EMA smoothing factor formula: `2 / (length + 1)`.
- Multiplies it by a `base_alpha` (a user-defined multiplier to tweak responsiveness).
- Adjusts further for volatility: Adds a term `(1 + vol_factor * (volatility / src))`, where `vol_factor` scales the impact, and `volatility / src` normalizes ATR relative to the source price (making it scale-invariant).
- The EMA is then calculated recursively: If the previous EMA is NA (e.g., at the start), it uses the current source value; otherwise, it weights the current source by `alpha` and the prior EMA by `(1 - alpha)`.
- **Purpose**: This creates "adaptive" EMAs that react faster in volatile markets (higher alpha when volatility is high relative to price) without overreacting in calm periods. It's an enhancement over standard EMAs, which use fixed alphas and can lag in choppy conditions. The mythical theme is just naming—functionally, it's a volatility-weighted EMA.
### 3. **Calculating the EMAs**
```pine
ema9 = mythical_ema(close, 9, 1.2, 0.5) // Hermes - quick & nimble
ema20 = mythical_ema(close, 20, 1.0, 0.3) // Apollo - short-term foresight
ema50 = mythical_ema(close, 50, 0.9, 0.2) // Athena - wise strategist
ema100 = mythical_ema(close, 100, 0.8, 0.1) // Zeus - powerful oversight
ema200 = mythical_ema(close, 200, 0.7, 0.05) // Kronos - long-term patience
```
- **What it does**: Applies the custom EMA function to the close price with varying lengths (9, 20, 50, 100, 200 periods), base alphas (decreasing from 1.2 to 0.7 for longer periods to make shorter ones more responsive), and volatility factors (decreasing from 0.5 to 0.05 to reduce volatility influence on longer-term EMAs).
- **Purpose**: These form a multi-timeframe EMA ribbon:
- Shorter EMAs (e.g., 9 and 20) capture short-term momentum.
- Longer ones (e.g., 200) show long-term trends.
- Crossovers (e.g., short EMA crossing above long EMA) can signal buy/sell opportunities. The volatility adjustment makes them "mythical" by adding dynamism, potentially improving signal quality in real markets.
### 4. **VWAP Calculation**
```pine
vwap_val = ta.vwap(close) // VWAP based on close price
```
- **What it does**: Computes the Volume Weighted Average Price (VWAP) using the built-in `ta.vwap` function, anchored to the close price. VWAP is the average price weighted by volume over the session (resets daily by default in Pine Script).
- **Purpose**: VWAP acts as a benchmark for "fair value." Prices above VWAP suggest bullishness (buyers in control), below indicate bearishness (sellers dominant). It's commonly used by institutional traders to assess entry/exit points.
### 5. **Plotting EMAs and VWAP**
```pine
plot(ema9, color=color.fuchsia, title='EMA 9 (Hermes)')
plot(ema20, color=color.red, title='EMA 20 (Apollo)')
plot(ema50, color=color.orange, title='EMA 50 (Athena)')
plot(ema100, color=color.aqua, title='EMA 100 (Zeus)')
plot(ema200, color=color.blue, title='EMA 200 (Kronos)')
plot(vwap_val, color=color.yellow, linewidth=2, title='VWAP')
```
- **What it does**: Overlays the EMAs and VWAP on the chart with distinct colors and titles for easy identification in TradingView's legend.
- **Purpose**: Visualizes the EMA ribbon and VWAP line. Traders can watch for EMA alignments (e.g., all sloping up for uptrend) or price interactions with VWAP.
### 6. **Dynamic VWAP Band**
```pine
band_pct = 0.005
vwap_upper = vwap_val * (1 + band_pct)
vwap_lower = vwap_val * (1 - band_pct)
p1 = plot(vwap_upper, color=color.new(color.yellow, 0), title="VWAP Upper Band")
p2 = plot(vwap_lower, color=color.new(color.yellow, 0), title="VWAP Lower Band")
fill_color = close >= vwap_val ? color.new(color.green, 80) : color.new(color.red, 80)
fill(p1, p2, color=fill_color, title="Dynamic VWAP Band")
```
- **What it does**: Creates a band ±0.5% around the VWAP.
- Plots the upper/lower bands with full transparency (color opacity 0, so lines are invisible).
- Fills the area between them dynamically: Semi-transparent green (opacity 80) if close ≥ VWAP (bullish bias), red if below (bearish bias).
- **Purpose**: Highlights deviations from VWAP visually. The color change provides an at-a-glance sentiment indicator—green for "above fair value" (potential strength), red for "below" (potential weakness). The narrow band (0.5%) focuses on short-term fairness, and the fill makes it easier to spot than just the line.
### 7. **Trend Clouds with VWAP Interaction**
```pine
bullish = ema9 > ema20 and ema20 > ema50
bearish = ema9 < ema20 and ema20 < ema50
bullish_above_vwap = bullish and close > vwap_val
bullish_below_vwap = bullish and close <= vwap_val
bearish_below_vwap = bearish and close < vwap_val
bearish_above_vwap = bearish and close >= vwap_val
bgcolor(bullish_above_vwap ? color.new(color.green, 50) : na, title="Bullish Above VWAP")
bgcolor(bullish_below_vwap ? color.new(color.green, 80) : na, title="Bullish Below VWAP")
bgcolor(bearish_below_vwap ? color.new(color.red, 50) : na, title="Bearish Below VWAP")
bgcolor(bearish_above_vwap ? color.new(color.red, 80) : na, title="Bearish Above VWAP")
```
- **What it does**: Defines trend conditions based on EMA alignments:
- Bullish: Shorter EMAs stacked above longer ones (9 > 20 > 50, indicating upward momentum).
- Bearish: The opposite (downward momentum).
- Sub-conditions combine with VWAP: E.g., bullish_above_vwap is true only if bullish and price > VWAP.
- Applies background colors (bgcolor) to the entire chart pane:
- Strong bullish (above VWAP): Green with opacity 50 (less transparent, more intense).
- Weak bullish (below VWAP): Green with opacity 80 (more transparent, less intense).
- Strong bearish (below VWAP): Red with opacity 50.
- Weak bearish (above VWAP): Red with opacity 80.
- If no condition matches, no color (na).
- **Purpose**: Creates "clouds" for trend visualization, enhanced by VWAP context. This helps traders confirm trends—e.g., a strong bullish cloud (darker green) suggests a high-conviction uptrend when price is above VWAP. The varying opacity differentiates signal strength: Darker for aligned conditions (trend + VWAP agreement), lighter for misaligned (potential weakening or reversal).
### Overall Indicator Usage and Limitations
- **How to use it**: Add this to a TradingView chart (e.g., stocks, crypto, forex). Look for EMA crossovers, price bouncing off EMAs/VWAP, or cloud color changes as signals. Bullish clouds with price above VWAP might signal buys; bearish below for sells.
- **Strengths**: Combines momentum (EMAs), volume (VWAP), and volatility adaptation for a multi-layered view. Dynamic colors make it intuitive.
- **Limitations**:
- EMAs lag in ranging markets; volatility adjustment helps but doesn't eliminate whipsaws.
- VWAP resets daily (standard behavior), so it's best for intraday/session trading.
- No alerts or inputs for customization (e.g., changeable lengths)—it's hardcoded.
- Performance depends on the asset/timeframe; backtest before using.
- **License**: Mozilla Public License 2.0, so it's open-source and modifiable.
Frozen 4H VWAP – Precision AnchoredFrozen 4H VWAP – Precision Anchored Like Ice
The Frozen 4H VWAP – Precision Anchored delivers a clean, stable, and reliable view of the 4-hour Volume Weighted Average Price, designed for traders who want higher timeframe insights without intrabar noise or repainting.
🔹 Key Features:
Non-Repainting: VWAP value is “frozen” at the close of each 4H candle — no mid-bar updates or flickering.
4H Timeframe Anchoring: Seamlessly pulls 4-hour VWAP values into any timeframe you’re trading on.
Clear Trend Reference: Updates only when a new 4H candle begins, acting as a trustworthy anchor for support/resistance.
Custom Source Option: Choose from different price sources (default: HLC3) to fit your strategy.
Whether you're scalping, day trading, or swing trading, this indicator gives you a powerful edge by grounding your decisions in higher timeframe VWAP data — clear, calm, and frozen in time.

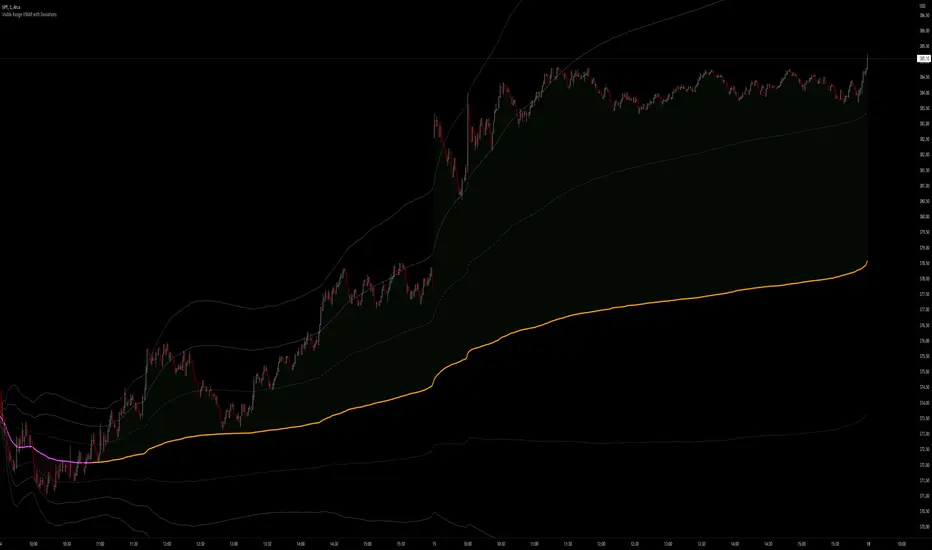
Visible Range VWAP with DeviationsImplementing Pine's new Visible range function I have built with the help of @RumpyPumpyDumpy a Visible range Vwap with Standard deviations in the same style and color way originally created by Zach Hurwitz, This is created in the styling and under the teaching of his education over the last few years. Zach uses intraday, and long term strategy based around 4 trade types that are taken in and around Vwap and its deviation bands. Whether that is intraday vwap , Longer term time based vwaps, Event based vwaps such as earnings , Gaps, Highest Volume based, and now "Visible range" based vwaps. The new visible range function is a huge help and time saver when wanting to quickly see a longer dated vwap or a vwap from a specific spot on your chart. All you have to do is scroll to that position on the chart and the Vwap and bands automatically launches from the furthest most left candle on your chart using the source input user chooses, HLC3, High, Low, etc.
This is a fully functional Volume weighted average price and launches on the furthest most left bar on your chart. It comes set to calculate the average price based off the launch candles HLC3 value, or User can choose to change the source input to High or Low for custom anchored visible range high/low vwap showing overhead resistance or support from underneath.
The deviations can be used as support and resistance intraday or longer time frames. Myself and others in our community have 4 trade type set ups that we take in and around Vwaps deviations. It offers us consistent, and manageable risk points at measured distances away from average price, and specific targets to aim for intraday and in longer time framed swing trades.
Vwap and its deviations are a institutional benchmark and a tool that higher time frame and institutional traders around the world use as a guide. With the use of visible range and multiple launch points on the candle we can quickly get an idea of where participants may be buying and selling, or trapped or supportive of price.
Standard deviation bands and the color-coding reflects the market’s current position and slope. This can now be applied to the visible range of your entire chart, and you can quickly understand whether the market is trending positive, negative, or flat and counter trend.
I have included our traditional color way of Zach's original vwap indicators that were originally released on TOS and now also available on TradingView. This shows a yellow positive sloped vwap , or magenta negative sloped vwap . User also has choice of slope signal which shows positive, negative, neutral, or single color choice.
There is also positive and negative cloud coloring behind price to show when price is above or below visible range vwap . This helps immediately understand whether price is moving in your favor or against. In addition there is the choice of brightly highlighting what we refer to as the "Fast lane", which is a trending market either positive or negative in plus one or negative one deviation. You can use them independently, or choose not to color them at all. There is also Positive and negative coloring options for the Deviation plots themselves, which in positive trend will color the upper deviations green or in negative trend color them red.
User also has the choice to add "Tolerance bands", which are sub deviation levels usually used in 0.25-0.50 increments. These show a zone above and below each deviation of which price may test above or below. We do not think as vwap as a hard "Line in the sand" rather a zone where we look for participation from those that are currently in that average price, this means price sometimes may move slightly under the vwap or deviation level as price seeks liquidity and the Tolerance bands can add some insight in an event like this.
As always-
*** ALL USERS ASSUME ALL RESPONSIBILTIY WHILE USING THIS TOOL. THIS IS NOT, NOR SHOULD NOT BE MISCONSTRUED AS FINANCIAL ADVICE. USER ASSUMES ALL RISKS ASSOCIATED WITH THE USE OF THIS TOOL WHILE TRADING,AND FOR ANY AND ALL LOSS THAT MAY OCCUR WHILE USING SAID TOOL. TRADING IS RISKY AND USER COULD STAND TO LOSE ALL CAPITAL INVESTED.
Hope you enjoy.
Thanks
-JMF
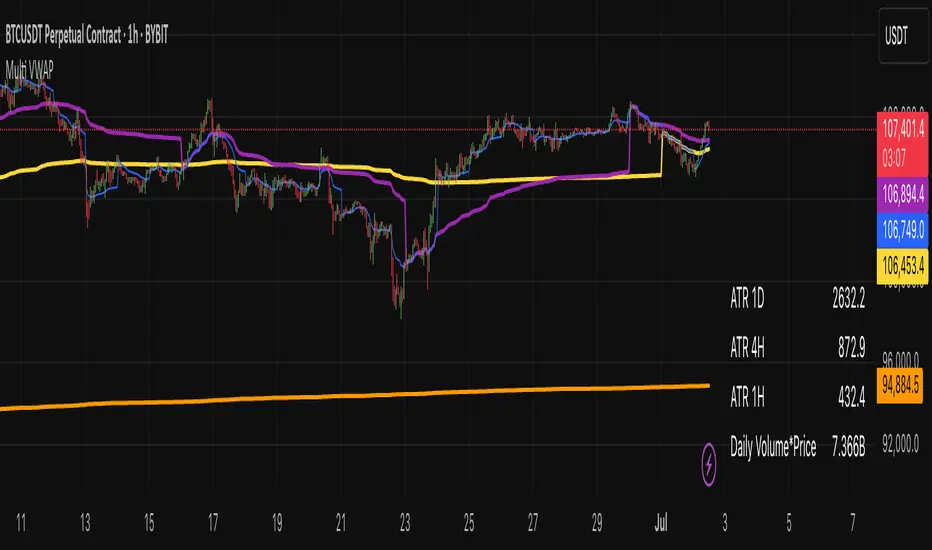
Multi VWAP indicatorMulti VWAP – Advanced Volume-Weighted Average Price Tool
The Multi VWAP indicator is a powerful tool for traders who use volume-based price analysis to find high-probability trade levels. It plots multiple VWAPs across different timeframes and key market anchors to give a deeper view of market structure and value.
Features:
Multi-Timeframe VWAPs: Displays VWAPs for the Year, Month, Week, and Day – giving you an instant overview of where price is trading relative to its volume-based average over time.
Anchored VWAPs from Yearly High/Low: Automatically anchors VWAP to the Yearly High and Yearly Low – these levels often act as dynamic support and resistance, making them excellent reference points for both entries and exits.
ATR Levels: Optional display of Average True Range (ATR) on Daily, 4-Hour, and Hourly timeframes – useful for volatility assessment and risk management.
Volume × Price Analysis: Includes an option to show Volume × Price for the previous day, which is especially helpful when trading low-liquidity cryptocurrencies or small-cap stocks, where volume has a stronger influence on price.
The Multi VWAP indicator is ideal for traders who want a layered, volume-driven perspective of the market. It helps identify key support and resistance levels, track market sentiment shifts, and improve timing across different trading styles.
Institutional Session VWAP Bands (Zeiierman)█ Overview
Institutional Session VWAP Bands (Zeiierman) plots a clean, session-aware VWAP that restarts at the “True Close” (end of the first trading hour) for each session you enable (Sydney, Tokyo, London, New York). From that anchor, the script computes a classic volume-weighted average price plus optional standard-deviation bands to frame session fair value and dispersion.
By aligning VWAP to when institutional flows settle (the first hour), you get a reference that matches real execution behavior, yielding more credible pullbacks, retests, and mean-reversion reads inside each session.
█ How It Works
⚪ Session Detection
You choose the sessions (on/off), their UTC-aligned time windows, and colors. The script detects when each session is active on your chart timeframe.
⚪ True-Close Anchoring
At session open the indicator waits. When the first hour completes, it flips the anchor on and starts a fresh VWAP for that session, mirroring how many desks treat the first hour as the real close for the prior day’s positioning.
⚪ VWAP Core
From the true-close anchor, VWAP is calculated in the standard way: cumulative (price × volume) / cumulative volume using your chosen price source (default hlc3).
⚪ VWAP Bands (σ)
Upper/Lower bands are built using a running standard deviation of the price source since the anchor. You control the σ multiplier and line width, and you can optionally fill between the bands.
█ Why Sessions + True-Close Anchoring
⚪ Institutional Timing Matters
A new anchor at the first-hour close reflects where real flows have settled, giving you a session fair-value line that aligns with how many funds evaluate prices intraday.
⚪ Cleaner Session Reads
Because VWAP and σ-bands restart each session, your retests, squeezes, and mean-reversion signals are based on today’s order-flow context, not yesterday’s inertia.
Result: a session-true fair-value with dispersion bands that stay close to the action, improving the quality of pullback entries and risk framing.
█ How to Use
⚪ Session Fair-Value Guide
Treat VWAP as the magnet for intraday value. Impulsive moves away from VWAP that fold back often present retest opportunities.
⚪ σ-Band Reversion & Breaks
Reversion: Tests beyond the upper/lower band that snap back inside can flag exhaustion.
Trend: Price riding the VWAP band in a strong trend
⚪ Session Handoffs
When one session hands to the next, watch how price behaves around the new session’s VWAP Bands after its anchor triggers. Continuation through the new VWAP vs. rejection often sets the tone.
█ Settings
UTC: Choose the timezone used to evaluate session windows (e.g., UTC+2).
Sessions (Sydney, Tokyo, London, New York): Toggle visibility and define each HHMM-HHMM window.
VWAP Price: Source for weighting.
Band Multiplier (σ): Standard deviation multiplier.
█ Related publications
True Close – Institutional Trading Sessions (Zeiierman)
-----------------
Disclaimer
The content provided in my scripts, indicators, ideas, algorithms, and systems is for educational and informational purposes only. It does not constitute financial advice, investment recommendations, or a solicitation to buy or sell any financial instruments. I will not accept liability for any loss or damage, including without limitation any loss of profit, which may arise directly or indirectly from the use of or reliance on such information.
All investments involve risk, and the past performance of a security, industry, sector, market, financial product, trading strategy, backtest, or individual's trading does not guarantee future results or returns. Investors are fully responsible for any investment decisions they make. Such decisions should be based solely on an evaluation of their financial circumstances, investment objectives, risk tolerance, and liquidity needs.

Anchored VWAP Pinch & Handoff, Intervals, and Signals"Anchored VWAP Pinch & Handoff, Intervals, and Signals" is an AVWAP toolbox for those who like to use various VWAP trading techniques. The indicator is currently comprised of the following three sections:
• The Pinch & Handoff section (shown above on chart) allows manually setting an upper and lower AVWAP (Pinch) along with an additional AVWAP (Handoff) by entering dates or by dragging the vertical anchor lines to the desired significant events on chart. Each of these three AVWAPs can also be set to show zones above and/or below by a percentage or standard deviation amount. The theory behind this method is that the upper and lower AVWAPs may act as dynamic support and resistance levels, effectively creating a price range or channel. As price moves between these two VWAP levels, it becomes squeezed or consolidated within that range. Further conjecture is that the longer the price remains within the range of the two anchored VWAP values, the higher the potential for an explosive breakout. Traders using this strategy may interpret the prolonged consolidation as a period of price compression, with the expectation that a significant move in either direction is likely to occur. Traders employing the AVWAP Pinch strategy might look for specific chart patterns or additional confirmation signals to enter a trade. For example, a breakout above the upper anchored VWAP level could trigger a long trade, while a breakdown below the lower anchored VWAP level could signal a short trade. Stop-loss orders and profit targets are typically set based on the trader's risk tolerance and the volatility of the asset. The third AVWAP (Handoff) is typically set after price has broken through the Pinch, and is used as a new level of support or resistance. The "Pinch & Handoff" phrase is believed to have been coined by Brian Shannon, who has popularized this method.
• The Intervals section (shown above on chart) is comprised of six periodic AVWAPs which cyclically reset. Their default settings are 1 Day, 2 Days, 1 Week, 1 Month, 1 Quarter, and 1 Year. They each may be set to desired period and when they are enabled the VWAPs whose periods are lower than the current chart timeframe are automatically hidden. For example a 1 Day AVWAP is not useful on a 1 Week chart so it would be hidden from that timeframe. When using AVWAPs from higher timeframes it may be helpful to set your chart to "Scale price chart only". This can be enabled by right clicking on your chart's price column and then left clicking "Scale price chart only" to enable that option.
• The Auto section (shown above on chart) is comprised of two automatic Anchored VWAPs. There are choices for setting anchors automatically based upon Highest Source, Highest Volume, Lowest Source, Lowest Volume, Pivot High, and Pivot Low. Because these two VWAPs work retroactively they are drawn with lines instead of plots. There is currently a limitation of 500 lines that may be drawn at any given time and the logic within this indicator uses a line for every bar of VWAP that is drawn, so if the combined length of both of these VWAPs exceeds 500 bars the earliest lines would disappear. For typical use of looking for the highest high in the last 50 bars or the last fractal this limitation should not be an issue.
---
All of the plots have been titled including hidden plots that are generated for the AVWAP line drawings. All of the various types of AVWAP within the indicator should be available as choices within the Alert creation dialog if use of alerts is desired.
---
NOTICE: This is an example script and not meant to be used as an actual strategy. By using this script or any portion thereof, you acknowledge that you have read and understood that this is for research purposes only and I am not responsible for any financial losses you may incur by using this script!

30-Day Rolling VWAP30-Day Rolling VWAP (30-RVWAP)
Overview:
The 30-Day Rolling VWAP is an advanced technical analysis tool designed for crypto traders that combines Volume Weighted Average Price over a 30-day rolling window with sophisticated volume analysis to generate high-probability trading signals.
Key Features:
1. Dynamic Color-Coded VWAP Line
Green glow = Strong bullish pressure
Red glow = Strong bearish pressure
Gray = Neutral/balanced market
The line changes color based on volume-weighted directional pressure
2. Volume Pressure Zones
Multi-layered glowing fill effect around VWAP
Expands/contracts based on volatility and volume
Shows potential support/resistance zones
3. Smart Alert System
Buy/Sell alerts based on VWAP color change
Cross above/below VWAP alerts
Confidence levels based on pressure strength
How to Use:
1. Color Signals
When VWAP turns green: Consider buying (bullish pressure)
When VWAP turns red: Consider selling (bearish pressure)
Gray color indicates consolidation/neutral market
2. Alert Structure
Buy/Sell alerts include confidence percentage (0-100%)
Higher confidence = stronger directional pressure
Cross alerts notify when price crosses VWAP with distance
3. Volume Pressure Zones
Wider zones = higher volatility/volume
Use zones as dynamic support/resistance levels
Watch for price reactions at zone boundaries
4. Trading Strategy
Enter long when VWAP turns green with high confidence (60%+)
Enter short when VWAP turns red with high confidence
Use VWAP as trailing stop (exit when cross alerts trigger)
Use pressure zones for profit targets
5. Alert Messages
Buy Signal: "BTCUSDT | 15m | BUY Signal | Price: 42380.00 | VWAP: 42350.00 | Distance: 0.07% | Confidence: 78% due to strong bullish pressure"
Cross Alert: "BTCUSDT | 15m | CROSS ABOVE VWAP | Price: 42360.00 | VWAP: 42350.00 | Distance: 0.02%"
Best Practices:
Use higher timeframes (4H+) for trend direction; preferably **daily timeframe**
Combine with other indicators for confirmation
Monitor volume for signal validation
Consider market context when entering trades
The indicator combines multiple volume metrics to filter out false signals and provides clear visual and alert-based trading signals.

Dynamic Swing Anchored VWAP (Zeiierman)█ Overview
Dynamic Swing Anchored VWAP (Zeiierman) is a price–volume tool that anchors VWAP at fresh swing highs/lows and then adapts its responsiveness as conditions change. Instead of one static VWAP that drifts away over time, this indicator re-anchors at meaningful structure points (swings). It computes a decayed, volume-weighted average that can speed up in volatile markets and slow down during quiet periods.
Blending swing structure with an adaptive VWAP engine creates a fair-value path that stays aligned with current price behavior, making retests, pullbacks, and mean reversion opportunities easier to spot and trade.
█ How It Works
⚪ Swing Anchor Engine
The script scans for swing highs/lows using your Swing Period.
When market direction flips (new pivot confirmed), the indicator anchors a new VWAP at that pivot and starts tracking from there.
⚪ Adaptive VWAP Core
From each anchor , VWAP is computed using a decay model (recent price×volume matters more; older data matters less).
Adaptive Price Tracking lets you set the base responsiveness in “bars.” Lower = more reactive, higher = smoother.
Volatility Adjustment (ATR vs Avg ATR) can automatically speed up the VWAP during spikes and slow it during compression, so the line stays relevant to live conditions.
█ Why This Adaptive Approach Beats a Simple VWAP
Standard VWAP is cumulative from the anchor point. As time passes and volume accumulates, it often drifts far from current price, especially in prolonged trends or multi-session moves. That drift makes retests rare and unreliable.
Dynamic Swing Anchored VWAP solves this in two ways:
⚪ Event-Driven Anchoring (Swings):
By restarting at fresh swing highs/lows, the VWAP reference reflects today’s structure. You get frequent, meaningful retests because the anchor stays near the action.
⚪ Adaptive Responsiveness (Volatility-Aware):
Markets don’t move at one speed. When volatility expands, a fixed VWAP lags; when volatility contracts, it can overreact to noise. Here, the “tracking speed” can auto-adjust using ATR vs its average.
High Volatility → faster tracking: VWAP hugs price more tightly, preserving retest relevance.
Low Volatility → smoother tracking: VWAP filters chop and stays stable.
Result: A VWAP that follows price more accurately, creating plenty of credible retest opportunities and more trustworthy mean-reversion/continuation reads than a simple, ever-growing VWAP.
█ How to Use
⚪ S wing-Aware Fair Value
Use the VWAP as a dynamic fair-value guide that restarts at key structural pivots. Pullbacks to the VWAP after impulsive moves often provide retest entries.
⚪ Trend Trading
In trends, the adaptive VWAP will ride closer to price, offering continuation pullbacks.
█ Settings
Swing Period: Number of bars to confirm swing highs/lows. Larger = bigger, cleaner pivots (slower); smaller = more frequent pivots (noisier).
Adaptive Price Tracking: Sets the base reaction speed (in bars). Lower = faster, tighter to price; higher = smoother, slower.
Adapt APT by ATR ratio: When ON, the tracking speed auto-adjusts with market volatility (ATR vs its own average). High vol → faster; low vol → calmer.
Volatility Bias: Controls how strongly volatility affects the speed. >1 = stronger effect; <1 = lighter touch.
-----------------
Disclaimer
The content provided in my scripts, indicators, ideas, algorithms, and systems is for educational and informational purposes only. It does not constitute financial advice, investment recommendations, or a solicitation to buy or sell any financial instruments. I will not accept liability for any loss or damage, including without limitation any loss of profit, which may arise directly or indirectly from the use of or reliance on such information.
All investments involve risk, and the past performance of a security, industry, sector, market, financial product, trading strategy, backtest, or individual's trading does not guarantee future results or returns. Investors are fully responsible for any investment decisions they make. Such decisions should be based solely on an evaluation of their financial circumstances, investment objectives, risk tolerance, and liquidity needs.

RTH Levels: VWAP + PDH/PDL + ONH/ONL + IBAlgo Index — Levels Pro (ONH/ONL • PDH/PDL • VWAP±Bands • IB • Gaps)
Purpose. A session-aware, non-repainting levels tool for intraday decision-making. Designed for futures and indices, with clean visuals, alerts, and a one-click Minimal Mode for screenshot-ready charts.
What it plots
• PDH/PDL (RTH-only) – Prior Regular Trading Hours high/low, computed intraday and frozen at the RTH close (no 24h mix-ups, no repainting).
• ONH/ONL – Prior Overnight high/low, held throughout RTH.
• RTH VWAP with ±σ bands – Volume-weighted variance, reset each RTH.
• Initial Balance (IB) – First N minutes of RTH, plus 1.5× / 2.0× extensions after IB completes.
• Today’s RTH Open & Prior RTH Close – With gap detection and “gap filled” alert.
• Killzone shading – NY Open (09:30–10:30 ET) and Lunch (11:15–13:30 ET).
• Values panel (top-right) – Each level with live distance in points & ticks.
• Right-edge level tags – With anti-overlap (stagger + vertical jitter).
• Price-scale tags – Native trackprice markers that always “stick” to the axis.
⸻
New in v6.4
• Minimal Mode: one click for a clean look (thinner lines, VWAP bands/IB extensions hidden, on-chart right-edge labels off; price-scale tags remain).
• Theme presets: Dark Hi-Contrast / Light Minimal / Futures Classic / Muted Dark.
• Anti-overlap controls: horizontal staggering, vertical jitter, and baseline offset to keep tags readable even when levels cluster.
⸻
Quick start (2 minutes)
1. Add to chart → keep defaults.
2. Sessions (ET):
• RTH Session default: 09:30–16:00 (US equities cash hours).
• Overnight Session default: 18:00–09:29.
Adjust for your market if you use different “day” hours (e.g., many use 08:20–13:30 ET for COMEX Gold).
3. Theme & Minimal Mode: pick a Theme Preset; enable Minimal Mode for screenshots.
4. Visibility: toggle PD/ON/VWAP/IB/References/Panel to taste.
5. Right-edge labels: turn Show Right-Edge Labels on. If they crowd, tune:
• Anti-overlap: min separation (ticks)
• Horizontal offset per tag (bars)
• Vertical jitter per step (ticks)
• Right-edge baseline offset (bars)
6. Alerts: open Add alert → Condition: and pick the events you want.
⸻
How levels are computed (no repainting)
• PDH/PDL: Intraday H/L are accumulated only while in RTH and saved at RTH close for “yesterday’s” values.
• ONH/ONL: Accumulated across the defined Overnight window and then held during RTH.
• RTH VWAP & ±σ: Volume-weighted mean and standard deviation, reset at the RTH open.
• IB: First N minutes of RTH (default 60). Extensions (1.5×/2.0×) appear after IB completes.
• Gaps: Today’s RTH open vs prior RTH close; “Gap Filled” triggers when price trades back to prior close.
⸻
Practical playbooks (how to trade around the levels)
1) PDH/PDL interactions
• Rejection: Price taps PDH/PDL then closes back inside → mean-reversion toward VWAP/IB.
• Acceptance: Close/hold beyond PDH/PDL with momentum → continuation to next HTF/IB target.
• Alert: PD Touch/Break.
2) ONH/ONL “taken”
• Often one ON extreme is taken during RTH. ONH Taken / ONL Taken → check if it’s a clean break or sweep & reclaim.
• Sweep + reclaim near VWAP can fuel rotations through the ON range.
3) VWAP ±σ framework
• Balanced: First tag of ±1σ often reverts toward VWAP.
• Trend: Persistent trade beyond ±1σ + IB break → target ±2σ/±3σ.
• Alerts: VWAP Cross and VWAP Reject (cross then immediate fail back).
4) IB breaks
• After IB completes, a clean IB break commonly targets 1.5× and sometimes 2.0×.
• Quick return inside IB = possible fade back to the opposite IB edge/VWAP.
• Alerts: IB Break Up / Down.
5) Gaps
• Gap-and-go: Opening drive away from prior close + VWAP support → trend until IB completion.
• Gap-fill: Weak open and VWAP overhead/underfoot → trade toward prior close; manage on Gap Filled alert.
Pro tip: Stack confluences (e.g., ONL sweep + VWAP reclaim + IB hold) and respect your execution rules (e.g., require a 5-minute close in direction, or your order-flow confirmation).
⸻
Inputs you’ll actually touch
• Sessions (ET): Session Timezone, RTH Session, Overnight Session.
• Visibility: toggles for PD/ON/VWAP/IB/Ref/Panel.
• VWAP bands: set σ multipliers (±1/±2/±3).
• IB: duration (minutes) and extension multipliers (1.5× / 2.0×).
• Style & Theme: Theme Preset, Main Line Width, Trackprice, Minimal Mode, and anti-overlap controls.
⸻
Alerts included
• PD Touch/Break — High ≥ PDH or Low ≤ PDL
• ONH Taken / ONL Taken — First in-RTH take of ONH/ONL
• VWAP Cross — Close crosses VWAP
• VWAP Reject — Cross then immediate fail back
• IB Break Up / Down — Break of IB High/Low after IB completes
• Gap Filled — Price trades back to prior RTH close
Setup: Add alert → Condition: Algo Index — Levels Pro → choose event → message → Notify on app/email.
⸻
Panel guide
The top-right panel shows each level plus live distance from last price:
LevelValue (Δpoints | Δticks)
Coloring: green if level is below current price, red if above.
⸻
Styling & screenshot tips
• Use Theme Preset that matches your chart.
• For dark charts, “Dark Hi-Contrast” with Main Line Width = 3 works well.
• Enable Trackprice for crisp axis tags that always stick to the right edge.
• Turn on Minimal Mode for cleaner screenshots (no VWAP bands or IB extensions, on-chart tags off; price-scale tags remain).
• If tags crowd, increase min separation (ticks) to 30–60 and horizontal offset to 3–5; add vertical jitter (4–12 ticks) and/or push tags farther right with baseline offset (bars).
⸻
Behavior & limitations
• Levels are computed incrementally; tables refresh on the last bar for efficiency.
• Right-edge labels are placed at bar_index + offset and do not track extra right-margin scrolling (TradingView limitation). The price-scale tags (from trackprice) do track the axis.
• “RTH” is what you define in inputs. If your market uses different day hours, change the session strings so PDH/PDL reflect your definition of “yesterday’s session.”
⸻
FAQ
Q: My PDH/PDL don’t match the daily chart.
A: By design this uses RTH-only highs/lows, not 24h daily bars. Adjust sessions if you want a different definition.
Q: Right-edge tags overlap or don’t sit at the far right.
A: Increase min separation / horizontal offset / vertical jitter and/or push tags farther with baseline offset. If you want markers that always hug the axis, rely on Trackprice.
Q: Can I change killzones?
A: Yes—edit the session strings in settings or request a version with user inputs for custom windows.
⸻
Disclaimer
Educational use only. This is not financial advice. Always apply your own risk management and confirmation rules.
⸻
Enjoy it? Please ⭐ the script and share screenshots using Minimal Mode + a Theme Preset that fits your style.

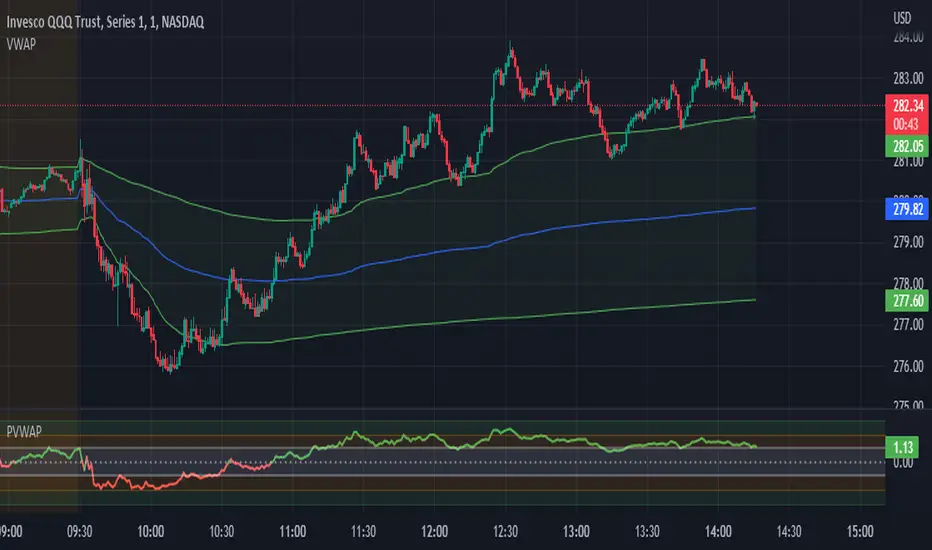
Candle Level of VWAP [By MUQWISHI]The " Price of Volume Weighted Average Price " (PVWAP) indicator calculates the VWAP standard deviation of bar price.
Features:
1. Ability to smooth the "Price of Volume Weighted Average Price" line.
2. Ability to choose the anchor period (timeframes).
Let me know if you have any questions.
Thanks.
52SIGNAL RECIPE VWAP Quantum Matrix Pro═══52SIGNAL RECIPE VWAP Quantum Matrix Pro ═══
◆ Overview
52SIGNAL RECIPE VWAP Quantum Matrix Pro is an advanced technical indicator based on Volume Weighted Average Price (VWAP), integrating volatility-adjusted bands and Fibonacci levels to provide multi-dimensional analysis of price movements.
It automatically applies optimized lookback periods for different timeframes, providing customized analysis for various trading styles, and helps traders effectively identify critical support/resistance zones through precise price level identification.
─────────────────────────────────────
◆ Key Features
• **Adaptive VWAP Bands**: Automatically adjusting upper and lower bands based on market volatility
• **Fibonacci Integration**: Fibonacci levels (23.6%, 38.2%, 50%, 61.8%, 78.6%) extended around VWAP center
• **Timeframe Optimization**: Automatic lookback period adjustment for each chart cycle
• **Pivot Point Analysis**: Core support/resistance levels based on volume-weighted highs and lows
• **Precision Labeling**: Accurate numerical display for all major price levels
• **Visual Gradation**: Intuitive visualization through color gradation for each Fibonacci level
─────────────────────────────────────
◆ Technical Foundation
■ VWAP Calculation Principles
• **Volume Weighting**: Calculation of real equilibrium price considering volume rather than simple price averaging
• **Standard Deviation Bands**: Statistical fluctuation range setting around VWAP center
• **Volatility Adjustment Mechanism**: Dynamic band width adjustment using current ATR to historical ATR ratio
• **Precise Price Range**: Identification of highest/lowest price range within specified lookback period
■ Fibonacci Band Implementation
• **VWAP-Centered Extension**: Division of distance from centerline (VWAP) to standard deviation bands by Fibonacci ratios
• **Symmetrical Upper/Lower Structure**: Application of identical Fibonacci ratios in both upward and downward directions
• **Color Gradation**: Progressive color changes for each Fibonacci level providing visual depth
─────────────────────────────────────
◆ Practical Applications
■ Price Movement Interpretation
• **Central Reference Point**:
▶ VWAP serves as intraday/period equilibrium price providing balance point of buying/selling pressure
▶ Movement above/below VWAP can be interpreted as short-term bullish/bearish signals
• **Band Reaction Patterns**:
▶ Reaching outer bands (100%) signals overbought/oversold conditions
▶ Reaction patterns between Fibonacci levels provide basis for trend strength and persistence judgment
■ Trading Strategy Utilization
• **Range-bound Trading**:
▶ Short-term trading utilizing bounce patterns between Fibonacci levels
▶ Oscillation trading between centerline (VWAP) and Fibonacci levels
• **Trend Following Strategy**:
▶ Breakout of Fibonacci levels aligned above/below VWAP signals trend strengthening
▶ Strong momentum confirmation when re-entering after outer band breakout
─────────────────────────────────────
◆ Advanced Configuration Options
■ Input Parameter Guide
• **Base Standard Deviation** (Default: 2.0)
▶ 1.0-1.5: Narrow bands, suitable for short-term trading
▶ 1.8-2.2: Balanced bands, optimal for general market conditions
▶ 2.5-3.0: Wide bands, suitable for long-term positions
• **Maximum/Minimum Standard Deviation** (Default: 3.0/1.0)
▶ Maximum: Cryptocurrency (4.0), Stocks/Forex (3.0), Low volatility (2.5)
▶ Minimum: Intraday trading (0.8), General (1.0), Long-term (1.5)
• **Volatility Measurement Period** (Default: 20)
▶ Short-term (10-14): Fast response, intraday trading
▶ Medium-term (15-25): Balanced response, swing trading
▶ Long-term (30-50): Noise filtering, long-term investment
• **Use Volatility Adjustment** (Default: On)
▶ On: Automatic band width adjustment based on current market volatility (recommended)
▶ Off: Fixed standard deviation bands usage
■ Timeframe-Specific Optimal Settings
• **Intraday Trading** (15min-1hr): Base standard deviation 1.8, volatility period 14
• **Swing Trading** (4hr-daily): Base standard deviation 2.0, volatility period 20
• **Position Trading** (daily-weekly): Base standard deviation 2.5, volatility period 30
■ Market-Specific Optimal Settings
• **Stock Market**: Base standard deviation 2.0, volatility period 20
• **Forex Market**: Base standard deviation 1.8, volatility period 25
• **Cryptocurrency Market**: Base standard deviation 2.5, volatility period 14, maximum standard deviation 4.0
─────────────────────────────────────
◆ Synergy with Other Indicators
• **Moving Averages**: VWAP and major moving average crossovers strengthen trend reversal signals
• **RSI/Stochastic**: Combination of VWAP band reactions in overbought/oversold zones improves reversal signal accuracy
• **Bollinger Bands**: VWAP Quantum Matrix and Bollinger Band convergence/divergence patterns are useful for volatility change prediction
• **Fibonacci Retracement**: Strong support/resistance formation when trend-direction Fibonacci retracement matches VWAP Fibonacci levels
• **Horizontal Support/Resistance**: Reaction probability significantly increases when past important price levels match VWAP Fibonacci levels
─────────────────────────────────────
◆ Conclusion
VWAP Quantum Matrix Pro provides deep insights into price action by integrating volatility-adjusted bands and Fibonacci theory into traditional VWAP analysis.
It dynamically responds to market environment changes through volume weighting and volatility adaptation mechanisms, and can be flexibly applied to various trading styles through timeframe-optimized lookback period settings.
Through appropriate input parameter configuration, the indicator can be optimized to match each trader's style and objectives, and through combination with other technical indicators, it strengthens confidence in trading decisions, ultimately enabling more precise and systematic market approaches.
─────────────────────────────────────
※ Disclaimer: Past performance does not guarantee future results. Always use appropriate risk management strategies.
═══52SIGNAL RECIPE VWAP Quantum Matrix Pro ═══
◆ 개요
52SIGNAL RECIPE VWAP Quantum Matrix Pro는 거래량 가중 평균 가격(VWAP)을 기반으로 하는 고급 기술적 지표로, 변동성 조정 밴드와 피보나치 레벨을 통합하여 가격 움직임을 다차원적으로 분석합니다.
타임프레임별로 최적화된 룩백 기간을 자동 적용하여 다양한 거래 스타일에 맞춤화된 분석을 제공하며, 정밀한 가격 레벨 식별을 통해 트레이더가 중요한 지지/저항 구간을 효과적으로 파악할 수 있도록 돕습니다.
─────────────────────────────────────
◆ 주요 특징
• **적응형 VWAP 밴드**: 시장 변동성에 따라 자동으로 조정되는 상하단 밴드 제공
• **피보나치 통합**: VWAP 중심으로 피보나치 레벨(23.6%, 38.2%, 50%, 61.8%, 78.6%) 확장
• **타임프레임 최적화**: 각 차트 주기에 맞춰 자동으로 룩백 기간 조정
• **피봇 포인트 분석**: 거래량 가중 고저가 기반의 핵심 지지/저항 레벨 표시
• **정밀 레이블링**: 모든 주요 가격 레벨에 정확한 수치 표시
• **시각적 그라데이션**: 피보나치 레벨별 컬러 그라데이션으로 직관적인 시각화
─────────────────────────────────────
◆ 기술적 기반
■ VWAP 계산 원리
• **거래량 가중치**: 단순 가격 평균이 아닌 거래량을 고려한 실질적 균형 가격 계산
• **표준편차 밴드**: VWAP 중심으로 통계적 변동 범위 설정
• **변동성 조정 메커니즘**: 현재 ATR과 과거 ATR 비율을 활용한 동적 밴드폭 조정
• **정밀 가격 범위**: 지정된 룩백 기간 내 최고/최저 가격 범위 식별
■ 피보나치 밴드 구현
• **VWAP 중심 확장**: 중심선(VWAP)에서 표준편차 밴드까지의 거리를 피보나치 비율로 분할
• **상하단 대칭 구조**: 상승과 하락 방향으로 동일한 피보나치 비율 적용
• **색상 그라데이션**: 피보나치 레벨별 점진적 색상 변화로 시각적 깊이감 제공
─────────────────────────────────────
◆ 실용적 응용
■ 가격 움직임 해석
• **중심 기준점**:
▶ VWAP은 일중/기간 내 균형가격으로 매수/매도 압력의 균형점 제공
▶ VWAP 위/아래 움직임은 단기 강세/약세 신호로 해석 가능
• **밴드 반응 패턴**:
▶ 외부 밴드(100%)에 도달 시 과매수/과매도 상태 시그널
▶ 피보나치 레벨 간 반응 패턴은 추세 강도와 지속성 판단 근거
■ 트레이딩 전략 활용
• **범위 내 거래**:
▶ 피보나치 레벨 간 바운스 패턴 활용한 단기 매매
▶ 중심선(VWAP)과 피보나치 레벨 간 오실레이션 거래
• **추세 추종 전략**:
▶ VWAP 위/아래 정렬된 피보나치 레벨 돌파는 추세 강화 신호
▶ 외부 밴드 돌파 후 다시 진입 시 강한 모멘텀 확인
─────────────────────────────────────
◆ 고급 설정 옵션
■ 인풋 파라미터 가이드
• **기본 표준 편차 (Base Standard Deviation)** (기본값: 2.0)
▶ 1.0-1.5: 좁은 밴드, 단기 거래에 적합
▶ 1.8-2.2: 균형 잡힌 밴드, 일반적 시장 환경에 최적
▶ 2.5-3.0: 넓은 밴드, 장기 포지션에 적합
• **최대/최소 표준 편차 (Maximum/Minimum Standard Deviation)** (기본값: 3.0/1.0)
▶ 최대: 암호화폐(4.0), 주식/외환(3.0), 저변동성(2.5)
▶ 최소: 일중 거래(0.8), 일반(1.0), 장기(1.5)
• **변동성 측정 기간 (Volatility Measurement Period)** (기본값: 20)
▶ 단기(10-14): 빠른 반응, 일중 거래
▶ 중기(15-25): 균형 잡힌 반응, 스윙 트레이딩
▶ 장기(30-50): 노이즈 필터링, 장기 투자
• **변동성 조정 사용 (Use Volatility Adjustment)** (기본값: 켜짐)
▶ 켜짐: 현재 시장 변동성에 따라 밴드 폭 자동 조정 (권장)
▶ 꺼짐: 고정된 표준편차 밴드 사용
■ 타임프레임별 최적 설정
• **일중 거래** (15분-1시간): 기본 표준편차 1.8, 변동성 기간 14
• **스윙 트레이딩** (4시간-일봉): 기본 표준편차 2.0, 변동성 기간 20
• **포지션 트레이딩** (일봉-주봉): 기본 표준편차 2.5, 변동성 기간 30
■ 시장별 최적 설정
• **주식 시장**: 기본 표준편차 2.0, 변동성 기간 20
• **외환 시장**: 기본 표준편차 1.8, 변동성 기간 25
• **암호화폐 시장**: 기본 표준편차 2.5, 변동성 기간 14, 최대 표준편차 4.0
─────────────────────────────────────
◆ 다른 지표와의 시너지
• **이동평균선**: VWAP과 주요 이동평균선 교차는 추세 전환 신호 강화
• **RSI/스토캐스틱**: 과매수/과매도 구간에서 VWAP 밴드 반응과 결합 시 반전 신호 정확도 향상
• **볼린저 밴드**: VWAP Quantum Matrix와 볼린저 밴드 수렴/발산 패턴은 변동성 변화 예측에 유용
• **피보나치 리트레이스먼트**: 추세 방향 피보나치 리트레이스먼트와 VWAP 피보나치 레벨 일치 시 강력한 지지/저항 형성
• **수평 지지/저항**: 과거 중요 가격대와 VWAP 피보나치 레벨 일치 시 반응 확률 대폭 증가
─────────────────────────────────────
◆ 결론
VWAP Quantum Matrix Pro는 전통적인 VWAP 분석에 변동성 조정 밴드와 피보나치 이론을 통합하여 가격 행동에 대한 깊이 있는 통찰력을 제공합니다.
거래량 가중치와 변동성 적응 메커니즘을 통해 시장 환경 변화에 동적으로 대응하며, 타임프레임별 최적화된 룩백 기간 설정으로 다양한 거래 스타일에 유연하게 적용할 수 있습니다.
적절한 인풋 파라미터 설정을 통해 각 트레이더의 스타일과 목표에 맞게 지표를 최적화할 수 있으며, 다른 기술적 지표들과의 조합을 통해 트레이딩 결정에 대한 확신을 강화하고, 궁극적으로 더 정밀하고 체계적인 시장 접근을 가능하게 합니다.
─────────────────────────────────────
※ 면책 조항: 과거 성과가 미래 결과를 보장하지 않습니다. 항상 적절한 리스크 관리 전략을 사용하세요.

Long-Term VWAP Mean Reversion SDCACore Idea:
This indicator is designed to support Strategic Dollar Cost Averaging (SDCA) for Bitcoin using a cumulative VWAP-based mean reversion model. It helps long-term investors identify high-conviction buy zones and overbought conditions using statistical deviation from the cumulative VWAP. This indicator evaluates how much price is stretched from the true market average price, weighted by cumulative volume over time.
Core Concepts and Formulas:
Cumulative VWAP (Volume Weighted Average Price):
VWAP cumulative = ∑(Price×Volume) / ∑Volume
A long-term anchor that reflects the average dollar cost of all market participants across all candles. This version does not reset daily, unlike intraday VWAP.
VWAP Deviation % :
Deviation% = Price - VWAP cumulative / VWAP cumulative x 100
Shows how far current price has diverged from the long-term fair value.
Z-Score of VWAP Deviation:
Z= (Price−VWAP)−μ / σ (lookback period: default 200)
SDCA Multiplier Mapping:
*Keep in mind in my Z-Score system, -2 represents the overbought level (white horizontal line) and +2 represents oversold (cyan horizontal line) conditions. So the scores on the Y axis and Z-score in the table are reversed.
| Z-Score Range | SDCA Multiplier |
---------------------------------------------
| ≤ -2 | 0.25×
| -1 to +1 | 1.0×
| > +2 | 2.0×
The pink line plots this multiplier. It’s meant to control buy weight at each time step.
How to Use This for SDCA:
-Buy normally when the multiplier is 1.0× (Z-score between -1 and +1)
-Accelerate buying when Z-score is deeply negative (price far below VWAP)
-Slow or pause buying when Z-score is high (price far above VWAP)
-Use the stats panel to track current Z-score, VWAP level, deviation %, and multiplier
-Watch the red/blue backgrounds as visual confirmation of oversold/overbought zones
Inputs:
Z-Score Lookback Length:
Default: 200 but can be adjusted.
Visuals:
Z-Score Line (cyan): shows current standardized deviation from VWAP
Multiplier Line (bright pink): your SDCA intensity signal
Background Zones: cyan = oversold, white = overbought
Horizontal Lines: +2 and -2 standard deviation thresholds
Stats Panel (bottom right): live values for Z-score, multiplier, price, VWAP, and the deviation formula
Suited For:
-Long-term Bitcoin investors
-SDCA Systems
-Mean reversion systems
-Macro-level buy/sell planning

Harmonic Rolling VWAP (Zeiierman)█ Overview
The Harmonic Rolling VWAP (Zeiierman) indicator combines the concept of the Rolling Volume Weighted Average Price (VWAP) with advanced harmonic analysis using Discrete Fourier Transform (DFT). This innovative indicator aims to provide traders with a dynamic view of price action, capturing both the volume-weighted price and underlying harmonic patterns. By leveraging this combination, traders can gain deeper insights into market trends and potential reversal points.
█ How It Works
The Harmonic Rolling VWAP calculates the rolling VWAP over a specified window of bars, giving more weight to periods with higher trading volume. This VWAP is then subjected to harmonic analysis using the Discrete Fourier Transform (DFT), which decomposes the VWAP into its frequency components.
Key Components:
Rolling VWAP (RVWAP): A moving average that gives more weight to higher volume periods, calculated over a user-defined window.
True Range (TR): Measures volatility by comparing the current high and low prices, considering the previous close price.
Discrete Fourier Transform (DFT): Analyzes the harmonic patterns within the RVWAP by decomposing it into its frequency components.
Standard Deviation Bands: These bands provide a visual representation of price volatility around the RVWAP, helping traders identify potential overbought or oversold conditions.
█ How to Use
Identify Trends: The RVWAP line helps in identifying the underlying trend by smoothing out short-term price fluctuations and focusing on volume-weighted prices.
Assess Volatility: The standard deviation bands around the RVWAP give a clear view of price volatility, helping traders identify potential breakout or breakdown points.
Find Entry and Exit Points: Traders can look for entries when the price is near the lower bands in an uptrend or near the upper bands in a downtrend. Exits can be considered when the price approaches the opposite bands or shows harmonic divergence.
█ Settings
VWAP Source: Defines the price data used for VWAP calculations. The source input defines the price data used for calculations. This setting affects the VWAP calculations and the resulting bands.
Window: Sets the number of bars used for the rolling calculations. The window input sets the number of bars used for the rolling calculations. A larger window smooths the VWAP and standard deviation bands, making the indicator less sensitive to short-term price fluctuations. A smaller window makes the indicator more responsive to recent price changes.
-----------------
Disclaimer
The information contained in my Scripts/Indicators/Ideas/Algos/Systems does not constitute financial advice or a solicitation to buy or sell any securities of any type. I will not accept liability for any loss or damage, including without limitation any loss of profit, which may arise directly or indirectly from the use of or reliance on such information.
All investments involve risk, and the past performance of a security, industry, sector, market, financial product, trading strategy, backtest, or individual's trading does not guarantee future results or returns. Investors are fully responsible for any investment decisions they make. Such decisions should be based solely on an evaluation of their financial circumstances, investment objectives, risk tolerance, and liquidity needs.
My Scripts/Indicators/Ideas/Algos/Systems are only for educational purposes!

VOLX+ VWAP Range BandsVOLX+ plots multiple VWAP-weighted high/low channels across different lookback periods to show how price behaves relative to short-term and long-term value zones.
Instead of using a single VWAP line, this tool creates four rolling VWAP envelopes:
Short-term range (fast reaction)
Mid-term range
Mid-mid range (transitional layer)
Long-term range (macro context)
Each band is computed as:
VWAP-High = SMA(high × volume, length) ÷ SMA(volume, length)
VWAP-Low = SMA(low × volume, length) ÷ SMA(volume, length)
This produces dynamic price channels that account for both price and traded volume, offering a clearer sense of where the market is accepting or rejecting value.
What It Shows
Four VWAP-weighted high/low bands
A short-term VWAP midline
Price line
Three SMAs for trend context
Optional visibility switches for each VWAP band
The filled regions between VWAP highs and lows create a layered “value map,” helping you interpret:
Trend continuation (price hugging outer VWAP bands)
Mean reversion (price returning toward inner bands)
Volatility contraction/expansion
Shifts in short-term vs long-term balance
🧠 How to Use
Use the short-term band for day-trading context or detecting short-term excess.
Use mid-term and mid-mid bands to confirm developing structure.
Use the long-term VWAP band to understand broader value zones.
Combine VWAP bands with SMAs and structure analysis for confluence.
This indicator is intended for price interpretation and analytical support.
✔ Does Not Repaint
The script uses rolling VWAP formulas and standard MAs; everything is stable and non-repainting.

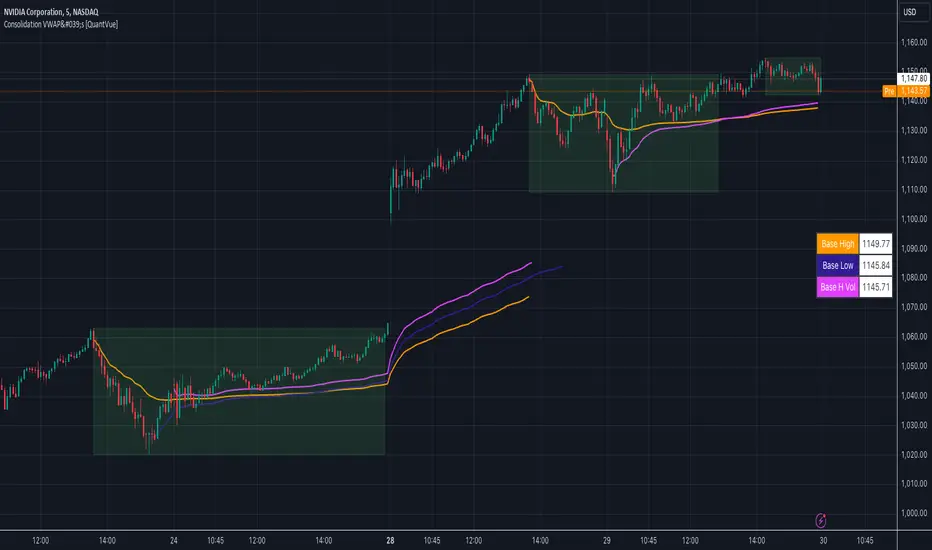
Consolidation VWAP's [QuantVue]Introducing the Consolidation VWAP's Indicator , a powerful tool designed to identify consolidation periods in stock advance and automatically anchor three distinct VWAPs to key points within the consolidation.
Consolidation Period Identification:
The indicator automatically detects periods of consolidation or areas on the chart where a stock's price moves sideways within a defined range. This period can be seen as the market taking a "breather" as it digests the previous gains. Consolidations are important because they often act as a base for the next move, either continuing the previous uptrend or reversing direction.
Consolidation requirements can be customized by the user to match your instrument and timeframe.
Maximum Consolidation Depth
Minimum Consolidation Length
Maximum Consolidation Length
Prior Uptrend Amount
Anchored VWAP, or Anchored Volume-Weighted Average Price, is a technical analysis tool used to determine the average price of a stock weighted by volume, starting from a specific point in time chosen by the analyst.
Unlike traditional VWAP, which starts at the beginning of the trading session, the anchored VWAP allows traders to select any point on the chart, such as a significant event, price low, high, or a breakout, to begin the calculation.
VWAP incorporates price and volume in a weighted average and can be used to identify areas of support and resistance on the chart.
VWAP Anchored to Consolidation High: This VWAP is anchored at the highest price point within the identified consolidation period. It helps traders understand the
average price paid by buyers who entered at the peak of the consolidation.
VWAP Anchored to Consolidation Low: This VWAP is anchored at the lowest price point within the consolidation. It provides insights into the average price paid by
buyers who entered at the lowest point of the consolidation.
VWAP Anchored to Highest Volume in the Consolidation: This VWAP is anchored at the price level with the highest trading volume during the consolidation. It reflects the average price at
which the most trading activity occurred, often indicating a key support or resistance level.
The indicator also allows the trader to see past consolidation areas and previous anchored VWAP's.
Give this indicator a BOOST and COMMENT your thoughts!
We hope you enjoy.
Cheers!
GMS: GW-VWAPAlright, as per usual with these, I end up adapting an existing indicator to what I want to accomplish. So this is based off the built in VWAP indicator. I added in the gummy worm to easily identify the trend, as well as the related bands to identify potential areas to either reverse position or to trim an existing one.
The middle part of the bands are the gummy worm version of VWAP. It is the VWAP using the high and another VWAP using the low. The black line is HL2 VWAP (technically 3 VWAPs).
The bands follow what I was mentioning above. So the outer most part of the bands are the high & low VWAP (with the same multiplier) and the inner bands are the HL2 VWAP.
Of course you can set whatever input source you want for these. The default is how I use it. If you want to get rid of the bar color just go to the indicator settings and un-select it at the bottom.
Source code is open so feel free to poke around.
Hope this helps,
Andre

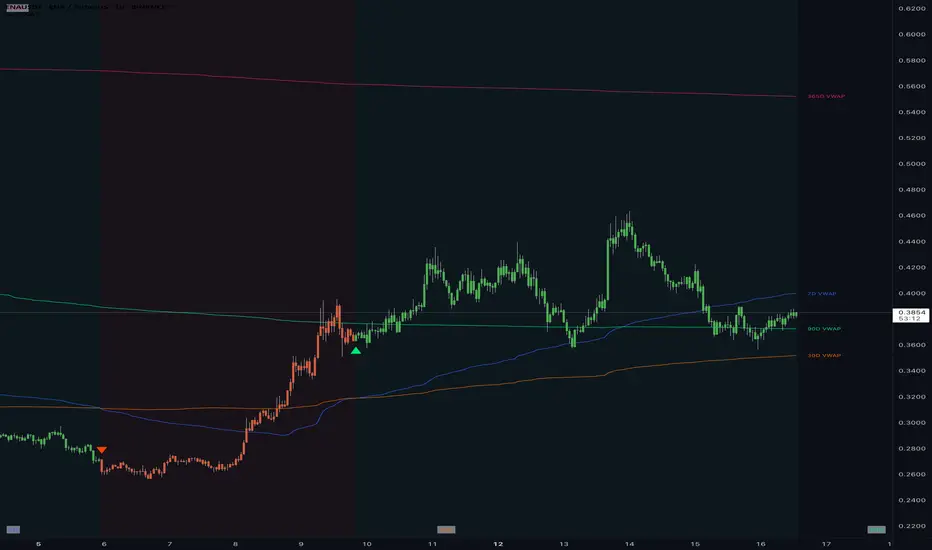
Multi Rolling VWAPMulti Rolling VWAP Indicator
Displays 4 volume-weighted average price (VWAP) levels on your chart:
7D VWAP - Weekly rolling average
30D VWAP - Monthly rolling average
90D VWAP - Quarterly rolling average
365D VWAP - Yearly rolling average
Each VWAP shows where the average price is, weighted by volume. Institutional traders often use these levels as support/resistance.
Optional Features:
Bands show volatility zones (Value Area High/Low)
Anchor modes: Reset weekly, monthly, quarterly, or yearly instead of rolling
Crypto volume aggregation from 15+ exchanges for accurate calculations
Clean, minimal design for white background charts.

VWAP Multi-Timeframe VWAP Multi-Timeframe - Complete Professional Indicator
🚀 WHAT IS IT?
The VWAP Multi-Timeframe is an advanced indicator that combines 5 different VWAP periods in a single tool, providing a complete view of market fair value levels across multiple time scales.
⭐ KEY FEATURES
📊 5 Configurable VWAPs:
🟡 Daily VWAP - Ideal for day trading and intraday operations
🟠 Weekly VWAP - Perfect for swing trading
🔵 Monthly VWAP - Excellent for medium-term analysis
🔴 Quarterly VWAP - Essential for quarterly strategies
🟢 Yearly VWAP - Fundamental for long-term investments
🎯 Multiple Price Sources:
Choose the source that best fits your strategy:
Close - Closing price (most common)
OHLC4 - Complete average (smoother)
HLC3 - Typical price (default)
HL2 - Period midpoint
Open/High/Low - Specific prices
💡 HOW TO USE
For Day Traders:
Use Daily VWAP as main fair value reference
Prices above = buying pressure / Prices below = selling pressure
For Swing Traders:
Combine Weekly and Monthly VWAP to identify trends
Look for confluences between different timeframes
For Investors:
Quarterly and Yearly VWAP show long-term value levels
Excellent for identifying entry points in investments
🔧 TECHNICAL FEATURES
✅ Pine Script v6 - Latest and optimized version
✅ Clean Interface - User-friendly design