Cari dalam skrip untuk "VWAP"
VWAP Supply & Demand Zones PRO**Overview:**
This script represents a major evolution of the original "VWAP Supply and Demand Zones" indicator. Initially created to explore price interaction with VWAP, it has now matured into a robust and feature-rich tool for identifying high-probability zones of institutional buying and selling pressure. The update introduces volume and momentum validation, dynamic zone management, alert logic, and a visual dashboard (HUD) — all designed for improved precision and clarity. The structural improvements, anti-repainting logic, and significant added utility warranted releasing this as a new script rather than a minor update.
---
### What It Does:
This indicator dynamically detects **supply and demand zones** using VWAP-based logic combined with **volume** and **momentum confirmation**. When price crosses VWAP with strength, it identifies the potential zone of excess demand (below VWAP) or supply (above VWAP), marking it visually with colored regions on the chart.
Each zone is extended for a user-defined duration, monitored for touch interactions (tests), and tracked for possible breaks. The script helps traders interpret price behavior around these institutional zones as either **reversal** opportunities or **continuation** confirmation depending on context and strategy preference.
---
### How It Works:
* **VWAP Basis**: Zones are anchored at VWAP at the time of a significant cross.
* **Volume & Momentum Filters**: Crosses are only considered valid if backed by above-average volume and notable price momentum.
* **Zone Drawing**: Validated supply and demand zones are drawn as boxes on the chart. Each is extended forward for a customizable number of bars.
* **Touch Counting**: Zones track the number of price touches. Alerts are issued after a user-defined number of tests.
* **Break Detection**: If price closes significantly beyond a zone boundary, the zone is marked as broken and visually dimmed.
* **Visual Dashboard (HUD)**: A compact real-time HUD displays VWAP value, active zone counts, and current market bias.
---
### How to Use It:
**Reversal Trading:**
* Look for price **rejecting** a zone after touching it.
* Use rejection candles or secondary indicators (e.g., RSI divergence) to confirm.
* These setups may offer low-risk entries when price respects the zone.
**Continuation Trading:**
* A **break of a zone** suggests strong directional bias.
* Use confirmed zone breaks to enter in the direction of momentum.
* Ideal in trending environments, especially with high volume and ATR movement.
---
### Key Inputs:
* **VWAP Length**: Moving VWAP period (default: 20)
* **Zone Width %**: Percentage size of zone buffer (default: 0.5%)
* **Min Touches**: How many times price must test a zone before alerts trigger
* **Zone Extension**: How far into the future zones are projected
* **Volume & ATR Filters**: Ensure only strong, valid crossovers create zones
---
### Alerts:
You can enable alerts for:
* **New zone creation**
* **Zone tests (after minimum touch count)**
* **Zone breaks**
* **VWAP crosses**
* **Active presence inside a zone (entry conditions)**
These alerts help automate market monitoring, making it suitable for discretionary or systematic workflows.
---
### Why It's a New Script:
This is not a cosmetic update. The internal logic, signal generation, filtering methodology, visual engine, and UX framework have been entirely rebuilt from the ground up. The result is a highly adaptive, precision-oriented tool — appropriate for intraday scalpers and swing traders alike. It goes far beyond the original in terms of functionality and reliability, justifying a fresh release.
---
### Suitable Markets and Timeframes:
* Works across all liquid markets (crypto, equities, futures, forex)
* Best used on timeframes where volume data is stable (5m and above recommended)
* Recalibrate inputs for optimal detection across instruments

VWAP and EMA Crossover VWAP & EMA-21 Crossover Indicator
The VWAP & EMA-21 Crossover Indicator is a momentum-based trend tool that combines the institutional strength of VWAP with the responsiveness of the 21-period Exponential Moving Average. It is designed for intraday traders who rely on clean and high-probability trend confirmation.
Key Features
Plots real-time VWAP as the institutional fair-value benchmark
Plots EMA-21 for fast trend detection
Generates Buy & Sell signals based on VWAP and EMA-21 alignment
Alerts for bullish and bearish crossovers
Suitable for stocks, indices, crypto, forex, and futures
How Signals Work
Buy Signal: Triggered when price moves above VWAP and crosses above EMA-21, indicating bullish momentum.
Sell Signal: Triggered when price moves below VWAP and crosses below EMA-21, confirming bearish momentum.
Best Use-Cases
Scalping and intraday trading (1m–30m charts)
Trend continuation and breakout confirmation
Filtering trades using VWAP’s institutional bias
Spotting early momentum shifts with EMA-21
Why this Indicator Works
VWAP identifies where institutional traders see fair value, while EMA-21 captures short-term trend direction. When both align, the indicator highlights clean, high-probability trading opportunities and filters out low-quality setups.
Conclusion
The VWAP & EMA-21 Crossover Indicator is ideal for traders seeking a simple yet powerful signal system that blends institutional volume logic with fast trend confirmation. Perfect for day traders, scalpers, and momentum-based strategies.
TLC sessionA Professional Intraday Session Tracker with VWAP and Economic Event Integration
Description
This indicator provides visual tracking of major trading sessions (Asian, London, New York) combined with VWAP calculations and macroeconomic event zones. It's designed for intraday traders who need to monitor session overlaps, liquidity periods, and high-impact news events.
The basic script of trading sessions was taken as a basis and refined for greater convenience.
Key Features:
Customizable Session Tracking: Visualize up to 3 trading sessions with adjustable time zones (supports IANA & GMT formats)
Dynamic VWAP Integration: Built-in Volume-Weighted Average Price calculation
Macro Event Zones: Highlights key economic announcement windows (adjustable for summer/winter time)
Price Action Visualization: Displays open/close prices, session ranges, and average price levels
Automatic DST Adjustment: Uses IANA timezone database for daylight savings awareness
How It Works
1. Trading Session Detection
Three fully configurable sessions (e.g., Asia, London, New York)
Each session displays:
Colored background zone
Opening price (dashed line)
Closing price (dashed line)
Average price (dotted line)
Optional label with session name
2. VWAP Calculation
Standard Volume-Weighted Average Price plotted as circled line
Helps identify fair value within each session
3. Macro Event Zones
Special highlighted period for economic news releases
Automatically adjusts for summer/winter time
Default set to 1000-1200 (summer) or 0900-1100 (winter) GMT-5 (US session open)
Why This Indicator is Unique
Multi-Session Awareness
Unlike simple session indicators, this tool:
Tracks price development within each session
Shows session overlaps (critical for volatility periods)
Maintains separate VWAP calculations across sessions
Professional-Grade Features
IANA timezone support (automatic DST handling)
Customizable visual elements (toggle labels, ranges, averages)
Object-based architecture (clean, efficient rendering)
News event integration (helps avoid trading during high-impact releases)
Usage Recommendations
Best Timeframes
1-minute to 1-hour charts (intraday focus)
Not recommended for daily+ timeframes
Trading Applications
1. Session Breakout Strategy: Trade breakouts when London/New York sessions open
2. VWAP Reversion: Fade moves that deviate too far from VWAP
3. News Avoidance: Reduce position sizing during macro event windows
Visual Example
Asian session (red)
London session (blue)
New York session (purple)
Macro event zone (white)
VWAP line (gold circles)
The basic script of trading sessions was taken as a basis and refined for greater convenience.

VWAP (Enhanced)Structured VWAP Enhanced
A dynamic, multi-functional VWAP indicator designed to help traders visualize key support and resistance levels during the trading session. This indicator computes the Volume Weighted Average Price (VWAP) along with two structured bands derived from customizable multipliers based on either standard deviation or percentage. In addition, it offers the following features:
Dual Bands: Displays two bands (Band #1 and Band #2) that adapt to market volatility, each with its own customizable multiplier.
Dynamic Midlines: Plots both the original midlines (the center of each band) and enhanced midlines between the VWAP and each band edge for clearer visual cues.
Fixed Offset Bands: Includes offset lines set at a fixed 0.25% above and below the VWAP and each band level to help highlight near-term price targets.
Custom VWAP Anchoring: Supports various anchoring periods (Session, Week, Month, etc.) and special events (Earnings, Dividends, Splits) to reset VWAP calculations, making it adaptable to different trading styles.
Visual Customization: Easily toggle the display of each component (bands, midlines, enhanced midlines, and offset lines) to suit your analysis needs.
Whether you are an intraday trader or a longer-term market participant, Structured VWAP Enhanced provides a robust framework to identify price imbalances and potential turning points throughout your trading day.
Add this indicator to your chart for a comprehensive view of VWAP dynamics and structured market levels.
VWAP Bands with ML [CryptoSea]VWAP Machine Learning Bands is an advanced indicator designed to enhance trading analysis by integrating VWAP with a machine learning-inspired adaptive smoothing approach. This tool helps traders identify trend-based support and resistance zones, predict potential price movements, and generate dynamic trade signals.
Key Features
Adaptive ML VWAP Calculation: Uses a dynamically adjusted SMA-based VWAP model with volatility sensitivity for improved trend analysis.
Forecasting Mechanism: The 'Forecast' parameter shifts the ML output forward, providing predictive insights into potential price movements.
Volatility-Based Band Adjustments: The 'Sigma' parameter fine-tunes the impact of volatility on ML smoothing, adapting to market conditions.
Multi-Tier Standard Deviation Bands: Includes two levels of bands to define potential breakout or mean-reversion zones.
Dynamic Trend-Based Colouring: The VWAP and ML lines change colour based on their relative positions, visually indicating bullish and bearish conditions.
Custom Signal Detection Modes: Allows traders to choose between signals from Band 1, Band 2, or both, for more tailored trade setups.
In the image below, you can see an example of the bands on higher timeframe showing good mean reversion signal opportunities, these tend to work better in ranging markets rather than strong trending ones.
How It Works
VWAP & ML Integration: The script computes VWAP and applies a machine learning-inspired adjustment using SMA smoothing and volatility-based adaptation.
Forecasting Impact: The 'Forecast' setting shifts the ML output forward in time, allowing for anticipatory trend analysis.
Volatility Scaling (Sigma): Adjusts the ML smoothing sensitivity based on market volatility, providing more responsive or stable trend lines.
Trend Confirmation via Colouring: The VWAP line dynamically switches colour depending on whether it is above or below the ML output.
Multi-Level Band Analysis: Two standard deviation-based bands provide a framework for identifying breakouts, trend reversals, or continuation patterns.
In the example below, we can see some of the most reliable signals where we have mean reversion signals from the band whilst the price is also pulling back into the VWAP, these signals have the additional confluence which can give you a higher probabilty move.
Alerts
Bullish Signal Band 1: Alerts when the price crosses above the lower ML Band 1.
Bearish Signal Band 1: Alerts when the price crosses below the upper ML Band 1.
Bullish Signal Band 2: Alerts when the price crosses above the lower ML Band 2.
Bearish Signal Band 2: Alerts when the price crosses below the upper ML Band 2.
Filtered Bullish Signal: Alerts when a bullish signal is triggered based on the selected signal detection mode.
Filtered Bearish Signal: Alerts when a bearish signal is triggered based on the selected signal detection mode.
Application
Trend & Momentum Analysis: Helps traders identify key market trends and potential momentum shifts.
Dynamic Support & Resistance: Standard deviation bands serve as adaptive price zones for potential breakouts or reversals.
Enhanced Trade Signal Confirmation: The integration of ML smoothing with VWAP provides clearer entry and exit signals.
Customizable Risk Management: Allows users to adjust parameters for fine-tuned signal detection, aligning with their trading strategy.
The VWAP Machine Learning Bands indicator offers traders an innovative tool to improve market entries, recognize potential reversals, and enhance trend analysis with intelligent data-driven signals.

Crypto Spot/Futures Dominance Indicator with AlertsFutures/Spot Dominance Indicator:
Overview:
The futures/spot dominance indicator is a versatile tool used by traders and analysts to assess the relative strength or dominance of the futures market in relation to the spot (or cash) market for a specific asset. It offers insights into market sentiment, potential arbitrage opportunities, and risk management while incorporating the VWAP indicator for added context.
How It Works:
This indicator automatically detects and adapts to the futures symbol applied to the chart, simplifying the setup for traders. However, it still necessitates manual input of the corresponding spot pair to ensure accuracy.
Automatic Futures Symbol Detection: The indicator starts by automatically detecting the futures symbol on the trading chart, eliminating the need for manual configuration. This ensures that the indicator is applied to the correct futures contract.
Manual Spot Pair Entry: To provide a reliable reference point for the comparison, traders must manually input the corresponding spot symbol via the indicator's inputs. For instance, if the indicator detects the BTCUSDT.P futures symbol, traders would manually enter the BTCUSDT spot symbol.
Gathering Data: The indicator collects historical price data for both the detected futures contract and the manually specified spot symbol. This data includes open, high, low, and close prices, as well as trading volume.
VWAP Calculation: To gain a deeper understanding of price trends and market dynamics, the indicator calculates the VWAP (Volume Weighted Average Price) for both the futures and spot markets. The VWAP places more weight on prices with higher trading volume, offering a weighted average that reflects market consensus.
Premium/Discount Calculation: By subtracting the VWAP of the spot market from the VWAP of the futures market, the indicator quantifies the premium or discount of the futures price concerning the spot price. A positive value indicates a premium, while a negative value suggests a discount.
Plotting: The premium/discount value is displayed as a line on the chart, often alongside moving averages or other smoothing techniques for improved trend analysis.
Alerts: In addition to its analysis capabilities, this indicator now includes alerts to enhance your trading experience. It alerts you in the following scenarios:
Premium Above Average: Notifies you when the premium crosses above the average line.
Premium Below Average: Alerts you when the premium crosses below the average line.
Premium Above Zero: Provides an alert when the premium crosses above the zero line.
Premium Below Zero: Generates an alert when the premium crosses below the zero line.
Benefits of the Futures/Spot Dominance Indicator:
Sentiment Analysis: Traders use the indicator to assess market sentiment. A futures premium might signify bullish sentiment, while a discount could indicate bearish sentiment.
Arbitrage Opportunities: Identifying price discrepancies between futures and spot markets can help traders spot arbitrage opportunities, where they can profit from price differentials.
Risk Management: The indicator assists in evaluating risks associated with futures positions, helping traders manage their exposure effectively.
Trend Confirmation: When used in conjunction with other technical indicators, futures/spot dominance, along with VWAP, can provide additional confirmation of price trends.
Hedging: Investors and corporations use this tool to gauge the effectiveness of hedging strategies based on futures contracts.
Speculative Trading: Traders and investors use the indicator to inform speculative positions, aligning their trades with perceived market strength or weakness.
Insightful Analysis: Futures/spot dominance analysis, enriched by VWAP data, offers insights into market behavior during specific events or changes in economic conditions.
In summary, the futures/spot dominance indicator, with its integration of VWAP and automatic futures symbol detection, provides traders and investors with a comprehensive tool to assess market dynamics. It aids in sentiment analysis, risk management, and trend confirmation while offering potential arbitrage opportunities. The newly added alerts enhance the indicator's functionality, providing timely notifications of key market events. However, it relies on manual input of the corresponding spot pair to ensure precise comparisons between futures and spot markets. It should be used alongside other analysis techniques for a well-rounded view of the market.

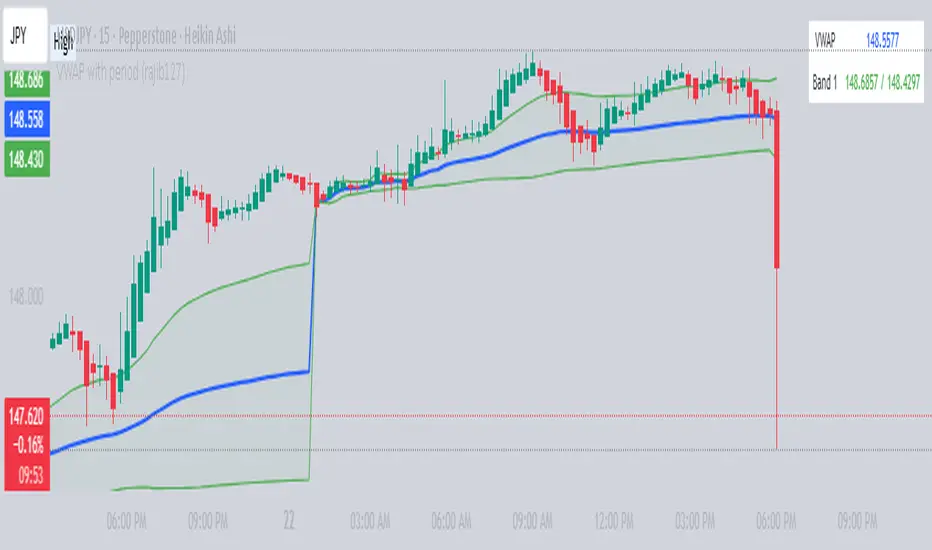
EOD re-entriesThis indicator is designed to compliment another of my trading scripts which gives signals for long-term trends on the daily chart. Here, I'm using the same daily 50 and 200MAs, but projecting them on the 4 hour chart to potentially catch faster trade re-entry points.
There are built in alerts for the following:
- Long: The price closed above the daily 50 MA while the 4 hour VWAP is above the MVWAP
- Long: The price closed above the daily 200 MA while the 4 hour VWAP is above the MVWAP
- Short: The price closed below the daily 50 MA while the 4 hour VWAP is below the MVWAP
- Short: The price closed below the daily 200 MA while the 4 hour VWAP is below the MVWAP
- VWAP long re-entry (large green triangle): The price closes above the VWAP and both the 50 & 200 MAs
- VWAP short re-entry (large red triangle): The price closes below the VWAP and both the 50 & 200 MAs
- EMA long re-entry (small green triangle): 4 EMAs of your choosing are fanning out above the 50 & 200 MAs when the price is above VWAP
- EMA short re-entry (small red triangle): 4 EMAs of your choosing are fanning out below the 50 & 200 MAs when the price is below VWAP
All of the above are filtered against stochastic RSI and numerous other oscillators to reinforce the signals.
This is a private script. Please DM me for access.

VWAP y Standar DeviationThis script presents the real VWAP (Yellow line), in 50 period VWAP (Blue Line) and the 120 period VWAP (Red Line). Additionally, it presents the values of 1 and 1,618 standard deviations of the VWAP of 50 periods.
This confirmation allows to visualize the behavior of the price in realicon to the VWAP key indicator that represents the midpoint of the operating volumes in a period.
This script evaluates the deviation of the price in relation to the average of the volume traded in the different periods.
The indicator settings allow changing the length of the VWAP for custom settings. Standard deviations are determined based on VWAP 2. VWAP 1 is a reference for determining the global trend of movement in the established period.
The upper and lower limits of the representative Standard Deviation of 1.618 (Fibonacci Number) are used as confirmation of continuation of a trend once crossed by the price.
During the ranges the 1.618 limits of the Dev. Standard are used as entry and exit points of the operation (For this it is necessary to adjust the VWAP 2 to the studied temporality and the operated asset)

VWAP Pro v6 (Color + Bands)AI helped me code VWAP
When price goes above VWAP line, VWAP line will turn green to indicate buyers are in control.
When price goes below VWAP line, VWAP line will turn red to indicate sellers are in control.
VWAP line stays blue when price is considered fair value.
VWAP with period (rajib127)VWAP with Adjustable Period (rajib127)
This advanced VWAP (Volume Weighted Average Price) indicator offers enhanced functionality with customizable anchor periods and multiple standard deviation bands.
Key Features:
Adjustable Anchor Period: Unlike standard VWAP that resets daily, this indicator allows you to set custom anchor timeframes (Daily, Weekly, Monthly) to match your trading strategy
Multiple Deviation Bands: Display up to 3 sets of bands with customizable multipliers for better support/resistance identification
Dual Calculation Modes: Choose between Standard Deviation or Percentage-based band calculations
Flexible Price Sources: Select from 7 different price calculation methods (Typical, Close, High, Low, Median, Weighted, Open)
Timeframe Visibility Control: Option to hide VWAP on higher timeframes (Daily and above) for cleaner charts
Visual Enhancements: Color-coded bands with fill areas and real-time value display table
Trading Applications:
Identify dynamic support and resistance levels
Spot mean reversion opportunities when price deviates from bands
Use different anchor periods for swing trading vs day trading strategies
Combine with other indicators for confluence-based entries
Unique Advantage:
The ability to adjust the VWAP reset period makes this indicator versatile for various trading styles - from intraday scalping with hourly resets to swing trading with weekly anchors.
Perfect for traders who want more control over their VWAP analysis beyond the standard daily reset limitation.
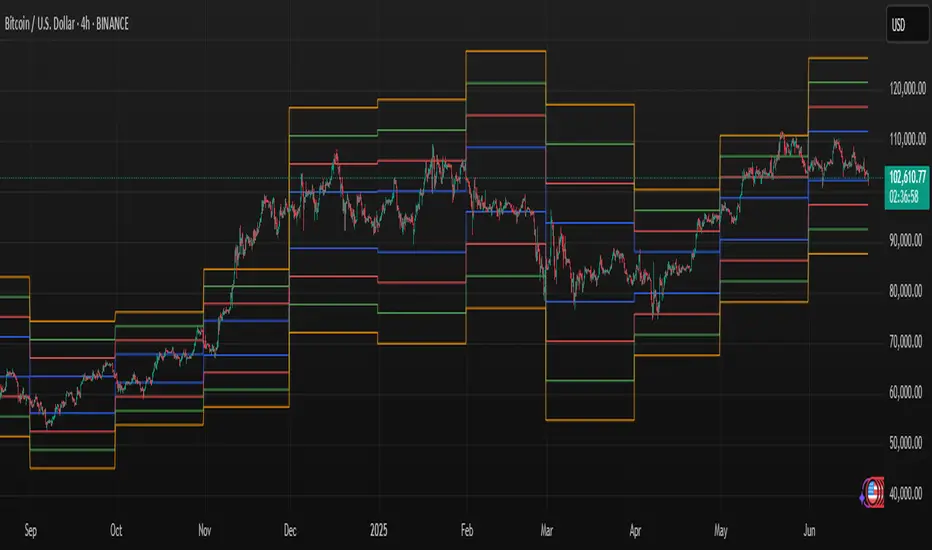
Volume Zones IndicatorVolume Zones Indicator — VWAP with Dynamic Monthly Volume Zones
This indicator is an enhanced version of the classic VWAP (Volume Weighted Average Price), designed to create clear monthly zones around VWAP based on average price range (ATR) and volume activity.
The core idea is to highlight key zones where price is more likely to reverse or consolidate, based on where significant trading volume occurs.
How does it work?
VWAP is calculated over the last N days (set by the lookbackPeriod input).
Four zones are plotted above and below VWAP, spaced using a multiple of ATR.
Each zone has its own color for clarity:
Blue — closest to VWAP
Red — second band
Green — third band
Orange — outer band (potential breakout or exhaustion zone)
If the current volume exceeds the moving average of volume, it is highlighted directly on the chart. This helps detect accumulation or distribution moments more easily.
What does the trader see?
You see horizontal colored bands on the chart that update at the start of each new month. These zones:
Remain fixed throughout the month
Automatically adjust based on recent volume and volatility
Act as dynamic support/resistance levels
Best used for:
Mean reversion strategies — identifying pullbacks toward value areas
Support and resistance mapping — automatic SR zones based on price/volume behavior
Breakout filtering — when price reaches zone 3 or 4, trend continuation or reversal is likely
Adding volume context to price action — works well with candlestick and pattern analysis
Settings
Lookback Period (Days): VWAP and volume smoothing length
Volume Area Threshold %: Reserved for future functionality
Works on any timeframe; best suited for 4H timeframe.
Zones are calculated and fixed monthly for clean visual context
Combines price structure with actual volume flow for more reliable decision-making
VWAP Predictive Breakout + RSI + OB + Trend/Chop📈 VWAP Predictive Breakout + RSI + Order Blocks + Trend/Chop Filter
This multi-layered day trading and scalping tool is designed to predict price direction after a VWAP breakout, rather than react to it. It combines volume, RSI, candlestick structure, order blocks, and trend/chop analysis to improve the accuracy of intraday signals.
🔍 Core Features
VWAP Predictive Breakout
Signals are generated when price breaks above/below VWAP with strength (volume spike + strong candle body), supported by trend confirmation.
RSI Momentum Filter
Uses RSI divergence behavior to validate breakouts, filtering out weak or exhausted moves.
Order Block Detection
Marks bullish and bearish engulfing patterns and checks for proximity to these zones as confirmation for breakouts.
Trend vs Chop Detection
Uses ADX, ATR, EMA distance, Bollinger Band width, and candlestick cleanliness to dynamically identify whether the market is trending or choppy.
Clean Candle Behavior
Filters out noisy or indecisive candles by analyzing wick-to-body ratio and ATR-based body size.
📌 Visual Markers
🟢 Buy Signal: Green triangle below bar
🔴 Sell Signal: Red triangle above bar
🟢⚪ Bullish Order Block: Green circle
🔴⚪ Bearish Order Block: Red circle
🟩 Trending Background: Light green
🟥 Choppy Background: Light red
🛎 Alerts Included
Long signal: VWAP breakout + RSI + Order Block + Clean Candle
Short signal: VWAP breakdown + RSI + Order Block + Clean Candle
🧠 Best Use Cases
Scalping high-probability VWAP reversals or continuations
Day trading in markets where trend clarity is critical
Filtering noise in sideways conditions using real-time chop detection

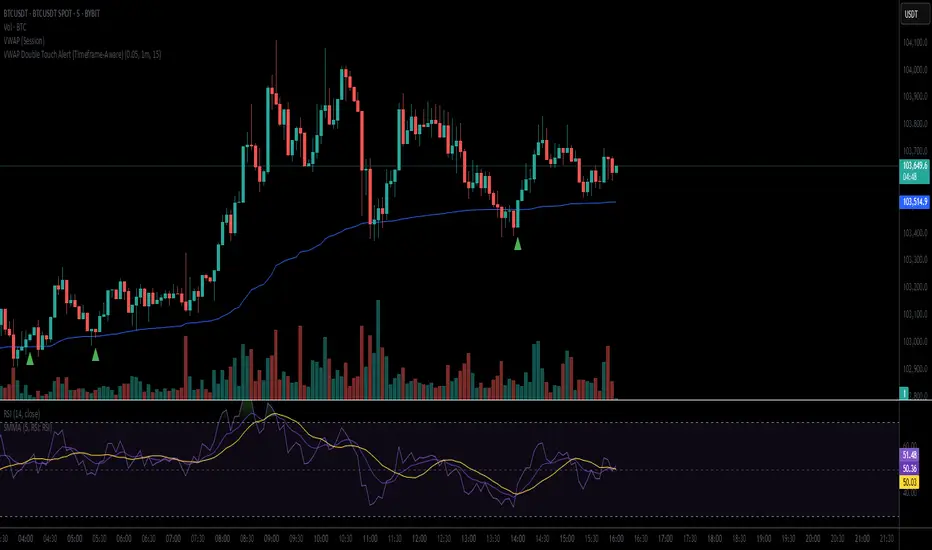
VWAP Double Touch Alert (Timeframe-Aware)📌 VWAP Double Touch Alert — Smart Re-entry Signal for Precision Traders
Take your VWAP trading to the next level with this intelligent indicator that filters out the noise and zeroes in on high-probability re-entry setups.
💡 How it works:
This script tracks every time price touches the VWAP line and alerts you when it happens twice within a defined window of time (adjustable per your timeframe). This is often a sign of smart money accumulation, potential reversals, or explosive breakouts.
🔍 Why Traders Love It:
✅ Filters out weak signals — only alerts on confirmed double touches
✅ Fully adjustable VWAP zone sensitivity
✅ Selectable timeframe profiles or custom window (1m, 5m, 15m, 30m, etc.)
✅ Clean visual cues with minimal chart clutter
✅ Perfect for scalping, intraday reversals, or VWAP mean-reversion strategies
⚙️ Customization:
VWAP zone width (in %)
Time window in bars or automatic based on timeframe
Custom alert messages
Alert only triggers once per double-touch event to avoid spamming
🎯 Best For:
Crypto scalpers & day traders
VWAP bounce and mean-reversion traders
Traders who want clean, conclusive entry alerts without lag
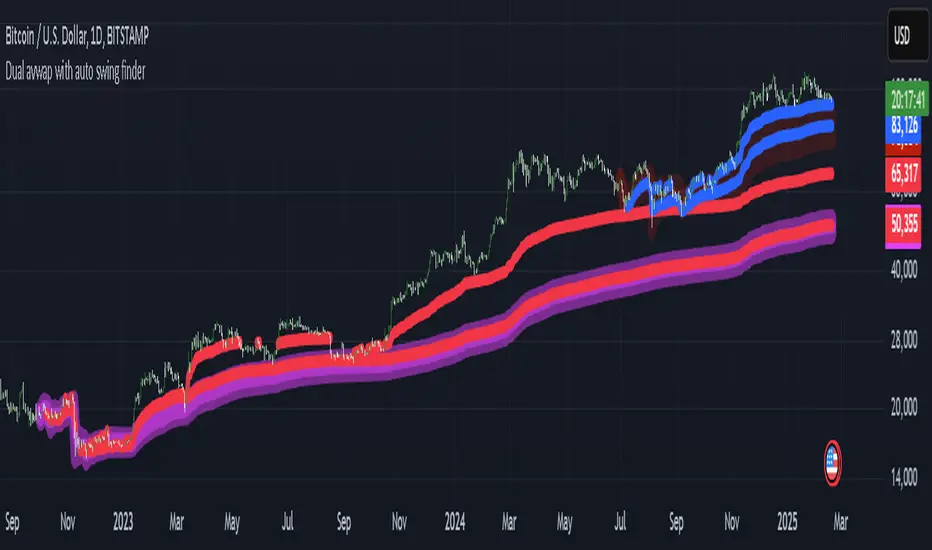
My auto dual avwap with Auto swing low/pivot low finderWelcome to My Auto Dual AVWAP with Auto Swing Low/Pivot Low Finder – an open-source TradingView indicator designed to enhance your technical analysis toolbox. This indicator is published under the Mozilla Public License 2.0 and is available for anyone to study, modify, and distribute.
Key Features
Auto Pivot/Swing Low Finder:
In addition to VWAP lines, the indicator incorporates an automatic detection mechanism for swing lows/pivot lows. This feature assists in identifying potential support areas and price reversals, further enhancing your trading strategy.
Dual VWAP Calculation with high/low range:
The indicator calculates two separate volume-weighted average price (VWAP) lines based on different price inputs (low and high prices) and defined time sessions. This allows traders to gain a more nuanced view of market activity during specific trading periods.
Customizable Time Sessions:
You can specify distinct start and end times for each VWAP calculation session. This flexibility helps you align the indicator with your preferred trading hours or market sessions, making it adaptable to various time zones and trading styles.
Easy to Customize:
With clear code structure and detailed comments, the script is designed to be accessible even for traders who want to customize or extend its functionality. Whether you're a seasoned coder or just starting out, the code is written with transparency in mind.
How It Works
Session Initialization:
The script sets up two distinct time sessions using user-defined start and end times. For each session, it detects the beginning of the trading period to reset cumulative values.
Cumulative Calculations:
During each session, the indicator accumulates the product of price and volume as well as the total volume. The VWAP is then computed as the ratio of these cumulative values.
Dual Data Sources:
Two separate data inputs (using low and high prices) are used to calculate two VWAP lines. This dual approach provides a broader perspective on market trends and can help in identifying dynamic support and resistance levels.
Visualization:
The calculated VWAP lines are plotted directly on your chart with distinct colors and thickness settings for easy visualization. This makes it simple to interpret the data at a glance.
Why Use This Indicator?
Whether you are a day trader, swing trader, or simply looking to refine your market analysis, My Auto Dual AVWAP with Auto Swing Low/Pivot Low Finder offers a robust set of features that can help you identify key price levels and improve your decision-making process. Its open-source nature invites collaboration and customization, ensuring that you can tailor it to fit your unique trading style.
Feel free to explore, modify, and share this indicator. Happy trading!
VWAP Valuation Model | JeffreyTimmermansVWAP Valuation Model
This indicator provides a powerful tool for traders looking to assess the value of an asset based on the VWAP (Volume Weighted Average Price) and the z-score. The VWAP Valuation Model is designed to give insights into the overbought or oversold condition of an asset by comparing the current price to a volume-weighted average over a defined period.
Key Features:
VWAP Baseline: The indicator calculates a volume-weighted moving average of the price, which serves as the core reference line for price analysis.
Z-Score: The z-score is calculated to determine how far the current price deviates from the mean, adjusted for volatility. This score helps identify overbought and oversold conditions.
Smoothing Option: Optionally, the indicator can be smoothed for better visualization, with the smoothing length being adjustable.
Real-time Data: The indicator provides real-time insights for multiple assets, such as Bitcoin (BTCUSD), Ethereum (ETHUSD), and Solana (SOLUSD), and can take the broader market performance (like the total crypto market) into account.
Z-Score Table: The indicator features an interactive table that provides valuable information on the z-scores of selected assets, allowing traders to quickly get an overview of market conditions. The table is strategically positioned above the chart for maximum visibility without interfering with the chart data.
Usage:
Overbought/Oversold: A z-score above +1.5 indicates overvaluation (overbought), while a score below -1.5 indicates undervaluation (oversold). This indicator helps in making informed trading decisions.
VWAP Range: The indicator offers a visual representation of the VWAP range, crucial for understanding price trends and market dynamics.
This indicator is ideal for investors interested in fundamental analysis while also needing technical insights to identify buy and sell opportunities. It helps to objectively assess market valuation and make well-informed decisions.
Important Note: This indicators works only in mean-reverting markets, not trending periods.
-Jeffrey

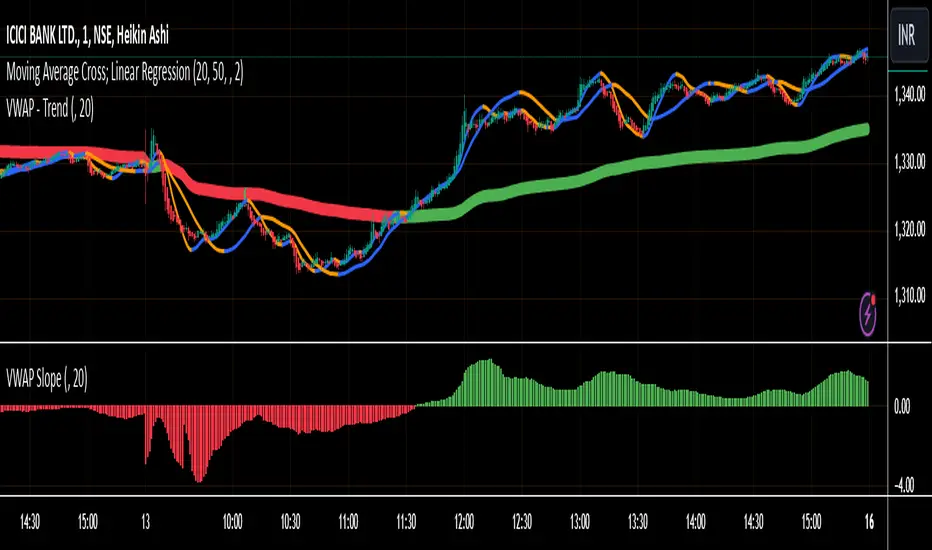
VWAP SlopeThis script calculates and displays the slope of the Volume Weighted Average Price (VWAP) . It compares the current VWAP with its value from a user-defined lookback period to determine the slope. The slope is color-coded: green for an upward trend (positive slope) and red for a downward trend (negative slope) .
Key Points:
VWAP Calculation: The script calculates the VWAP based on a user-defined timeframe (default: daily), which represents the average price weighted by volume.
Slope Determination: The slope is calculated by comparing the current VWAP to its value from a previous period, providing insight into market trends.
Color-Coding: The slope line is color-coded to visually indicate the market direction: green for uptrend and red for downtrend.
This script helps traders identify the direction of the market based on VWAP , offering a clear view of trends and potential turning points.
Derivative Oscillator Cu [ID: AC-P]The "AC-P" version of the Derivative Oscillator is my personal customized version of Constance Brown's Derivative Oscillator (using Everget's implementation of it as the base), with the the following modifications and additions:
VWAP Indication - option to show whether the price input option is above or below the Daily VWAP (red triangles = price input is below vwap, green triangles = price input is above vwap)
Bullish and Bearish phases from shayankm's Waddah Attar Explosion V2 () is included as indication dots (bullish = blue dots, bearish = yellow dots) below/above the Derivative Oscillator histogram
Coral Trend from Lazybear () is included as indication dots (red/green dots below/above the Derivative Oscillator histogram
Input source options for vwap, Waddah components (MACD, Bollinger Upper/Lower)
Centerline option for Coral trend, and Horizontal center option for the Derivative Oscillator with circle indication (optional - provided as option for flexibility in use with overlaying with other indicators)
This indicator is a hybrid, with a combination of leading indicators and lagging trending indicators combined into one. Specifically, a few of the other indicators I use are lacking in the momentum and trend department, and this is one of the indicators I use to address that:
VWAP provides trend information on lower timeframes from a high timeframe interval (D)
Coral Trend provides additional confirmation to VWAP trend wise, and is adjustable
Waddah Attar Explosion provides a third level of confirmation for trending moves, taking into account shorter and longer timeframes (FastEMA and SlowEMA parameters).
Script base for the Derivative Oscillator is credited to Everget () and LazyBear ().
Source attribution to Constance Brown for the Derivative Oscillator formula/indicator:
// Brown, Constance.
// Reference 1: “The Derivative Oscillator: a New Approach to an Old Problem,” Journal of Technical Analysis (Winter-Spring 1994) 45–61.
// Reference 2: Technical Analysis for the Trading Professional. New York, NY: McGraw-Hill, 1999.
Information on the Derivative Oscillator:
www.investopedia.com

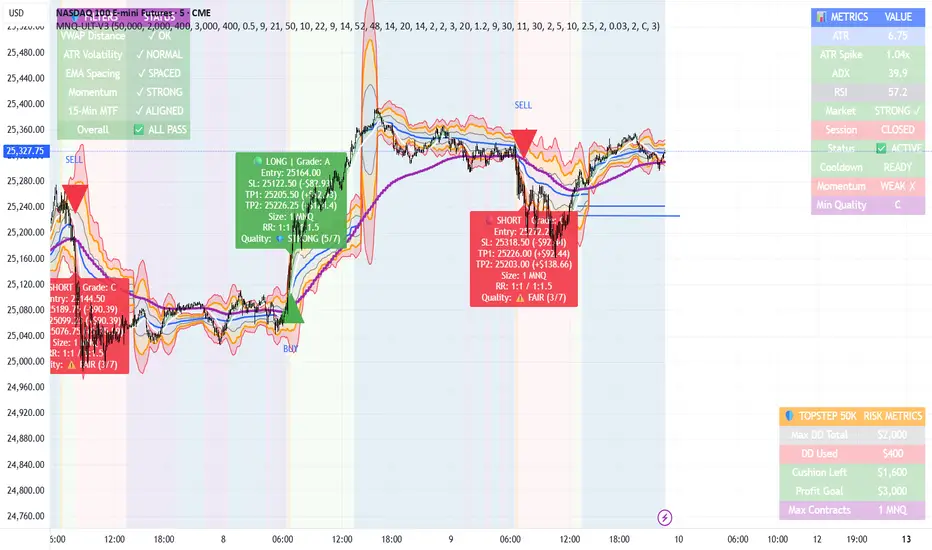
MNQ TopStep 50K | Ultra Quality v3.0MNQ TopStep 50K | Ultra Quality v3.0 - Publish Summary📊 OverviewA professional-grade trading indicator designed specifically for MNQ futures traders using TopStep funded accounts. Combines 7 technical confirmations with 5 advanced safety filters to deliver high-quality trade signals while managing drawdown risk.🎯 Key FeaturesCore Signal System
7-Point Confirmation: VWAP, EMA crossovers, 15-min HTF trend, MACD, RSI, ADX, and Volume
Signal Grading: Each signal is rated A+ through D based on 7 quality factors
Quality Threshold: Adjustable minimum grade requirement (A+, A, B, C, D)
Advanced Safety Filters (Customizable)
Mean Reversion Filter - Prevents chasing extended moves beyond VWAP bands
ATR Spike Filter - Avoids trading during extreme volatility events
EMA Spacing Filter - Ensures proper trend separation (optional)
Momentum Filter - Requires consecutive directional bars (optional)
Multi-Timeframe Confirmation - Aligns with 15-min trend (optional)
TopStep Risk Management
Real-time drawdown tracking
Position sizing calculator based on remaining cushion
Daily loss limit monitoring
Consecutive loss protection
Max trades per day limiter
Visual Components
VWAP with 1σ, 2σ, 3σ bands
EMA 9/21 with cloud fill
15-min EMA 50 for HTF trend
Comprehensive metrics dashboard
Risk management panel
Filter status panel
Detailed trade labels with entry, stops, and targets
⚙️ Default Settings (Balanced for Regular Signals)Technical Indicators
Fast EMA: 9 | Slow EMA: 21 | HTF EMA: 50 (15-min)
MACD: 10/22/9
RSI: 14 period | Thresholds: 52 (buy) / 48 (sell)
ADX: 14 period | Minimum: 20
ATR: 14 period | Stop: 2x | TP1: 2x | TP2: 3x
Volume: 1.2x average required
Session Settings
Default: 9:30 AM - 11:30 AM ET (adjustable)
Avoids first 15 minutes after market open
Customizable trading hours
Safety Filters (Default Configuration)
✅ Mean Reversion: Enabled (2.5σ max from VWAP)
✅ ATR Spike: Enabled (2.0x threshold)
❌ EMA Spacing: Disabled (can enable for quality)
❌ Momentum: Disabled (can enable for quality)
❌ MTF Confirmation: Disabled (can enable for quality)
Risk Controls
Minimum Signal Quality: C (adjustable to A+ for fewer/better signals)
Min Bars Between Signals: 10
Max Trades Per Day: 5
Stop After Consecutive Losses: 2
📈 Expected PerformanceWith Default Settings:
Signals per week: 10-15 trades
Estimated win rate: 55-60%
Risk-Reward: 1:2 (TP1) and 1:3 (TP2)
With Aggressive Settings (Min Quality = D, All Filters Off):
Signals per week: 20-25 trades
Estimated win rate: 50-55%
With Conservative Settings (Min Quality = A, All Filters On):
Signals per week: 3-5 trades
Estimated win rate: 65-70%
🚀 How to UseBasic Setup:
Add indicator to MNQ 5-minute chart
Adjust TopStep account settings in inputs
Set your risk per trade percentage (default: 0.5%)
Configure trading session hours
Set minimum signal quality (Start with C for balanced results)
Signal Interpretation:
Green Triangle (BUY): Long signal - all confirmations aligned
Red Triangle (SELL): Short signal - all confirmations aligned
Label Details: Shows entry, stop loss, take profit levels, position size, and signal grade
Signal Grade: A+ = Elite (6-7 points) | A = Strong (5) | B = Good (4) | C = Fair (3)
Dashboard Monitoring:
Top Right: Technical metrics and market conditions
Top Left: Filter status (which filters are passing/blocking)
Bottom Right: TopStep risk metrics and position sizing
⚡ Customization TipsFor More Signals:
Lower "Minimum Signal Quality" to D
Decrease ADX threshold to 18-20
Lower RSI thresholds to 50/50
Reduce Volume multiplier to 1.1x
Disable additional filters
For Higher Quality (Fewer Signals):
Raise "Minimum Signal Quality" to A or A+
Increase ADX threshold to 25-30
Enable all 5 advanced filters
Tighten VWAP distance to 2.0σ
Increase momentum requirement to 3-4 bars
For TopStep Compliance:
Adjust "Max Total Drawdown" and "Daily Loss Limit" to match your account
Update "Already Used Drawdown" daily
Monitor the Risk Panel for cushion remaining
Use recommended contract sizing
🛡️ Risk DisclaimerIMPORTANT: This indicator is for educational and informational purposes only.
Past performance does not guarantee future results
All trading involves substantial risk of loss
Use proper risk management and position sizing
Test thoroughly in paper trading before live use
The indicator does not guarantee profitable trades
Adjust settings based on your risk tolerance and trading style
Always comply with your broker's and TopStep's rules
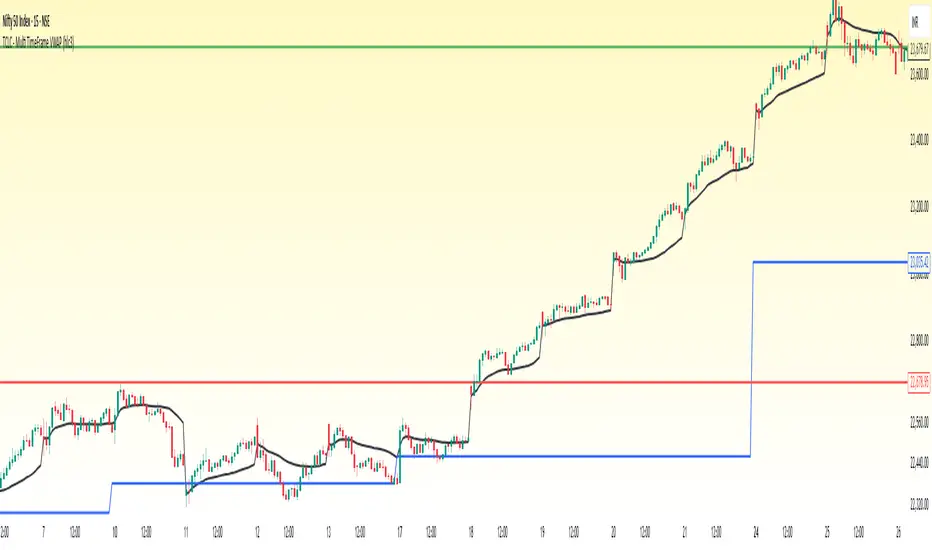
TCLC - Multi TimeFrame VWAPVWAP :
VWAP, or Volume Weighted Average Price, is a trading indicator that represents the average price of a security over a specific period, weighted by the volume of trades at each price level. It is calculated by taking the sum of the product of price and volume and dividing it by the total volume for the period. Essentially, VWAP shows the average price at which most trades occurred, giving more weight to prices with higher trading volumes.
The Indicator Plots the VWAP in Daily, WEEKLY , MONTHLY , YEARLY which helps to gauage the trend where the Volume vs Price exists....
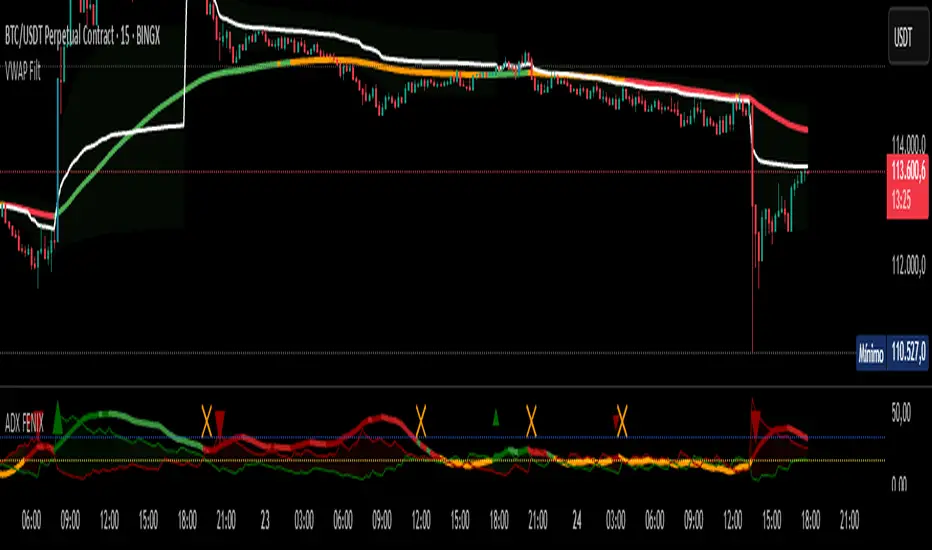
VWAP Filtrado con TendenciaThis indicator combines the classic VWAP with a trend EMA filtered by the TDFI oscillator to confirm market direction.
- VWAP is displayed in white as the fair value reference.
- The trend EMA dynamically changes color according to market condition: green (uptrend), red (downtrend), orange (range).
- Candles highlight in blue when a bullish VWAP crossover is confirmed, and in fuchsia when a bearish crossover is confirmed.
- Includes adjustable thresholds and a cooldown filter to reduce noise and improve reliability.
This approach allows traders to identify not only the relative position to VWAP but also the strength and clarity of the trend, enhancing decision-making across all timeframes.
VWAP Filtered with TrendThis indicator combines the classic **VWAP** with a trend EMA filtered by the TDFI oscillator to confirm market direction.
- VWAP is displayed in white as the fair value reference.
- The trend EMA dynamically changes color according to market condition: green (uptrend), red (downtrend), orange (range).
- Candles highlight in blue when a bullish VWAP crossover is confirmed, and in fuchsia when a bearish crossover is confirmed.
- Includes adjustable thresholds and a cooldown filter to reduce noise and improve reliability.
This approach allows traders to identify not only the relative position to VWAP but also the strength and clarity of the trend, enhancing decision-making across all timeframes.
Bitcoin Macro Oscillator | [DeV]The Bitcoin Macro Oscillator (BMO) is a sophisticated fundamental indicator designed to provide a comprehensive view of Bitcoin’s market conditions by combining four key on-chain metrics: the Market Value to Realized Value (MVRV) Ratio, Volume-Weighted Average Price (VWAP) Ratio, Cumulative Value-Days Destroyed (CVDD) Ratio, and Sharpe Ratio. These metrics are individually z-scored and weighted according to user-defined preferences, then averaged to produce a single oscillating value, the BMO Z-score. This helps users identify whether Bitcoin is in a bullish (above zero) or bearish (below zero) phase, offering insights into potential market tops, bottoms, and overall trend strength. Inspired and reverse engineered from the BMO of Woonomics, this indicator is enhanced with a customizable moving average.
Market Value to Realized Value (MVRV) Ratio
The MVRV Ratio compares Bitcoin’s current market capitalization (price multiplied by circulating supply) to its realized capitalization (the value of all coins at the price they were last moved on the blockchain). Calculated as MVRV = Market Cap / Realized Cap, it is then z-scored over a user-defined lookback period (default 120 days). This metric tracks whether Bitcoin is overvalued (high MVRV, suggesting a market top) or undervalued (low MVRV, indicating a potential bottom), providing a gauge of investor profitability and market sentiment.
Volume-Weighted Average Price (VWAP) Ratio
The VWAP Ratio measures Bitcoin’s current price against its volume-weighted average price, which is computed by summing the product of price and volume over a lookback period (default 120 days) and dividing by total volume, with a fallback to the current price if volume is zero. The ratio is z-scored to standardize it. This tracks the relationship between price and the average price paid with volume consideration, helping identify overbought or oversold conditions—high values may signal tops, while low values suggest bottoms.
Cumulative Value-Days Destroyed (CVDD) Ratio
The CVDD Ratio is based on the CVDD metric, which estimates the total value of Bitcoin that has been “destroyed” (spent at a loss) over time, approximated here using a longer-term simple moving average (SMA) of the price over twice the lookback period. The ratio is calculated as the current price divided by this CVDD price, then z-scored. It tracks the accumulation of value destruction, with low values indicating bearish exhaustion and high values suggesting bullish momentum.
Sharpe Ratio
The Sharpe Ratio assesses Bitcoin’s risk-adjusted return by comparing the average return (calculated as the natural log of the price change) to its volatility (standard deviation of returns) over a user-defined Sharpe lookback period (default 180 days). If volatility is zero, it defaults to zero to avoid errors. This z-scored value tracks whether Bitcoin’s price movements offer a favorable return for the risk taken—positive values indicate good risk-adjusted performance, while negative values suggest caution.
Together, the MVRV, VWAP, CVDD, and Sharpe Ratio metrics provide a multi-faceted view of Bitcoin’s market health, with each contributing unique insights into valuation, volume, value destruction, and risk-adjusted performance. Their weighted combination into the BMO Z-score balances these inputs to offer a unified signal, enhanced by a customizable moving average (default 90-period EMA) that smooths the Z-score for trend confirmation—rising when bullish, falling when bearish. Credit to Woonomics for inspiring this robust framework, which adapts their BMO concept into a flexible, user-tailored tool.
