Rolling Strategic AVWAPThe Rolling Strategic AVWAP gives you the ability to have the standard AVWAP indicators applied across all charts in all timeframes. There is no manual intervention necessary to keep all the standard VWAPs up to date. This indicator is written so that all weekends and trading holidays are taken into account so you never have any gaps or days where the indicator isn't working.
Standard rolling AVWAP indicators:
Daily
2-day
3-day
Week-to-Date
Month-to-Date
Year-to-Date
Additionally I have supplied several custom labeled AVWAP indicators that the user can adjust the date themselves
Custom Fixed AVWAP indicators:
Prior Week-to-Date
Prior Month-to-Date
Prior Year-to-Date
Fed rate decision
Inflation report
GDP report
Jobs report
3 more labeled Custom1-3
These custom locations will allow the user to anchor the VWAP to meaningful dates and times in the market. Often there are large moves due to global macro events that can give the trader an edge by referencing the VWAP to the date and time.
Labels and Display
There are options to turn on and off any of the AVWAPs, as well as turning on and off the display labels below the candles.
Cari dalam skrip untuk "VWAP"

Volatility Stop with Vwap StrategyFirst the credits goes to @TradingView for their release of the volatility stop mtf indicator.
I have took it, and inside I have added a weekly vwap for a better trend direction and at the same time I have added a dynamic risk managment which is calculated from the distance between the volatility line to the close of the candle.
The rules for entry are simple:
For long:We enter when our close of the candle is above the volatility stop line and at the same time the close of the candle is above weekly vwap
For short we enter when our close of the candle is below the volatility stop line and at the same time the close of the candle is below weekly vwap.
We exit when we either have a reverse signal than the one we enterred, or based on the TP/SL which is calculated with the distance from vwap to the close of the candle.
If you have any questions please let me know !

Market VWAPsIt's annoying to have to redraw the anchored VWAPs over and over, so I wrote an indicator that will create an anchored VWAP for every session and daily open.
Session times are configurable. Disable the ones in Styles that you don't need.
Enjoy!

Rumpy's Murrey Math Lines & VWAPs - (pine v4)Murrey Math lines based on weekly closes plus VWAP and pine v4 goodies. Options for adjusting label visibility and disabling vwaps individually.
--------------------------------------
If you find it useful please consider a tip/donation :
BTC - 3BMEXEDyWJ58eXUEALYPadbn1wwWKmf6sA
--------------------------------------
With only MMLs :
Bogdan Ciocoiu - Sniper EntryWhat is Sniper Entry
Sniper Entry is a set indicator that encapsulates a collection of pre-configured scripts using specific variables that enable users to extract signals by interpreting market behaviour quickly, suitable for 1-3min scalping. This instrument is a tool that acts as a confluence for traders to make decisions concerning current market conditions. This indicator does not apply solely to an asset.
What Sniper Entry is not
Sniper Entry is not interpreting fundamental analysis and will also not be providing out of box market signals. Instead, it will provide a collection of integrated and significantly improved open-source subscripts designed to help traders speculate on market trends. Traders must apply their strategies and configure Sniper Entry accordingly to maximise the script's output.
Originality and usefulness
The collection of subscripts encapsulated in this tool makes it unique in the Trading View ecosystem. This indicator enables traders to consider entry positions or exit positions by comparing similar algorithms at once.
Its usefulness also emerges from the unique configurations embedded in the indicator's settings, which are different from those of the original scripts.
This indicator's originality is also reflected in how its modules are integrated, including the integration of the settings.
Open-source reuse
I used the following open-source resources, which I simplified significantly and pre-configured for short term scalping. The source codes for the below are already in the public domain, including the following links listed below.
www.tradingview.com (open source)
(open source and generic algorithm)
www.tradingview.com (open source)
(open source)
(open source)
www.tradingview.com (generic MA algorithm and open source)
(generic VWAP algorithm and open source)

VSA - The Volume HUDVSA Volume HUD: Your At-a-Glance Volume Dashboard
Tired of cluttered charts with multiple indicators taking up screen space?
The VSA Volume HUD is a clean, powerful, and fully customisable Heads-Up Display that puts all the critical volume and price action data you need into one compact box, right on your chart.
Designed for traders who rely on Volume Spread Analysis (VSA), this tool helps you instantly gauge the strength, conviction, and context behind every price move as it happens.
Key Features
This indicator isn't just about showing the current volume; it provides a comprehensive, real-time analysis of the market's activity.
Real-time VSA Dashboard: A persistent on-screen table that updates with every tick, giving you instant feedback without needing to look away from the price. The HUD is fully draggable (hold Ctrl/Cmd + click and drag) to place it anywhere you like.
Essential Volume Metrics:
Current Volume: Displayed in a clean, abbreviated format (e.g., 1.25M for millions, 54.3K for thousands).
% Change (vs. Previous Bar): Instantly see if volume is expanding or contracting.
Vs Short-Term Average: Compare the current bar's volume to a moving average to spot unusual spikes.
Volume Velocity: Measures the rate of change in volume over a short period, helping you spot acceleration or deceleration in market interest.
Relative Volume (RVOL): See how the current volume compares to the average for that specific time of day, perfect for identifying abnormally high or low activity.
Price Action & Volatility Context:
Range vs. ATR: Quickly determine if the current bar's volatility is expanding or contracting compared to the recent average.
Price vs. VWAP: See how far the current price has deviated from the session's Volume-Weighted Average Price, a key level for institutional traders.
Deep Customization is Key
Tailor the HUD to perfectly match your trading style and chart aesthetic.
Display & Layout:
Compact Mode: Remove the metric labels for a sleek, minimalist view that saves screen space.
Bar Meters: Enable optional visual bars next to key metrics for a quick, graphical representation of strength.
Total Control: Toggle every single metric on or off to build the exact dashboard you need. Adjust text size, position, and background opacity with ease.
Smart Coloring & Visual Alerts:
Advanced VSA Coloring: This isn't just about up/down candles. The script intelligently colors volume based on confluence. It highlights increasing volume on a strong up-bar (bullish confirmation) or increasing volume on a down-bar (potential climax or distribution), giving you a deeper VSA context.
High Volume Highlight: Make standout bars impossible to miss! The entire HUD background can change color automatically when volume surges past a custom threshold (e.g., over 150% of the average), instantly drawing your attention to critical moments.
Full Color Customization: Change every color to match your chart's theme, including separate colors for bullish/bearish moves, the background, and the border.
How to Use It
The VSA Volume HUD is a powerful confirmation tool. Use it to:
Confirm Breakouts: Look for a spike in Volume vs. Average and RVOL as price breaks a key level.
Spot Exhaustion: Notice high volume on a narrow-range candle after a long trend, visible through the Range/ATR metric.
Gauge Conviction: Use the Advanced Coloring to see if volume is supporting the price move (e.g., green volume on a green candle) or diverging from it.

Easy MA SignalsEasy MA Signals
Overview
Easy MA Signals is a versatile Pine Script indicator designed to help traders visualize moving average (MA) trends, generate buy/sell signals based on crossovers or custom price levels, and enhance chart analysis with volume-based candlestick coloring. Built with flexibility in mind, it supports multiple MA types, crossover options, and customizable signal appearances, making it suitable for traders of all levels. Whether you're a day trader, swing trader, or long-term investor, this indicator provides actionable insights while keeping your charts clean and intuitive.
Configure the Settings
The indicator is divided into three input groups for ease of use:
General Settings:
Candlestick Color Scheme: Choose from 10 volume-based color schemes (e.g., Sapphire Pulse, Emerald Spark) to highlight high/low volume candles. Select “None” for TradingView’s default colors.
Moving Average Length: Set the MA period (default: 20). Adjust for faster (lower values) or slower (higher values) signals.
Moving Average Type: Choose between SMA, EMA, or WMA (default: EMA).
Show Buy/Sell Signals: Enable/disable signal plotting (default: enabled).
Moving Average Crossover: Select a crossover type (e.g., MA vs VWAP, MA vs SMA50) for signals or “None” to disable.
Volume Influence: Adjust how volume impacts candlestick colors (default: 1.2). Higher values make thresholds stricter.
Signal Appearance Settings:
Buy/Sell Signal Shape: Choose shapes like triangles, arrows, or labels for signals.
Buy/Sell Signal Position: Place signals above or below bars.
Buy/Sell Signal Color: Customize colors for better visibility (default: green for buy, red for sell).
Custom Price Alerts:
Custom Buy/Sell Alert Price: Set specific price levels for alerts (default: 0, disabled). Enter a non-zero value to enable.
Set Up Alerts
To receive notifications (e.g., sound, popup, email) when signals or custom price levels are hit:
Click the Alert button (alarm clock icon) in TradingView.
Select Easy MA Signals as the condition and choose one of the four alert types:
MA Crossover Buy Alert: Triggers on MA crossover buy signals.
MA Crossover Sell Alert: Triggers on MA crossover sell signals.
Custom Buy Alert: Triggers when price crosses above the custom buy price.
Custom Sell Alert: Triggers when price crosses below the custom sell price.
Enable Play Sound and select a sound (e.g., “Bell”).
Set the frequency (e.g., Once Per Bar Close for confirmed signals) and create the alert.
Analyze the Chart
Moving Average Line: Displays the selected MA with color changes (green for bullish, red for bearish, gray for neutral) based on price position relative to the MA.
Buy/Sell Signals: Appear as shapes or labels when crossovers or custom price levels are hit.
Candlestick Colors: If a color scheme is selected, candles change color based on volume strength (high, low, or neutral), aiding in trend confirmation.
Why Use Easy MA Signals?
Easy MA Signals is designed to simplify technical analysis while offering advanced customization. It’s ideal for traders who want:
A clear visualization of MA trends and crossovers.
Flexible signal generation based on MA crossovers or custom price levels.
Volume-enhanced candlestick coloring to identify market strength.
Easy-to-use settings with tooltips for beginners and pros alike.
This script is particularly valuable because it combines multiple features into one indicator, reducing chart clutter and providing actionable insights without overwhelming the user.
Benefits of Easy MA Signals
Highly Customizable: Supports SMA, EMA, and WMA with adjustable lengths.
Offers multiple crossover options (VWAP, SMA10, SMA20, etc.) for tailored strategies.
Custom price alerts allow precise targeting of key levels.
Volume-Based Candlestick Coloring: 10 unique color schemes highlight volume strength, helping traders confirm trends.
Adjustable volume influence ensures adaptability to different markets.
Flexible Signal Visualization: Choose from various signal shapes (triangles, arrows, labels) and positions (above/below bars).
Customizable colors improve visibility on any chart background.
Alert Integration: Built-in alert conditions for crossovers and custom prices support sound, email, and app notifications.
Easy setup for real-time trading decisions.
User-Friendly Design: Organized input groups with clear tooltips make configuration intuitive.
Suitable for beginners and advanced traders alike.
Example Use Cases
Swing Trading with MA Crossovers:
Scenario: A trader wants to trade Bitcoin (BTC/USD) on a 4-hour chart using an EMA crossover strategy.
Setup:
Set Moving Average Type to EMA, Length to 20.
Set Moving Average Crossover to “MA vs SMA50”.
Enable Show Buy/Sell Signals and choose “arrowup” for buy, “arrowdown” for sell.
Select “Emerald Spark” for candlestick colors to highlight volume surges.
Usage: Buy when the EMA20 crosses above the SMA50 (green arrow appears) and volume is high (dark green candles). Sell when the EMA20 crosses below the SMA50 (red arrow). Set alerts for real-time notifications.
Scalping with Custom Price Alerts:
Scenario: A day trader monitors Tesla (TSLA) on a 5-minute chart and wants alerts at specific support/resistance levels.
Setup:
Set Custom Buy Alert Price to 150.00 (support) and Custom Sell Alert Price to 160.00 (resistance).
Use “labelup” for buy signals and “labeldown” for sell signals.
Keep Moving Average Crossover as “None” to focus on price alerts.
Usage: Receive a sound alert and label when TSLA crosses 150.00 (buy) or 160.00 (sell). Use volume-colored candles to confirm momentum before entering trades.
When NOT to Use Easy MA Signals
High-Frequency Trading: Reason: The indicator relies on moving averages and volume, which may lag in ultra-fast markets (e.g., sub-second trades). High-frequency traders may need specialized tools with real-time tick data.
Alternative: Use order book or market depth indicators for faster execution.
Low-Volatility or Sideways Markets:
Reason: MA crossovers and custom price alerts can generate false signals in choppy, range-bound markets, leading to whipsaws.
Alternative: Use oscillators like RSI or Bollinger Bands to trade within ranges.
This indicator is tailored more towards less experienced traders. And as always, paper trade until you are comfortable with how this works if you're unfamiliar with trading! We hope you enjoy this and have great success. Thanks for your interested in Easy MA Signals!

Bank Nifty ScalpingThis indicator is designed for scalping purposes.
Users have the option to input the desired source and enable or disable the following indicators:
Multiple EMA (Exponential moving average)
Simultaneously displays multiple moving averages to quickly identify shifts in momentum and obtain confirmation from slower-moving averages.
By default, the EMA display settings are configured to show the 20-day EMA and the 200-day EMA. However, users have the flexibility to modify the display settings according to their preferences. This means that users can customize the indicator to show the EMA values of their choice, such as EMA 50 and EMA 100.
VWAP ( Volume weighted average price )
Default value is set to ‘hl2’
A bullish trend is indicated when the price is above the Volume Weighted Average Price (VWAP), while a bearish trend is indicated when the price is below the VWAP.
VWMA ( Volume weighted moving average )
In the VWMA (Volume Weighted Moving Average) indicator, a default value of 20 is used. If the price is higher than the VWMA, it typically indicates a bullish trend. Conversely, if the price is lower than the VWMA, it suggests a bearish trend. The VWMA takes into account both price and volume, providing a weighted average that can help identify shifts in market sentiment.
Multiple SuperTrends
Default value is 10 and 2 / 10 and 3
A bullish trend is identified when the price is above the SuperTrend indicator, whereas a bearish trend is observed when the price is below the SuperTrend indicator.
Camarilla Pivot Points (Level 3 and 4 only)
Levels 3 and 4 serve as crucial support and resistance levels, acting as the final line of defense against strong trends. These levels are expected to generate reversals, where price often changes direction.
CPR ( Central Pivot Points)
The Daily Central Pivot Point Indicator is a popular tool used in technical analysis. It calculates several levels based on the previous day's high, low, and closing prices.
Strong Volume
The user has the ability to set the average volume for Nifty and BankNifty indices to calculate strong volume.
Elder Impulse System
The Impulse System, developed by Alexander Elder and discussed in his book "New Trading for a Living," is a censorship trading system designed to determine whether a trade should be allowed or prohibited. Additionally, it can be used to identify when a trend is starting to weaken. The Impulse System relies on the following factors:
1. Slope of a Fast Exponential Moving Average (EMA): The fast EMA's slope reflects the price's inertia or momentum.
2. Slope of the Moving Average Convergence Divergence (MACD): The MACD's slope indicates the strength or power of the price movement.
Based on these factors, the Impulse System categorizes candles or price bars into three colors:
* Green Candle: When both the fast EMA and MACD are rising, indicating upward momentum.
* Red Candle: When both the fast EMA and MACD are declining, suggesting downward momentum.
* Blue Candle: In all other cases where the conditions for green or red candles are not met, representing a neutral or uncertain market condition.
By applying the Impulse System, traders can gain insights into the market trend, its strength, and potential shifts in momentum, helping them make informed trading decisions.
Happy Trading

Distância Preço vs VWAPIt calculates the distance from the price to the VWAP. The idea is to make it easier to observe when the price might return to the VWAP.

Above VWAP (Y/N)Background-only overlay script.
It does not plot VWAP, does not draw any lines, and exists only to color the chart background based on above / below VWAP.

AggBands (v1) [qrsq]The "AggBands" indicator is a custom trading indicator designed to provide a consolidated view of the price action across multiple assets or trading pairs. It combines the price data from multiple tickers and calculates an aggregated price using user-defined weights for each ticker.
The indicator starts by defining the tickers to be included in the aggregation. You can choose from predefined configurations such as "BTC PAIRS," "CRYPTO TOTAL MARKET CAP," "TOP 5 PAIRS," "TOP 5 MEMECOINS," "SPX," "DXY," or "FANG." Each configuration includes specific tickers or indices relevant to the chosen category.
The indicator then fetches the closing, high, and low prices for each ticker and applies the user-defined weights to calculate the aggregated prices. The aggregated prices are normalized within a specified length to provide a consistent scale across different assets or pairs.
Next, the indicator calculates the midpoint, which is the average of the highest high and lowest low of the aggregated prices over a specified aggregation period.
To assess the volatility, the indicator calculates the price range and applies the Average True Range (ATR) indicator to determine the volatility value. The standard deviation is then computed using the price range and aggregation period, with an additional scaling factor applied to the volatility value.
Based on the standard deviation, the indicator generates multiple bands above and below the midpoint. By default, three standard deviation bands are calculated, but the user can choose between one and five bands. The upper and lower bands are smoothed using various moving average (MA) types, such as Simple Moving Average (SMA), Exponential Moving Average (EMA), Smoothed Moving Average (SMMA/RMA), Weighted Moving Average (WMA), Volume Weighted Moving Average (VWMA), Volume Weighted Average Price (VWAP), or Arnaud Legoux Moving Average (ALMA). The user can also adjust the length, offset, and sigma parameters for the moving averages.
The indicator can optionally smooth the midpoint, upper bands, and lower bands using a separate set of moving average parameters.
The indicator can be useful for traders and analysts who want to gain a consolidated view of price movements across multiple assets or trading pairs. It helps identify trends, volatility, and potential support and resistance levels based on the aggregated price and standard deviation bands. Traders can use this information to make informed decisions about trading strategies, risk management, and market analysis.

rth vwapPlots the RTH (regular trading hours) VWAP. This is intended for instruments with volume only and mostly for futures. Time zone is set to EST, but start and end times of the VWAP can be configured. Standard setting is set to US equity index futures regular trading hours of 9:30 EST to 16:00 EST.

VWOP: Volume Weighted & Oscillated PriceWhile playing around with the standard "ta.vwap" I wondered why there was no length input, so I did some research on what the underlying calculation actually is, and did my best to augment it so as to allow for a variable length based on an oscillator value.
Normal VWAP = (Number of Shares Bought x Typical Price) / Total Volume
In my VWOP Calculation, typical price is replaced by selected moving average type or "matype" and then multiplied by the volume.
Then a total value is calculated using math.sum with a length value that changes according to a selected oscillator's value. The total is then divided by
the sum of just volume using the same oscillating length value. Result is then passed through the selected"matype" once more to give the final result.
Indicator designed for use as a entry/exit indicator in conjunction with more traditional moving averages and/or signal filters. Useful for taking volume + an oscillator into account along with price, instead of just the price as with a simple moving average.

UV IndicatorUV Indicator (Ultimate VWAP Indicator) is using Volume Weighted Average Price to find Direction of the Trend, and Resistance & Support.
- Circle and Square shapes represent the point of Resistance and Support.
- Teal and Maroon background colors represent Uptrend and Downtrend of the Market.
- Numbers represent the Spread Percentages.

The Systemtable viewed bullish/bearish indicator. uses 9 & 20 ema crossings along with macd & rsi to identify the bullish/bearish trend. ability to toggle vwaps + emas.
Goal to consolidate the various indicators for users that don't pay for premium ++

Daytrading Suite: Neon TPO + FVG v6.1Here is the summary of the code and the trading guide in English.
---
### 1. Code Summary: What does the chart show?
The script combines three dimensions of trading into a single chart:
* **The Context (TPO / Market Profile - Yesterday):**
* **Gold Zone (Center):** Yesterday's **POC (Point of Control)**. This was the "fairest price". It often acts as a magnet.
* **White Dashed Lines:** The **VAH (Value Area High)** and **VAL (Value Area Low)**. Yesterday, 70% of all trading volume happened between these lines. This is the area of "Balance".
* **The Structure (HTF - 1 Hour+):**
* **Red/Green Boxes (Right Edge):** Automatic **Supply & Demand Zones** based on the 1-hour chart (or your setting). They indicate major resistance and support levels.
* **The Timing (Entries):**
* **Neon FVG Boxes (Small):** "Fair Value Gaps". These represent imbalances in price. If price revisits these, it is often your **entry signal**.
* **Lines (VWAP, EMA, PDH/PDL):** Act as dynamic support and trend indicators.
---
### 2. Trading Strategy: How to use it
Do not just trade every colored spot. You must combine **Location (TPO)** with **Signal (FVG)**.
#### Step A: The Open (Where are we?)
In the morning (or at the US Open), check where the price is relative to the **white TPO lines**.
1. **Inside the White Lines (In Balance):**
* The market is undecided. Expect ranging/choppy behavior.
* **Strategy:** Buy at the bottom edge (VAL), Sell at the top edge (VAH). The target is often the Gold Zone (POC) in the middle.
2. **Outside the White Lines (Imbalance):**
* The market is seeking new prices. Danger of a Trend!
* **Strategy:** If price breaks above VAH and tests it from above -> **Long**. If it breaks below VAL -> **Short**.
#### Step B: The Setup (The High Probability Scenario)
Here is the "Rejection" Setup (Long Example):
1. Price drops to the lower white line (**VAL**) or into a green **Demand Zone**.
2. It bounces (shows a wick).
3. In the process, a small **green Neon FVG** is formed.
4. **Entry:** Limit Order at the top of the Neon FVG.
5. **Target:** The Gold Zone (POC) or the upper white line (VAH).
6. **Stop Loss:** Below the recent swing low.
#### Step C: Warning Signals (When NOT to trade)
* **In "No Man's Land":** If the price is sitting right in the middle between Gold (POC) and White (VAH/VAL), do nothing. The risk is 50/50. Wait until price hits an edge.
* **Against the Flow:** If EMA 9 and 21 are pointing steeply downwards, do not buy blindly at the VAL just because the line is there. Wait for confirmation (FVG).
### Pre-Trade Checklist:
1. **Level:** Am I at a white line (VAH/VAL) or the Gold Zone (POC)?
2. **Structure:** Do I have an HTF Demand/Supply Zone backing me up?
3. **Trigger:** Do I see a Neon FVG pointing in my direction?

SMAs TimePortalPlots 5× SMAs from 3 different timeframes - plus current chart timeframe
Plots 2× VWAPs with bands.
Meant for personal use, but maybe you can find it useful too.
Disclaimer: Beware I might update this with big changes in the future.

Periodic Moving AveragesIndicator plots three simple moving averages (MA) that are reset at the beginning of period, specified by a user.
Red MA is based on highs
Blue MA is based on close
Green MA one is based on lows.
Moving averages often act as support /resistance levels. They can also help to identify intraday trend. It is important to realize that none of the moving averages is universal as price behavior changes from day to day. On the chart I’ve highlighted several occurrences when one of MAs (different ones) provided support for price.
Parameters:
PERIOD – period for which MAs are plotted. They are reset at the beginning of each period. Period cannot be lower than chart’s timeframe
LENGTH – length of moving averages. If set to 0 then parameter is ignored and MAs are calculated on all bars, available in the period
VWAP? – if checked then moving averages will be calculated as volume weighted price
Disclaimer
This indicator should not be used as a standalone tool to make trading decisions but only in conjunction with other technical analysis methods.


Institutional Rolling VWAPs • 3 lines Institutional Rolling VWAPs • 3 lines + editable σ bands. 3 x modifiable vwaps, time anchored, same for ltf and htf

Multiple Moving Averages, Bollinger Bands, VWAP Options - Lett5 simple moving averages.
You decide:
1. The type of moving average
2. The length of the moving average
3. To show Bollinger Bands
4. To show VWAP.
Crossover Alerts for Yesterday O/H/L/C , Today Vwap [Zero54]This is a very simple script/indicator that trigger alerts every time the script triggers the following conditions.
1) Script crosses yesterday's (previous day's) high
2) Script crosses yesterday's (previous day's) low
3) Script crosses yesterday's (previous day's) open
4) Script crosses yesterday's (previous day's) close
5) Script crosses today's vwap.
I developed this to keep track of the scripts I follow and I find it useful. Hope you will find it useful too.
Steps to use:
1) Open the ticker for which you want to set the alerts.
2) Add this indicator to the chart.
3) Right Click on the text and set choose "Add Alert"
4) After you have done with setting up the alert, feel free to remove the indicator from the chart. It is not necessary for the indicator to be added in the chart in order for it to work.
5) Repeat 1-4 for all the scripts for which you want to set the alerts.
Be advised: During market open, if you have set alerts for multiple scripts, a tsunami of alerts may be triggered.
If you like this alert indicator, please like/boost it. Feel free to re-use this code however you may wish to. Cheers!

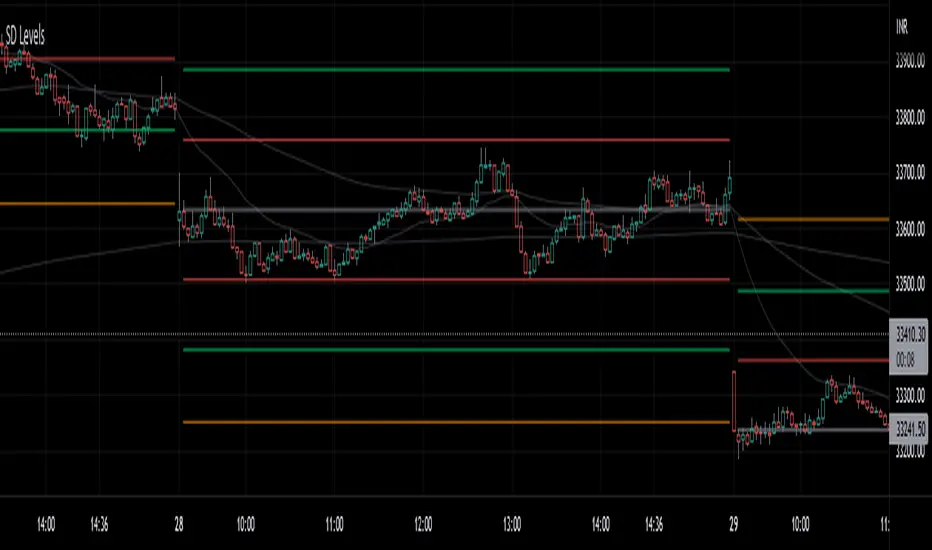
SD LevelsSD Levels is an indicator for the gap-up gap down markets
Works best on 5minute and lower time frames.
Involves standard deviation levels, Emas and Vwap.
Colorful lines are standard deviation levels which are +0.33,-0.33,+0.66,-0.66,+1.00 and -1.00 based.
Static Gray line is settlement line based on the first candle of the day and the tf you choose (default source OHLC4, also works good on close source)