Dynamic Trend Indicator (DTI) - VWAP FilterThe Dynamic Trend Indicator (DTI) with VWAP Filter is a trend-following indicator.
It aims to identify and follow market trends while minimizing false signals in choppy or ranging markets.
The DTI combines a dynamically adjusted Exponential Moving Average (EMA) with a daily Volume Weighted Average Price (VWAP) confirmation filter and a cooldown mechanism to enhance signal reliability. This indicator is particularly useful for traders on intraday timeframes (e.g., 4-hour charts) who want to align their trades with the broader daily trend while avoiding whipsaws.
Key Features:
Dynamic Trend Line:
The core of the DTI is a trend line calculated using a custom EMA that adjusts its period dynamically based on market conditions.
The period of the EMA is determined by a combination of volatility (measured via ATR) and trend strength (measured via price momentum). In strong trends, the period shortens for faster responsiveness; in weak or ranging markets, it lengthens to reduce noise.
An optional smoothing EMA can be applied to the dynamic trend line to further reduce noise, with a user-defined smoothing length.
Daily VWAP Confirmation Filter:
A daily VWAP is calculated to provide a higher-timeframe trend bias. VWAP represents the average price paid for an asset during the day, weighted by volume, and is often used as a benchmark by institutional traders.
Buy signals are only generated when the price is above the daily VWAP (indicating a bullish daily bias), and sell signals are only generated when the price is below the VWAP (indicating a bearish daily bias).
The VWAP resets at the start of each day, ensuring it reflects the current day’s trading activity.
Cooldown Mechanism:
To prevent rapid signal reversals (whipsaws), the indicator includes a cooldown period between signals. After a buy or sell signal is generated, no new signals can be generated for a user-defined number of bars (default: 5 bars).
This helps filter out noise in choppy markets, ensuring signals are spaced out and more likely to align with significant trend changes.
Visual Elements:
Trend Line: Plotted on the chart, colored green when the price is above (uptrend) and red when below (downtrend). A gray color indicates a neutral trend.
Buy/Sell Signals: Displayed as green triangles below the bar for buy signals and red triangles above the bar for sell signals.
Background Coloring: The chart background is shaded green during uptrends and red during downtrends, providing a quick visual cue of the trend direction.
Daily VWAP Line: Optionally plotted as a purple step line, allowing traders to see the VWAP level and its relationship to the price.
Alerts:
The indicator includes built-in alerts for buy and sell signals, triggered when the price crosses the trend line and satisfies the VWAP filter and cooldown conditions.
Alert messages specify whether the signal is a buy or sell and confirm that the VWAP condition was met (e.g., "DTI Buy Signal: Price crossed above trend line and VWAP").
Input Parameters
Base Length (default: 14): The base period for calculating volatility and trend strength, used to adjust the dynamic EMA period.
Volatility Multiplier (default: 1.5): Adjusts the sensitivity of the dynamic period to market volatility (via ATR).
Trend Threshold (default: 0.5): Controls the sensitivity of the dynamic period to trend strength (via price momentum).
Use Smoothing (default: true): Enables/disables smoothing of the trend line with an additional EMA.
Smoothing Length (default: 3): The period for the smoothing EMA, if enabled.
Cooldown Bars (default: 5): The minimum number of bars between consecutive signals, reducing signal frequency in choppy markets.
Show Daily VWAP (default: true): Toggles the display of the daily VWAP line on the chart.
How It Works
Dynamic Trend Line Calculation:
Volatility is measured using the Average True Range (ATR) over the base length, scaled by the volatility multiplier.
Trend strength is calculated as the absolute price momentum (change in price over the base length) divided by the volatility factor.
The dynamic EMA period is adjusted based on the trend strength: stronger trends result in a shorter period (faster response), while weaker trends result in a longer period (more stability). The period is constrained between 5 and 50 to avoid extreme values.
A custom EMA function is used to handle the dynamic period, as Pine Script’s built-in ta.ema() requires a fixed length. The trend line is optionally smoothed with a secondary EMA.
Signal Generation:
A buy signal is generated when the price crosses above the trend line, the price is above the daily VWAP, and the cooldown period has elapsed.
A sell signal is generated when the price crosses below the trend line, the price is below the daily VWAP, and the cooldown period has elapsed.
The cooldown mechanism ensures that signals are not generated too frequently, reducing false signals in ranging markets.
Daily VWAP Calculation:
The VWAP is calculated by accumulating the price-volume product (close * volume) and total volume for the day, resetting at the start of each new day.
The VWAP is then computed as the cumulative price-volume divided by the cumulative volume, providing a volume-weighted average price for the day.
Usage
Timeframe: Best suited for intraday timeframes (e.g., 1-hour, 4-hour) where the daily VWAP provides a higher-timeframe trend bias. It can also be used on daily charts with adjustments to the cooldown period.
Markets: Works well in trending markets (e.g., forex, crypto, stocks) where the dynamic trend line can capture sustained price movements. The VWAP filter helps align signals with the daily trend, making it effective for assets with clear daily biases.
Trading Strategy:
Buy: Enter a long position when a green triangle (buy signal) appears, indicating the price has crossed above the trend line and is above the daily VWAP.
Sell: Enter a short position (or exit a long) when a red triangle (sell signal) appears, indicating the price has crossed below the trend line and is below the daily VWAP.
Use the trend line and VWAP as dynamic support/resistance levels to set stop-losses or take-profit targets.
Backtesting: Use TradingView’s strategy tester to evaluate the indicator’s performance on your chosen market and timeframe, adjusting parameters like cooldown_bars and volatility_mult to optimize for profitability.
Example
On a 4-hour SOLUSDT chart, the DTI with VWAP Filter might show:
An uptrend with the price above the green trend line and above the daily VWAP, generating buy signals as the price continues to rise.
A downtrend where the price falls below the red trend line and the daily VWAP, generating sell signals that align with the bearish daily bias.
During choppy periods, the cooldown mechanism and VWAP filter reduce false signals, ensuring trades are taken only when the price aligns with the daily trend.
Limitations
Lagging Nature: Like all trend-following indicators, the DTI may lag during sharp price reversals, as the dynamic EMA needs time to adjust.
Ranging Markets: While the VWAP filter and cooldown mechanism reduce whipsaws, the indicator may still generate some false signals in strongly ranging markets. Combining it with a trend strength filter (e.g., ADX) can help.
VWAP Dependency: The effectiveness of the VWAP filter depends on the market’s respect for the daily VWAP as a support/resistance level. In markets with low volume or erratic price action, the VWAP may be less reliable.
Potential Improvements
VWAP Buffer: Add a percentage buffer around the VWAP (e.g., require the price to be 1% above/below) to further reduce noise.
Multi-Timeframe VWAP: Incorporate a weekly VWAP for additional trend confirmation on longer timeframes.
Trend Strength Filter: Add an ADX filter to ensure signals are generated only during strong trends (e.g., ADX > 25).
Cari dalam skrip untuk "VWAP"

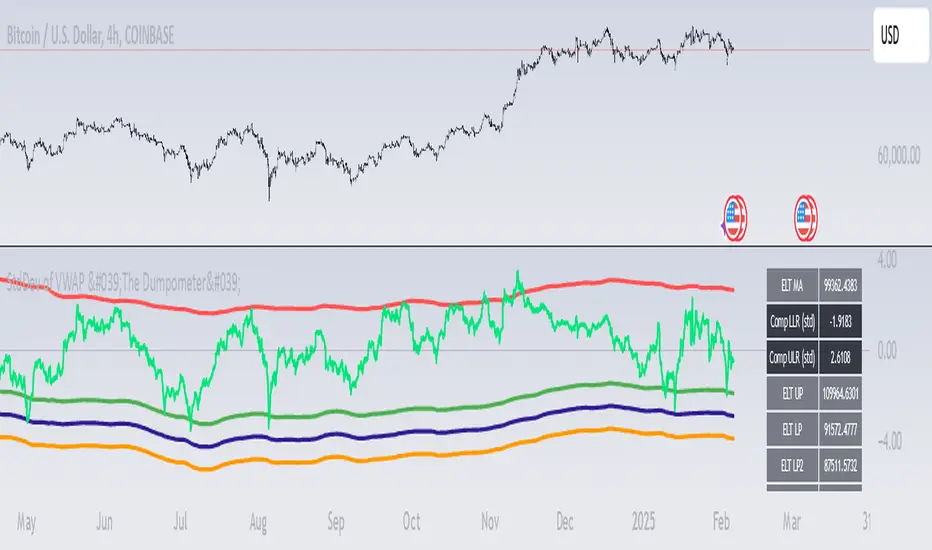
StdDev of VWAP/MAStdDev Indicator (MA, Smoothed VWAP & Rolling VWAP) v5
Overview: The StdDev Indicator is a comprehensive tool designed to provide traders with multi-term deviation analysis by integrating various Moving Averages (MA) and Volume Weighted Average Price (VWAP) methodologies. This indicator combines different MA types and VWAP calculations across multiple timeframes to offer a nuanced view of market volatility and trend strength.
Key Features:
Multiple Moving Average Types:
Simple Moving Average (SMA): Calculates the average price over a specified period, providing a straightforward trend indicator.
Exponential Moving Average (EMA): Gives more weight to recent prices, making it more responsive to new information.
Weighted Moving Average (WMA): Assigns different weights to each price point, emphasizing specific periods.
Smoothed VWAP: Enhances the traditional VWAP by applying additional smoothing techniques (SMA, EMA, WMA) to reduce volatility.
Rolling VWAP: Continuously recalculates VWAP over a rolling window, offering dynamic support and resistance levels.
Multi-Term Deviation Analysis:
Extra Short Term (30 periods)
Short Term (50 periods)
Medium Term (110 periods)
Long Term (125 periods)
Extra-Long Term (190 periods)
Extremely-Long Term (245 periods)
Each term calculates the deviation of the selected price source (default: Low) from its corresponding MA or VWAP, normalized by the standard deviation. This multi-term approach allows traders to assess volatility and trend consistency across different time horizons.
Composite Upper and Lower Bounds:
Aggregates the upper and lower deviations from all terms to form composite boundaries. These bounds serve as dynamic support and resistance levels, helping traders identify potential reversal points or breakout zones.
Timeframe Customization:
Visibility Settings: Customize which deviation terms are visible on specific timeframes (15m, 1h, 4h, 1d, 1w). This flexibility ensures that the indicator aligns with your trading strategy, whether you're a scalper, day trader, or long-term investor.
Bar Coloring (Optional):
Visual Cues: When enabled, bars are color-coded based on the deviation levels, providing immediate visual feedback on market conditions. For example, bars may turn red when short-term deviations exceed the upper bound, indicating potential overbought conditions.
How It Works:
Deviation Calculation:
For each selected MA or VWAP type and term length, the indicator calculates the deviation of the current price source from the MA/VWAP. This deviation is normalized by the standard deviation to account for volatility.
Channel Offset:
Applies a linear regression and standard deviation to the deviation series to establish upper and lower channels. These channels are adjustable via multipliers, allowing traders to set their sensitivity levels.
Composite Boundaries:
Averages the upper and lower channels across all deviation terms to form composite upper and lower bounds. These bounds provide a holistic view of market volatility and trend strength.
Visualization:
Plots individual deviation lines for each term, along with the composite bounds. Optional bar coloring enhances visual interpretation, making it easier to spot significant market movements.
Usage Instructions:
Setup:
Add the StdDev Indicator to your TradingView chart. By default, it uses the Low price as the source, but this can be customized.
Configuration:
Moving Average Type: Select your preferred MA or VWAP type from the dropdown menu.
Term Lengths: Adjust the lengths for each deviation term as per your trading strategy.
StdDev Multipliers: Set the multipliers for the upper and lower bounds to control sensitivity.
Timeframe Visibility: Choose which deviation terms are visible on specific timeframes to tailor the indicator to your trading style.
Bar Coloring: Enable or disable bar coloring based on deviation thresholds for enhanced visual cues.
Interpretation:
Deviations: Monitor the deviation lines to assess overbought or oversold conditions across different terms.
Composite Bounds: Use the upper and lower bounds as dynamic support and resistance levels.
Bar Colors: Quickly identify significant market movements through color-coded bars.
Why Choose StdDev Indicator?
Comprehensive Analysis: By integrating multiple MA and VWAP types across various terms, the indicator offers a multifaceted view of market conditions.
Customization: Highly configurable settings allow traders to adapt the indicator to their specific strategies and timeframes.
Visual Clarity: Clear plotting and optional bar coloring provide intuitive insights, reducing the need for complex analysis.
Conclusion: The StdDev Indicator (MA, Smoothed VWAP & Rolling VWAP) v5 is a versatile tool that combines advanced moving average and VWAP methodologies to deliver a robust deviation analysis framework. Whether you're looking to fine-tune your scalping strategy or gain a deeper understanding of long-term market trends, this indicator equips you with the necessary tools to make informed trading decisions.
Support & Feedback: If you have any questions or need assistance with the indicator, feel free to reach out through the TradingView community or contact the script author directly.
Institutional VWAP Pressure – 5M Execution With 15M HTF BiasHow Smart Money Fades Overextended Intraday Moves
Most intraday traders rely on lagging indicators, chasing breakouts or reacting emotionally to volatility spikes.
Institutional traders do the opposite: they fade inefficiencies, accumulate liquidity, and force price back toward VWAP — the intraday “fair value anchor”.
In this idea, I’ll show you how 5M execution timing combined with 15M VWAP bias creates one of the cleanest mean-reversion models you can trade.
🧩 Why VWAP Matters for Institutional Flow
Large players measure performance and position quality relative to VWAP.
When price stretches too far above or below VWAP:
liquidity becomes thin
market orders become inefficient
continuation becomes unlikely
reversion becomes the path of least resistance
This creates exploitable opportunities — if you know where to look.
⏱ Why the 5M Timeframe Is Ideal for Execution
Most intraday inefficiencies (liquidity grabs, stop runs, exhaustion wicks) occur on 1M–5M candles, not on higher timeframes.
On 5-minute, we see:
microstructure shifts
orderflow exhaustion
failed breakouts
aggressive wicks into VWAP extremes
momentum curls (stochastics turning)
These details are invisible on 15M, meaning the 5M chart is where the actual entries should be taken.
📊 Why 15M Should Be Your HTF Bias Layer
Before fading an extended move, you must know:
Is the session trending strongly?
Is VWAP sloping up or down?
Are we in a high-volume directional environment?
15M gives clarity that 5M alone cannot.
It filters out setups that would fail in trending conditions and ensures that reversion plays align with institutional behavior.
Think of 15M as your macro intraday compass.
🎯 The Institutional VWAP Pressure Setup
We use a combination of three factors:
1️⃣ VWAP Deviation Zones (Overextension)
Price must exceed a tolerance band (e.g., ±0.5%) from VWAP.
This marks inefficiencies where retail is trapped.
2️⃣ Volume Exhaustion (Weak Liquidity)
Continuation requires strong volume.
Reversion happens when volume drops below a threshold (e.g., 70% of average).
Weak volume = weak conviction = high reversion probability.
3️⃣ Momentum Reversal (Stochastics Curl)
Institutions don’t fade blindly — they wait for momentum to turn:
SHORT: Stoch turns down from high levels
LONG: Stoch turns up from depressed levels
This avoids early entries and aligns with microstructure shifts.
🔻 SHORT Conditions (5M Execution)
Price > VWAP + tolerance
Volume < 0.7 × average
Stoch turning down (momentum shift)
15M VWAP not trending strongly upward
This identifies weak, extended rallies likely to mean-revert.
🔹 LONG Conditions (5M Execution)
Price < VWAP − tolerance
Volume exhaustion (weak selling)
Stoch curling upward
15M VWAP not trending sharply downward
This captures panic-driven selling that institutions often buy.
🧠 Why This Works Consistently
Because the model isn’t based on patterns or random indicators — it’s based on how real liquidity is managed:
VWAP = institutional fair value
Extreme deviations = retail emotion
Low volume = lack of continuation
Stochastic curl = momentum turning
15M slope = session structure
You’re essentially trading the natural tendency of price to return to efficiency.

SMA PLOTS & ANCHORED VWAP & CONSOLIDATION FINDERHi traders,
SMA Plots, Anchored VWAP & Consolidation Finder
This Pine Script indicator combines multiple technical analysis tools to provide traders with a comprehensive view of price trends, volume-weighted price levels, and consolidation periods. It includes Simple Moving Averages (SMAs) for daily and chart timeframes, an Anchored Volume-Weighted Average Price (VWAP) with standard deviation bands, and a consolidation detection system based on Bollinger Bands (BB), Average True Range (ATR), and Relative Strength Index (RSI). Designed for versatility, it caters to both trend-following and range-bound trading strategies.
Indicators and Logic
Simple Moving Averages (SMAs):
Daily SMAs: 50-period and 200-period SMAs are calculated on the daily timeframe, plotted on the chart for trend identification. These are ideal for long-term trend analysis, with the 50-SMA acting as a short-term trend indicator and the 200-SMA as a long-term trend indicator.
Chart SMAs: 50-period and 200-period SMAs are calculated on the current chart timeframe, offering flexibility for intraday or swing trading. These are toggleable and disabled by default to reduce chart clutter.
Labeling: Customizable labels for SMA lines and their values (toggleable) provide clear visual cues, showing the exact price levels of the SMAs on the chart.
Anchored VWAP with Standard Deviation Bands:
The VWAP is anchored to a user-defined date (default: March 20, 2020), calculating the volume-weighted average price from that point. It serves as a dynamic support/resistance level, reflecting the average price traders have paid.
Three standard deviation bands (1σ, 2σ, 3σ) are plotted around the VWAP, helping identify overbought/oversold conditions or potential breakout zones. These bands are toggleable for user convenience.
A 1-period EMA is included (toggleable, disabled by default) for traders who prefer a fast-moving average for short-term price tracking.
Consolidation Detection:
The consolidation finder uses three indicators to identify low-volatility periods, which often precede breakouts:
Bollinger Bands (BB): Measures price range tightness using the BB width (upper band - lower band / SMA). A low BB width (< user-defined threshold) indicates consolidation.
ATR (Average True Range): Assesses volatility as a percentage of the closing price. A low ATR % (< user-defined threshold) confirms reduced market activity.
RSI (Relative Strength Index): A low RSI (< user-defined threshold) suggests weak momentum, typical of consolidation phases.
Two consolidation signals are generated:
New Signal: Detects consolidation if at least a user-defined number of bars (default: 3) within a lookback period (default: 10) meet the criteria.
Standard Signal: Detects instant consolidation based on the current bar’s conditions.
A dynamic table displays historical data (min/max/average) for BB width, ATR %, and RSI within a user-defined date range, aiding in parameter optimization.
Trading Strategies
Trend-Following with SMAs:
Use the 50/200 SMA crossover on the daily timeframe to identify bullish (50 > 200) or bearish (50 < 200) trends.
On the chart timeframe, enable the 50/200 SMAs for shorter-term trend confirmation, aligning trades with the dominant trend.
Example: Enter long positions when the price is above both SMAs and short positions when below, using SMA value labels to confirm price proximity.
Mean-Reversion with Anchored VWAP:
Treat the VWAP as a mean price level. Enter long trades when the price dips to the lower 1σ/2σ bands and short trades when it rises to the upper 1σ/2σ bands, expecting a reversion to the VWAP.
Use the 3σ bands to identify extreme conditions for potential breakout or reversal trades.
Example: If the price touches the lower 2σ band and the RSI is oversold, consider a long trade targeting the VWAP.
Breakout Trading with Consolidation Detection:
Monitor the consolidation signals (new or standard) to identify low-volatility periods. These often precede significant price movements.
Enter breakout trades when the price breaks above/below key levels (e.g., VWAP, SMA, or BB bands) after a consolidation signal.
Example: If the “New Signal” is active and the price breaks above the VWAP with increasing volume, initiate a long trade targeting the upper BB band.
User-Friendly Features
Customizable Inputs: Users can adjust SMA lengths, VWAP anchor date, band multipliers, and consolidation thresholds to suit their trading style.
Toggleable Plots and Labels: Enable/disable SMAs, VWAP bands, EMA, and labels to declutter the chart and focus on relevant data.
Dynamic Table: Displays historical BB width, ATR %, and RSI metrics for the selected date range, helping users fine-tune parameters.
Alert Conditions: Two alert conditions (new and standard consolidation signals) allow users to set notifications for trading opportunities.
Visual Clarity: Color-coded plots (green for bullish, red for bearish) and clear labels enhance readability and decision-making.
How to Use
Add the indicator to your chart and adjust input parameters (e.g., SMA lengths, VWAP anchor date, consolidation thresholds) based on your trading preferences.
Enable/disable plots and labels to customize the chart display.
Monitor the dynamic table for historical data to optimize consolidation detection settings.
Set alerts for consolidation signals to stay informed of potential trading opportunities.
Combine SMA trends, VWAP levels, and consolidation signals to develop a robust trading strategy.
Notes
This indicator is best used in conjunction with other technical/fundamental analysis to confirm signals.
Backtest any strategy thoroughly before live trading, as past performance does not guarantee future results.
The default settings are optimized for general use but may require adjustment for specific markets or timeframes.
Disclaimer
This script is provided for educational purposes and should not be considered financial advice. Always conduct your own research and consult a financial advisor before trading.

Key Levels (PA, MAs, VWAPs, Volume Profile, rVWAPs)This indicator marks all kinds of key levels so that users can keep an overview of their specified levels in a convenient non chart cluttering way. It can highlight levels of confluence or display each level seperately.
The indicator includes markers for the following levels:
Price Action: Opens, Previous High/Low, Monday Range
Moving Averages: H4, D1 and W1 with customisable lengths
VWAPs: Developing and Previous VWAPs with their respective VAL/VAH (1 Standard Deviation)
Rolling VWAPs
Volume Profile: Developing and Previous VAL/VAH/POC
What makes this indicator different is its vast customisation options and big library of levels…
… users can choose to merge all levels that are aligned in a specified % threshold and additionally they can choose to color them the same color to highlight confluence levels.
… users have the choice between Full Label Markers or Abbreviations of those Labels.
… users have the choice of a few presets making level switching fast and convenient (Price Action, Volume Profile, VWAP, Volume or Custom).
… users can specify if they prefer to highlight Simple Moving Averages or Exponential Moving Averages. They have calculations available on three different timeframes and can change the lengths of each.
… users can color all levels the same with one click instead of having to manually change all of them.
… when users choose Volume Profile Levels they can either let the script auto calculate the row size making asset switching simple or they can manually input row size.
With the custom preset users can show and hide whichever levels they want.
(To have them the same every time you freshly load the indicator save your settings as default in the lower left corner of the settings tab).
Purpose
This indicator is designed to serve as a level visualisation tool that has the ability to highlight levels of confluence. It may assist in keeping an overview of where all levels are currently located but does not produce signals or trade recommendations.

DYNAMIC TRADING DASHBOARDStudy Material for the "Dynamic Trading Dashboard"
This Dynamic Trading Dashboard is designed as an educational tool within the TradingView environment. It compiles commonly used market indicators and analytical methods into one visual interface so that traders and learners can see relationships between indicators and price action. Understanding these indicators, step by step, can help traders develop discipline, improve technical analysis skills, and build strategies. Below is a detailed explanation of each module.
________________________________________
1. Price and Daily Reference Points
The dashboard displays the current price, along with percentage change compared to the day’s opening price. It also highlights whether the price is moving upward or downward using directional symbols. Alongside, it tracks daily high, low, open, and daily range.
For traders, daily levels provide valuable reference points. The daily high and low are considered intraday support and resistance, while the median price of the day often acts as a pivot level for mean reversion traders. Monitoring these helps learners see how price oscillates within daily ranges.
________________________________________
2. VWAP (Volume Weighted Average Price)
VWAP is calculated as a cumulative average price weighted by volume. The dashboard compares the current price with VWAP, showing whether the market is trading above or below it.
For traders, VWAP is often a guide for institutional order flow. Price trading above VWAP suggests bullish sentiment, while trading below VWAP indicates bearish sentiment. Learners can use VWAP as a training tool to recognize trend-following vs. mean reversion setups.
________________________________________
3. Volume Analysis
The system distinguishes between buy volume (when the closing price is higher than the open) and sell volume (when the closing price is lower than the open). A progress bar highlights the ratio of buying vs. selling activity in percentage.
This is useful because volume confirms price action. For instance, if prices rise but sell volume dominates, it can signal weakness. New traders learning with this tool should focus on how volume often precedes price reversals and trends.
________________________________________
4. RSI (Relative Strength Index)
RSI is a momentum oscillator that measures price strength on a scale from 0 to 100. The dashboard classifies RSI readings into overbought (>70), oversold (<30), or neutral zones and adds visual progress bars.
RSI helps learners understand momentum shifts. During training, one should notice how trending markets can keep RSI extended for longer periods (not immediate reversal signals), while range-bound markets react more sharply to RSI extremes. It is an excellent tool for practicing trend vs. range identification.
________________________________________
5. MACD (Moving Average Convergence Divergence)
The MACD indicator involves a fast EMA, slow EMA, and signal line, with focus on crossovers. The dashboard shows whether a “bullish cross” (MACD above signal line) or “bearish cross” (MACD below signal line) has occurred.
MACD teaches traders to identify trend momentum shifts and divergence. During practice, traders can explore how MACD signals align with VWAP trends or RSI levels, which helps in building a structured multi-indicator analysis.
________________________________________
6. Stochastic Oscillator
This indicator compares the current close relative to a range of highs and lows over a period. Displayed values oscillate between 0 and 100, marking zones of overbought (>80) and oversold (<20).
Stochastics are useful for students of trading to recognize short-term momentum changes. Unlike RSI, it reacts faster to price volatility, so false signals are common. Part of the training exercise can be to observe how stochastic “flips” can align with volume surges or daily range endpoints.
________________________________________
7. Trend & Momentum Classification
The dashboard adds simple labels for trend (uptrend, downtrend, neutral) based on RSI thresholds. Additionally, it provides quick momentum classification (“bullish hold”, “bearish hold”, or neutral).
This is beneficial for beginners as it introduces structured thinking: differentiating long-term market bias (trend) from short-term directional momentum. By combining both, traders can practice filtering signals instead of trading randomly.
________________________________________
8. Accumulation / Distribution Bias
Based on RSI levels, the script generates simplified tags such as “Accumulate Long”, “Accumulate Short”, or “Wait”.
This is purely an interpretive guide, helping learners think in terms of accumulation phases (when markets are low) and distribution phases (when markets are high). It reinforces the concept that trading is not only directional but also involves timing.
________________________________________
9. Overall Market Status and Score
Finally, the dashboard compiles multiple indicators (VWAP position, RSI, MACD, Stochastics, and price vs. median levels) into a Market Score expressed as a percentage. It also labels the market as Overbought, Oversold, or Normal.
This scoring system isn’t a recommendation but a learning framework. Students can analyze how combining different indicators improves decision-making. The key training focus here is confluence: not depending on one indicator but observing when several conditions align.
Extended Study Material with Formulas
________________________________________
1. Daily Reference Levels (High, Low, Open, Median, Range)
• Day High (H): Maximum price of the session.
DayHigh=max(Hightoday)DayHigh=max(Hightoday)
• Day Low (L): Minimum price of the session.
DayLow=min(Lowtoday)DayLow=min(Lowtoday)
• Day Open (O): Opening price of the session.
DayOpen=OpentodayDayOpen=Opentoday
• Day Range:
Range=DayHigh−DayLowRange=DayHigh−DayLow
• Median: Mid-point between high and low.
Median=DayHigh+DayLow2Median=2DayHigh+DayLow
These act as intraday guideposts for seeing how far the price has stretched from its key reference levels.
________________________________________
2. VWAP (Volume Weighted Average Price)
VWAP considers both price and volume for a weighted average:
VWAPt=∑i=1t(Pricei×Volumei)∑i=1tVolumeiVWAPt=∑i=1tVolumei∑i=1t(Pricei×Volumei)
Here, Price_i can be the average price (High + Low + Close) ÷ 3, also known as hlc3.
• Interpretation: Price above VWAP = bullish bias; Price below = bearish bias.
________________________________________
3. Volume Buy/Sell Analysis
The dashboard splits total volume into buy volume and sell volume based on candle type.
• Buy Volume:
BuyVol=Volumeif Close > Open, else 0BuyVol=Volumeif Close > Open, else 0
• Sell Volume:
SellVol=Volumeif Close < Open, else 0SellVol=Volumeif Close < Open, else 0
• Buy Ratio (%):
VolumeRatio=BuyVolBuyVol+SellVol×100VolumeRatio=BuyVol+SellVolBuyVol×100
This helps traders gauge who is in control during a session—buyers or sellers.
________________________________________
4. RSI (Relative Strength Index)
RSI measures strength of momentum by comparing gains vs. losses.
Step 1: Compute average gains (AG) and losses (AL).
AG=Average of Upward Closes over N periodsAG=Average of Upward Closes over N periodsAL=Average of Downward Closes over N periodsAL=Average of Downward Closes over N periods
Step 2: Calculate relative strength (RS).
RS=AGALRS=ALAG
Step 3: RSI formula.
RSI=100−1001+RSRSI=100−1+RS100
• Used to detect overbought (>70), oversold (<30), or neutral momentum zones.
________________________________________
5. MACD (Moving Average Convergence Divergence)
• Fast EMA:
EMAfast=EMA(Close,length=fast)EMAfast=EMA(Close,length=fast)
• Slow EMA:
EMAslow=EMA(Close,length=slow)EMAslow=EMA(Close,length=slow)
• MACD Line:
MACD=EMAfast−EMAslowMACD=EMAfast−EMAslow
• Signal Line:
Signal=EMA(MACD,length=signal)Signal=EMA(MACD,length=signal)
• Histogram:
Histogram=MACD−SignalHistogram=MACD−Signal
Crossovers between MACD and Signal are used in studying bullish/bearish phases.
________________________________________
6. Stochastic Oscillator
Stochastic compares the current close against a range of highs and lows.
%K=Close−LowestLowHighestHigh−LowestLow×100%K=HighestHigh−LowestLowClose−LowestLow×100
Where LowestLow and HighestHigh are the lowest and highest values over N periods.
The %D line is a smooth version of %K (using a moving average).
%D=SMA(%K,smooth)%D=SMA(%K,smooth)
• Values above 80 = overbought; below 20 = oversold.
________________________________________
7. Trend and Momentum Classification
This dashboard generates simplified trend/momentum logic using RSI.
• Trend:
• RSI < 40 → Downtrend
• RSI > 60 → Uptrend
• In Between → Neutral
• Momentum Bias:
• RSI > 70 → Bullish Hold
• RSI < 30 → Bearish Hold
• Otherwise Neutral
This is not predictive, only a classification framework for educational use.
________________________________________
8. Accumulation/Distribution Bias
Based on extreme RSI values:
• RSI < 25 → Accumulate Long Bias
• RSI > 80 → Accumulate Short Bias
• Else → Wait/No Action
This helps learners understand the idea of accumulation at lows (strength building) and distribution at highs (profit booking).
________________________________________
9. Overall Market Status and Score
The tool adds up 5 bullish conditions:
1. Price above VWAP
2. RSI > 50
3. MACD > Signal
4. Stochastic > 50
5. Price above Daily Median
BullishScore=ConditionsMet5×100BullishScore=5ConditionsMet×100
Then it categorizes the market:
• RSI > 70 or Stoch > 80 → Overbought
• RSI < 30 or Stoch < 20 → Oversold
• Else → Normal
This encourages learners to think in terms of probabilistic conditions instead of single-indicator signals.
________________________________________
⚠️ Warning:
• Trading financial markets involves substantial risk.
• You can lose more money than you invest.
• Past performance of indicators does not guarantee future results.
• This script must not be copied, resold, or republished without authorization from aiTrendview.
By using this material or the code, you agree to take full responsibility for your trading decisions and acknowledge that this is not financial advice.
________________________________________
⚠️ Disclaimer and Warning (From aiTrendview)
This Dynamic Trading Dashboard is created strictly for educational and research purposes on the TradingView platform. It does not provide financial advice, buy/sell recommendations, or guaranteed returns. Any use of this tool in live trading is completely at the user’s own risk. Markets are inherently risky; losses can exceed initial investment.
The intellectual property of this script and its methodology belongs to aiTrendview. Unauthorized reproduction, modification, or redistribution of this code is strictly prohibited. By using this study material or the script, you acknowledge personal responsibility for any trading outcomes. Always consult professional financial advisors before making investment decisions.

[astropark] Progressive VWAPDearDear Followers,
today another awesome Analysis Tool, that you can use in your trading journey: Progressive VWAP !
If you love vwap, you will love this indicator, as it calculates some special "progressive" / "evolving" vwap levels:
daily vwap named dvwap
2D vwap named 2dvwap
3D vwap named 3dvwap
weekly vwap named wvwap
2W vwap named 2wvwap
Monthly vwap named mvwap
Quarterly vwap named qvwap
Yearly vwap named yvwap
You can:
choose which progressive vwap to show and which to hide
change each line color / thickness / display style (solid or dashed)
choose to show or hide labels and change their size
Why such indicator should be helpful? How can I use it to do profit?
In multiple ways:
when a lower timeframe crosses an higher timeframe progressive vwap, you know sentiment is getting bullish and viceversa if the cross is downwards
price tends to bounce on such progressive vwaps: the higher the timeframe, the more probably the bounce is as well as the magnitude of the breakout of the level
This indicator works on every timeframe, market and pair.
As I always say, all tools are great if you use them correctly: this is not the "Holy Grail", so always use proper money and risk management strategies.
This is a premium indicator , so send me a private message in order to get access to this script.

cd_VWAP_mtg_CxCd_VWAP_mtg_Cx
Overview
The most important condition for being successful and profitable in the market is to consistently follow the same rules without compromise, while the price constantly moves in countless different ways.
Regardless of the concept or trading school, those who have rules win.
In this indicator, we will define and use three main sections to set and apply our rules.
The indicator uses the VWAP (Volume Weighted Average Price) — price weighted by volume.
Two VWAPs can be displayed either by manually entering date and time, or by selecting from the menu.
From the menu, you can select the following reference levels:
• HTF Open: Opening candle of the higher timeframe
• ATH / ATL: All-Time High / All-Time Low candles
• PMH / PML, PWH / PWL, PDH / PDL, PH4H / PH4L: Previous Month, Week, Day, or H4 Highs/Lows
• MH / ML, WH / WL, DH / DL, H4H / H4L: Current Month, Week, Day, or H4 Highs/Lows
Additionally, it includes:
• Mitigation / Order Block zones (local buyer-seller balance) across two timeframes.
• Buy/Sell Side Liquidity levels (BSL / SSL) from the aligned higher timeframe (target levels).
________________________________________
Components and Usage
1 – VWAP
Calculated using the classical method:
• High + Volume for the upper value
• Close + Volume for the middle value
• Low + Volume for the lower value
The VWAP is displayed as a colored band, where the coloring represents the bias.
Let’s call this band FVB (Fair Value Band) for ease of explanation.
The FVB represents the final line of defense, the buyer/seller boundary, and in technical terms, it can be viewed as premium/discount zones or support/resistance levels.
Within this critical area, the strong side continues its move, while the weaker side is forced to retreat.
But does the side that breaks beyond the band always keep going?
We all know that’s not always the case — in different pairs and timeframes, price often violates both the upper and lower edges multiple times.
To achieve more consistent analysis, we’ll define a new set of rules.
________________________________________
2 – Mitigation / Order Blocks
In trading literature, there are dozens of different definitions and uses of mitigation or order blocks.
Here, we will interpret the candlesticks to create our own definition, and we’ll use the zones defined by candles that fit this pattern.
For simplicity, let’s abbreviate mitigation as “mtg.”
For a candle to be selected as an mtg, it must clearly show strength from one side (buyers or sellers) — which can also be observed visually on the chart.
________________________________________
Bullish mtg criteria:
1. The first candle must be bullish (close > open) → buyers are strong.
2. The next candle makes a new high (buyers push higher) but fails to close above and pulls back to close inside the previous range → sellers react.
It also must not break the previous low → buyers defend.
3. In the following candle(s), as long as the first candle’s low is protected and the second candle’s high is broken, it indicates buyer strength → a bullish mtg is confirmed.
When price returns to this zone later (gets mitigated), the expectation is that the zone holds and price pushes upward again.
If the low is violated, the mtg becomes invalid.
In technical terms:
If the previous candle’s high is broken but no close occurs above it, the expectation is a reversal move that will retest its low.
Question:
What if the low is protected and in the next candle(s) a new high forms?
Answer: → Bullish mtg.
Bearish mtg (opposite)
3 – Buy/Sell Side Liquidity Levels
With the help of the aligned higher timeframe (swing points), we will define our market structure framework and set our liquidity targets accordingly.
Let’s put the pieces together.
If we continue explaining from a trade-focused perspective, our first priority should be our bias — our projection or expectation of the market’s potential movement.
We will determine this bias using the FVB.
Since we know the band often gets violated on both sides, we want the price action to convince us of its strength.
To do that, we’ll use the first candle that closes beyond the band.
The distance from that candle’s high to low will be our threshold range
Bullish level = high + (candle length × coefficient)
Bearish level = low - (candle length × coefficient)
When the price closes beyond this threshold, it demonstrates strength, and our bias will now align in that direction.
How long will this bias remain valid?
→ Until a closing candle appears on the opposite side of the band.
If a close occurs on the opposite side, then a new bias will only be confirmed once the new threshold level is broken.
During the period in between, we have no bias.
Let’s continue on the chart:
Now that our bias has been established, where and how do we look for trade opportunities?
There are two possible entry approaches:
• Aggressive entry: Enter immediately with the breakout.
• Conservative entry: Wait for a pullback and enter once a suitable structure forms.
(The choice depends on the user’s preference.)
At this stage, the user can apply their own entry model. Let’s give an example:
Let’s assume we’re looking for setups using HTF sweep + LTF CISD confirmation.
Once our bias turns bearish, we look for an HTF sweep forming on or near an FVB or mtg block, and then confirm the entry with a CISD signal.
In summary:
• FVB defines the bias, the entry zone, and the target zone.
• Mtg blocks represent entry zones.
• BSL / SSL levels suggest target zones.
Overlapping FVB and mtg blocks are expected to be more effective.
The indicator also provides an option for a second FVB.
A band attached to a lower timeframe can be used as confirmation.
• Main band: Bias + FVB
• Extra band: Entry trigger confirmed by a close beyond it.
Mtg blocks can provide trade entry opportunities, especially when the price is moving strongly in one direction (flow).
Consecutive or complementary mtg blocks indicate that the price is decisive in one direction, while sometimes also showing areas where we should wait before entering.
Mtg blocks that contain an FVG (Fair Value Gap) within their body are expected to be more effective.
Settings:
The default values are set to 1-3-5m, optimized for scalping trades.
VWAP settings:
Main VWAP (FVB):
• Can be set by selecting a start time, manually entering date and time, or choosing a predefined level.
Extra VWAP (FVB):
• Set from the menu. If not needed, select “none.”
• Visibility, color, and fill settings for VWAP are located here.
• Threshold levels visibility and color options are also in this section.
• The multiplier is used for calculating the threshold level.
Important:
• If the Extra VWAP is selected but not displayed, you need to increase the chart timeframe.
o Example: If the chart is on 3m and you select WH from the extra options, it will not display correctly.
• Upper limits for VWAP:
o 1m and 3m charts: daily High/Low
o 5m chart: weekly High/Low
________________________________________
Mtg Settings:
• Visibility and color settings for blocks are configured here.
• To display on a second timeframe, the box must be checked and the timeframe specified.
• Optional display modes: “only active blocks,” “only last violated mtg,” or “all.”
• For confirmation and removal criteria, choosing high/low or close determines the source used for mtg block formation and deletion conditions.
BSL/SSL Settings:
• Visibility, color, font size, and line style can be configured in this section.
When “Auto” is selected, the aligned timeframe is determined automatically by the indicator, while in manual mode, the user defines the timeframe.
Final Words:
Simply opening trades every time the price touches the VWAP or mtg blocks will not make you a profitable trader. Searching for setups with similar structures while maintaining proper risk management will yield better results in the long run.
I would be happy to hear your feedback and suggestions.
Happy trading!

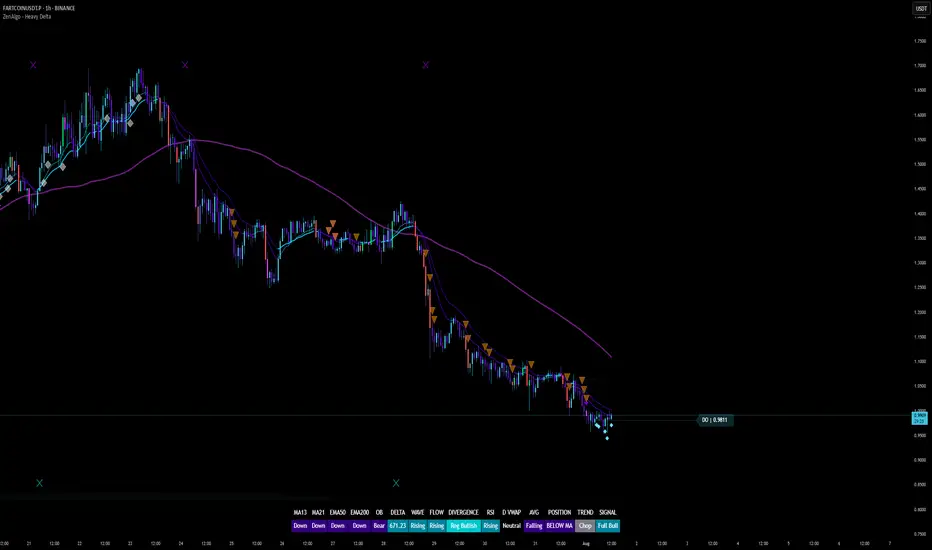
ZenAlgo - Heavy DeltaThe ZenAlgo - Heavy Delta indicator is a comprehensive technical analysis tool designed for traders seeking a deeper understanding of market dynamics. It combines multiple advanced sub-indicators, including Order Blocks, Moving Averages, VWAP, and Delta Volume analysis, and more to provide actionable insights. This indicator is particularly useful for identifying potential trade entries and exits based on institutional order flow and price action patterns.
Features
Order Block Detection: Identifies bullish and bearish order blocks with detailed visualization and volume analysis.
VWAP (Volume Weighted Average Price): Tracks the average price of a security weighted by volume over various anchor periods.
Moving Averages (MA): Customizable MAs (13, 21, 50, 200 periods) to detect trends and momentum shifts.
Daily Open and Monday Range: Highlights key levels like daily open and intraday/multi-day high-low ranges for better price context.
Delta Volume Analysis: Measures the net difference between buying and selling volume for market sentiment insights.
Divergence Detection: Detects regular and hidden bullish/bearish divergences for trend reversal opportunities.
Visual Alerts: Displays intuitive symbols for potential buy/sell signals and key price levels.
Added Value: Why Is This Indicator Original/Why Shall You Pay for This Indicator?
The ZenAlgo - Heavy Delta indicator offers a distinct advantage by integrating multiple analysis techniques into one cohesive tool. While many individual indicators are freely available, this script goes beyond simple overlays to provide an advanced analytical framework. Here’s why it stands out:
1. Synergy of Indicators
Order Blocks: These are not static; the indicator dynamically calculates zones where institutional activity likely occurred, supported by volume-weighted metrics.
Delta Volume Analysis: Freely available delta volume tools typically show raw data, but this script filters noise, categorizes volume into meaningful up/down segments, and integrates it with other signals for context.
VWAP and Moving Averages: VWAP and customizable MAs are enhanced with divergence checks, color-coded trends, and market state classifications. This integration helps confirm trends and reversals with higher precision.
2. Volume-Based Insights
Traditional volume indicators often fail to show the "intent" behind price moves. This script combines delta volume and order block data to highlight areas of significant buying or selling pressure and their potential impacts on future price action.
3. Visual Simplicity with Advanced Logic
Unlike using several separate tools, which can clutter your chart, this indicator presents a streamlined interface. Every plotted element serves a clear purpose, minimizing distractions while maximizing actionable insights.
4. Customized for Active Traders
The indicator doesn’t just provide standard calculations. It includes proprietary adjustments like mitigation thresholds in order blocks, percentage-based signals for VWAP, and delta volume intensity levels that align better with active market conditions.
5. Why Pay for It?
Time and effort savings: Instead of setting up and calibrating multiple tools, this indicator combines them into a single efficient package.
Enhanced accuracy: Each sub-indicator validates the others, reducing false signals.
Unique features: For instance, the script automatically adjusts for multi-timeframe inconsistencies and uses gradient color fills to convey volume strength in order blocks—a feature absent in free indicators.
How It Works
The indicator combines individual sub-indicators into a logical framework where each part contributes to the overall analysis. Here’s how each feature operates:
1. Order Blocks
Identification: Uses specific price action patterns to locate zones of likely institutional interest (bullish or bearish blocks).
Dynamic Updates: The blocks adjust as new price data comes in, ensuring their relevance. Volume within these zones is weighted, helping assess their strength and potential price reactions.
Visual Enhancements: Blocks are color-coded and filled with gradients based on volume intensity, providing immediate visual cues about their importance.
2. VWAP (Volume Weighted Average Price)
Calculation: Anchored to user-selected periods (daily, weekly, etc.), VWAP is recalculated in real-time, showing the "fair" price based on traded volume.
Integration: Acts as a dynamic support/resistance line, particularly useful in intraday and swing trading. Labels provide percentage deviation for quick interpretation.
3. Moving Averages (MAs)
Customization: Supports various types (EMA, SMA, etc.) and lengths (13, 21, 50, 200). Traders can configure these to suit their strategies.
Market Status: By comparing the price to these MAs, the indicator classifies the market as Full Bull, Bullish, Neutral, Bearish, or Full Bear. This high-level summary helps traders quickly gauge market sentiment.
4. Delta Volume
Core Logic: Calculates the net difference between buying and selling pressure (volume) for each candle.
Visual Signals: Plots symbols when significant delta volume changes coincide with other indicator signals, like divergence or order block activity.
5. Daily Open and Monday Range
Purpose: Identifies key psychological levels like the daily open and the high/low range for the first trading day of the week.
Context: Highlights these levels with dynamic percentage changes, helping traders understand how price is behaving relative to them.
6. Divergence Detection
Logic: Tracks discrepancies between price movement and momentum (via Moving Averages, Delta Volume, and Order Blocks). These divergences often precede reversals.
Validation: Divergences are only flagged when other features, like delta volume shifts or order block interactions, confirm the setup.
By combining these tools in a meaningful way, ZenAlgo - Heavy Delta transforms raw data into actionable intelligence, giving traders a comprehensive view of market dynamics and a significant edge in decision-making.
Why Use Heikin Ashi for Heavy Delta?
The ZenAlgo - Heavy Delta indicator is optimized for Heikin Ashi (HA) candles, which smooth out market noise and make trends more visually apparent. Heikin Ashi works best for this strategy for several key reasons:
Why Heikin Ashi Works Best
Trend Clarity: Unlike traditional candlesticks, Heikin Ashi averages price data to create smoother transitions. This helps the indicator better identify sustained trends and reduces false signals caused by short-term price fluctuations.
Noise Reduction: HA candles filter out minor fluctuations and emphasize the overall market direction, making it easier to align the indicator’s signals (like Delta Volume and Order Blocks) with larger market movements.
Improved Visual Insights: Features like Order Blocks and Delta Volume align well with Heikin Ashi's smoothed representation, as it avoids the erratic movements that traditional candles sometimes display.
Better Support for Trend Strategies: Heikin Ashi candles naturally highlight key reversals and continuation patterns, which complement the analytical goals of this indicator.
Important Notes About Heikin Ashi:
Synthetic Nature of HA Candles: Heikin Ashi values are calculated differently than traditional candles. For example: a) The open is the average of the prior candle's open and close. b) The close is the average of the high, low, open, and close. This synthetic nature means that HA candles do not reflect actual market prices but rather smoothed averages, which can slightly lag real-time price movements.
Lagging Effect: Because HA candles use averaged data, they can lag behind actual price action. This is beneficial for identifying trends but less effective for precise entry/exit timing.
Inaccuracy in Low Volatility: In low-volume or low-volatility conditions, HA candles may distort actual price dynamics, leading to less reliable insights.
No Direct Alerts or Buy/Sell Signals : Issuing explicit buy or sell signals based on Heikin Ashi candles is not possible due to their averaged, synthetic nature. As such, the ZenAlgo - Heavy Delta indicator does not generate direct trading signals. Instead, the indicator is a decision-support tool that provides insights into trends, volume dynamics, and potential key levels, leaving trade execution to the trader's discretion.
Usage Examples
Trend Confirmation: Use the MA market status to identify if the market is in a Full Bull or Bear state.
Reversal Zones: Monitor order block zones for price rejection or absorption, signaling a potential reversal.
Breakout Trading: Trade breakouts when price surpasses VWAP or Monday Range highs/lows.
Delta Divergence: Look for positive/negative delta volume divergences during consolidations for breakout cues.
Mean Reversion: Use VWAP or MAs as dynamic support/resistance for mean reversion setups.
Intraday Scalping: Utilize daily open and intraday levels for short-term trades.
Swing Trading: Employ order blocks and multi-day ranges to frame swing trade setups.
Volume Climax: Identify volume spikes using Delta Volume to confirm trend continuation or reversal.
Momentum Trading: Combine divergence signals with Delta Volume for high-conviction entries.
Risk Management: Use defined order block boundaries to set stop losses and targets.
Settings
Order Blocks: Customize label visibility, label offsets, and block appearance.
VWAP: Adjust anchor period and toggle visibility.
Moving Averages: Configure length, type (EMA, SMA, etc.), and visibility of MAs (13, 21, 50, 200).
Delta Volume: Enable/disable delta symbols and labels, adjust sensitivity multipliers.
Daily Open/Monday Range: Toggle visibility and customize display preferences.
General Visuals: Adjust label offsets, color schemes, and transparency.
Important Notes
This indicator is a technical analysis tool and does not guarantee trading success.
Use it in conjunction with other indicators and fundamental analysis for a more comprehensive trading strategy.
Performance may vary in low-liquidity markets or during sudden news events.
Divergence signals might fail in strongly trending markets.
RD Key Levels (Weekly, Daily, Previous vWAP)The RexDog Key Levels indicator plots the weekly open, daily open, and the previous day vWAP close.
These are all critical price levels (zones) to know when trading any market or instrument. These areas are also high probability reaction areas that you can trade using simple confirmation trading patterns.
First, I'll cover an overview of the indicator then I'll share general usage tips.
Weekly Open - default is white/orange. White is when price is above the weekly open. Orange is when price is below the weekly open.
Weekly High/Low - there are options to turn on the weekly high and lows. Default plot is circles. Green is the high. Red is the low.
Daily Open - default is green/red. Green is when price is above the daily open. Red is when price is below the daily open.
Previous vWAPs - aqua single lines. These are the closing price of the daily vWAPs.
Top Indicators - The triangles at the top of the chart signify is price is currently above or below the weekly open. This is helpful on lower timeframe charts (5m, 15m) to get a quick indication when price is far extended beyond the weekly open. Green triangle = above weekly open. Red triangle = below weekly open.
General Usage
Each one of these levels are important levels markets look use for continuation or failure of momentum and bias. I also find it extremely helpful to think of these levels as magnets, dual magnets. They both attract and repel price at the same time. Now you might say, how is that helpful to have opposing views at the same time? Be indifferent to direction, create your own rules on when these price zones repel or attract price, I have my own.
Here's the easiest way to use these price levels.
As price approaches one of these levels to expect a reaction. A reaction is price is going in one direction and price hits a price level zone and reacts in the opposite direction.
These are price zones, sometimes you will see a reaction right at the price but visualize these areas as zones of reaction.
A high percentage of the time when price approaches these level zones there will be a reaction. So trade the reaction .
How do you do that?
Simple. Trade patterns that repeat. I have 3 solid patterns I trade around these key levels:
The first pattern is early entry with precise scale in rules and a very effective protective stop loss placement.
The second pattern is wait for confirmation that the level holds. This requires more patience and for you to fully trust the chart. The benefit of this pattern is with confirmation you have even more precise stop placement.
There is a bonus third pattern I trade around these levels. I call this the confirmation and bluff entry. It's a combination of both of the patterns above. You wait for confirmation but on any pull back you call the bluff on the market and enter on key test. Trade management here is critical. In addition to the pattern you trade you should have a series of failure patterns that tell you to get out of the trade, I use 2 primary failure patterns.
I trade all markets, same system, same rules, so I'll show a few examples.
Usually I start with Bitcoin but let's start with equities:
BA - Boeing - 8 Trades
Here we see weekly low patterns, previous week low test, vwAP hold patterns, day magnets and day holding. Then 2 week failures and a double hold pattern.
These are all straightforward trades to execute following really simple patterns.
BTCUSD Previous vWAP and Day Open Trades
We see here on the circle areas both daily open and previous day vWAP zone tests. Within this chart are all 3 highly effective patterns I trade.
SPY - 7 High Probability Trades
Here we see a pDay vWAP mixed with a daily failure. Next a daily retest, then a pDay vWAP failure, then a vWAP capture and test. Then a double weekly failure test (great trade there) and finally a daily test.
I could provide more examples but most are just derivatives of the above examples.

Previous Period Close & Live VWAP @MaxMaserati 3.0 Previous Period Close & Live VWAP @MaxMaserati 3.0 ═════════════════════════════════════════════════════════════A professional-grade Volume Weighted Average Price (VWAP) indicator designed for dual-timeframe analysis, providing essential institutional-level insights for day, swing, and institutional traders. ═════════════════════════════════════════════════════════════VWAP ═════════════════════════════════════════════════════════════VWAP is the Volume Weighted Average Price—the average price adjusted for the volume traded at each price level. It gives higher importance to prices where more transactions occurred.
CALCULATION:
VWAP = Σ(Price × Volume) / Σ(Volume)
WHY IT'S CRITICAL:
It represents the true average price paid by all market participants.
Institutions use it as a benchmark for trade execution quality.
It functions as a dynamic support and resistance level driven by volume.
More reliable than simple moving averages for intraday trading.
═════════════════════════════════════════════════════════════
MMM PRO VWAP @MaxMaserati 3.0 Features
═════════════════════════════════════════════════════════════ This indicator displays the closed VWAP level from the previous period alongside a dynamic, live VWAP line for the current period. This setup allows for immediate comparison of current price action relative to the prior period's volume-weighted average.
PREVIOUS PERIOD PRESSURE-BASED COLORING
The color of the previous period's close instantly reveals the dominant pressure:
GREEN: If the VWAP closed HIGHER than it opened, indicating dominant buying volume (Bulls won).
RED: If the VWAP closed LOWER than it opened, indicating dominant selling volume (Bears won).
This provides instant, actionable insight into the market's recent sentiment.
═════════════════════════════════════════════════════════════
Trading Applications & Strategy Ideas
═════════════════════════════════════════════════════════════
INTRADAY TRADING (VWAP 1 - Daily)
Bullish Bias: Price trading above the Daily VWAP (look for long setups).
Bearish Bias: Price trading below the Daily VWAP (look for short setups).
The Previous Close VWAP acts as a key support/resistance level.
The previous close color provides immediate daily sentiment.
SWING TRADING (VWAP 2 - Weekly/Monthly)
Use the higher timeframe VWAP (Weekly/Monthly) to establish the major trend direction.
Combine both VWAPs for multi-timeframe confluence and stronger conviction trades.
INSTITUTIONAL INSIGHTS
VWAP is considered the fair value based on volume.
Previous period close levels are crucial institutional zones.
Price often exhibits mean reversion, tending to move back towards the VWAP.
CORE STRATEGY IDEAS:
Buy (Long) when price tests the Daily VWAP from above (support).
Sell (Short) when price tests the Daily VWAP from below (resistance).
Use the previous close color for quick sentiment analysis. ═════════════════════════════════════════════════════════════
Pro Tips for Enhanced Analysis
═════════════════════════════════════════════════════════════
Confluence: The strongest setups occur when price is above both Daily and Monthly VWAP (bullish) or below both (bearish).
Reversion: Extreme deviations from VWAP suggest an imminent return to the mean. Previous close levels act as price magnets.
Trend Confirmation: Consistent price movement above VWAP confirms a strong uptrend; consistent movement below confirms a strong downtrend.
Institutional Focus: The end-of-day VWAP close highlights whether bulls or bears controlled the period. This pressure can often carry over.
Risk Management: Do not trade against the established VWAP bias without strong, independent confirmation. Use previous close levels as stop-loss references. ═════════════════════════════════════════════════════════════
Important Notes
═════════════════════════════════════════════════════════════
Timeframe Consistency: The VWAP line is timeframe-independent. The Daily VWAP will appear the same on a 1-minute chart as it does on a 4-hour chart.
Previous Close Persistence: The previous period close level remains on the chart until the next period's reset, serving as a critical historical reference point.
Volume Dependency: VWAP's reliability is highest during liquid market hours. Use caution during low-volume periods.
Not a Complete Strategy: This is an indicator tool. Always use it with robust risk management and combine it with your existing analysis methods. ═══════════════════════════════════════════════════════════

DIN: Dynamic Trend NavigatorDIN: Dynamic Trend Navigator
Overview
The Dynamic Trend Navigator script is designed to help traders identify and capitalize on market trends using a combination of Weighted Moving Averages (WMA), Volume Weighted Average Price (VWAP), and Anchored VWAP (AVWAP). The script provides customizable settings and flexible alerts for various crossover conditions, enhancing its utility for different trading strategies.
Key Features
- **1st and 2nd WMA**: Allows users to set and visualize two Weighted Moving Averages. These can be customized to any period, providing flexibility in trend identification.
- **VWAP and AVWAP**: Incorporates both VWAP and AVWAP, offering insights into price levels adjusted by volume.
- **ATR and ADX Indicators**: Includes the Average True Range (ATR) and Average Directional Index (ADX) to help assess market volatility and trend strength.
- **Flexible Alerts**: Configurable buy and sell alerts for any crossover condition, making it versatile for various trading strategies.
How to Use the Script
1. **Set the WMA Periods**: Customize the periods for the 1st and 2nd WMAs to suit your trading strategy.
2. **Enable VWAP and AVWAP**: Choose whether to include VWAP and AVWAP in your analysis by enabling the respective settings.
3. **Configure Alerts**: Set up alerts for the desired crossover conditions (WMA, VWAP, AVWAP) to receive notifications for potential trading opportunities.
4. **Monitor Signals**: Watch for buy and sell signals indicated by triangle shapes on the chart, which appear at the selected crossover points.
When to Use
- **Best Time to Use**: The script is most effective in trending markets where price movements are well-defined. It helps traders stay on the right side of the trend and avoid false signals during periods of low volatility.
- **When Not to Use**: Avoid using the script in choppy or sideways markets where price action lacks direction. The script may generate false signals in such conditions, leading to potential losses.
Benefits of VWAP and AVWAP
- **VWAP**: The Volume Weighted Average Price provides a price benchmark that adjusts for volume, helping traders identify fair value levels. It is particularly useful for intraday trading and gauging market sentiment.
- **AVWAP**: The Anchored VWAP allows traders to set a starting point for VWAP calculations, providing flexibility in analyzing price levels over specific periods or events. This helps in identifying key support and resistance levels based on volume.
Unique Aspects
- **Customizability**: The script offers extensive customization options for WMA periods, VWAP, AVWAP, and alert conditions, making it adaptable to various trading strategies.
- **Combining Indicators**: By integrating WMAs, VWAP, AVWAP, ATR, and ADX, the script provides a comprehensive view of market conditions, enhancing decision-making.
- **Real-Time Alerts**: The flexible alert system ensures traders receive timely notifications for potential trade setups, improving responsiveness to market changes.
Examples
- **Example 1**: A trader sets the 1st WMA to 8 and the 2nd WMA to 100, enabling the VWAP. When the 1st WMA crosses above the 2nd WMA or VWAP, a buy signal is triggered, indicating a potential long entry.
- **Example 2**: A trader sets the AVWAP to start 30 bars ago and monitors for crossovers with the 1st WMA. When the 1st WMA crosses below the AVWAP, a sell signal is triggered, suggesting a potential short entry.
Final Notes
The Dynamic Trend Navigator script is a powerful tool for traders looking to enhance their market analysis and trading decisions. Its unique combination of customizable indicators and flexible alert system sets it apart from other scripts, making it a valuable addition to any trader's toolkit.
Disclaimer: Never any financial advice. Just ThisGirl loving experimenting with indicators to help myself, as well as others.

VCBBDOVWAPSMA By Anil ChawraHow Users Can Make Profit Using This Script:
1. Volume Representation : Each candle on the chart represents a specific time period (e.g., 1 minute, 1 hour, 1 day) and includes information about both price movement and trading volume during that period.
2. Candlestick Anatomy : A volume candle has the same components as a regular candlestick: the body (which represents the opening and closing prices) and the wicks or shadows (which indicate the highest and lowest prices reached during the period).
3. Volume Bars : Instead of just the candlestick itself, volume candles also include a bar or histogram representing the trading volume during that period. The height or length of the volume bar indicates the amount of trading activity.
4. Interpreting Volume : High volume candles typically indicate increased market interest or activity during that period. This could be due to significant buying or selling pressure.
5. Confirmation : Traders often look for confirmation from other technical indicators or price action to validate the significance of a high volume candle. For example, a high volume candle breaking through a key support or resistance level may signal a strong market move.
6. Trend Strength : Volume candles can provide insights into the strength of a trend. A series of high volume candles in the direction of the trend suggests strong momentum, while decreasing volume may indicate weakening momentum or a potential reversal.
7. Volume Patterns : Traders also analyze volume patterns, such as volume spikes or divergences, to identify potential trading opportunities or reversals.
8. Combination with Price Action: Volume analysis is often used in conjunction with price action analysis and other technical indicators to make more informed trading decisions.
9. Confirmation and Validation: It's important to confirm the significance of volume candles with other indicators or price action signals to avoid false signals.
10. Risk Management : As with any trading strategy, proper risk management is crucial when using volume candles to make trading decisions. Set stop-loss orders and adhere to risk management principles to protect your capital.
How to script works :
1.Identify High Volume Candles: Look for candles with significantly higher volume compared to the surrounding candles. These can indicate increased market interest or activity.
2.Wait for Confirmation: Once you identify a high volume candle, wait for confirmation from subsequent candles to ensure the momentum is sustained.
3.Enter the Trade: After confirmation, consider entering a trade in the direction indicated by the high volume candle. For example, if it's a bullish candle, consider buying.
4.Set Stop Loss: Always set a stop loss to limit potential losses in case the trade goes against you.
5.Take Profit: Set a target for taking profits. This could be based on technical analysis, such as a resistance level or a certain percentage gain.
6.Monitor Volume: Continuously monitor volume to gauge the strength of the trend. Decreasing volume may signal weakening momentum and could be a sign to exit the trade.
7.Risk Management: Manage risk carefully by adjusting position sizes according to your risk tolerance and the size of your trading account.
8.Review and Adapt: Regularly review your trades and adapt your strategy based on what's working and what's not.
Remember, no trading strategy guarantees profits, and it's essential to practice proper risk management and have realistic expectations. Additionally, consider combining volume analysis with other technical indicators for a more comprehensive approach to trading.
**How Users Can Make Profit Using This Script:
**
DAYS OPEN LINE:
1.Purpose: Publishing a "Days Open Line" indicator serves to inform customers about the operational schedule of a business or service.
2.Visibility: It ensures that the information regarding the days of operation is easily accessible to current and potential customers.
3.Transparency: By making the operational schedule public, businesses demonstrate transparency and reliability to their customers.
4.Accessibility: The indicator should be published on various platforms such as the business website, social media channels, and physical locations to ensure accessibility to a wide audience.
5.Clarity: The information should be presented in a clear and concise manner, specifying the days of the week the business is open and the corresponding operating hours.
6.Updates: It's important to regularly update the "Days Open Line" indicator to reflect any changes in the operational schedule, such as holidays or special events.
7.Customer Convenience: Providing this information helps customers plan their visits accordingly, reducing inconvenience and frustration due to unexpected closures.
8.Expectation Management: Setting clear expectations regarding the business hours helps manage customer expectations and reduces the likelihood of disappointment or complaints.
9.Customer Service: Publishing the "Days Open Line" indicator demonstrates a commitment to customer service by ensuring that customers have the information they need to engage with the business.
10.Brand Image: Consistently .maintaining and updating the indicator contributes to a positive brand image, as it reflects professionalism, reliability, and a customer-centric approach.
SMA CROSS:
1.This indicator generates buy and sell signals based on the crossover of two Simple Moving Averages (SMA): a shorter 3-day SMA and a longer 8-day SMA.
When the 3-day SMA crosses above the 8-day SMA, it generates a buy signal indicating a potential upward trend.
Conversely, when the 3-day SMA crosses below the 8-day SMA, it generates a sell signal indicating a potential downward trend.
Signal Interpretation:
2.Buy Signal: Generated when the 3-day SMA crosses above the 8-day SMA.
Sell Signal: Generated when the 3-day SMA crosses below the 8-day SMA.
Usage:
3.Traders can use this indicator to identify potential entry and exit points in the market.
Buy signals suggest a bullish trend, indicating a favorable time to enter or hold a long position.
4.Sell signals suggest a bearish trend, indicating a potential opportunity to exit or take a short position.
Parameters:
5.Periods: 3-day SMA and 8-day SMA.
Price: Closing price is commonly used, but users can choose other price types (open, high, low) for calculation.
Confirmation:
6.It's recommended to use additional technical analysis tools or confirmatory indicators to validate signals and minimize false signals.
Risk Management:
7.Implement proper risk management strategies, such as setting stop-loss orders, to mitigate losses in case of adverse price movements.
Backtesting:
8.Before using the indicator in live trading, conduct thorough backtesting to evaluate its effectiveness under various market conditions.
Considerations:
9.While SMA crossovers can provide valuable insights, they may generate false signals during ranging or choppy markets.
Combine this indicator with other technical analysis techniques for comprehensive market analysis.
Continuous Optimization:
10.Monitor the performance of the indicator and adjust parameters or incorporate additional filters as needed to enhance accuracy over time.
BOLLINGER BAND:
1.Definition: A Bollinger Band indicator is a technical analysis tool that consists of a centerline (typically a moving average) and two bands plotted above and below it. These bands represent volatility around the moving average.
2.Purpose: Publishing a Bollinger Band indicator serves to provide traders and investors with insights into the volatility and potential price movements of a financial instrument.
3.Visualization: The indicator is typically displayed on price charts, allowing users to visualize the relationship between price movements and volatility levels.
4.Interpretation: Traders use Bollinger Bands to identify overbought and oversold conditions, potential trend reversals, and volatility breakouts.
5.Components: The indicator consists of three main components: the upper band, lower band, and centerline (usually a simple moving average). These components are calculated based on standard deviations from the moving average.
6.Parameters: Traders can adjust the parameters of the Bollinger Bands, such as the period length and standard deviation multiplier, to customize the indicator based on their trading strategy and preferences.
7.Signals: Bollinger Bands generate signals when prices move outside the bands, indicating potential trading opportunities. For example, a price breakout above the upper band may signal a bullish trend continuation, while a breakout below the lower band may indicate a bearish trend continuation.
8.Confirmation: Traders often use other technical indicators or price action analysis to confirm signals generated by Bollinger Bands, enhancing the reliability of their trading decisions.
9.Education: Publishing Bollinger Band indicators can serve an educational purpose, helping traders learn about technical analysis concepts and how to apply them in real-world trading scenarios.
10.Risk Management: Traders should exercise proper risk management when using Bollinger Bands, as false signals and market volatility can lead to losses. Publishing educational content alongside the indicator can help users understand the importance of risk management in trading.
VWAP:
1.Calculation: VWAP is calculated by dividing the cumulative sum of price times volume traded for every transaction (price * volume) by the total volume traded.
2.Time Frame: VWAP is typically calculated for a specific time frame, such as a trading day or a session.
3.Intraday Trading: It's commonly used by intraday traders to assess the fair value of a security and to determine if the current price is above or below the average price traded during the day.
4.Execution: Institutional traders often use VWAP as a benchmark for executing large orders, aiming to buy at prices below VWAP and sell at prices above VWAP.
5.Benchmark: It serves as a benchmark for traders to evaluate their trading performance. Trades executed below VWAP are considered good buys, while those above are considered less favorable.
6.Sensitivity: VWAP is more sensitive to price and volume changes during periods of high trading activity and less sensitive during periods of low trading activity.
7.Day's End: VWAP resets at the end of each trading day, providing a new reference point for the following trading session.
8.Volume Weighting: The weighting by volume means that prices with higher trading volumes have a greater impact on VWAP than those with lower volumes.
9.Popular with Algorithmic Traders: Algorithmic trading systems often incorporate VWAP strategies to execute trades efficiently and minimize market impact.
10.Limitations: While VWAP is a useful indicator, it's not foolproof. It may lag behind rapidly changing market conditions and may not be suitable for all trading strategies or market conditions. Additionally, it's more effective in liquid markets where there is significant trading volume.

Day Open Line + SMA 8/3 Crossover + BollingerHow Users Can Make Profit Using This Script:
DAYS OPEN LINE:
1.Purpose: Publishing a "Days Open Line" indicator serves to inform customers about the operational schedule of a business or service.
2.Visibility: It ensures that the information regarding the days of operation is easily accessible to current and potential customers.
3.Transparency: By making the operational schedule public, businesses demonstrate transparency and reliability to their customers.
4.Accessibility: The indicator should be published on various platforms such as the business website, social media channels, and physical locations to ensure accessibility to a wide audience.
5.Clarity: The information should be presented in a clear and concise manner, specifying the days of the week the business is open and the corresponding operating hours.
6.Updates: It's important to regularly update the "Days Open Line" indicator to reflect any changes in the operational schedule, such as holidays or special events.
7.Customer Convenience: Providing this information helps customers plan their visits accordingly, reducing inconvenience and frustration due to unexpected closures.
8.Expectation Management: Setting clear expectations regarding the business hours helps manage customer expectations and reduces the likelihood of disappointment or complaints.
9.Customer Service: Publishing the "Days Open Line" indicator demonstrates a commitment to customer service by ensuring that customers have the information they need to engage with the business.
10.Brand Image: Consistently .maintaining and updating the indicator contributes to a positive brand image, as it reflects professionalism, reliability, and a customer-centric approach.
SMA CROSS:
1.This indicator generates buy and sell signals based on the crossover of two Simple Moving Averages (SMA): a shorter 3-day SMA and a longer 8-day SMA.
When the 3-day SMA crosses above the 8-day SMA, it generates a buy signal indicating a potential upward trend.
Conversely, when the 3-day SMA crosses below the 8-day SMA, it generates a sell signal indicating a potential downward trend.
Signal Interpretation:
2.Buy Signal: Generated when the 3-day SMA crosses above the 8-day SMA.
Sell Signal: Generated when the 3-day SMA crosses below the 8-day SMA.
Usage:
3.Traders can use this indicator to identify potential entry and exit points in the market.
Buy signals suggest a bullish trend, indicating a favorable time to enter or hold a long position.
4.Sell signals suggest a bearish trend, indicating a potential opportunity to exit or take a short position.
Parameters:
5.Periods: 3-day SMA and 8-day SMA.
Price: Closing price is commonly used, but users can choose other price types (open, high, low) for calculation.
Confirmation:
6.It's recommended to use additional technical analysis tools or confirmatory indicators to validate signals and minimize false signals.
Risk Management:
7.Implement proper risk management strategies, such as setting stop-loss orders, to mitigate losses in case of adverse price movements.
Backtesting:
8.Before using the indicator in live trading, conduct thorough backtesting to evaluate its effectiveness under various market conditions.
Considerations:
9.While SMA crossovers can provide valuable insights, they may generate false signals during ranging or choppy markets.
Combine this indicator with other technical analysis techniques for comprehensive market analysis.
Continuous Optimization:
10.Monitor the performance of the indicator and adjust parameters or incorporate additional filters as needed to enhance accuracy over time.
BOLLINGER BAND:
1.Definition: A Bollinger Band indicator is a technical analysis tool that consists of a centerline (typically a moving average) and two bands plotted above and below it. These bands represent volatility around the moving average.
2.Purpose: Publishing a Bollinger Band indicator serves to provide traders and investors with insights into the volatility and potential price movements of a financial instrument.
3.Visualization: The indicator is typically displayed on price charts, allowing users to visualize the relationship between price movements and volatility levels.
4.Interpretation: Traders use Bollinger Bands to identify overbought and oversold conditions, potential trend reversals, and volatility breakouts.
5.Components: The indicator consists of three main components: the upper band, lower band, and centerline (usually a simple moving average). These components are calculated based on standard deviations from the moving average.
6.Parameters: Traders can adjust the parameters of the Bollinger Bands, such as the period length and standard deviation multiplier, to customize the indicator based on their trading strategy and preferences.
7.Signals: Bollinger Bands generate signals when prices move outside the bands, indicating potential trading opportunities. For example, a price breakout above the upper band may signal a bullish trend continuation, while a breakout below the lower band may indicate a bearish trend continuation.
8.Confirmation: Traders often use other technical indicators or price action analysis to confirm signals generated by Bollinger Bands, enhancing the reliability of their trading decisions.
9.Education: Publishing Bollinger Band indicators can serve an educational purpose, helping traders learn about technical analysis concepts and how to apply them in real-world trading scenarios.
10.Risk Management: Traders should exercise proper risk management when using Bollinger Bands, as false signals and market volatility can lead to losses. Publishing educational content alongside the indicator can help users understand the importance of risk management in trading.
VWAP:
1.Calculation: VWAP is calculated by dividing the cumulative sum of price times volume traded for every transaction (price * volume) by the total volume traded.
2.Time Frame: VWAP is typically calculated for a specific time frame, such as a trading day or a session.
3.Intraday Trading: It's commonly used by intraday traders to assess the fair value of a security and to determine if the current price is above or below the average price traded during the day.
4.Execution: Institutional traders often use VWAP as a benchmark for executing large orders, aiming to buy at prices below VWAP and sell at prices above VWAP.
5.Benchmark: It serves as a benchmark for traders to evaluate their trading performance. Trades executed below VWAP are considered good buys, while those above are considered less favorable.
6.Sensitivity: VWAP is more sensitive to price and volume changes during periods of high trading activity and less sensitive during periods of low trading activity.
7.Day's End: VWAP resets at the end of each trading day, providing a new reference point for the following trading session.
8.Volume Weighting: The weighting by volume means that prices with higher trading volumes have a greater impact on VWAP than those with lower volumes.
9.Popular with Algorithmic Traders: Algorithmic trading systems often incorporate VWAP strategies to execute trades efficiently and minimize market impact.
10.Limitations: While VWAP is a useful indicator, it's not foolproof. It may lag behind rapidly changing market conditions and may not be suitable for all trading strategies or market conditions. Additionally, it's more effective in liquid markets where there is significant trading volume.
How the Script Works:
1.Utilizes Day Open Line for accurate market entry points.
2.Identifies bullish trends with SMA 3 crossover SMA 8.
3.Signals potential sell opportunities with SMA 8 crossunder SMA 3.
4.Bollinger Bands indicate overbought and oversold conditions.
5.VWAP offers insights into average price levels weighted by volume.
6.Combination of indicators enhances trade confirmation.
7.Facilitates precise timing for buy and sell decisions.
8.Enables traders to capitalize on market volatility.
9.Empowers users to navigate dynamic market conditions.
10.Supports profitable trading strategies with comprehensive analysis.
11.It is known when the market is sideways.

ORBs, EMAs, AVWAPThis Pine Script (version 6) is a multi-session trading indicator that combines Opening Range Breakouts (ORBs), Exponential Moving Averages (EMAs), and an Anchored VWAP (AVWAP) system — all in one overlay script for TradingView.
Here’s a clear breakdown of its structure and functionality:
🕒 1. Session Logic and ORB Calculation
Purpose: Identify and plot the high and low of the first 30 minutes (default) for the Tokyo, London, and New York trading sessions.
Session Anchors (NY time):
Tokyo → 20:00
London → 03:00
New York → 09:30
(All configurable in inputs.)
ORB Duration: Default is 30 minutes (orbDurationMin), also user-configurable.
Resets:
London and NY ORBs reset at the start of each new New York trading day (17:00 NY time).
Tokyo ORB resets independently using a stored timestamp.
Process:
For each session:
While the time is within the ORB window, the script captures the session’s high and low.
Once the window closes, those levels remain plotted until reset.
Plot Colors:
Tokyo → Yellow (#fecc02)
London → Gray (#8c9a9c)
New York → Magenta (#ff00c8)
These form visible horizontal lines marking the prior session ranges — useful for breakout or retest trading setups.
📈 2. EMA System
Purpose: Provide trend and dynamic support/resistance guidance.
It calculates and plots four EMAs:
EMA Period Color Purpose
EMA 9 Short-term Green Fast signal
EMA 20 Short-term Red Confirms direction
EMA 113 Medium Aqua Trend filter
EMA 200 Long-term Orange Macro trend baseline
Each EMA is plotted directly on the price chart for visual confluence with ORB and VWAP levels.
⚖️ 3. Anchored VWAP (AVWAP)
Purpose: Display a volume-weighted average price anchored to specific timeframes or events, optionally with dynamic deviation or percentage bands.
Features:
Anchor Options:
Time-based: Session, Week, Month, Quarter, Year, Decade, Century
Event-based: Earnings, Dividends, Splits
VWAP resets when the chosen anchor condition is met (e.g., new month, new earnings event, etc.).
Bands:
Up to three levels of symmetric upper/lower bands.
Choose between Standard Deviation or Percentage-based widths.
Display Toggles:
Each band’s visibility is optional.
VWAP can be hidden on 1D+ timeframes (hideonDWM option).
Color Scheme:
VWAP: Fuchsia (magenta-pink) line
Bands: Green / Olive / Teal with light-filled zones
⚙️ 4. Technical Highlights
Uses ta.vwap() with built-in band calculations.
Handles instruments with or without volume (errors if missing volume).
Uses time-zone aware timestamps (timestamp(NY_TZ, …)).
Uses timeframe.change() to detect new anchors for the VWAP.
Employs persistent variables (var) to maintain session state across bars.
💡 In Practice
This indicator is designed for multi-session intraday traders who:
Trade Tokyo, London, or NY open breakouts or retests.
Use EMA stacking and crossovers for trend confirmation.
Use Anchored VWAP as a fair-value or mean-reversion reference.
Need clear visual structure across different market sessions.
It provides strong session separation, trend context, and volume-weighted price reference — making it ideal for discretionary or semi-systematic trading strategies focused on liquidity zones and session momentum.

BooBee Digital - Enhanced Buy & Sell Alerts Suite
BooBee Digital - Enhanced Buy & Sell Alerts Suite
Introduction:
The “BooBee Digital - Enhanced Buy & Sell Alerts Suite” is a comprehensive trading tool designed to provide traders with precise buy and sell signals by integrating the Average True Range (ATR) trailing stop technique and the Volume Weighted Average Price (VWAP) indicator. This script is tailored to help traders make informed decisions by considering both market volatility and trading volume.
How It Works:
1. ATR Calculation:
• Purpose: Measures market volatility to set dynamic stop levels.
• Details: The Average True Range (ATR) is calculated over a user-defined period. The ATR value reflects the average range of price movements over the specified period, which is crucial for assessing market volatility.
2. ATR Trailing Stop:
• Purpose: Identifies potential trend reversals by setting trailing stops based on market volatility.
• Details: The ATR trailing stop is dynamically adjusted using the ATR value and a user-defined sensitivity factor. This trailing stop level helps identify trend reversals by moving in accordance with price fluctuations.
3. VWAP Calculation:
• Purpose: Provides a volume-weighted average price to benchmark fair value.
• Details: The VWAP is calculated by taking the sum of the product of price and volume, divided by the total volume. This indicator gives traders a reference point for the average price at which the asset has traded throughout the day, considering trading volume.
4. EMA Crossover:
• Purpose: Adds a confirmation layer for buy and sell signals.
• Details: A 1-period Exponential Moving Average (EMA) is used to identify short-term price movements. Buy and sell signals are generated based on the crossover of the EMA and the ATR trailing stop, adding an extra layer of confirmation for trade entries and exits.
Signal Generation:
Buy Signal:
• Generated when the price is above the ATR trailing stop and there is a bullish crossover of the EMA and ATR trailing stop.
• Indicator: Green label below the bar with “Buy” text.
Sell Signal:
• Generated when the price is below the ATR trailing stop and there is a bearish crossover of the EMA and ATR trailing stop.
• Indicator: Red label above the bar with “Sell” text.
VWAP Line:
• The VWAP line is plotted on the chart to help traders identify significant price levels based on trading volume.
• Indicator: Blue line representing the VWAP.
How to Use:
• Chart Type: The script is designed for use on standard chart types such as Candlestick and OHLC. It does not support non-standard chart types like Heikin Ashi, Renko, Kagi, Point & Figure, and Range, as they may produce unrealistic results.
• Clean Chart: Ensure your chart is clean and free of other indicators to avoid confusion. The signals and colors plotted by the script should be easily identifiable.
• Trade Confirmation: Use the buy and sell signals generated by the script in conjunction with other analysis methods to confirm trades.
Key Concepts:
• ATR Trailing Stop: This technique sets dynamic stop levels based on market volatility, helping to identify trend reversals.
• VWAP: This indicator provides a benchmark for the average price considering trading volume, helping traders identify fair value.
• EMA Crossover: This adds a layer of confirmation for buy and sell signals, improving the accuracy of trade entries and exits.

Anchored VWAP by Time (Math by Thomas)📄 Description
This tool lets you plot an Anchored Volume Weighted Average Price (VWAP) starting from any specific date and time you choose. Unlike standard VWAPs that reset daily or weekly, this version gives you full control to track institutional pricing zones from precise anchor points—such as key swing highs/lows, market open, or news-driven candles.
It’s especially useful for price action and Smart Money Concepts (SMC) traders who track liquidity, fair value gaps (FVGs), and institutional zones.
🇮🇳 For NSE India Traders
You can anchor VWAP to Indian market open (e.g., 9:15 AM IST) or major events like RBI policy, earnings, or breakout candles.
The time input uses UTC by default, so for Indian Standard Time (IST), remember:
9:15 AM IST = 3:45 AM UTC
3:30 PM IST = 10:00 AM UTC
⚙️ How to Use
Add the indicator to your chart.
Open the settings panel.
Under “Anchor Start Time”, choose the date & time to begin the VWAP.
Use UTC format (adjust from IST if needed).
Customize the line color and thickness to suit your chart style.
The VWAP will begin plotting from that time forward.
🔎 Best Use Cases
Track VWAP from intraday range breakouts
Anchor from swing highs/lows to identify mean reversion zones
Combine with your FVGs, Order Blocks, or CHoCHs
Monitor VWAP reactions during key macro events or expiry days
🔧 Clean Design
No labels are used, keeping your chart clean.
Works on all timeframes (1min to Daily).
Designed for serious intraday & positional traders.

MNQ Pro Scalping | SMA20 + VWAP Color //@version=5
TIFFANY//@version=5
indicator("MNQ Pro Scalping | SMA20 + VWAP Color + ATR SLTP + Fake Breakout", overlay=true)
// ===== INPUTS =====
smaLen = input.int(20, "SMA Length")
atrLen = input.int(14, "ATR Length")
slMult = input.float(1.0, "SL = ATR x", step=0.1)
tpMult = input.float(1.5, "TP = ATR x", step=0.1)
showNY = input.bool(true, "Only New York Session (09:30–16:00 ET)")
// ===== NY SESSION FILTER =====
inNY = not showNY or time(timeframe.period, "0930-1600")
// ===== SMA 20 =====
sma20 = ta.sma(close, smaLen)
smaColor = close > sma20 ? color.green : color.red
plot(sma20, "SMA 20", color=smaColor, linewidth=2)
// ===== VWAP (COLOR CHANGE) =====
vwapVal = ta.vwap(hlc3)
vwapColor = close > vwapVal ? color.green : color.red
plot(vwapVal, "VWAP", color=vwapColor, linewidth=2)
// ===== ATR =====
atr = ta.atr(atrLen)
// ===== CROSS CONDITIONS =====
crossUp = ta.crossover(close, sma20)
crossDown = ta.crossunder(close, sma20)
// ===== VALID TRADE CONDITIONS =====
longCond = crossUp and close > vwapVal and inNY
shortCond = crossDown and close < vwapVal and inNY
// ===== ATR SL / TP LEVELS =====
longSL = close - atr * slMult
longTP = close + atr * tpMult
shortSL = close + atr * slMult
shortTP = close - atr * tpMult
// ===== PLOT SL / TP WHEN SIGNAL =====
plot(longCond ? longSL : na, "Long SL", color=color.red, style=plot.style_linebr)
plot(longCond ? longTP : na, "Long TP", color=color.green, style=plot.style_linebr)
plot(shortCond ? shortSL : na, "Short SL", color=color.red, style=plot.style_linebr)
plot(shortCond ? shortTP : na, "Short TP", color=color.green, style=plot.style_linebr)
// ===== FAKE BREAKOUT DETECTION =====
// Giá cắt SMA nhưng đóng nến quay ngược lại
fakeUp = ta.crossover(high, sma20) and close < sma20
fakeDown = ta.crossunder(low, sma20) and close > sma20
plotshape(fakeUp and inNY, title="Fake Up", style=shape.xcross, location=location.abovebar, color=color.red, size=size.small)
plotshape(fakeDown and inNY, title="Fake Down", style=shape.xcross, location=location.belowbar, color=color.green, size=size.small)
// ===== SIGNAL SHAPES =====
plotshape(longCond, title="LONG", style=shape.triangleup, location=location.belowbar, color=color.green, size=size.small)
plotshape(shortCond, title="SHORT", style=shape.triangledown, location=location.abovebar, color=color.red, size=size.small)
// ===== ALERTS =====
alertcondition(longCond,
title="MNQ LONG – ATR Setup",
message="MNQ LONG: Cross ABOVE SMA20 | Above VWAP | ATR SL/TP valid")
alertcondition(shortCond,
title="MNQ SHORT – ATR Setup",
message="MNQ SHORT: Cross BELOW SMA20 | Below VWAP | ATR SL/TP valid")
alertcondition(fakeUp,
title="Fake Breakout UP",
message="WARNING: Fake breakout ABOVE SMA20")
alertcondition(fakeDown,
title="Fake Breakout DOWN",
message="WARNING: Fake breakout BELOW SMA20")
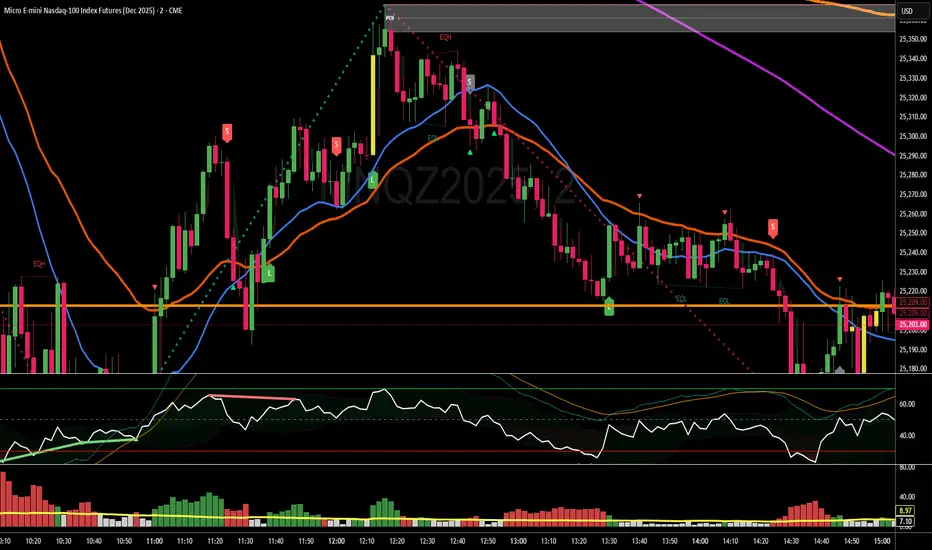
Multi-Timeframe VWAP DashboardMulti-Timeframe VWAP Dashboard with Advanced Customization**
Unlock the power of **Volume-Weighted Average Price (VWAP)** across multiple timeframes with this highly customizable and feature-rich Pine Script. Designed for traders who demand precision and flexibility, this script provides a **comprehensive VWAP dashboard** that adapts to your trading style and strategy. Whether you're a day trader, swing trader, or long-term investor, this tool offers unparalleled insights into market trends and price levels.
---
### **Key Features:**
1. **Multi-Timeframe VWAP Calculation:**
- Calculate VWAP across **12-minute, 48-minute, 96-minute, 192-minute, daily, weekly, monthly, and even yearly timeframes**.
- Supports **custom timeframes** for tailored analysis.
2. **Price Source Selection:**
- Choose from multiple price sources for VWAP calculation, including **Open, High, Low, Close, HL2, HLC3, HLCC4, and All**.
- Optimize VWAP for **uptrends and downtrends** by selecting the most relevant price source.
3. **Customizable Labels:**
- Add **dynamic labels** to each VWAP line for quick reference.
- Customize label **colors, sizes, and offsets** to suit your chart setup.
- Display **price values** and **session types** (e.g., "12 Min", "Daily", "Weekly") directly on the chart.
4. **Advanced Session Detection:**
- Automatically detect new sessions for **intraday, daily, weekly, monthly, and yearly timeframes**.
- Ensures accurate VWAP calculations for each session.
5. **Plot Visibility Control:**
- Toggle the visibility of individual VWAP plots to **reduce clutter** and focus on the most relevant timeframes.
- Includes options for **short-term, medium-term, and long-term VWAPs**.
6. **Comprehensive Timeframe Coverage:**
- From **12-minute intervals** to **12-month intervals**, this script covers all major timeframes.
- Perfect for traders who analyze markets across multiple horizons.
7. **User-Friendly Inputs:**
- Intuitive input options for **timeframes, colors, labels, and offsets**.
- Easily customize the script to match your trading preferences.
8. **Dynamic Label Positioning:**
- Labels adjust automatically based on price movements and session changes.
- Choose from **multiple offset options** to position labels precisely.
9. **Miscellaneous Customization:**
- Adjust **text color, label size, and price display settings**.
- Enable or disable **price values** and **session type labels** for a cleaner chart.
---
### **Why Use This Script?**
- **Versatility:** Suitable for all trading styles, including scalping, day trading, swing trading, and long-term investing.
- **Precision:** Accurate VWAP calculations across multiple timeframes ensure you never miss key price levels.
- **Customization:** Tailor the script to your specific needs with a wide range of input options.
- **Clarity:** Dynamic labels and customizable plots make it easy to interpret market trends at a glance.
---
### **How It Works:**
1. **Select Your Price Source:**
- Choose the price source (e.g., Open, Close, HL2) for VWAP calculation based on your trading strategy.
2. **Choose Timeframes:**
- Define the timeframes for VWAP calculation, from intraday to yearly intervals.
3. **Customize Labels and Plots:**
- Enable or disable labels and plots for each timeframe.
- Adjust colors, sizes, and offsets to match your chart setup.
4. **Analyze Market Trends:**
- Use the VWAP lines and labels to identify **support/resistance levels**, **trend direction**, and **potential reversal points**.
5. **Adapt to Market Conditions:**
- Switch between timeframes and price sources to adapt to changing market conditions.
---
### **Ideal For:**
- **Day Traders:** Use short-term VWAPs (e.g., 12-minute, 48-minute) to identify intraday trends and key levels.
- **Swing Traders:** Leverage medium-term VWAPs (e.g., 96-minute, daily) to spot swing opportunities.
- **Long-Term Investors:** Analyze long-term VWAPs (e.g., weekly, monthly) to gauge overall market direction.
---
### **How to Get Started:**
1. Add the script to your TradingView chart.
2. Customize the inputs to match your trading preferences.
3. Analyze the VWAP lines and labels to make informed trading decisions.
---
### **Pro Tip:**
Combine this script with other technical indicators (e.g., moving averages, RSI) for a **holistic view** of the market. Use the VWAP lines as dynamic support/resistance levels to enhance your entry and exit strategies.
This script is a must-have tool for traders who value precision, flexibility, and clarity. Share it with your audience to help them elevate their trading game. Whether they're beginners or seasoned professionals, this **Multi-Timeframe VWAP Dashboard** will become an essential part of their toolkit.

PRO Scalper(EN)
## What it is
**PRO Scalper** is an intraday price–action and liquidity map that helps you see where the market is likely to move **now**, not just where it has been.
It combines five building blocks that professional scalpers often watch together:
1. **Session Volume-Weighted Average Price (VWAP)** — the intraday “fair value” anchor.
2. **Opening Range** — the first minutes of the session that set the day’s balance.
3. **Trend filter** — higher-timeframe bias using **Exponential Moving Averages (EMA)** and optional **Average Directional Index (ADX)** strength.
4. **Two independent Supply/Demand zone engines** — zones are drawn from confirmed swing pivots, with midlines and **touch counters**.
5. **Order-flow style visuals**:
* **Delta bubbles** (green/red circles) show where buying or selling pressure was unusually strong, using a safe **delta proxy** (no external feeds).
* **Liquidity densities** (subtle rectangular bands) highlight clusters of large activity that often act as magnets or barriers and disappear when “eaten” by strong moves.
This mix gives you a **complete intraday picture**: the mean (VWAP), the day’s initial balance (Opening Range), the higher-timeframe push (trend filter), the nearby fuel or brakes (zones), and the live pressure points (bubbles and densities).
---
## Why these components
* **VWAP** tracks where the bulk of traded value sits. Price tends to rotate around it or accelerate away from it — a perfect compass for scalps.
* **Opening Range** frames the early auction. Many intraday breaks, fades and retests start at its boundaries.
* **EMA bias + ADX strength** separates trending conditions from chop, so you can keep only the zones that agree with the bigger push.
* **Pivot-based zones (two pairs at once)** are simple, objective and fast. Midlines help with confirmations; touch counters quantify how many times the zone was tested.
* **Bubbles and densities** add the “effort” layer: where the push appeared and where liquidity is concentrated. You see **where** a move is likely to continue or fail.
Together they reduce ambiguity: **context + level + effort** — all on one screen.
---
## How it works (plain language)
* **VWAP** resets each day and is calculated as the cumulative sum of typical price multiplied by volume divided by total volume.
* **Opening Range** is either automatic (a multiple of your chart timeframe) or a manual number of minutes. While it is forming, the highest high and lowest low are captured and plotted as the range.
* **Trend filter**
* **EMA Fast** and **EMA Slow** define directional bias.
* **ADX (optional)** adds “trend strength”: only when the Average Directional Index is above the chosen threshold do we treat the move as strong. You can source this from a higher timeframe.
* **Zones**
* There are **two independent pairs** of pivots at the same time (for example 10-left 10-right and 5-left 5-right).
* Each detected pivot creates a **Supply** (from a swing high) or **Demand** (from a swing low) box. Box depth = **zone depth × Average True Range** for adaptive sizing; the boxes **extend forward**.
* Midline (optional dashed line inside the box) is the “balance” of the zone.
* **“Only in trend”** mode can hide boxes that go against the higher-timeframe bias.
* The **touch counter** increases when price revisits the box. Labels show the pair name and the number of touches.
* **Bubbles**
* A safe **delta proxy** measures bar pressure (for example, range-weighted close vs open).
* A **quantile filter** shows only unusually large pressure: choose lookback and percentile, and the script draws a circle sized by intensity (green = bullish pressure, red = bearish).
* **Densities**
* The script marks heavy activity clusters as **subtle bands** around price (depth = fraction of Average True Range).
* If price **breaks** a density with volume above its moving average, the band **disappears** (“eaten”), which often precedes continuation.
---
## How to use — practical playbooks
> Recommended chart: crypto or index futures, one to five minutes. Use **one hour** or **fifteen minutes** for the higher-timeframe bias.
### 1) Trend pullback scalp (continuation)
1. Enable **Only in trend** zones.
2. In an uptrend: wait for a pullback into a **Demand** zone that overlaps with VWAP or sits just below the Opening Range midpoint.
3. Look for **green bubbles** near the zone’s bottom or a fresh **density** under price.
4. Enter on a candle closing **back above the zone midline**.
5. Stop-loss: below the bottom of the zone or a small multiple of Average True Range.
6. Targets: previous swing high, Opening Range high, fixed risk multiples, or VWAP.
Mirror the logic for downtrends using Supply zones, red bubbles and densities above price.
### 2) Reversion with liquidity sweep (fade)
1. Bias neutral or countertrend allowed.
2. Price **wicks through** a zone boundary (or an Opening Range line) and **closes back inside** the zone.
3. The bubble color often flips (absorption).
4. Enter toward the **inside** of the zone; stop beyond the sweep wick; first target = zone midline, second = opposite side of the zone or VWAP.
### 3) Opening Range break and retest
1. Wait for the Opening Range to complete.
2. A break with a large bubble suggests intent.
3. Look for a **retest** into a nearby zone aligned with VWAP.
4. Trade continuation toward the next zone or the session extremes.
### 4) Density “eaten” continuation
1. When a density band **disappears** on high volume, it often means the resting liquidity was consumed.
2. Trade in the direction of the break, toward the nearest opposing zone.
---
## Settings — quick guide
**Core**
* *ATR Length* — used for zone and density depths.
* *Show VWAP / Show Opening Range*.
* *Opening Range*: Auto (multiple of timeframe minutes) or Manual minutes.
**Trend Filter**
* *Mode*: Off, EMA only, or EMA with ADX strength.
* *Use higher timeframe* and its value.
* *EMA Fast / EMA Slow*, *ADX Length*, *ADX threshold*.
* *Plot EMA filter* to display the moving averages.
**Zones (two pairs)**
* *Pivot A Left / Right* and *Pivot B Left / Right*.
* *Zone depth × ATR*, *Extend bars*.
* *Show zone midline*, *Only in trend zones*.
* Labels automatically show the touch counters.
**Bubbles**
* *Show Bubbles*.
* *Quantile lookback* and *Quantile percent* (higher percent = stricter filter, fewer bubbles).
**Densities**
* *Metric*: absolute delta proxy or raw volume.
* *Quantile lookback / percent*.
* *Depth × ATR*, *Extend bars*, *Merge distance* (in ATR),
* *Break condition*: volume moving average length and multiplier,
* *Midline for densities* (optional dashed line).
---
## Tips and risk management
* This script **does not use external order-flow feeds**. Delta is a **proxy** suitable for TradingView; tune quantiles per symbol and timeframe.
* Do not trade every bubble. Combine **context (trend + VWAP + Opening Range)** with **level (zone)** and **effort (bubble/density)**.
* Set stop-losses beyond the zone or at a fraction of Average True Range. Predefine risk per trade.
* Backtest your rules with a strategy script before using real funds.
* Markets differ. Parameters that work on Bitcoin may not transfer to low-liquidity altcoins or stocks.
* Nothing here is financial advice. Scalping is high-risk; slippage and over-trading can quickly damage your account.
---
## What makes PRO Scalper unique
* Two **independent** zone engines run in parallel, so you can see both **larger structure** and **fine intraday levels** at the same time.
* Clean **“only in trend” rendering** — zones and midlines against the bias can be hidden, reducing clutter and hesitation.
* **Touch counters** convert “feel” into numbers.
* **Self-contained order-flow visuals** (bubbles and densities) that require no extra data sources.
* Careful defaults: subtle colors for densities, clearer zones, and responsive auto Opening Range.
---
(RU)
## Что это такое
**PRO Scalper** — это индикатор для внутридневной торговли, который показывает **контекст и ликвидность прямо сейчас**.
Он объединяет пять модулей, которыми профессиональные скальперы пользуются вместе:
1. **VWAP** — средневзвешенная по объему цена за сессию, «справедливая стоимость» дня.
2. **Opening Range** — первая часть сессии, задающая баланс дня.
3. **Фильтр тренда** — направление старшего таймфрейма по **экспоненциальным средним** и при желании по силе тренда **Average Directional Index**.
4. **Две независимые системы зон спроса/предложения** — зоны строятся от подтвержденных экстремумов (пивотов), имеют **среднюю линию** и **счетчик касаний**.
5. **Визуализация «ордер-флоу»**:
* **Пузыри дельты** (зеленые/красные круги) — места повышенного покупательного/продажного давления, рассчитанные через безопасный **прокси-дельты**.
* **Плотности ликвидности** (ненавязчивые прямоугольные ленты) — скопления объема, которые нередко притягивают цену или удерживают ее и исчезают, когда «разъедаются» сильным движением.
Итог — **полная картинка момента**: среднее (VWAP), баланс дня (Opening Range), старшая сила (фильтр тренда), ближайшие уровни топлива/тормозов (зоны), текущие точки усилия (пузыри и плотности).
---
## Почему именно эти элементы
* **VWAP** показывает, где сосредоточена стоимость; цена либо вращается вокруг него, либо быстро уходит — идеальный ориентир скальпера.
* **Opening Range** фиксирует ранний аукцион — от его границ часто начинаются пробои, возвраты и ретесты.
* **EMA + ADX** отделяют тренд от «пилы», позволяя оставлять на графике только зоны по направлению старшего таймфрейма.
* **Зоны от пивотов** просты, объективны и быстры; средняя линия помогает подтверждать разворот, счетчик касаний переводит субъективность в цифры.
* **Пузыри и плотности** добавляют слой «усилия»: где именно возник толчок и где сконцентрирована ликвидность.
Комбинация **контекста + уровня + усилия** уменьшает двусмысленность и ускоряет принятие решения.
---
## Как это работает (простыми словами)
* **VWAP** каждый день стартует заново: сумма «типичной цены × объем» делится на суммарный объем.
* **Opening Range** — автоматический (кратный минутам вашего таймфрейма) или вручную заданный период; пока он формируется, фиксируются максимум и минимум.
* **Фильтр тренда**
* Две экспоненциальные средние задают направление.
* **ADX** (по желанию) добавляет «силу». Источник можно взять со старшего таймфрейма.
* **Зоны**
* Одновременно работает **две пары** пивотов (например 10-лево 10-право и 5-лево 5-право).
* От пивота строится зона **предложения** (от максимума) или **спроса** (от минимума). Глубина зоны = **коэффициент × Average True Range**; зона тянется вперед.
* Внутри рисуется **средняя линия** (по желанию).
* Режим **«только по тренду»** скрывает зоны против старшего направления.
* **Счетчик касаний** увеличивается, когда цена снова входит в зону; подпись показывает пару и количество касаний.
* **Пузыри**
* Используется безопасный **прокси-дельты** — измерение «напряжения» внутри свечи.
* Через **квантильный фильтр** выводятся только необычно сильные места: настраиваются окно и процент квантиля; размер кружка — сила, цвет: зеленый покупатели, красный продавцы.
* **Плотности**
* Крупные активности отмечаются **ненавязчивыми прямоугольниками** (глубина — доля Average True Range).
* Если плотность **пробивается** объемом выше среднего, она **исчезает** — часто это предвещает продолжение.
---
## Как пользоваться — практические схемы
> Рекомендация: крипто или фьючерсы, таймфрейм 1–5 минут. Для старшего фильтра удобно взять **1 час** или **15 минут**.
### 1) Скальп на откат по тренду
1. Включите **«только по тренду»**.
2. В восходящем тренде дождитесь отката в **зону спроса**, желательно рядом с **VWAP** или серединой **Opening Range**.
3. Подтверждение — **зеленые пузыри** у нижней границы зоны или свежая **плотность** под ценой.
4. Вход после закрытия свечи **выше средней линии** зоны.
5. Стоп-лосс: за нижнюю границу зоны или небольшой множитель Average True Range.
6. Цели: предыдущий максимум, верх Opening Range, фиксированные R-множители, либо VWAP.
Для нисходящего тренда зеркально: зоны предложения, красные пузыри и плотности над ценой.
### 2) Контрдвижение с «выбиванием ликвидности»
1. Нейтральный или контртрендовый режим.
2. Цена **выносит хвостом** границу зоны (или линию Opening Range) и **закрывается обратно внутри**.
3. Цвет пузыря часто меняется (поглощение).
4. Вход внутрь зоны; стоп — за хвост выбивания; цели: средняя линия, противоположная граница зоны или VWAP.
### 3) Пробой Opening Range + ретест
1. Дождитесь завершения диапазона.
2. Сильный пробой с крупным пузырем — признак намерения.
3. Ищите **ретест** в зоне по тренду рядом с линией диапазона и VWAP.
4. Торгуйте продолжение к следующей зоне.
### 4) Продолжение после «съеденной» плотности
1. Когда прямоугольник плотности **исчезает** на повышенном объеме, это значит, что ликвидность поглощена.
2. Торгуйте в сторону пробоя к ближайшей противоположной зоне.
---
## Настройки — краткая шпаргалка
**Core**
— Длина Average True Range (для размеров зон и плотностей).
— Включение VWAP и Opening Range.
— Длина Opening Range: автоматическая (кратная минутам ТФ) или ручная.
**Trend Filter**
— Режим: выкл., только средние, либо средние + ADX.
— Источник со старшего таймфрейма и его значение.
— Длины средних, длина ADX и порог силы.
— Показать/скрыть линий средних.
**Zones (две пары одновременно)**
— Пара A: лев/прав; Пара B: лев/прав.
— Глубина зоны × Average True Range, продление по барам.
— Средняя линия, режим **«только по тренду»**.
— Подписи со счетчиком касаний.
**Bubbles**
— Вкл./выкл., окно поиска и процент квантиля (чем выше процент — тем реже пузыри).
**Densities**
— Метрика: абсолютная прокси-дельты или чистый объем.
— Окно/квантиль, глубина × Average True Range, продление,
— Порог объединения (в Average True Range),
— Условие «разъедания» по объему,
— Средняя линия плотности (по желанию).
---
## Советы и риски
* Индикатор **не использует внешние потоки ордер-флоу**. Дельта — **прокси**, подходящая для TradingView; подбирайте квантили под инструмент и таймфрейм.
* Не торгуйте каждый пузырь. Склейте **контекст (тренд + VWAP + Opening Range)** с **уровнем (зона)** и **усилием (пузырь/плотность)**.
* Стоп-лосс — за границей зоны или по Average True Range. Риск на сделку задавайте заранее.
* Перед реальными деньгами протестируйте правила в стратегии.
* Разные рынки ведут себя по-разному; настройки из Биткоина могут не подойти малоликвидным альткоинам или акциям.
* Это не инвестиционная рекомендация. Скальпинг — высокий риск; проскальзывание и переизбыток сделок быстро наносят ущерб капиталу.
---
## Чем уникален PRO Scalper
* Две **одновременные** системы зон показывают и **крупную структуру**, и **точные локальные уровни**.
* Режим **«только по тренду»** чистит экран от лишних уровней и ускоряет решение.
* **Счетчики касаний** дают количественную опору.
* **Самодостаточные визуализации усилия** (пузыри и плотности) — без сторонних источников данных.
* Аккуратная цветовая схема: плотности — мягко, зоны — ясно; Opening Range — адаптивный.
Пусть он станет вашей «картой местности» для быстрых и дисциплинированных решений внутри дня.

Three Legged GooseThree Legged Goose
Three-Legged Goose is an all-in-one intraday trading system.
It features a sleek and customizable Opening range overlay with infinitely generating price targets, Average Daily Range Zones, Curated Anchored VWAPs, Total Volume and ATR analysis, as well as our state of the art Market Momentum Trend detection.
Three-Legged Goose also has important Daily levels, including the Previous Day's High and Low and the Current Days Open, three fully customizable Exponential Moving Averages, a customizable ema cloud, and a toggleable standard vwap.
Using this indicator allows you to get rid of any unnecessary indicators that are taking up those valuable slots in TradingView.
AVWAP + ORBS:
The Opening Range Breakout system builds off of our recommended 15min opening range and does all of your price target calculations based on the width of the opening range. These targets are fully customizable within the settings,
to allow fine-tuning from ticker to ticker. We have programmed three Anchored vwaps at different time intervals to act as a dynamic trend-finding instrument. These, along with the opening range breakout system, can help you quickly spot the day's trend and dynamic support and resistance long before your standard moving averages have caught up with price intraday.
Average Daily Range Zones:
We believe these zones to be essential to trading, especially with our system. These zones tend to act as areas of major support and resistance as well as give an idea of the projected volatility of the underlying.
Market Momentum Trend Detection:
We paint our momentum analysis directly on your candles. By taking the overall Market Internals + the underlying's Price movement, we can determine areas where we feel comfortable adding risk on or taking risk off.
This will help those that struggle at identifying trends and valid reversals.
All of the default settings are our recommended settings.
Please check the Author Instructions Below for how to gain access to our indicators.
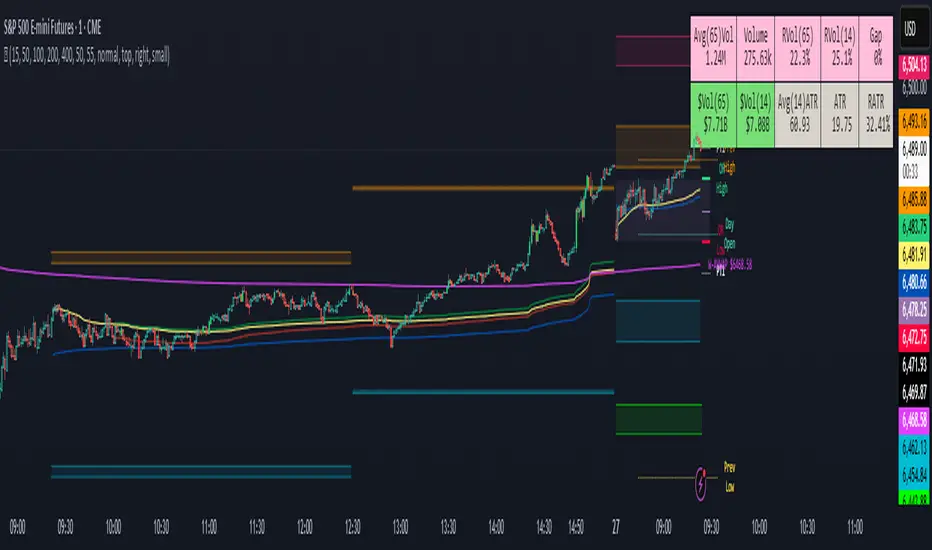
PKSE Buy/Sell Signals Table - Two Columns with VWAPndicator Description: PKSE Buy/Sell Signals Table - Two Columns with VWAP
Overview
The PKSE Buy/Sell Signals Table - Two Columns with VWAP is a robust Pine Script indicator for Pakistan Stock Exchange (PSX) traders. It generates buy and sell signals for 19 PSX stocks based on Simple Moving Average (SMA) crossovers, KSE100 Index trends, and daily Volume Weighted Average Price (VWAP) conditions, displayed in two compact, side-by-side tables optimized for monitor viewing.
Purpose
This indicator helps traders identify high-probability trading opportunities by filtering signals with VWAP to reduce noise, ideal for swing traders, day traders, and investors monitoring PSX stocks.
Key Features
Dual-Table Layout: Displays 19 stocks in two side-by-side tables (10 and 9 stocks) for a monitor-friendly view.
Enhanced Signal Logic: Combines three conditions:
KSE100 Trend: Signals depend on the KSE100 Index being above/below its SMA.
Stock SMA: Signals based on stock price crossing or being above/below its SMA.
Daily VWAP Filter: Buy signals require the stock to be above its daily VWAP; sell signals require it to be below.
Signal Types:
Buy NOW: Stock crosses above SMA, KSE100 is bullish, stock above VWAP.
Buy: Stock above SMA, KSE100 bullish, stock above VWAP.
Sell NOW: Stock crosses below SMA, KSE100 bearish, stock below VWAP.
Sell: Stock below SMA, KSE100 bearish, stock below VWAP.
Neutral: Conditions not fully met.
No Data: Invalid or missing data.
Customizable Inputs:
SMA length (default: 5).
Timeframe (5, 15, 30, 60 minutes, daily; default: 30 minutes).
KSE100 symbol (default: "PSX:KSE100").
Color-Coded Signals: Green (Buy), lime (Buy NOW), red (Sell), orange (Sell NOW), gray (No Data), white (Neutral).
Stock Coverage: Tracks 19 PSX stocks (e.g., FFC, OGDC, HUBC, UBL, MCB, LUCK).
Error Handling: Handles invalid symbols or missing data with "No Data" signals.
How It Works
Fetches KSE100 and stock prices in the selected timeframe (default: 30 minutes) and daily VWAP.
Calculates SMA for KSE100 and stocks; evaluates VWAP position.
Generates signals when all conditions align, based on the 30-minute candle close.
Displays results in two tables (Stock, Signal, Timeframe) at top-right and top-center.
Usage Instructions
Add the indicator to your TradingView chart.
Configure inputs: SMA length, timeframe, KSE100 symbol.
View tables showing signals for 19 PSX stocks.
Use signals to guide trading, combining with other analysis.
Adjust table positions if needed (modify position.top_right/top_center).
Ideal For
PSX traders using SMA and VWAP strategies.
Swing/day traders seeking filtered signals.
Investors tracking KSE100 and stock trends.
Limitations
Limited to 19 stocks due to TradingView’s 40-security-call limit.
Signals rely on SMA, VWAP, and KSE100; combine with other analysis.
Hardcoded stock list; contact the author for customizations.
Notes
Verify stock symbols are valid on your TradingView platform.
Best on 1920x1080+ resolution. Adjust chart scaling if tables overlap.
Published on June 12, 2025, at 11:50 AM PKT.
Disclaimer
Trading carries risk. This indicator is for informational purposes only and not financial advice. Conduct your own research before trading.

CloudfareCloudfare - Advanced Market Sentiment Visualization System
What It Does:
Cloudfare is a proprietary market sentiment analysis tool that visualizes real-time money flow and order flow through a dynamic cloud system. Unlike traditional indicators that lag price action, Cloudfare provides forward-looking market sentiment analysis by combining multiple proprietary algorithms.
Core Innovation - Dynamic Cloud Technology:
The cloud system is the primary innovation, not a simple mashup of existing indicators. It uses a proprietary algorithm that:
Analyzes money flow velocity through volume-weighted price action
Calculates institutional order flow patterns using proprietary OBV modifications
Implements a unique "breathing" algorithm that expands/contracts based on market volatility
Uses color-coded transparency to indicate sentiment strength (0-100 scale)
Proprietary Signal Generation:
Higher High/Lower Low Pattern Recognition: Custom algorithm that identifies price breakouts with 3-bar confirmation and volume divergence analysis
Signal Strength Scoring: Proprietary 0-100 scoring system that combines price action, volume surge detection, RSI momentum shifts, and money flow velocity
Dynamic Glow System: Signal brightness adapts to market conditions - brighter signals indicate higher probability setups
Technical Methodology:
Money Flow Analysis: Custom MFI implementation with volume weighting and momentum calculations
Order Flow Tracking: Proprietary OBV modifications that detect institutional accumulation/distribution
Volume Divergence Detection: Unique algorithm that identifies volume patterns not visible in standard indicators
Multi-Factor Confirmation: Combines 5 different confirmation methods to filter false signals
Why This Justifies Closed-Source Protection:
The core algorithms for cloud generation, signal strength calculation, and dynamic glow adaptation are proprietary mathematical models developed over 3 months of testing. These are not simple combinations of existing indicators but original mathematical approaches to market sentiment visualization.
Unique Value Proposition:
Real-time sentiment visualization through the breathing cloud system
Forward-looking signals that anticipate trend changes before price confirmation
Adaptive transparency that changes based on market conditions
Multi-timeframe VWAP integration with proprietary anchoring methodology
How to Use:
Cloud Analysis: Green cloud indicates bullish money flow, red indicates bearish pressure
Diamond Signals: Green diamonds below price for bullish reversals, red diamonds above for bearish
Signal Strength: Brighter diamonds represent higher probability setups
Trend Confirmation: 5-day confirmation system filters noise and false signals
Best Practices:
Works optimally on daily and 4-hour timeframes
Combine with price action analysis for maximum effectiveness
Monitor cloud color changes for early trend shift warnings
Use diamond signals for entry/exit timing
Author's Instructions:
To request access to this invite-only script, please contact me directly through TradingView messaging with your trading experience and intended use case. Access is granted on a case-by-case basis to ensure proper usage and support.
