EMA and VWAP by Phil VoEMA and VWAP by Phil Vo
Description
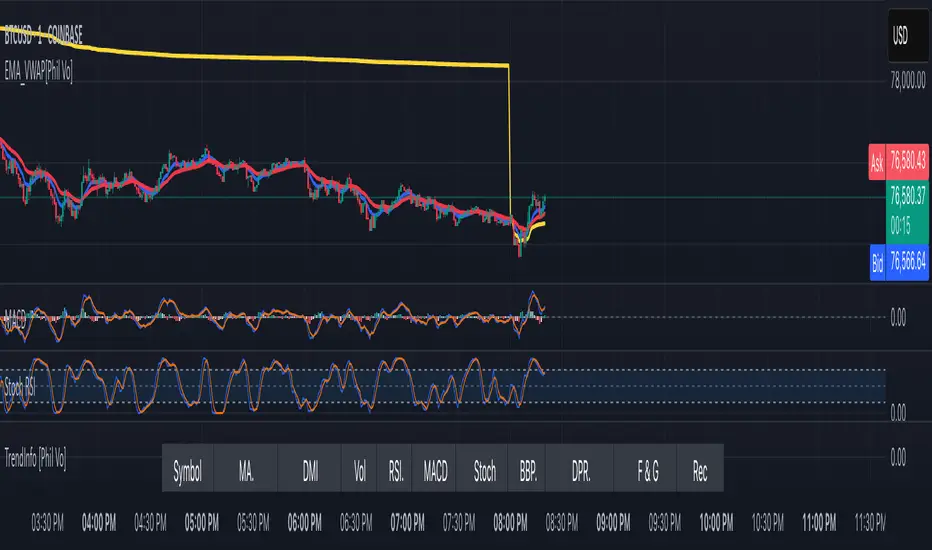
This indicator combines two powerful technical analysis tools: Exponential Moving Averages (EMAs) and Volume Weighted Average Price (VWAP). Designed to assist traders in identifying trends and key price levels, this script overlays two customizable EMAs and a daily VWAP on your chart.
* EMA 1 (Blue): A fast-moving EMA with a default period of 9, ideal for short-term trend analysis.
* EMA 2 (Red): A slower EMA with a default period of 21, useful for confirming longer-term trends.
* VWAP (Yellow): The Volume Weighted Average Price, calculated using the typical price (HLC3) and volume, resetting daily. It serves as a dynamic support/resistance level and reflects the average price weighted by volume.
Features
* Customizable EMAs: Adjust the periods of both EMAs via the settings (minimum period: 1).
* Visual Clarity: Each line is plotted in a distinct color (Blue for EMA 1, Red for EMA 2, Yellow for VWAP) with a linewidth of 2 for easy identification.
* Daily VWAP: The VWAP resets at the start of each trading day, providing a reliable intraday reference point.
* Tooltips: Hover over the input settings to see descriptions of each EMA period.
How to Use
1. Add the indicator to your chart.
2. Customize the EMA periods in the settings if desired (defaults are 9 and 21).
3. Use the EMAs to spot trends:
* When EMA 1 crosses above EMA 2, it may signal a bullish trend.
* When EMA 1 crosses below EMA 2, it may indicate a bearish trend.
4. Use the VWAP as a dynamic support/resistance level:
* Prices above VWAP might suggest bullish momentum.
* Prices below VWAP might indicate bearish pressure.
Settings
* EMA 1 Length: Set the period for the fast EMA (default: 9).
* EMA 2 Length: Set the period for the slow EMA (default: 21).
Notes
* The VWAP resets daily by default, making it most suitable for intraday trading.
* This script is open-source under the Mozilla Public License 2.0, so feel free to study or modify it!
Author
Created by Phil Vo. Happy trading!
How to Add This to TradingView
When you publish the script:
1. Paste the description above into the "Description" field in the "Publish Script" dialog.
2. Set the title as "EMA and VWAP by Phil Vo".
3. Choose "Public" visibility and "Open" access to share it with the community.
4. Add tags like "EMA", "VWAP", "Moving Average", "Trend", and "Volume" to help users find it.
This description provides a clear explanation of the indicator’s purpose, usage instructions, and customization options, making it accessible and helpful for TradingView users. Let me know if you’d like to adjust anything!
Cari dalam skrip untuk "VWAP"
MACD Crossover Breakout Rays with VWAP & Breakout ConfirmationOverview
This script is designed to highlight potential strong breakout moves by combining MACD crossovers, VWAP confirmation, and price action breakouts. It helps traders identify momentum shifts and filter high-probability trade setups.
How It Works
1. MACD Crossover Detection
- The script detects bullish crossovers (MACD line crossing above the signal line) and bearish crossovers (MACD line crossing below the signal line).
- A horizontal ray is drawn at the high (bullish) or low (bearish) of the crossover candle.
2. Multi-Timeframe MACD Confirmation
- A secondary MACD crossover is checked on a lower timeframe (default: 5 minutes) to confirm the strength of the move.
- The script ensures alignment between the primary and lower timeframe MACD crossovers before signaling a strong move.
3. VWAP Confirmation
- A bullish breakout is valid only if the price is above the VWAP.
- A bearish breakout is valid only if the price is below the VWAP.
4. Breakout Validation
- The script waits for price action confirmation—a breakout is only valid when a candle closes above (bullish) or below (bearish) the horizontal ray.
- Once confirmed, the ray color changes to blue to signal a strong move.
5. Label Alerts for Strong Moves
- When all conditions align, the script prints "STRONG 💪 MOVE" above or below the breakout candle.
- The previous label is automatically removed to keep the chart clean.
Customization Options
- MACD Settings: Adjust fast/slow lengths and signal smoothing.
- Lower Timeframe Confirmation: Choose a different timeframe for multi-timeframe MACD validation.
- VWAP Filtering: Ensure breakouts align with volume-weighted trends.
- Ray Length & Colors: Customize the horizontal ray length, width, and colors.
- Breakout Confirmation Window: Adjust how many bars to check for MACD alignment.
Best Use Cases
✅ Identifying high-probability breakouts with trend confirmation.
✅ Filtering out false signals by requiring multi-timeframe agreement.
✅ Helping traders stay in momentum-driven moves with strong confirmation.
⚠ Note: This script is for educational purposes only and does not constitute financial advice. Always conduct your own analysis before making trading decisions.

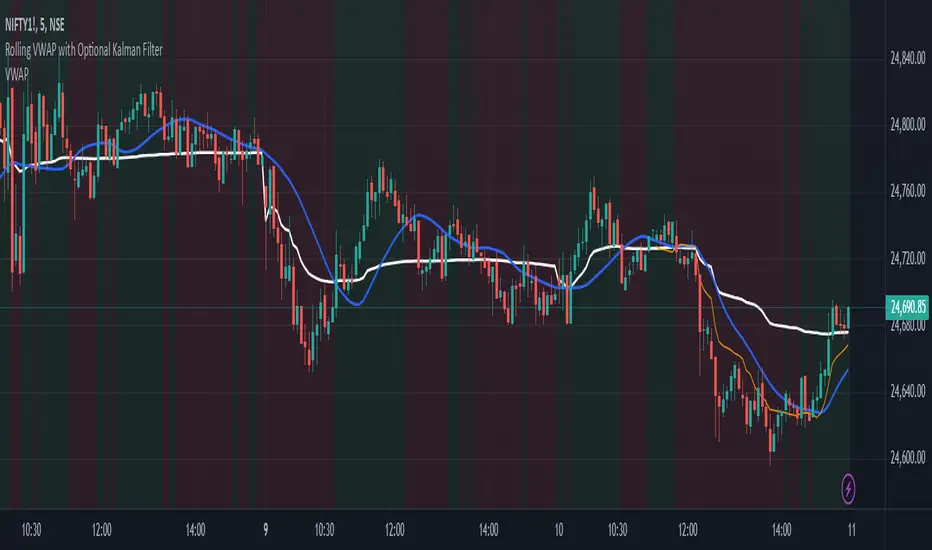
Rolling VWAP with Optional Kalman FilterThis script provides an advanced and customizable Rolling VWAP (Volume-Weighted Average Price) indicator, designed for traders who want to refine their trend analysis and improve decision-making. With a unique option to apply a Kalman Filter, you can smooth out VWAP values to reduce noise in volatile markets, making it easier to identify actionable trends.
Key Features:
Dynamic Rolling VWAP:
Choose the rolling window size (number of bars) to match your trading style, whether you’re an intraday scalper or a swing trader.
Kalman Filter Toggle:
Enable the Kalman filter to smooth VWAP values and eliminate market noise.
Adjustable Kalman Gain to control the level of smoothing, making it suitable for both fast and slow markets.
Price Source Flexibility:
Use the Typical Price ((H+L+C)/3) or the Close Price as the basis for VWAP calculation.
Visual Enhancements:
Background shading highlights whether the price is above (bullish) or below (bearish) the VWAP, helping traders make quick visual assessments.
A legend dynamically updates the current VWAP value.
Dual View Option:
Compare the raw Rolling VWAP and the Kalman-filtered VWAP when the filter is enabled, giving you deeper insight into market trends.
Use Cases:
Intraday Traders: Identify key price levels for re-entry or exits using a short rolling window and responsive filtering.
Swing Traders: Analyze broader trends with a longer rolling window and smoother VWAP output.
Volatile Markets: Use the Kalman filter to reduce noise and avoid false signals during high market volatility.
How to Use:
Adjust the Rolling Window to set the number of bars for VWAP calculation.
Toggle Kalman Filter on/off depending on your preference for raw or smoothed VWAP values.
Fine-tune the Kalman Gain for the desired level of smoothing.
Use the shading to quickly assess whether the price is trading above or below the VWAP for potential entry/exit signals.
Eze Profit - VWAP + MACD Combined SignalThe Eze Profit - VWAP + MACD Combined Signal is an advanced trading tool designed to help traders align price trends with momentum confirmation for better decision-making. By combining Volume-Weighted Average Price (VWAP) and Moving Average Convergence Divergence (MACD), this indicator provides clear entry and exit signals, allowing traders to follow trends and take advantage of momentum shifts.
How It Works:
VWAP:
VWAP represents the average price of an asset, weighted by volume, over a specific period.
It acts as a dynamic support/resistance level and trend filter. Price above VWAP indicates bullish conditions, while price below VWAP suggests bearish conditions.
MACD:
MACD measures momentum through the difference between fast and slow exponential moving averages (EMAs).
Signals are generated when the MACD line crosses its signal line:
Bullish Crossover: Indicates increasing upward momentum.
Bearish Crossunder: Indicates increasing downward momentum.
Combined Logic:
Long Signal: Triggered when price is above VWAP, and MACD exhibits a bullish crossover.
Short Signal: Triggered when price is below VWAP, and MACD exhibits a bearish crossunder.
The script tracks the trader's "in-position" state to prevent redundant signals and ensure clarity.
How to Use:
Use this script to identify potential long and short trading opportunities:
Buy Signal: Enter a long position when the price moves above VWAP and MACD confirms bullish momentum.
Sell Signal: Exit or short when the price drops below VWAP and MACD confirms bearish momentum.
Combine with additional tools like support/resistance, volume analysis, or candlestick patterns for confirmation.
Features:
VWAP Trend Filter: Dynamically adjusts to the trading session to identify overall trend direction.
MACD Momentum Confirmation: Detects key momentum shifts with configurable settings for fast, slow, and signal lengths.
Position State Tracking: Avoids signal redundancy by monitoring open positions.
Buy/Sell Visualizations: Plots Buy/Sell signals directly on the chart for ease of use.
Alerts: Notifies traders in real-time when a long or short signal is triggered.
Customizable Settings:
MACD Fast Length, Slow Length, and Signal Smoothing parameters.
VWAP timeframe resolution to adapt to different trading styles (e.g., intraday or daily).
Credits:
This script is based on standard VWAP and MACD calculations provided by TradingView’s library and has been enhanced with unique logic for combined signal generation.
Notes:
This indicator is intended for educational purposes and should not be considered financial advice. Use it as part of a broader trading strategy alongside other tools for optimal results.

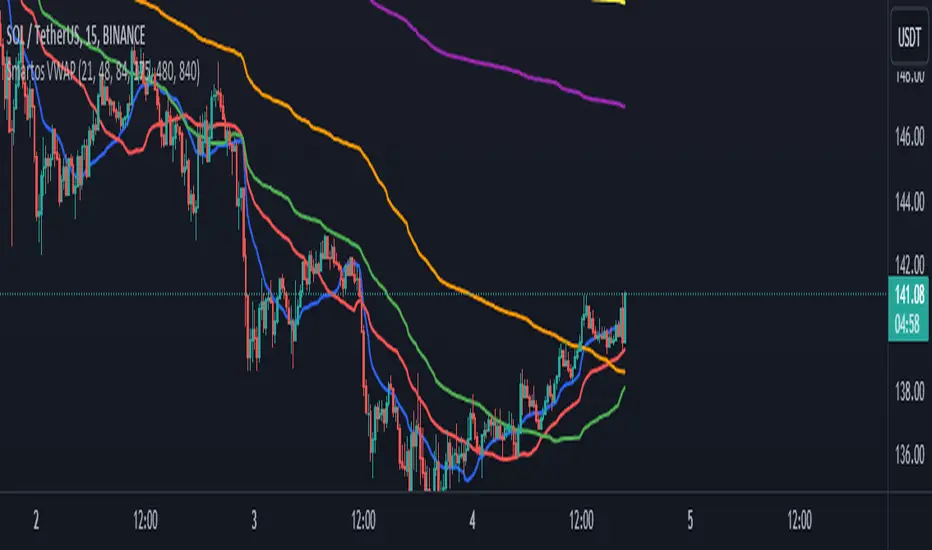
Smartos VWAPSmartos VWAP Indicator Description
Smartos VWAP is a versatile and customizable technical analysis tool designed for traders and analysts to gauge the average price of a security based on its trading volume. The indicator calculates the Volume Weighted Average Price (VWAP) over six different customizable periods, allowing users to adapt the analysis to their trading strategies.
Key Features:
Volume Weighted Average Price (VWAP): The Smartos VWAP provides a dynamic measure of the average price at which a security has traded throughout the day, weighted by volume. This makes it a useful reference point for assessing price levels.
Customizable Periods: The indicator allows users to set six different candle lengths for VWAP calculations, with default values of 21, 48, 84, 175, 480, and 840 candles. Users can easily modify these values to suit their trading preferences.
Multiple VWAP Lines: The indicator plots six distinct VWAP lines on the chart, each representing a different period. This enables traders to observe price action relative to multiple VWAPs, helping identify trends and potential support and resistance levels.
Visual Clarity: Each VWAP line is color-coded for easy differentiation, making it simple for traders to analyze price movements and the relationship between the current price and the average price over the selected periods.
Usage:
Traders can use the Smartos VWAP indicator to make informed decisions regarding entry and exit points, as well as to assess overall market sentiment. By observing the position of the price relative to the VWAP lines, traders can gain insights into potential bullish or bearish trends.
Zigzag Tails [Trendoscope®] 🎲 Introducing Zigzag Tails Indicator by Trendoscope.
The Zigzag Tails Indicator, a groundbreaking tool from Trendoscope, redefines technical analysis by seamlessly integrating anchored VWAPs (Volume Weighted Average Prices) and Average Price calculations with Zigzag pivot points. This advanced indicator recalculates Average Price or VWAP from one Zigzag pivot to the next, offering unparalleled insights into market movements.
🎯 Innovative Design
Each Zigzag pivot can feature up to three distinct tails, corresponding to the high, low, and close prices of each candle. Users have the flexibility to select between Average Price and VWAP for display on their charts. By default, the indicator plots all three tails, but individual tail visibility is customizable via the settings panel.
Average Price Mode: When selected, tails depict the average price across a specified number of bars.
VWAP Mode: In this mode, tails represent the VWAP, calculated for a given price over a set number of bars.
🎯 Dynamic Dotted Tail
The Zigzag Tails Indicator features dotted tails that extend from the last Zigzag pivot to the current bar. These dotted tails dynamically adapt to market changes and are subject to repainting with the emergence of new Zigzag pivots.
When repainting is enabled, the dotted tails originate from the last unconfirmed Zigzag pivot, extending to the current bar. This setting offers a more immediate, albeit tentative, visual representation of market trends.
With repainting disabled, the dotted tails will be anchored from the last confirmed Zigzag pivot to the current bar, providing a more stable but slightly delayed market analysis.
Irrespective of the repaint option, the dotted dynamic tails is always expected to repaint.
🎯 Practical Applications
The Zigzag Tails Indicator provides more accurate support and resistance levels than traditional VWAP, rolling VWAP, or moving averages. Its precision makes it an invaluable tool for identifying trends, as well as potential trend continuations or reversals.
🛠 Indicator Settings
Zigzag Configuration:
Zigzag Length determines the loopback length for the foundational Zigzag calculation.
Number of Bars represent the calculation distance. This limitation is added to avoid runtime errors on lower timeframes. The calculations run through lots of loops. Hence, if it is run across too many bars, we may get timeout issues.
Repaint: Activating this will also display the last, unconfirmed Zigzag pivot. Since the last pivot is inherently tentative, it may repaint with the arrival of new bars. A pivot is confirmed only when a subsequent unconfirmed pivot emerges on the chart.
Tail Configuration
Tail Type: Choose between average and VWAP for the tail calculation. The average option plots a simple average, while the VWAP option calculates an anchored VWAP from pivot to pivot.
Display Options: Tailored display options for High, Low, Close prices, with customizable colors for each tail type.
Inspired by the ideas of @KioseffTrading's implementation of Zigzag Anchored VWAP

Session Dynamics & Pivot Overlay (Arjo)## **OVERVIEW**
The **Session Dynamics & Pivot Overlay (Arjo)** is a visual analysis tool that displays session-based price ranges, anchored volume-weighted averages, daily pivot levels, and smoothed trend conditions on the chart. It highlights how price interacts with custom sessions, midpoint levels, and dynamic ranges, providing a structured visual layout that helps users observe market behavior over time without implying any form of prediction or trading signal.
## **CONCEPTS**
This indicator incorporates several widely used analytical concepts:
- **Session Ranges:** Identifies user-defined time windows and visually displays their high, low, and midpoint behavior throughout the session.
- **VWAP (Morning Session):** Shows volume-weighted average price calculations for a defined morning period, assisting with visual comparison between price and weighted averages.
- **Daily Pivot Levels:** Displays R1–R2, S1–S2, central pivot, and associated levels derived from prior daily price data.
- **Trend Smoothing:** Uses SuperSmoother filtering and an additional EMA to highlight whether the smoothed trend is rising or falling.
- **EMA + ATR Bands:** Plots a 20-period EMA with upper and lower ATR-derived bands to help visualize short-term price displacement relative to average true range.
All of these elements are presented solely for structural and comparative chart analysis.
## **FEATURES**
- **Custom Session Visualization:** Automatically draws session boxes, capturing the evolving high, low, and midpoint throughout the defined intraday window.
- **Dynamic Midline Calculation:** A midpoint line is updated continuously during the session to visually anchor price within the session’s range.
- **Morning Session VWAP:** Displays a dedicated VWAP line for the morning window with adjustable source and configuration options.
- **Daily Pivot Lines:** Automatically plots pivot, BC/TC, R1–R2, and S1–S2 levels with customizable colors, widths, and line styles.
- **Trend-Responsive Pivot Display:** Optionally toggles visibility of R2 or S2 depending on the direction of the smoothed trend.
- **EMA + ATR Zones:** Renders a 20-EMA and ATR-based support/resistance zone using filled regions for enhanced visual clarity.
- **Full Customization:** Multiple color, transparency, line-style, and display options allow users to adapt the presentation to their charting preferences.
- **Overlay Compatible:** Designed to work directly on price charts without obstructing candles or other overlays.
## **HOW TO USE**
Users can interact with the indicator entirely through the settings panel:
- Adjust session timings to match preferred market hours or custom internal zones.
- Enable or disable the display of pivot levels, VWAP, or the ATR/EMA zone.
- Customize colors and line styles to improve visibility according to the chart background or personal preference.
- Observe how price behaves relative to the session box, midpoint, VWAP, and pivot levels for contextual understanding.
- Utilize the smoothed trend condition to see when the indicator chooses to display certain pivot extensions.
These elements help users interpret chart structure, volatility, and intraday behavior in a visually organized manner.
## **CONCLUSION**
The ** Session Dynamics & Pivot Overlay (Arjo) ** indicator offers a consolidated view of session structure, pivot levels, VWAP, and smoothed trend conditions. Its purpose is to improve visual clarity and assist users in understanding market context without issuing directives or trade suggestions. It functions as an educational tool that enhances chart interpretation and supports structured analysis.
---
## **DISCLAIMER**
This indicator is for educational and visual analysis purposes only. It does not provide trading signals, financial advice, or guaranteed outcomes. Users should conduct their own research and consult a licensed financial professional when necessary. All trading decisions are solely the responsibility of the user.
Happy Trading (Arjo)

Current & Previous-Day VWAPThe “Current & Previous‑Day VWAP” indicator plots two important volume‑weighted price references on intraday charts:
Current Session VWAP (solid line): The VWAP is the volume‑weighted average price of the current trading session. TradingView’s built‑in ta.vwap() function automatically resets its calculation at the start of each new intraday session
offline-pixel.github.io
, so the line accurately follows today’s price action. You can set the color of this line via the indicator’s input (defaults to blue).
Previous‑Day VWAP (dotted lines): At the final bar of each session, the indicator stores the current session’s VWAP value. On the first bar of the following session, it draws a horizontal dotted line at that stored value and extends it across the entire day. This uses TradingView’s session detection functions—session.islastbar to capture the closing VWAP and session.isfirstbar to start the new line
tradingview.com
. An array holds each line and its y‑value so that multiple previous‑day VWAPs remain visible for comparison. The color of these dotted lines is also user‑configurable.
This design lets you see both where the current price is relative to today’s VWAP and how it stands against the closing VWAP levels of previous sessions, all at a glance.

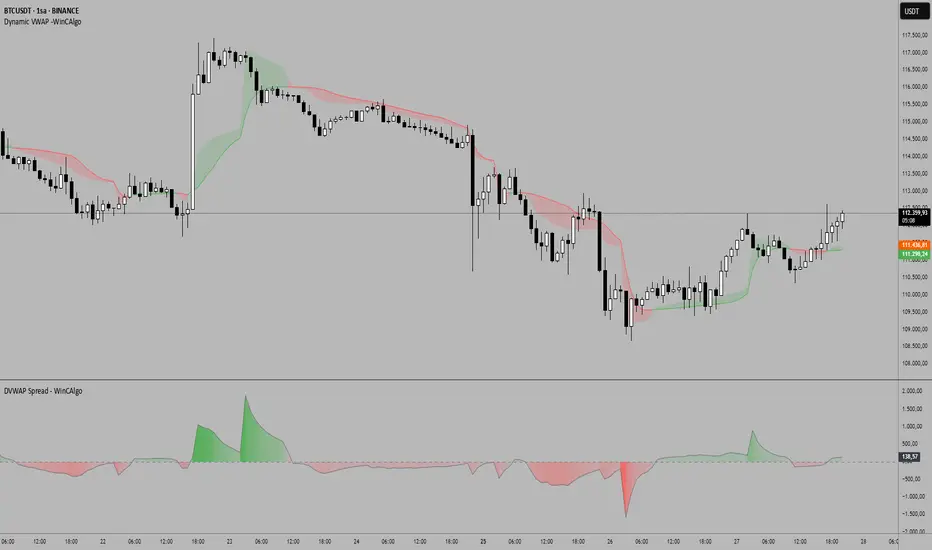
DVWAP Spread -WinCAlgoDynamic VWAP Spread Oscillator
This indicator transforms the relationship between two adaptive VWAP curves into an oscillator format, making trend analysis more precise and intuitive.
What it shows:
Spread Value: The difference between Fast VWAP and Smoothed VWAP
Dynamic Coloring: Intensity increases as the spread moves away from zero
Zero Line: The neutral point where both VWAP curves converge
How to interpret:
Above Zero (Green): Fast VWAP > Smoothed VWAP → Bullish bias
Below Zero (Red): Fast VWAP < Smoothed VWAP → Bearish bias
Distance from Zero: Shows the strength of the current trend
Zero Crossovers: Potential trend change signals
📌 Usage Ideas:
Trend Filter: Take long trades only when oscillator is positive, shorts when negative
Momentum Gauge: Larger spread values indicate stronger trend momentum
Divergence Analysis: Look for divergences between price and oscillator for reversal signals
Overbought/Oversold: Extreme values may indicate potential mean reversion opportunities
Zero Line Bounces: Use zero line as dynamic support/resistance for entries
Parameters:
Period: Controls the lookback period for adaptive calculations
Adjustment Step: Fine-tunes the adaptive smoothing sensitivity
Fast Response: Adjusts how quickly the fast VWAP responds to price changes
Source: Price input for VWAP calculation (default: HLC3)
Scalper's Fractal Cloud with RSI + VWAP + MACD (Fixed)Scalper’s Fractal Confluence Dashboard
1. Purpose of the Indicator
This TradingView indicator script provides a high-confluence setup for scalping and day trading. It blends momentum indicators (RSI, MACD), trend bias tools (EMA Cloud, VWAP), and structure (fractal swings, gap zones) to help confirm precise entries and exits.
2. Components of the Indicator
- EMA Cloud (50 & 200 EMA): Trend bias – green means bullish, red means bearish. Avoid longs under red cloud.
- VWAP: Institutional volume anchor. Ideal entries are pullbacks to VWAP in direction of trend.
- Gap Zones: Shows open-air zones (white space) where price can move fast. Used to anticipate momentum moves.
- ZigZag Swings: Marks structural pivots (highs/lows) – useful for stop placement and range anticipation.
- MACD Histogram: Shows bullish or bearish momentum via background color.
- RSI: Overbought (>70) or oversold (<30) warnings. Good for exits or countertrend reversion plays.
- EMA Spread Label: Quick view of momentum strength. Wide spread = strong trend.
3. Scalping Entry Checklist
Before entering a trade, confirm these conditions:
• • Bias: EMA cloud color supports trade direction
• • Price is above/below VWAP (confirming institutional flow)
• • MACD histogram matches direction (green for long, red for short)
• • RSI not at extreme (unless you’re fading trend)
• • If entering gap zone, expect fast move
• • Recent swing high/low nearby for target or stop
4. Risk & Sizing Guidelines
Risk 1–2% of account per trade. Place stop below recent swing low (for longs) or high (for shorts). Use fractional sizing near VWAP or white space zones for scalping reversals.
5. Daily Trade Journal Template
- Date:
- Ticker:
- Setup Type (VWAP pullback, Gap Break, EMA reversion):
- Entry Time:
- Bias (Green/Red Cloud):
- RSI Level / MACD Reading:
- Stop Loss:
- Target:
- Result (P/L):
- What I Did Well:
- What Needs Work:

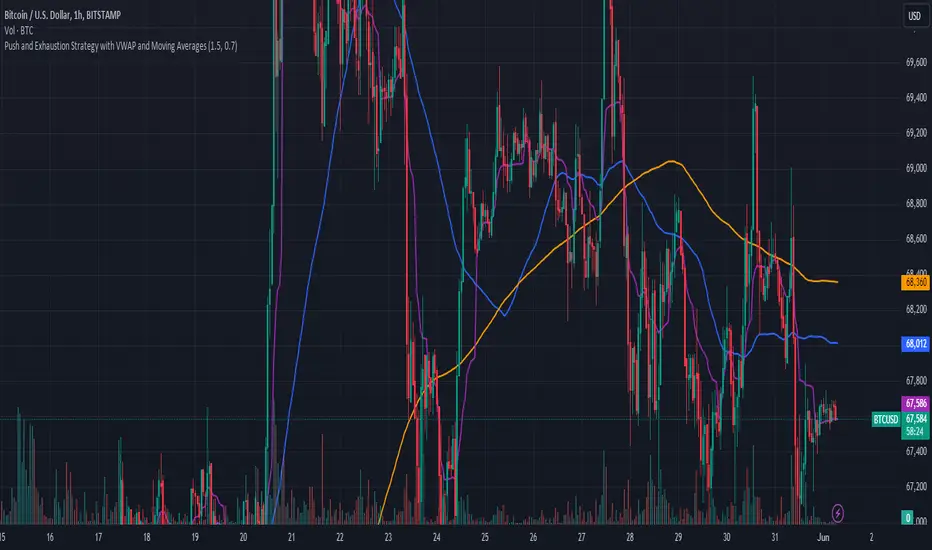
Push and Exhaustion Strategy with VWAP and Moving AveragesOverview:
The Push and Exhaustion Strategy Indicator is a custom technical analysis tool designed to help traders identify potential market turning points by highlighting significant price movements (pushes) and subsequent periods of reduced momentum (exhaustion). This indicator also incorporates key moving averages (50-period and 200-period) and the Volume Weighted Average Price (VWAP) to provide additional context for trading decisions.
Components:
Push and Exhaustion Thresholds:
Push Threshold: Set at 1.5 by default. This means the price must increase by 50% or more compared to the previous close to signal a push.
Exhaustion Threshold: Set at 0.7 by default. This means the price must decrease by 30% or more compared to the previous close to signal exhaustion.
VWAP (Volume Weighted Average Price):
VWAP is plotted on the chart to provide an average price weighted by volume, giving insight into the true average price paid for an asset.
Moving Averages:
50-period Moving Average (MA): Plotted in blue, it helps identify the short-to-mid-term trend direction.
200-period Moving Average (MA): Plotted in orange, it helps identify the long-term trend direction.
How It Works:
Push Condition:
A push signal is generated when the current closing price is at least 1.5 times the previous closing price (pushThreshold).
Additionally, the closing price must be above the VWAP, indicating strong upward momentum.
When these conditions are met, a green triangle is plotted above the price bar.
Exhaustion Condition:
An exhaustion signal is generated when the current closing price is at most 0.7 times the previous closing price (exhaustionThreshold).
Additionally, the closing price must be below the VWAP, indicating weakened momentum and potential reversal.
When these conditions are met, a red triangle is plotted below the price bar.
Visualization:
The indicator plots green triangles above bars to indicate a push signal and red triangles below bars to indicate an exhaustion signal.
It also plots the 50-period and 200-period moving averages as blue and orange lines, respectively.
The VWAP is plotted as a purple line, showing the average price considering the trading volume.
Alerts:
The indicator includes optional alerts that notify the trader when a push or exhaustion signal is detected.
Usage:
Push Signals: Traders might use push signals to enter trades in the direction of strong momentum, typically buying in an uptrend.
Exhaustion Signals: Traders might use exhaustion signals to anticipate potential reversals, considering exiting positions or entering counter-trend trades.
Moving Averages: The 50-period and 200-period moving averages help provide context to the overall trend, aiding in decision-making.
VWAP: Being above or below the VWAP helps validate the strength of the price movement.
This indicator provides a comprehensive view of market momentum, aiding traders in making informed decisions by highlighting significant price moves and potential reversals within the context of prevailing trends.
REV01 - Combined WT and SQZMOM Indicator and VWAP [KMARHOUMI]The Combined WaveTrend and Squeeze Momentum Indicator with VWAP (CWT_SQZMOM) is a powerful trading tool designed for traders looking to capitalize on market momentum and volatility squeezes, with the added insight of volume-weighted average price (VWAP) levels.
This custom indicator integrates three key components:
WaveTrend Oscillator: A momentum indicator that highlights potential reversal points in the market by identifying overbought and oversold conditions.
Squeeze
Momentum Indicator (SQZMOM): Identifies market consolidation periods (squeeze) and potential momentum breakouts, offering visual cues for significant price movements.
Volume-Weighted Average Price (VWAP): Provides a baseline measure of the average price based on volume, crucial for understanding market direction within a trading day.
Features
Visual Cues: Utilizes color-coded histograms, circles, and triangles to provide clear visual signals for trading opportunities.
Customizable Parameters: Allows traders to adjust input values for the WaveTrend Oscillator and Squeeze Momentum Indicator to fit various trading styles and timeframes.
Dynamic Indicators: Combines price momentum with volume data, offering a comprehensive view of market conditions.
How to Use
Setup: Apply the indicator to any chart in a trading platform that supports Pine Script (e.g., TradingView). Adjust the input parameters as needed to match your trading strategy and the asset's volatility.
Reading the Indicator:
WaveTrend Crossovers: Look for blue circles indicating a bullish crossover of the WaveTrend lines (wt1 crosses above wt2) and fuchsia circles for a bearish crossover (wt1 crosses below wt2). These points signal potential reversal opportunities.
Squeeze Momentum (SQZMOM): Green triangles at the bottom indicate a "Squeeze On" condition, suggesting market consolidation and potential for a breakout. Red triangles at the top signal a "Squeeze Off" condition, indicating the end of the squeeze and the start of a momentum phase.
VWAP: The price position relative to the VWAP line helps identify the overall market trend. Prices above VWAP may indicate bullish conditions, while prices below VWAP suggest bearish conditions.
Example Scenario for Going Long
Imagine the asset's price has been consolidating, and you observe a green triangle ("Squeeze On") at the bottom of the chart, indicating a potential breakout. Shortly after, a blue circle appears, signaling a bullish crossover in the WaveTrend Oscillator. If this crossover occurs above the VWAP line, it strengthens the signal for a long position. Traders might enter a long trade at this point, setting a stop loss below the recent low and a take profit at a previous resistance level or using a risk-reward ratio that suits their strategy.

Moving Averages + BB & R.VWAP StDev (multi-tf)█ Moving Averages + Bollinger Bands and Rolling Volume Weighted Average Price with Standard Deviation Bands (Multi Timeframe)
Multiple moving averages can be independently applied.
The length , type and timeframe of each moving average are configurable .
The lines and colors are customizable too.
This script can display:
Moving Averages
Bollinger Bands
Rolling VWAP and Standard Deviation Bands
Types of Moving Averages:
Simple Moving Average (SMA)
Exponential Moving Average (EMA)
Smoothed Moving Average (SMMA)
Weighted Moving Average (WMA)
Volume Weighted Moving Average (VWMA)
Least Squares Moving Average (LSMA)
Hull Moving Average (HMA)
Arnaud Legoux Moving Average (ALMA)
█ Moving Average
Moving Averages are price based, lagging (or reactive) indicators that display the average price of a security over a set period of time.
A Moving Average is a good way to gauge momentum as well as to confirm trends, and define areas of support and resistance.
█ Bollinger Bands
Bollinger Bands consist of a band of three lines which are plotted in relation to security prices.
The line in the middle is usually a Simple Moving Average (SMA) set to a period of 20 days (the type of trend line and period can be changed by the trader, a 20 day moving average is by far the most popular).
The SMA then serves as a base for the Upper and Lower Bands which are used as a way to measure volatility by observing the relationship between the Bands and price.
█ Rolling VWAP
The typical VWAP is designed to be used on intraday charts, as it resets at the beginning of the day.
Such VWAPs cannot be used on daily, weekly or monthly charts. Instead, this rolling VWAP uses a time period that automatically adjusts to the chart's timeframe.
You can thus use the rolling VWAP on any chart that includes volume information in its data feed.
Because the rolling VWAP uses a moving window, it does not exhibit the jumpiness of VWAP plots that reset.
Based on the previous script :

MTF MA Ribbon and Bands + BB, Gaussian F. and R. VWAP with StDev█ Multi Timeframe Moving Average Ribbon and Bands + Bollinger Bands, Gaussian Filter and Rolling Volume Weighted Average Price with Standard Deviation Bands
Up to 9 moving averages can be independently applied.
The length , type and timeframe of each moving average are configurable .
The lines, colors and background fill are customizable too.
This script can also display:
Moving Average Bands
Bollinger Bands
Gaussian Filter
Rolling VWAP and Standard Deviation Bands
Types of Moving Averages:
Simple Moving Average (SMA)
Exponential Moving Average (EMA)
Smoothed Moving Average (SMMA)
Weighted Moving Average (WMA)
Volume Weighted Moving Average (VWMA)
Least Squares Moving Average (LSMA)
Hull Moving Average (HMA)
Arnaud Legoux Moving Average (ALMA)
█ Moving Average
Moving Averages are price based, lagging (or reactive) indicators that display the average price of a security over a set period of time.
A Moving Average is a good way to gauge momentum as well as to confirm trends, and define areas of support and resistance.
█ Bollinger Bands
Bollinger Bands consist of a band of three lines which are plotted in relation to security prices.
The line in the middle is usually a Simple Moving Average (SMA) set to a period of 20 days (the type of trend line and period can be changed by the trader, a 20 day moving average is by far the most popular).
The SMA then serves as a base for the Upper and Lower Bands which are used as a way to measure volatility by observing the relationship between the Bands and price.
█ Gaussian Filter
Gaussian filter can be used for smoothing.
It rejects high frequencies (fast movements) better than an EMA and has lower lag.
A Gaussian filter is one whose transfer response is described by the familiar Gaussian bell-shaped curve.
In the case of low-pass filters, only the upper half of the curve describes the filter.
The use of gaussian filters is a move toward achieving the dual goal of reducing lag and reducing the lag of high-frequency components relative to the lag of lower-frequency components.
█ Rolling VWAP
The typical VWAP is designed to be used on intraday charts, as it resets at the beginning of the day.
Such VWAPs cannot be used on daily, weekly or monthly charts. Instead, this rolling VWAP uses a time period that automatically adjusts to the chart's timeframe.
You can thus use the rolling VWAP on any chart that includes volume information in its data feed.
Because the rolling VWAP uses a moving window, it does not exhibit the jumpiness of VWAP plots that reset.
Made with the help from scripts of: adam24x, VishvaP, loxx and pmk07.

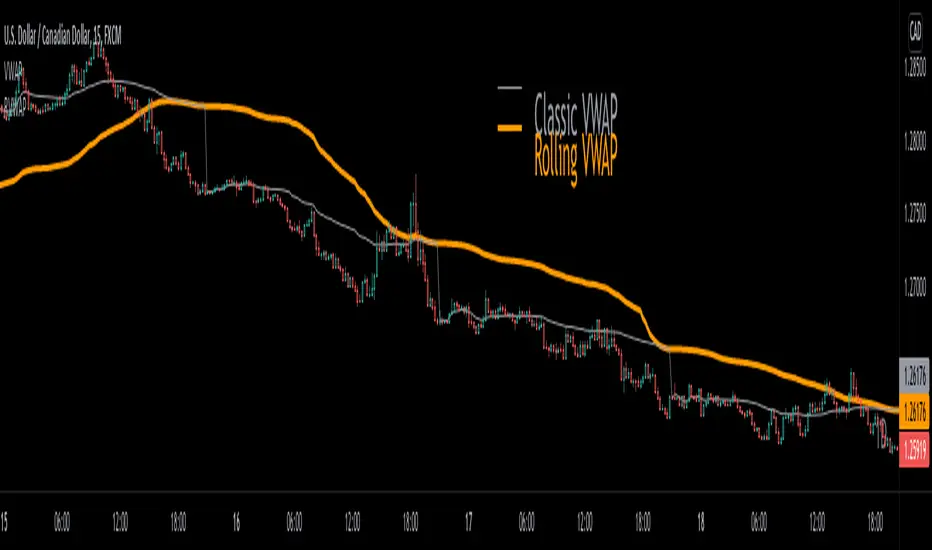
Rolling VWAP█ OVERVIEW
This indicator displays a Rolling Volume-Weighted Average Price. Contrary to VWAP indicators which reset at the beginning of a new time segment, RVWAP calculates using a moving window defined by a time period (not a simple number of bars), so it never resets.
█ CONCEPTS
If you are not already familiar with VWAP, our Help Center will get you started.
The typical VWAP is designed to be used on intraday charts, as it resets at the beginning of the day. Such VWAPs cannot be used on daily, weekly or monthly charts. Instead, this rolling VWAP uses a time period that automatically adjusts to the chart's timeframe. You can thus use RVWAP on any chart that includes volume information in its data feed.
Because RVWAP uses a moving window, it does not exhibit the jumpiness of VWAP plots that reset. You can see the more jagged VWAP on the chart above. We think both can be useful to traders; up to you to decide which flavor works for you.
█ HOW TO USE IT
Load the indicator on an active chart (see the Help Center if you don't know how).
Time period
By default, the script uses an auto-stepping mechanism to adjust the time period of its moving window to the chart's timeframe. The following table shows chart timeframes and the corresponding time period used by the script. When the chart's timeframe is less than or equal to the timeframe in the first column, the second column's time period is used to calculate RVWAP:
Chart Time
timeframe period
1min 🠆 1H
5min 🠆 4H
1H 🠆 1D
4H 🠆 3D
12H 🠆 1W
1D 🠆 1M
1W 🠆 3M
You can use the script's inputs to specify a fixed time period, which you can express in any combination of days, hours and minutes.
By default, the time period currently used is displayed in the lower-right corner of the chart. The script's inputs allow you to hide the display or change its size and location.
Minimum Window Size
This input field determines the minimum number of values to keep in the moving window, even if these values are outside the prescribed time period. This mitigates situations where a large time gap between two bars would cause the time window to be empty, which can occur in non-24x7 markets where large time gaps may separate contiguous chart bars, namely across holidays or trading sessions. For example, if you were using a 1D time period and there is a two-day gap between two bars, then no chart bars would fit in the moving window after the gap. The default value is 10 bars.
█ NOTES
If you are interested in VWAP indicators, you may find the VWAP Auto Anchored built-in indicator worth a try.
For Pine Script™ coders
The heart of this script's calculations uses the `totalForTimeWhen()` function from the ConditionalAverages library published by PineCoders . It works by maintaining an array of values included in a time period, but without a for loop requiring a lookback from the current bar, so it is much more efficient.
We write our Pine Script™ code using the recommendations in the User Manual's Style Guide .
Look first. Then leap.
Opening Range Breakout with VWAP & RSI ConfirmationThis indicator identifies breakout trading opportunities based on the Opening Range Breakout (ORB) strategy combined with intraday VWAP and higher timeframe RSI confirmation.
Opening Range: Calculates the high, low, and midpoint of the first 15 or 30 minutes (configurable) after your specified market open time.
Intraday VWAP: A volume-weighted average price calculated manually and reset daily, tracking price action throughout the trading day.
RSI Confirmation: Uses RSI from a user-selected higher timeframe (1H, 4H, or Daily) to confirm signals.
Buy Signal: Triggered when VWAP breaks above the Opening Range High AND the RSI is below or equal to the buy threshold (default 30).
Sell Signal: Triggered when VWAP breaks below the Opening Range Low AND the RSI is above or equal to the sell threshold (default 70).
Visuals: Plots Opening Range levels and VWAP on the chart with clear buy/sell markers and optional labels showing RSI values.
Alerts: Provides alert conditions for buy and sell signals to facilitate timely trading decisions.
This tool helps traders capture momentum breakouts while filtering trades based on momentum strength indicated by RSI.

Mean Reversion Framework [LTS]LHAMA Trading Suite's Mean Reversion Framework is a VWAP-centric mean reversion and exhaustion tool that combines volatility regimes, volume-weighted extension zones, and multi-oscillator divergence detection into a single framework. It is designed to help traders quickly answer three questions on any chart:
How far is price stretched away from VWAP in standard deviations?
Is the current environment favorable or hostile to mean reversion?
Are there momentum divergences supporting a reversal or trend continuation idea?
Core components
1. Adaptive VWAP with standard deviation bands
The framework builds around a dynamically anchored VWAP with statistical bands:
VWAP line plotted from a rolling anchor point.
Standard deviation bands : ±1σ, ±2σ, ±2.5σ, and ±3σ around VWAP.
Extension zones : the area between ±2.5σ and ±3σ is highlighted as an “extension zone,” where price is statistically stretched from its mean.
Anchoring is automatic and timeframe-aware. When you change your charts timeframe, this will automatically adjust what VWAP you are looking at to make sure you're always using the anchoring research has shown to be most appropriate and relevant for that timeframe.
2. Reversion candle coloring
To highlight potentially climactic moves:
The script tracks a configurable volume average and multiplier.
When price touches the ±2.5σ extension zone and a candle meets one of these conditions, candles can be recolored:
Has above average volume, but below average candle body size.
Has lower volume than the previous candle.
An optional alert can be triggered when these extension touches occur.
The ideal reversion setup is a quick extension into the marked zone, which includes a high volume, small body candle at its peak, surrounded by lower volume candles in opposite directions. This shows an energetic push in one direction, followed by exhaustion and a fade back toward the mean.
3. Volatility regime detection
The script classifies the current volatility regime using ATR:
Calculates ATR over a user-defined lookback.
Computes the percentile rank of current ATR relative to its recent history.
Labels the environment as:
HIGH volatility (ATR percentile at or above the high threshold).
LOW volatility (at or below the low threshold).
MODERATE otherwise.
The current regime and ATR percentile are displayed on the dashboard and can be used as context for whether mean-reversion setups may be more or less favorable. Alerts can fire when volatility crosses into high or low regimes so users can adjust expectations or strategies if desired.
4. RSI & Stochastic divergence framework
The indicator includes a combined divergence engine using RSI and Stochastic:
User-configurable RSI length.
User-configurable Stochastic K/D parameters.
Pivot-based detection with left/right lookbacks and a max lookback window.
Two main categories:
Regular divergences – potential reversal context.
Hidden divergences – potential trend continuation context.
For both RSI and Stochastic, the script looks for:
Bullish regular : price lower low vs. oscillator higher low.
Bearish regular : price higher high vs. oscillator lower high.
Hidden bullish : price higher low vs. oscillator lower low.
Hidden bearish : price lower high vs. oscillator higher high.
When conditions are met, the script will:
Plot labels on the price chart:
🔃 icons for regular (reversal) divergences.
⏩ icons for hidden (continuation) divergences.
Combine RSI and Stochastic confirmation into a single label when both agree, with tooltips explaining:
Price structure (HH/HL/LL/LH).
Which oscillator(s) confirmed the divergence.
Whether the pattern suggests potential reversal or continuation.
Optionally trigger alerts for each divergence type when alerts are enabled.
Divergence labels are based on confirmed pivots, so they appear with a delay relative to the pivot bar. They are not predictive and should be treated as contextual information rather than standalone trade signals.
5. Dashboard overlay
An on-chart dashboard summarizes the most important state variables in a compact table:
VWAP Anchor – shows the effective anchor logic currently in use (“Session/Week/Month”, “5-Day Rolling” or “Yearly (Jan 1)”).
Alert Status – ACTIVE, COOLDOWN, or DISABLED.
Volatility Regime – HIGH / MODERATE / LOW with the current ATR percentile.
VWAP Value – current VWAP price.
Price vs VWAP – distance of price from VWAP in standard deviations (σ).
ATR – current ATR value for the selected length.
The dashboard can be toggled on or off and moved to any corner of the chart (top/bottom, left/right).
6. Alert system & cooldown
The script defines multiple alert conditions so users can build their own rules around mean reversion and volatility changes:
Extension zone alerts :
Price enters upper extension (≥ +2.5σ).
Price enters lower extension (≤ −2.5σ).
Price enters any extension zone.
High-volume candle touching an extension zone.
Divergence alerts :
Regular bullish / bearish divergence.
Hidden bullish / bearish divergence.
Volatility regime alerts :
ATR percentile crosses into HIGH volatility.
ATR percentile crosses into LOW volatility.
To reduce alert noise around VWAP resets, there is an optional alert cooldown :
At the start of a new VWAP period (session/5-day/yearly, depending on timeframe), the script can enter a cooldown phase.
During cooldown, extension-related alerts are temporarily suppressed for a user-defined number of minutes.
Volatility regime alerts remain active, as they reflect broader structural changes rather than short-term VWAP resets.
Users can disable the cooldown by setting its duration to 0.

Range Lattice## RangeLattice
RangeLattice constructs a higher-timeframe scaffolding on any intraday chart, locking in structural highs/lows, mid/quarter grids, VWAP confluence, and live acceptance/break analytics. It provides a non-repainting overlay that turns range management into a disciplined process.
HOW IT WORKS
Structure Harvesting – Using request.security() , the script samples highs/lows from a user-selected timeframe (default 240 minutes) over a configurable lookback to establish the dominant range.
Grid Construction – Midpoint and quarter levels are derived mathematically, mirroring how institutional traders map distribution/accumulation zones.
Acceptance Detection – Consecutive closes inside the range flip an acceptance flag and darken the cloud, signaling balanced auction conditions.
Break Confirmation – Multi-bar closes outside the structure raise break labels and alerts, filtering the countless fake-outs that plague breakout traders.
VWAP Fan Overlay – Session VWAP plus ATR-based bands provide a live measure of flow centering relative to the lattice.
HOW TO USE IT
Range Plays : Fade taps of the outer rails only when acceptance is active and VWAP sits inside the grid—this is where mean-reversion works best.
Breakout Plays : Wait for confirmed break labels before entering expansion trades; the dashboard's Width/ATR metric tells you if the expansion has enough fuel.
Market Prep : Carry the same lattice from pre-market into regular trading hours by keeping the structure timeframe fixed; alerts keep you notified even when managing multiple tickers.
VISUAL FEATURES
Range Tap and Mid Pivot markers provide a tape-reading breadcrumb trail for journaling.
Cloud fill opacity tightens when acceptance persists, visually signaling balance compressions ready to break.
Dashboard displays absolute width, ATR-normalized width, and current state (Balanced vs Transitional) so you can glance across charts quickly.
Acceptance Flag toggle: Keep the repeated acceptance squares hidden until you need to audit balance.
PARAMETERS
Structure Timeframe (default: 240): Choose the timeframe whose ranges matter most (4H for indices, Daily for stocks).
Structure Lookback (default: 60): Bars sampled on the structure timeframe.
Acceptance Bars (default: 8): How many consecutive bars inside the range confirm balance.
Break Confirmation Bars (default: 3): Bars required outside the range to validate a breakout.
ATR Reference (default: 14): ATR period for width normalization.
Show Midpoint Grid (default: enabled): Display the midpoint and quarter levels.
Show Adaptive VWAP Fan (default: enabled): Toggle the VWAP channel for assets where volume distribution matters most.
Show Acceptance Flags (default: disabled): Turn the acceptance markers on/off for maximum visual control.
Show Range Dashboard (default: enabled): Disable if screen space is limited, re-enable during prep sessions.
ALERTS
The indicator includes five alert conditions:
Range High Tap: Price interacted with the RangeLattice high
Range Low Tap: Price interacted with the RangeLattice low
Range Mid Tap: Price interacted with the RangeLattice mid
Range Break Up: Confirmed upside breakout
Range Break Down: Confirmed downside breakout
Where it works best
This indicator works best on liquid instruments with clear structural levels. On very low timeframes (1-minute and below), the structure may update too frequently to be useful. The acceptance/break confirmation system requires patience—faster traders may find the multi-bar confirmation too slow for scalping. The VWAP fan is session-based and resets daily, which may not suit all trading styles.

FluxPulse Beacon## FluxPulse Beacon
FluxPulse Beacon applies a microstructure lens to every bar, combining directional thrust, realized volatility, and multi-timeframe liquidity checks to decide whether the tape is being pushed by real sponsorship or just noise. The oscillator's color-coded columns and adaptive burst thresholds transform complex flow dynamics into a single actionable flux score for futures and equities traders.
HOW IT WORKS
Momentum Extraction – Price differentials over a configurable pulse distance are smoothed using exponential moving averages to isolate directional thrust without reacting to single prints.
Volatility + Liquidity Normalization – The momentum stream is divided by realized volatility and multiplied by both local and higher-timeframe EMA volume ratios, ensuring pulses only appear when volatility and liquidity align.
Adaptive Thresholding – A volatility-derived standard deviation of flux is blended with the base threshold so bursts scale automatically between low-volatility and high-volatility market conditions.
Divergence Engine – Linear regression slopes compare price vs. flux to tag bullish/bearish divergences, highlighting stealth accumulation or distribution zones.
HOW TO USE IT
Continuation Entries : Go with the trend when histogram bars stay above the adaptive threshold, the signal line confirms, and trend bias agrees—this is where liquidity-backed follow-through lives.
Fade Plays : Watch for divergence alerts and shrinking compression values; when flux prints below zero yet price grinds higher, hidden selling pressure often precedes rollovers.
Session Filter : Compression percentage in the diagnostics table instantly tells you whether to trade thin overnight sessions—low compression means stand down.
VISUAL FEATURES
Dynamic background heat maps flux magnitude, while threshold lines provide a quick read on whether a pulse is statistically significant.
Diagnostics table displays live flux, signal, adaptive threshold, and compression for quick reference.
Alert-first workflow: The surface is intentionally clean—bursts and divergences are delivered via alerts instead of on-chart clutter.
PARAMETERS
Trend EMA Length (default: 34): Defines the macro bias anchor; increase for higher-timeframe confirmation.
Pulse Distance (default: 8): Controls how sensitive momentum extraction becomes.
Volatility Window (default: 21): Sample window for realized volatility normalization.
Liquidity Window (default: 55): Volume smoothing window that proxies liquidity expansion.
Liquidity Reference TF (default: 60): Select a higher timeframe to cross-check whether current volume matches institutional flows.
Adaptive Threshold (default: enabled): Disable for fixed thresholds on slower markets; enable for high-volatility assets.
Base Burst Threshold (default: 1.25): Minimum flux magnitude that qualifies as an actionable pulse.
ALERTS
The indicator includes four alert conditions:
Bull Burst: Detects upside liquidity pulses
Bear Burst: Detects downside liquidity pulses
Bull Divergence: Flags bullish delta divergence
Bear Divergence: Flags bearish delta divergence
LIMITATIONS
This indicator is designed for liquid futures and equity markets. Performance may degrade in low-volume or highly illiquid instruments. The adaptive threshold system works best on timeframes where sufficient volatility history exists (typically 15-minute charts and above). Divergence signals are probabilistic and should be confirmed with price action.
INSERT_CHART_SNAPSHOT_URL_HERE
---
## RangeLattice Mapper
RangeLattice Mapper constructs a higher-timeframe scaffolding on any intraday chart, locking in structural highs/lows, mid/quarter grids, VWAP confluence, and live acceptance/break analytics. It provides a non-repainting overlay that turns range management into a disciplined process.
HOW IT WORKS
Structure Harvesting – Using request.security() , the script samples highs/lows from a user-selected timeframe (default 240 minutes) over a configurable lookback to establish the dominant range.
Grid Construction – Midpoint and quarter levels are derived mathematically, mirroring how institutional traders map distribution/accumulation zones.
Acceptance Detection – Consecutive closes inside the range flip an acceptance flag and darken the cloud, signaling balanced auction conditions.
Break Confirmation – Multi-bar closes outside the structure raise break labels and alerts, filtering the countless fake-outs that plague breakout traders.
VWAP Fan Overlay – Session VWAP plus ATR-based bands provide a live measure of flow centering relative to the lattice.
HOW TO USE IT
Range Plays : Fade taps of the outer rails only when acceptance is active and VWAP sits inside the grid—this is where mean-reversion works best.
Breakout Plays : Wait for confirmed break labels before entering expansion trades; the dashboard's Width/ATR metric tells you if the expansion has enough fuel.
Market Prep : Carry the same lattice from pre-market into regular trading hours by keeping the structure timeframe fixed; alerts keep you notified even when managing multiple tickers.
VISUAL FEATURES
Range Tap and Mid Pivot markers provide a tape-reading breadcrumb trail for journaling.
Cloud fill opacity tightens when acceptance persists, visually signaling balance compressions ready to break.
Dashboard displays absolute width, ATR-normalized width, and current state (Balanced vs Transitional) so you can glance across charts quickly.
Acceptance Flag toggle: Keep the repeated acceptance squares hidden until you need to audit balance.
PARAMETERS
Structure Timeframe (default: 240): Choose the timeframe whose ranges matter most (4H for indices, Daily for stocks).
Structure Lookback (default: 60): Bars sampled on the structure timeframe.
Acceptance Bars (default: 8): How many consecutive bars inside the range confirm balance.
Break Confirmation Bars (default: 3): Bars required outside the range to validate a breakout.
ATR Reference (default: 14): ATR period for width normalization.
Show Midpoint Grid (default: enabled): Display the midpoint and quarter levels.
Show Adaptive VWAP Fan (default: enabled): Toggle the VWAP channel for assets where volume distribution matters most.
Show Acceptance Flags (default: disabled): Turn the acceptance markers on/off for maximum visual control.
Show Range Dashboard (default: enabled): Disable if screen space is limited, re-enable during prep sessions.
ALERTS
The indicator includes five alert conditions:
Range High Tap: Price interacted with the RangeLattice high
Range Low Tap: Price interacted with the RangeLattice low
Range Mid Tap: Price interacted with the RangeLattice mid
Range Break Up: Confirmed upside breakout
Range Break Down: Confirmed downside breakout
LIMITATIONS
This indicator works best on liquid instruments with clear structural levels. On very low timeframes (1-minute and below), the structure may update too frequently to be useful. The acceptance/break confirmation system requires patience—faster traders may find the multi-bar confirmation too slow for scalping. The VWAP fan is session-based and resets daily, which may not suit all trading styles.
---

Volume-Price Shift Box (Lite Version)Description
This indicator is a clean and intuitive visual tool designed to help traders quickly assess the current balance of bullish and bearish forces in the market.
It combines volume, price movement, VWAP, and OBV dynamics into a compact on-chart table that updates in real time.
This version focuses on the core logic and visualization of momentum and volume shifts, making it ideal for traders who want actionable insight without complex configuration.
How It Works
The script measures the combined strength of multiple market components:
VWAP trend indicates price bias relative to fair value.
OBV (On-Balance Volume) tracks volume flow to confirm or contradict price movement.
Volume ratio compares current volume to its recent average.
Momentum evaluates directional price movement over a configurable lookback period.
Accumulation / Distribution (A/D) Line estimates buying or selling pressure within each candle:
↑ — A/D is rising (buying pressure is increasing)
↑↑ — A/D is rising faster than before (acceleration of buying)
↓ — A/D is falling (selling pressure is increasing)
↓↓ — A/D is falling faster than before (acceleration of selling)
Each of these components contributes to an overall shift score.
Depending on this score, the box displays:
🟢 Bullish Shift — strong upward alignment
🔴 Bearish Shift — downward alignment
⚪ Neutral — mixed or indecisive conditions
Key Features
Compact on-chart information box with color-coded parameters
Combined volume-price relationship model
Configurable lookback and sensitivity controls
Real-time shift strength and trend duration tracking
Adjustable EMA/SMA smoothing for all averages
Lightweight design optimized for clarity
Inputs Overview
Box Position / Size – Place and scale the on-chart info box
Lookback Period – Number of bars used for calculations
VWAP Lookback – Period for VWAP distance smoothing
Shift Sensitivity – Adjusts reaction strength of bullish/bearish shifts
Neutral Zone Threshold – Defines when the market is considered neutral
EMA or SMA – Choose exponential or simple moving averages
Component Weights – Set the influence of VWAP, OBV, Volume, and Momentum on the shift score
Display Toggles – Enable or disable metrics shown in the box (Strength, Volume, VWAP, Duration, OBV)
How to Use
Apply the indicator to any symbol and timeframe.
Observe the box on the chart — it updates dynamically.
Look for transitions between Neutral → Bullish or Neutral → Bearish shifts.
Combine with your existing price action or confirmation tools (e.g., support/resistance, trendlines).
Use the “Strength” and “Duration” values to assess consistency and momentum quality.
(This indicator is not a buy/sell signal generator — it is designed as a contextual analysis and confirmation tool.)
How It Helps
Merges several key volume and price metrics into a single view
Highlights transitions in market control between buyers and sellers
Reduces clutter by presenting only relevant context data
Works on any market and timeframe, from scalping to swing trading
⚠️Disclaimer:
This script is provided for educational and informational purposes only. It is not financial advice and should not be considered a recommendation to buy, sell, or hold any financial instrument. Trading involves significant risk of loss and is not suitable for every investor. Users should perform their own due diligence and consult with a licensed financial advisor before making any trading decisions. The author does not guarantee any profits or results from using this script, and assumes no liability for any losses incurred. Use this script at your own risk.

ORB + Session VWAP Pro (London & NY) — fixedORB + Session VWAP Pro (London & NY) — Listing copy (EN)
What it is
A clean, non-repainting intraday tool that fuses the classic Opening Range Breakout (ORB) with a session-anchored VWAP filter for London and New York. It highlights only the higher-quality breakouts (above/below session VWAP), adds an optional retest confirmation, and scores each signal with an intuitive Confidence metric (0–100).
Why it works
• ORB provides the day’s first actionable structure (range high/low).
• Session VWAP filters “cheap” breaks and favors flows aligned with session value.
• Optional retest reduces first-tick whipsaws.
• Confidence blends breakout depth (vs ATR), VWAP slope and band distance.
Key visuals
• LDN/NY OR High/Low (line break style) + optional OR boxes.
• Active Session VWAP (resets per signal window; falls back to daily VWAP outside).
• Optional VWAP bands (stdev or %).
• Session shading (London/NY windows).
• Signal markers (LDN BUY/SELL, NY BUY/SELL) fired with cooldown.
Signals
• London Long / Short: Break of LDN OR High/Low ± ATR buffer, aligned with VWAP side.
• NY Long / Short: Same logic during NY window.
• Retest (optional): Requires a tag back to the OR level ± tolerance before confirmation.
• Confidence: 0–100; gate via Min Confidence (default 55).
Inputs that matter
• Open Range Length (min): Default 15.
• London/NY times & timezones.
• ATR buffer & retest tolerance.
• Bands mode: Stdev (with lookback) or % (e.g., 1%).
• Signal cooldown: Avoids clutter on fast moves.
Non-repaint policy
• OR lines build within fixed time windows using the current bar’s timestamp.
• VWAP is cumulative within the session window; no lookahead.
• All ta.crossover/ta.crossunder are precomputed every bar (no conditional execution).
• Signals are based on live bar values, not future bars.
⸻
Quick start (examples)
1) EURUSD, London momentum
• Chart: 5m or 15m.
• OR: 15 min starting 08:00 Europe/London.
• Signals: Use defaults; keep ATR buffer = 0.2 and Retest = ON, Min Confidence ≥ 55.
• Play:
• BUY when price breaks LDN OR High + buffer and stays above VWAP; retest confirms.
• Trail behind VWAP or band #1; partials into band #2.
2) NAS100, New York breakout & run
• Chart: 5m.
• NY window: 09:30 America/New_York, OR = 15 min.
• Retest OFF on high momentum days; Min Confidence ≥ 60.
• Use band mode Stdev, bandLen=50, show ±1/±2.
• Momentum continuation: add on pullbacks that hold above VWAP after the breakout.
3) XAUUSD, London fake & VWAP fade
• Chart: 5m.
• Keep Retest ON; accept only shorts that break OR Low but retest fails back under VWAP.
• Confidence gate ≥ 50 to allow more mean-reversion setups.
⸻
Pro tips
• Adjust ATR buffer to the instrument: FX 0.15–0.25, indices 0.20–0.35, metals 0.20–0.30.
• Retest ON for choppy conditions; OFF for news momentum.
• Use VWAP bands: take partials at ±1; stretch targets at ±2/±3.
• Session timezones are explicit (London/New York). Ensure they match your instrument’s behavior.
• Pair with a higher-TF bias (e.g., 1H/4H trend) for directional filtering.
⸻
Alerts (ready to use)
• ORB+SVWAP — LDN Long, LDN Short, NY Long, NY Short
(Respect your cooldown; alerts fire only after confirmation and confidence gate.)
⸻
Known limits & notes
• Designed for intraday. On 1D+ charts, session windows compress.
• If your broker session differs from London/NY clocks on a holiday, adjust input times.
• Session-anchored VWAP uses the script’s signal window, not exchange sessions, by design.

Head Hunter HHHead Hunter HH - Advanced Market Structure & Volume Analysis Indicator
This indicator combines volume analysis, price action, and VWAP to identify high-probability trading opportunities across multiple timeframes.
Key Features:
• Smart Volume Analysis: Detects institutional volume patterns using dynamic thresholds
• VWAP-Based Market Structure: Multiple standard deviation bands for precision entry/exit
• Daily Level Integration: Previous day's high, low, close, and current day's open
• Advanced Signal Classification: Regular, Super Strong, and Scalp signals
Signal Types:
1. Regular Signals (White/Purple Triangles)
• Volume-confirmed reversals
• Institutional price levels
• Technical momentum alignment
2. Super Strong Signals (Green/Red Diamonds)
• High-volume breakouts
• Strong momentum confirmation
• Multiple timeframe alignment
3. Scalp Signals (Green/Magenta Circles)
• Quick reversal opportunities
• VWAP deviation analysis
• Volume surge confirmation
Visual Components:
• VWAP with Standard Deviation Bands
• 50 MA (optional)
• Daily Reference Levels
• Color-coded signals based on strength
• Bar color changes on confirmed signals
Best Practices:
• Most effective on higher timeframes (1H+)
• Use with major pairs/instruments
• Combine signals with support/resistance
• Monitor volume confirmation
• Wait for candle close confirmation
This indicator helps identify institutional order flow and high-probability reversal zones by analyzing volume patterns, price action, and market structure, providing traders with multiple confirmation layers before entry.
Note: Results may vary based on market conditions and timeframe selection. Always use proper risk management.
