Volatility Rainbow [Nic]What is this
The volatility rainbow tracks divergences in a security and its volatility index. This can be used to identify periods of heightened implied (future) risk.
About Volatility
The volatility is calculated by looking at put / call ratios. When VIX goes up it means that puts are outpacing calls. This is a bearish signal.
About Correlation
When the security goes up while the VIX goes up, the divergence on the plot will increase and turn a color. This should be a warning.
Colors
RED - DIA
BLUE - SPX
GREEN - IWM
GOLD - GLD
YELLOW - QQQ
ORANGE - TLT
White- VVIX
Related
Cari dalam skrip untuk "Volatility"

Volatility SwitchThis is originally a script built by LazyBear in version 2 and updated to version 4. Slowly trying to learn other concepts in Pine and sharing what I come up with just in case it adds any value to the community. This gives a good idea of low volatility in the market and is a good warning sign to pay attention for a larger move when volatility swings back the other way.

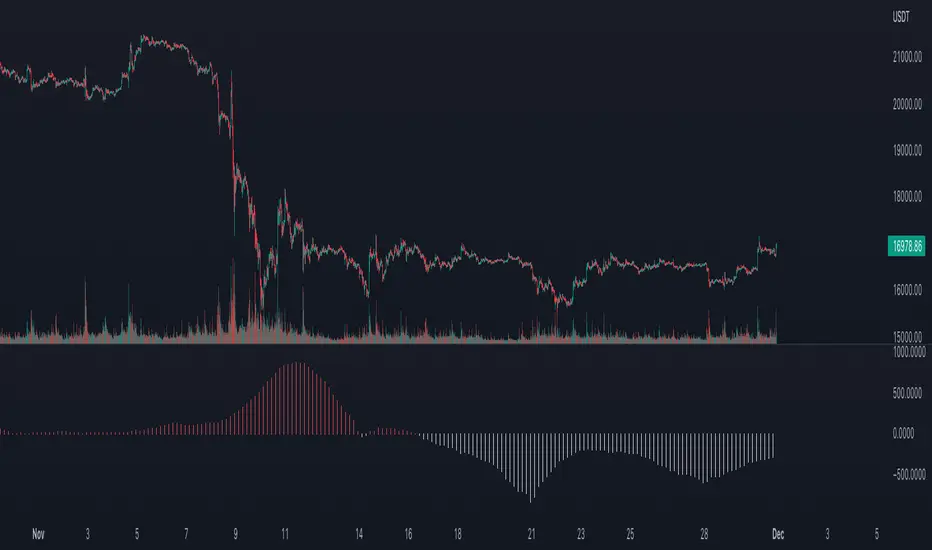
Volatility Range [by JQBS]Plotting the volatility over time. This is used to find reversal patterns in the BTC markets. Best used on higher timeframes 1D and higher. I haven't looked at it at lower TF but I reckon it's fairly useless.

Volatility Risk Premium (VRP) 1.0ENGLISH
This indicator (V-R-P) calculates the (one month) Volatility Risk Premium for S&P500 and Nasdaq-100.
V-R-P is the premium hedgers pay for over Realized Volatility for S&P500 and Nasdaq-100 index options.
The premium stems from hedgers paying to insure their portfolios, and manifests itself in the differential between the price at which options are sold (Implied Volatility) and the volatility the S&P500 and Nasdaq-100 ultimately realize (Realized Volatility).
I am using 30-day Implied Volatility (IV) and 21-day Realized Volatility (HV) as the basis for my calculation, as one month of IV is based on 30 calendaristic days and one month of HV is based on 21 trading days.
At first, the indicator appears blank and a label instructs you to choose which index you want the V-R-P to plot on the chart. Use the indicator settings (the sprocket) to choose one of the indices (or both).
Together with the V-R-P line, the indicator will show its one year moving average within a range of +/- 15% (which you can change) for benchmarking purposes. We should consider this range the “normalized” V-R-P for the actual period.
The Zero Line is also marked on the indicator.
Interpretation
When V-R-P is within the “normalized” range, … well... volatility and uncertainty, as it’s seen by the option market, is “normal”. We have a “premium” of volatility which should be considered normal.
When V-R-P is above the “normalized” range, the volatility premium is high. This means that investors are willing to pay more for options because they see an increasing uncertainty in markets.
When V-R-P is below the “normalized” range but positive (above the Zero line), the premium investors are willing to pay for risk is low, meaning they see decreasing uncertainty and risks in the market, but not by much.
When V-R-P is negative (below the Zero line), we have COMPLACENCY. This means investors see upcoming risk as being lower than what happened in the market in the recent past (within the last 30 days).
CONCEPTS:
Volatility Risk Premium
The volatility risk premium (V-R-P) is the notion that implied volatility (IV) tends to be higher than realized volatility (HV) as market participants tend to overestimate the likelihood of a significant market crash.
This overestimation may account for an increase in demand for options as protection against an equity portfolio. Basically, this heightened perception of risk may lead to a higher willingness to pay for these options to hedge a portfolio.
In other words, investors are willing to pay a premium for options to have protection against significant market crashes even if statistically the probability of these crashes is lesser or even negligible.
Therefore, the tendency of implied volatility is to be higher than realized volatility, thus V-R-P being positive.
Realized/Historical Volatility
Historical Volatility (HV) is the statistical measure of the dispersion of returns for an index over a given period of time.
Historical volatility is a well-known concept in finance, but there is confusion in how exactly it is calculated. Different sources may use slightly different historical volatility formulas.
For calculating Historical Volatility I am using the most common approach: annualized standard deviation of logarithmic returns, based on daily closing prices.
Implied Volatility
Implied Volatility (IV) is the market's forecast of a likely movement in the price of the index and it is expressed annualized, using percentages and standard deviations over a specified time horizon (usually 30 days).
IV is used to price options contracts where high implied volatility results in options with higher premiums and vice versa. Also, options supply and demand and time value are major determining factors for calculating Implied Volatility.
Implied Volatility usually increases in bearish markets and decreases when the market is bullish.
For determining S&P500 and Nasdaq-100 implied volatility I used their volatility indices: VIX and VXN (30-day IV) provided by CBOE.
Warning
Please be aware that because CBOE doesn’t provide real-time data in Tradingview, my V-R-P calculation is also delayed, so you shouldn’t use it in the first 15 minutes after the opening.
This indicator is calibrated for a daily time frame.
ESPAŇOL
Este indicador (V-R-P) calcula la Prima de Riesgo de Volatilidad (de un mes) para S&P500 y Nasdaq-100.
V-R-P es la prima que pagan los hedgers sobre la Volatilidad Realizada para las opciones de los índices S&P500 y Nasdaq-100.
La prima proviene de los hedgers que pagan para asegurar sus carteras y se manifiesta en el diferencial entre el precio al que se venden las opciones (Volatilidad Implícita) y la volatilidad que finalmente se realiza en el S&P500 y el Nasdaq-100 (Volatilidad Realizada).
Estoy utilizando la Volatilidad Implícita (IV) de 30 días y la Volatilidad Realizada (HV) de 21 días como base para mi cálculo, ya que un mes de IV se basa en 30 días calendario y un mes de HV se basa en 21 días de negociación.
Al principio, el indicador aparece en blanco y una etiqueta le indica que elija qué índice desea que el V-R-P represente en el gráfico. Use la configuración del indicador (la rueda dentada) para elegir uno de los índices (o ambos).
Junto con la línea V-R-P, el indicador mostrará su promedio móvil de un año dentro de un rango de +/- 15% (que puede cambiar) con fines de evaluación comparativa. Deberíamos considerar este rango como el V-R-P "normalizado" para el período real.
La línea Cero también está marcada en el indicador.
Interpretación
Cuando el V-R-P está dentro del rango "normalizado",... bueno... la volatilidad y la incertidumbre, como las ve el mercado de opciones, es "normal". Tenemos una “prima” de volatilidad que debería considerarse normal.
Cuando V-R-P está por encima del rango "normalizado", la prima de volatilidad es alta. Esto significa que los inversores están dispuestos a pagar más por las opciones porque ven una creciente incertidumbre en los mercados.
Cuando el V-R-P está por debajo del rango "normalizado" pero es positivo (por encima de la línea Cero), la prima que los inversores están dispuestos a pagar por el riesgo es baja, lo que significa que ven una disminución, pero no pronunciada, de la incertidumbre y los riesgos en el mercado.
Cuando V-R-P es negativo (por debajo de la línea Cero), tenemos COMPLACENCIA. Esto significa que los inversores ven el riesgo próximo como menor que lo que sucedió en el mercado en el pasado reciente (en los últimos 30 días).
CONCEPTOS:
Prima de Riesgo de Volatilidad
La Prima de Riesgo de Volatilidad (V-R-P) es la noción de que la Volatilidad Implícita (IV) tiende a ser más alta que la Volatilidad Realizada (HV) ya que los participantes del mercado tienden a sobrestimar la probabilidad de una caída significativa del mercado.
Esta sobreestimación puede explicar un aumento en la demanda de opciones como protección contra una cartera de acciones. Básicamente, esta mayor percepción de riesgo puede conducir a una mayor disposición a pagar por estas opciones para cubrir una cartera.
En otras palabras, los inversores están dispuestos a pagar una prima por las opciones para tener protección contra caídas significativas del mercado, incluso si estadísticamente la probabilidad de estas caídas es menor o insignificante.
Por lo tanto, la tendencia de la Volatilidad Implícita es de ser mayor que la Volatilidad Realizada, por lo cual el V-R-P es positivo.
Volatilidad Realizada/Histórica
La Volatilidad Histórica (HV) es la medida estadística de la dispersión de los rendimientos de un índice durante un período de tiempo determinado.
La Volatilidad Histórica es un concepto bien conocido en finanzas, pero existe confusión sobre cómo se calcula exactamente. Varias fuentes pueden usar fórmulas de Volatilidad Histórica ligeramente diferentes.
Para calcular la Volatilidad Histórica, utilicé el enfoque más común: desviación estándar anualizada de rendimientos logarítmicos, basada en los precios de cierre diarios.
Volatilidad Implícita
La Volatilidad Implícita (IV) es la previsión del mercado de un posible movimiento en el precio del índice y se expresa anualizada, utilizando porcentajes y desviaciones estándar en un horizonte de tiempo específico (generalmente 30 días).
IV se utiliza para cotizar contratos de opciones donde la alta Volatilidad Implícita da como resultado opciones con primas más altas y viceversa. Además, la oferta y la demanda de opciones y el valor temporal son factores determinantes importantes para calcular la Volatilidad Implícita.
La Volatilidad Implícita generalmente aumenta en los mercados bajistas y disminuye cuando el mercado es alcista.
Para determinar la Volatilidad Implícita de S&P500 y Nasdaq-100 utilicé sus índices de volatilidad: VIX y VXN (30 días IV) proporcionados por CBOE.
Precaución
Tenga en cuenta que debido a que CBOE no proporciona datos en tiempo real en Tradingview, mi cálculo de V-R-P también se retrasa, y por este motivo no se recomienda usar en los primeros 15 minutos desde la apertura.
Este indicador está calibrado para un marco de tiempo diario.

Volatility Risk Premium GOLD & SILVER 1.0ENGLISH
This indicator (V-R-P) calculates the (one month) Volatility Risk Premium for GOLD and SILVER.
V-R-P is the premium hedgers pay for over Realized Volatility for GOLD and SILVER options.
The premium stems from hedgers paying to insure their portfolios, and manifests itself in the differential between the price at which options are sold (Implied Volatility) and the volatility GOLD and SILVER ultimately realize (Realized Volatility).
I am using 30-day Implied Volatility (IV) and 21-day Realized Volatility (HV) as the basis for my calculation, as one month of IV is based on 30 calendaristic days and one month of HV is based on 21 trading days.
At first, the indicator appears blank and a label instructs you to choose which index you want the V-R-P to plot on the chart. Use the indicator settings (the sprocket) to choose one of the precious metals (or both).
Together with the V-R-P line, the indicator will show its one year moving average within a range of +/- 15% (which you can change) for benchmarking purposes. We should consider this range the “normalized” V-R-P for the actual period.
The Zero Line is also marked on the indicator.
Interpretation
When V-R-P is within the “normalized” range, … well... volatility and uncertainty, as it’s seen by the option market, is “normal”. We have a “premium” of volatility which should be considered normal.
When V-R-P is above the “normalized” range, the volatility premium is high. This means that investors are willing to pay more for options because they see an increasing uncertainty in markets.
When V-R-P is below the “normalized” range but positive (above the Zero line), the premium investors are willing to pay for risk is low, meaning they see decreasing uncertainty and risks in the market, but not by much.
When V-R-P is negative (below the Zero line), we have COMPLACENCY. This means investors see upcoming risk as being lower than what happened in the market in the recent past (within the last 30 days).
CONCEPTS :
Volatility Risk Premium
The volatility risk premium (V-R-P) is the notion that implied volatility (IV) tends to be higher than realized volatility (HV) as market participants tend to overestimate the likelihood of a significant market crash.
This overestimation may account for an increase in demand for options as protection against an equity portfolio. Basically, this heightened perception of risk may lead to a higher willingness to pay for these options to hedge a portfolio.
In other words, investors are willing to pay a premium for options to have protection against significant market crashes even if statistically the probability of these crashes is lesser or even negligible.
Therefore, the tendency of implied volatility is to be higher than realized volatility, thus V-R-P being positive.
Realized/Historical Volatility
Historical Volatility (HV) is the statistical measure of the dispersion of returns for an index over a given period of time.
Historical volatility is a well-known concept in finance, but there is confusion in how exactly it is calculated. Different sources may use slightly different historical volatility formulas.
For calculating Historical Volatility I am using the most common approach: annualized standard deviation of logarithmic returns, based on daily closing prices.
Implied Volatility
Implied Volatility (IV) is the market's forecast of a likely movement in the price of the index and it is expressed annualized, using percentages and standard deviations over a specified time horizon (usually 30 days).
IV is used to price options contracts where high implied volatility results in options with higher premiums and vice versa. Also, options supply and demand and time value are major determining factors for calculating Implied Volatility.
Implied Volatility usually increases in bearish markets and decreases when the market is bullish.
For determining GOLD and SILVER implied volatility I used their volatility indices: GVZ and VXSLV (30-day IV) provided by CBOE.
Warning
Please be aware that because CBOE doesn’t provide real-time data in Tradingview, my V-R-P calculation is also delayed, so you shouldn’t use it in the first 15 minutes after the opening.
This indicator is calibrated for a daily time frame.
----------------------------------------------------------------------
ESPAŇOL
Este indicador (V-R-P) calcula la Prima de Riesgo de Volatilidad (de un mes) para GOLD y SILVER.
V-R-P es la prima que pagan los hedgers sobre la Volatilidad Realizada para las opciones de GOLD y SILVER.
La prima proviene de los hedgers que pagan para asegurar sus carteras y se manifiesta en el diferencial entre el precio al que se venden las opciones (Volatilidad Implícita) y la volatilidad que finalmente se realiza en el ORO y la PLATA (Volatilidad Realizada).
Estoy utilizando la Volatilidad Implícita (IV) de 30 días y la Volatilidad Realizada (HV) de 21 días como base para mi cálculo, ya que un mes de IV se basa en 30 días calendario y un mes de HV se basa en 21 días de negociación.
Al principio, el indicador aparece en blanco y una etiqueta le indica que elija qué índice desea que el V-R-P represente en el gráfico. Use la configuración del indicador (la rueda dentada) para elegir uno de los metales preciosos (o ambos).
Junto con la línea V-R-P, el indicador mostrará su promedio móvil de un año dentro de un rango de +/- 15% (que puede cambiar) con fines de evaluación comparativa. Deberíamos considerar este rango como el V-R-P "normalizado" para el período real.
La línea Cero también está marcada en el indicador.
Interpretación
Cuando el V-R-P está dentro del rango "normalizado",... bueno... la volatilidad y la incertidumbre, como las ve el mercado de opciones, es "normal". Tenemos una “prima” de volatilidad que debería considerarse normal.
Cuando V-R-P está por encima del rango "normalizado", la prima de volatilidad es alta. Esto significa que los inversores están dispuestos a pagar más por las opciones porque ven una creciente incertidumbre en los mercados.
Cuando el V-R-P está por debajo del rango "normalizado" pero es positivo (por encima de la línea Cero), la prima que los inversores están dispuestos a pagar por el riesgo es baja, lo que significa que ven una disminución, pero no pronunciada, de la incertidumbre y los riesgos en el mercado.
Cuando V-R-P es negativo (por debajo de la línea Cero), tenemos COMPLACENCIA. Esto significa que los inversores ven el riesgo próximo como menor que lo que sucedió en el mercado en el pasado reciente (en los últimos 30 días).
CONCEPTOS :
Prima de Riesgo de Volatilidad
La Prima de Riesgo de Volatilidad (V-R-P) es la noción de que la Volatilidad Implícita (IV) tiende a ser más alta que la Volatilidad Realizada (HV) ya que los participantes del mercado tienden a sobrestimar la probabilidad de una caída significativa del mercado.
Esta sobreestimación puede explicar un aumento en la demanda de opciones como protección contra una cartera de acciones. Básicamente, esta mayor percepción de riesgo puede conducir a una mayor disposición a pagar por estas opciones para cubrir una cartera.
En otras palabras, los inversores están dispuestos a pagar una prima por las opciones para tener protección contra caídas significativas del mercado, incluso si estadísticamente la probabilidad de estas caídas es menor o insignificante.
Por lo tanto, la tendencia de la Volatilidad Implícita es de ser mayor que la Volatilidad Realizada, por lo cual el V-R-P es positivo.
Volatilidad Realizada/Histórica
La Volatilidad Histórica (HV) es la medida estadística de la dispersión de los rendimientos de un índice durante un período de tiempo determinado.
La Volatilidad Histórica es un concepto bien conocido en finanzas, pero existe confusión sobre cómo se calcula exactamente. Varias fuentes pueden usar fórmulas de Volatilidad Histórica ligeramente diferentes.
Para calcular la Volatilidad Histórica, utilicé el enfoque más común: desviación estándar anualizada de rendimientos logarítmicos, basada en los precios de cierre diarios.
Volatilidad Implícita
La Volatilidad Implícita (IV) es la previsión del mercado de un posible movimiento en el precio del índice y se expresa anualizada, utilizando porcentajes y desviaciones estándar en un horizonte de tiempo específico (generalmente 30 días).
IV se utiliza para cotizar contratos de opciones donde la alta Volatilidad Implícita da como resultado opciones con primas más altas y viceversa. Además, la oferta y la demanda de opciones y el valor temporal son factores determinantes importantes para calcular la Volatilidad Implícita.
La Volatilidad Implícita generalmente aumenta en los mercados bajistas y disminuye cuando el mercado es alcista.
Para determinar la Volatilidad Implícita de GOLD y SILVER utilicé sus índices de volatilidad: GVZ y VXSLV (30 días IV) proporcionados por CBOE.
Precaución
Tenga en cuenta que debido a que CBOE no proporciona datos en tiempo real en Tradingview, mi cálculo de V-R-P también se retrasa, y por este motivo no se recomienda usar en los primeros 15 minutos desde la apertura.
Este indicador está calibrado para un marco de tiempo diario.

Volatility Compression Ratio by M-CarloHello traders. I created this simple indicator to use as a FILTER.
He does not provide any operational signals but tells us if we are in a period of volatility compression or expansion and it can work on all market.
This filter works great for all strategies that work on breakouts
The concept is this: I will enter at breakout of a price level that I consider important, only if there is a volatility compression and not in the case of expansion of volatility.
Technically the calculation is very simple:
Step 1: I calculate the ATR at "x" periods, I set 7 by default because I get better results but you can change it as you like using the "atr length" field. You can also choose whether to calculate the ATR via RMA, SMA or EMA.
Step 2: I Calculate a simple average of the previous ATR over a longer period, longer period than set with the "length multiplier" parameter, which multiplies the "atr length" value by "x" times. Here I set the default 3 but you can change it as you like.
Step 3: I divide the ATR value calculated in step1 by its long-term average calculated in step2, obtaining a value that will oscillate above and below the value of 1
So:
if the indicator is above the value of 1 it means that volatility is expanding
If the indicator is below the value of 1 it means that we are in a period of volatility compression (and as we know volatility explodes sooner or later)
If you have any questions write to me and I hope this filter helps you! Have good Trading!

Volatility Spike EstimatorPlots the Average True Range (ATR), its historical mean, the upper threshold for a volatility spike, and uses background color to show the likelihood of a volatility spike based on the current ATR value.
Green background indicates an increased likelihood of a volatility spike, while red background means a spike might have already occurred or be in progress.
Update: In this version, we added a short-term ATR calculation with an adjustable input parameter, shortTermATRLength. The likelihood of a volatility spike is now estimated based on the short-term ATR instead of the original ATR. This change makes the indicator more sensitive to recent market conditions and can help detect potential volatility spikes more quickly.

TheATR™: Volatility Extremes (VolEx)Volatility is a crucial aspect of financial markets that is closely monitored by traders and investors alike. The traditional Average True Range (ATR) oscillator is a widely used technical indicator for measuring volatility in financial markets. However, there are limitations to the ATR oscillator, as it does not account for changing market conditions and may not adequately reflect extreme price movements. To address these limitations, TheATR has developed the VolEx indicator, which aims to identify extremes in the ATR oscillator by building dynamic thresholds using either a 'percentage' or 'standard deviation' based comparison with the value of the ATR.
The VolEx indicator utilizes a dynamic approach to measure volatility by considering the current level of the ATR oscillator relative to the dynamically generated thresholds. The dynamic thresholds are calculated based on the current ATR value and the chosen method of comparison (either 'percentage' or 'standard deviation'). If the ATR value exceeds the upper dynamic threshold, the market is experiencing high volatility, while a value below the lower dynamic threshold indicates low volatility.
The VolEx indicator offers several advantages over traditional volatility indicators, such as the ATR oscillator. First, it takes into account the changing market conditions and adjusts the thresholds accordingly. Second, it offers flexibility in the choice of the comparison method, allowing traders to tailor the indicator to their specific trading strategies. Finally, it provides clear signals for identifying extremes in volatility, which can be used to inform trading decisions.
In summary, the VolEx indicator developed by TheATR is a dynamic and flexible technical indicator that offers a robust approach to measuring volatility in financial markets. By utilizing dynamic thresholds and allowing for different comparison methods, the VolEx indicator provides a valuable tool for traders and investors seeking to identify extremes in market volatility..
NOTE: It is important to note that volatility, as measured by the VolEx indicator, does not provide any directional bias for the market movement. Rather, it simply indicates the degree to which the market is moving, regardless of direction. Traders and investors must use other technical or fundamental analysis tools to determine the direction of the market and make informed trading decisions based on their individual strategies and risk tolerance.

Volatility-Based Mean Reversion BandsThe Volatility-Based Mean Reversion Bands indicator is a powerful tool designed to identify potential mean reversion trading opportunities based on market volatility. The indicator consists of three lines: the mean line, upper band, and lower band. These bands dynamically adjust based on the average true range (ATR) and act as reference levels for identifying overbought and oversold conditions.
The calculation of the indicator involves several steps. The average true range (ATR) is calculated using a specified lookback period. The ATR measures the market's volatility by considering the range between high and low prices over a given period. The mean line is calculated as a simple moving average (SMA) of the closing prices over the same lookback period. The upper band is derived by adding the product of the ATR and a multiplier to the mean line, while the lower band is derived by subtracting the product of the ATR and the same multiplier from the mean line.
Interpreting the indicator is relatively straightforward. When the price approaches or exceeds the upper band, it suggests that the market is overbought and may be due for a potential reversal to the downside. On the other hand, when the price approaches or falls below the lower band, it indicates that the market is oversold and may be poised for a potential reversal to the upside. Traders can look for opportunities to enter short positions near the upper band and long positions near the lower band, anticipating the price to revert back towards the mean line.
The bar color and background color play a crucial role in visualizing the indicator's signals and market conditions. Lime-colored bars are used when the price is above the upper band, indicating a potential bearish mean reversion signal. Conversely, fuchsia-colored bars are employed when the price is below the lower band, suggesting a potential bullish mean reversion signal. This color scheme helps traders quickly identify the prevailing market condition and potential reversal zones. The background color complements the bar color by providing further context. Lime-colored background indicates a potential bearish condition, while fuchsia-colored background suggests a potential bullish condition. The transparency level of the background color is set to 80% to avoid obscuring the price chart while still providing a visual reference.
To provide additional confirmation for mean reversion setups, the indicator incorporates the option to use the Relative Strength Index (RSI) as a confluence factor. The RSI is a popular momentum oscillator that measures the speed and change of price movements. When enabled, the indicator checks if the RSI is in overbought territory (above 70) or oversold territory (below 30), providing additional confirmation for potential mean reversion setups.
In addition to visual signals, the indicator includes entry arrows above or below the bars to highlight the occurrence of short or long entries. When the price is above the upper band and the confluence condition is met, a fuchsia-colored triangle-up arrow is displayed above the bar, indicating a potential short entry signal. Similarly, when the price is below the lower band and the confluence condition is met, a lime-colored triangle-down arrow is displayed below the bar, indicating a potential long entry signal.
Traders can customize the indicator's parameters according to their trading preferences. The "Lookback Period" determines the number of periods used in calculating the mean line and the average true range (ATR). Adjusting this parameter can affect the sensitivity and responsiveness of the indicator. Smaller values make the indicator more reactive to short-term price movements, while larger values smooth out the indicator and make it less responsive to short-term fluctuations. The "Multiplier" parameter determines the distance between the mean line and the upper/lower bands. Increasing the multiplier widens the bands, indicating a broader range for potential mean reversion opportunities, while decreasing the multiplier narrows the bands, indicating a tighter range for potential mean reversion opportunities.
It's important to note that the Volatility-Based Mean Reversion Bands indicator is not a standalone trading strategy but rather a tool to assist traders in identifying potential mean reversion setups. Traders should consider using additional analysis techniques and risk management strategies to make informed trading decisions. Additionally, the indicator's performance may vary across different market conditions and instruments, so it's advisable to conduct thorough testing and analysis before integrating it into a trading strategy.

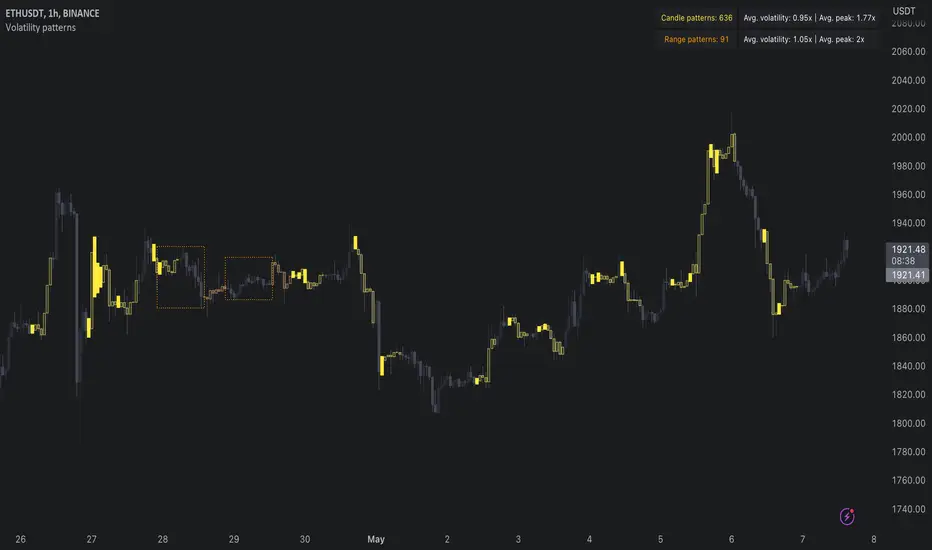
Volatility patterns / quantifytools- Overview
Volatility patterns detect various forms of indecisive price action, on a larger scale as a compressed range and on a smaller scale as indecision candles. Indecisive and volatility suppressing price action can be thought of as a spring being pressed down. The more suppression, the more tension is built and eventually released as a spike or series of spikes in volatility. Each volatility pattern is assigned an influence period, during which average and peak relative volatility is recorded and stored to volatility metrics.
- Patterns
The following scenarios are qualified as indecision candles: inside candles, indecision engulfing candles and volatility shifts.
By default, each indecision candle is considered a valid pattern only when another indecision candle has taken place within 3 periods, e.g. prior inside candle + indecision engulfing candle = valid volatility pattern. This measurement is taken to filter noise by looking for multiple hints of pending volatility, rather than just one. Level of tolerated noise can be changed via input menu by using sensitivity setting, by default set to 2.
Sensitivity at 1: Any single indecision candle is considered a valid pattern
Sensitivity at 2: 2 indecision candles within 3 bars is considered a valid pattern
Sensitivity at 3: 2 indecision candles within 2 bars (consecutive) is considered a valid pattern
The following scenarios are qualified as range patterns: series of lower highs/higher lows and series of low volatility pivots.
A pivot is defined by highest/lowest point in price, by default within 2 periods back and 2 periods forward. When 4 pivots with qualities mentioned above are found, a box indicating compressed range will appear. Both required pivots and pivot definition can be adjusted via input menu.
- Influence time and metrics
By default, influence time for each volatility pattern is set to 6 candles, a period for which spike(s) in volatility is expected. For each influence period, average relative volatility (volatility relative to volatility SMA 20) and peak relative volatility is recorded and stored to volatility metrics. All metrics used in calculations are visible in "Data Window "tab. Average and peak volatility during influence period will vary depending on chart, timeframe and chosen settings. Tweaking the settings might result in an improvement and is worth experimenting with.
- Visuals
By default, indecision candles are visualized as yellow lines and range patterns as orange boxes. Influence time periods are respectively visualized as colored candle borders, applied as long as influence time period is active. All colors are fully customizable via input menu.
- Practical guide
Volatility patterns depict moments of equal strength from both bulls and bears. While this equilibrium is in place, price is stagnant and compresses until either side initiates volatility, releasing the built up tension. On top of hedging and playing the volatility using volatility based instruments, some other methods can be applied to take advantage of the somewhat tricky areas of indecision.
Example #1: Trading volatility
Volatility is not a bad thing from a trading perspective, but can actually be fertile ground for executing trade setups. Trading volatility influence periods from higher timeframes on lower timeframes gives greater resolution to work with and opportunities to take advantage of the wild swings created.
Example #2: Finding bias for patterns
Points of confluence where it anyway makes sense to favor one side over the other can be used for establishing bias for indecisive price action as well. At face value, it makes sense to expect bearish reactions at range highs and bullish reactions at range low, for which volatility patterns can provide a catalyst.
Example #3: Betting on initiation direction
Betting on direction of the first volatile move can easily go against you, but if risk/reward is able to compensate for the poor win rate, it's a valid idea to consider and explore.
Volatility SpeedometerThe Volatility Speedometer indicator provides a visual representation of the rate of change of volatility in the market. It helps traders identify periods of high or low volatility and potential trading opportunities. The indicator consists of a histogram that depicts the volatility speed and an average line that smoothes out the volatility changes.
The histogram displayed by the Volatility Speedometer represents the rate of change of volatility. Positive values indicate an increase in volatility, while negative values indicate a decrease. The height of the histogram bars represents the magnitude of the volatility change. A higher histogram bar suggests a more significant change in volatility.
Additionally, the Volatility Speedometer includes a customizable average line that smoothes out the volatility changes over the specified lookback period. This average line helps traders identify the overall trend of volatility and its direction.
To enhance the interpretation of the Volatility Speedometer, color zones are used to indicate different levels of volatility speed. These color zones are based on predefined threshold levels. For example, green may represent high volatility speed, yellow for moderate speed, and fuchsia for low speed. Traders can customize these threshold levels based on their preference and trading strategy.
By monitoring the Volatility Speedometer, traders can gain insights into changes in market volatility and adjust their trading strategies accordingly. For example, during periods of high volatility speed, traders may consider employing strategies that capitalize on price swings, while during low volatility speed, they may opt for strategies that focus on range-bound price action.
Adjusting the inputs of the Volatility Speedometer indicator can provide valuable insights and flexibility to traders. By modifying the inputs, traders can customize the indicator to suit their specific trading style and preferences.
One input that can be adjusted is the "Lookback Period." This parameter determines the number of periods considered when calculating the rate of change of volatility. Increasing the lookback period can provide a broader perspective of volatility changes over a longer time frame. This can be beneficial for swing traders or those focusing on longer-term trends. On the other hand, reducing the lookback period can provide more responsiveness to recent volatility changes, making it suitable for day traders or those looking for short-term opportunities.
Another adjustable input is the "Volatility Measure." In the provided code, the Average True Range (ATR) is used as the volatility measure. However, traders can choose other volatility indicators such as Bollinger Bands, Standard Deviation, or custom volatility measures. By experimenting with different volatility measures, traders can gain a deeper understanding of market dynamics and select the indicator that best aligns with their trading strategy.
Additionally, the "Thresholds" inputs allow traders to define specific levels of volatility speed that are considered significant. Modifying these thresholds enables traders to adapt the indicator to different market conditions and their risk tolerance. For instance, increasing the thresholds may highlight periods of extreme volatility and help identify potential breakout opportunities, while lowering the thresholds may focus on more moderate volatility shifts suitable for range trading or trend-following strategies.
Remember, it is essential to combine the Volatility Speedometer with other technical analysis tools and indicators to make informed trading decisions.

Volatility % (Standard Deviation of Returns)This script takes closing prices of candles to measure the Standard Deviation (σ) which is then used to calculate the volatility by taking the stdev of the last 30 candles and multiplying it by the root of the trading days in a year, month and week. It then multiplies that number by 100 to show a percentage.
Default settings are annual volatility (252 candles, red), monthly volatility (30 candles, blue) and weekly volatility (5 candles, green) if you use daily candles. It is open source so you can increase the number of candles with which the stdev is calculated, and change the number of the root that multiplies the stdev.

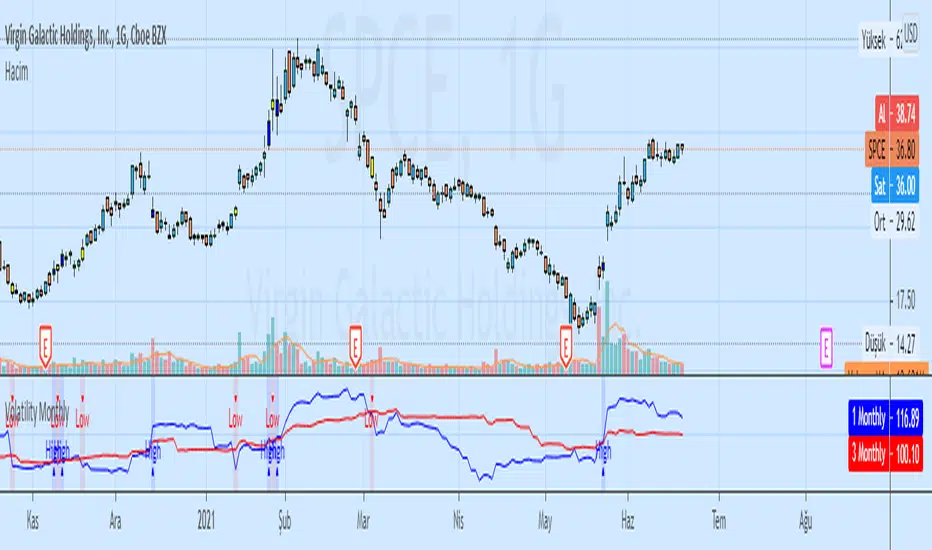
Volatility MeterThe title is quite self explanatory. It is a Volatility Meter based on Bollinger Bands Width and MA.
These parameters can be selected by users in settings tab:
- Basic Bollinger Bands Parameters: length , standart deviation and source
- Timeframes: 1h, 2h, 3h and 4h
If the indicator is red it means volatility is high in the market. If it is white , it means that market is not volatile right now.
Volatility ScreenerA screener to find easily volatile coins. The method is based on the standard deviation to the price average ratio.
Choose your target coins (coin1 to coin 15) and selected the length of observation.
By choose the minimum volatility level you can distinguish the coins with high volatility.
Change the timeframe to your desired.

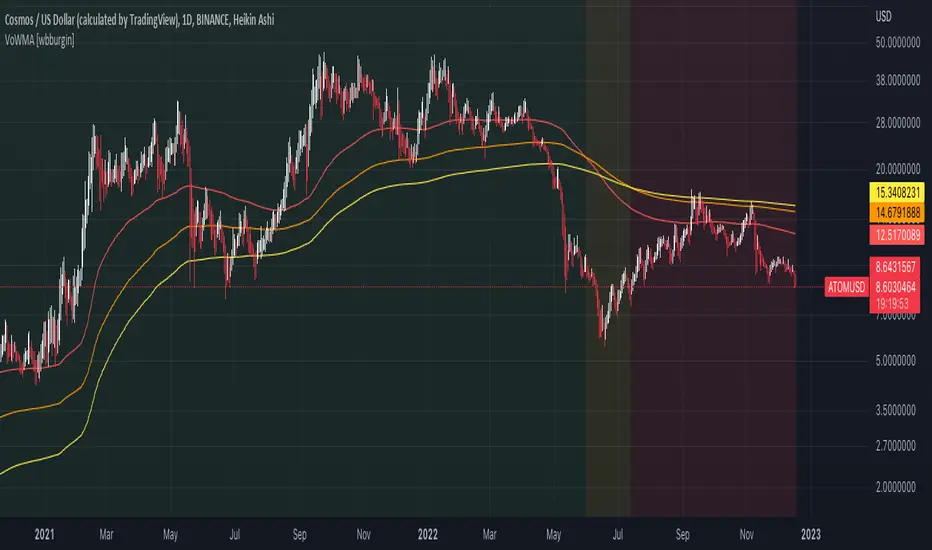
Volatility-Weighted Moving Average SystemThis simple script creates a moving average system weighted by volatility. The moving averages are less sensitive to price action than the typical moving averages we use, and their crossovers can be used to identify extended trends.
I've colored the background depending on trend. Ideally in the future, I'll draw long or short signals on-chart depending on the width between the bands, which works as a faster indicator of trend-change than crossover does.
Hope you all enjoy. Happy holidays.
Volatility Pivot Support and Resistance [Loxx]Volatility Pivot Support and Resistance calculates "pivots" (support/resistance lines) based on current symbol/timeframe Average True Range calculated volatility.
What is Average True Range?
The average true range (ATR) is a technical analysis indicator, introduced by market technician J. Welles Wilder Jr. in his book New Concepts in Technical Trading Systems, that measures market volatility by decomposing the entire range of an asset price for that period.
The true range indicator is taken as the greatest of the following: current high less the current low; the absolute value of the current high less the previous close; and the absolute value of the current low less the previous close. The ATR is then a moving average, generally using 14 days, of the true ranges.
Included:
-Bar coloring

VolatilityDivergenceRedGreen by STTAName: VolatilityDivergenceRedGreen by STTA
- Underlying and implied volatiliy normally show negative correlated behavior (price rises, vola falls and vice versa)
- This study shows symbols in on candles in chart where Undelying and corresponding vola index show same bahvior for 1,2 or 3 consecutive bars. (price rises and vola rises and vice versa)
- This situation is called Vola Divergence. Red, when prices and vola fall; green, when price and vola rise
- This information can be used to detect possible end of Up/Down-Swings.
- User can configure if rising or falling or both price movements shall be displayed.
- This study can be used with root symbols, which provide corresponding volatility indices.
- supported Root Symbols: SPX, NDQ, DJI, RUT, CL, XLE, GC, SI, EUR, HSI, FXI, EWZ, AMZN, AAPL, GS, GOOG, IBM, DEU40
- in all other symbols, no symbols are displayed.
Inputs
- underlying displayed in chart
Settings/Parameter
- each Divergence can be switched off/on separately
- output of each displayed symbol can be configured
Outputs
- RedDiv1: first bar with rising price and rising volatility index
- GreenDiv1: first bar with falling price and falling volatility index
- RedDiv2: second bar in a row with rising price and rising volatility index
- GreenDiv2: second bar with falling price and falling volatility index
- RedDiv3: third bar in a row with rising price and rising volatility index
- GreenDiv3: third bar in a row with falling price and falling volatility index

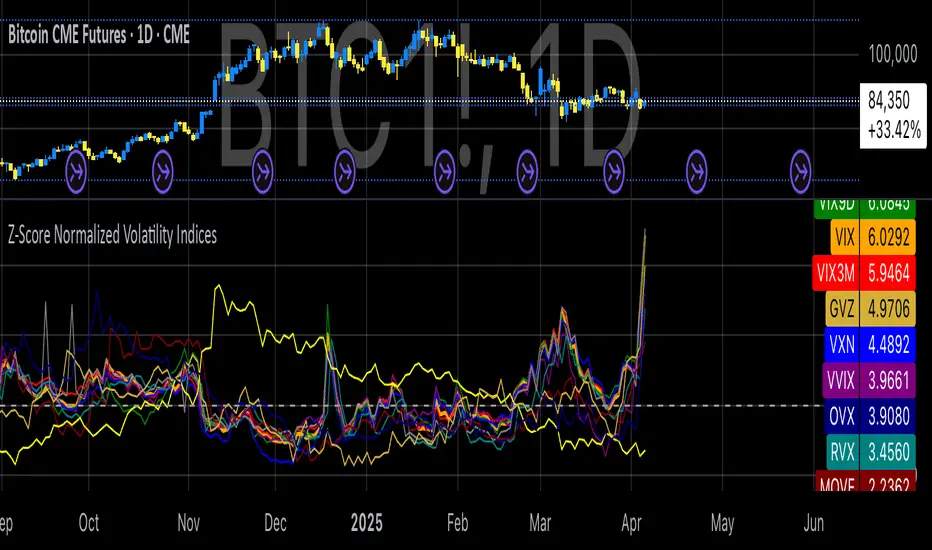
Z-Score Normalized Volatility IndicesVolatility is one of the most important measures in financial markets, reflecting the extent of variation in asset prices over time. It is commonly viewed as a risk indicator, with higher volatility signifying greater uncertainty and potential for price swings, which can affect investment decisions. Understanding volatility and its dynamics is crucial for risk management and forecasting in both traditional and alternative asset classes.
Z-Score Normalization in Volatility Analysis
The Z-score is a statistical tool that quantifies how many standard deviations a given data point is from the mean of the dataset. It is calculated as:
Z = \frac{X - \mu}{\sigma}
Where X is the value of the data point, \mu is the mean of the dataset, and \sigma is the standard deviation of the dataset. In the context of volatility indices, the Z-score allows for the normalization of these values, enabling their comparison regardless of the original scale. This is particularly useful when analyzing volatility across multiple assets or asset classes.
This script utilizes the Z-score to normalize various volatility indices:
1. VIX (CBOE Volatility Index): A widely used indicator that measures the implied volatility of S&P 500 options. It is considered a barometer of market fear and uncertainty (Whaley, 2000).
2. VIX3M: Represents the 3-month implied volatility of the S&P 500 options, providing insight into medium-term volatility expectations.
3. VIX9D: The implied volatility for a 9-day S&P 500 options contract, which reflects short-term volatility expectations.
4. VVIX: The volatility of the VIX itself, which measures the uncertainty in the expectations of future volatility.
5. VXN: The Nasdaq-100 volatility index, representing implied volatility in the Nasdaq-100 options.
6. RVX: The Russell 2000 volatility index, tracking the implied volatility of options on the Russell 2000 Index.
7. VXD: Volatility for the Dow Jones Industrial Average.
8. MOVE: The implied volatility index for U.S. Treasury bonds, offering insight into expectations for interest rate volatility.
9. BVIX: Volatility of Bitcoin options, a useful indicator for understanding the risk in the cryptocurrency market.
10. GVZ: Volatility index for gold futures, reflecting the risk perception of gold prices.
11. OVX: Measures implied volatility for crude oil futures.
Volatility Clustering and Z-Score
The concept of volatility clustering—where high volatility tends to be followed by more high volatility—is well documented in financial literature. This phenomenon is fundamental in volatility modeling and highlights the persistence of periods of heightened market uncertainty (Bollerslev, 1986).
Moreover, studies by Andersen et al. (2012) explore how implied volatility indices, like the VIX, serve as predictors for future realized volatility, underlining the relationship between expected volatility and actual market behavior. The Z-score normalization process helps in making volatility data comparable across different asset classes, enabling more effective decision-making in volatility-based strategies.
Applications in Trading and Risk Management
By using Z-score normalization, traders can more easily assess deviations from the mean in volatility, helping to identify periods when volatility is unusually high or low. This can be used to adjust risk exposure or to implement volatility-based trading strategies, such as mean reversion strategies. Research suggests that volatility mean-reversion is a reliable pattern that can be exploited for profit (Christensen & Prabhala, 1998).
References:
• Andersen, T. G., Bollerslev, T., Diebold, F. X., & Vega, C. (2012). Realized volatility and correlation dynamics: A long-run approach. Journal of Financial Economics, 104(3), 385-406.
• Bollerslev, T. (1986). Generalized autoregressive conditional heteroskedasticity. Journal of Econometrics, 31(3), 307-327.
• Christensen, B. J., & Prabhala, N. R. (1998). The relation between implied and realized volatility. Journal of Financial Economics, 50(2), 125-150.
• Whaley, R. E. (2000). Derivatives on market volatility and the VIX index. Journal of Derivatives, 8(1), 71-84.
Volatility Zones (STDEV %)This indicator displays the relative volatility of an asset as a percentage, based on the standard deviation of price over a custom length.
🔍 Key features:
• Uses standard deviation (%) to reflect recent price volatility
• Classifies volatility into three zones:
Low volatility (≤2%) — highlighted in blue
Medium volatility (2–4%) — highlighted in orange
High volatility (>4%) — highlighted in red
• Supports visual background shading and colored line output
• Works on any timeframe and asset
📊 This tool is useful for identifying low-risk entry zones, periods of expansion or contraction in price behavior, and dynamic market regime changes.
You can adjust the STDEV length to suit your strategy or timeframe. Best used in combination with your entry logic or trend filters.

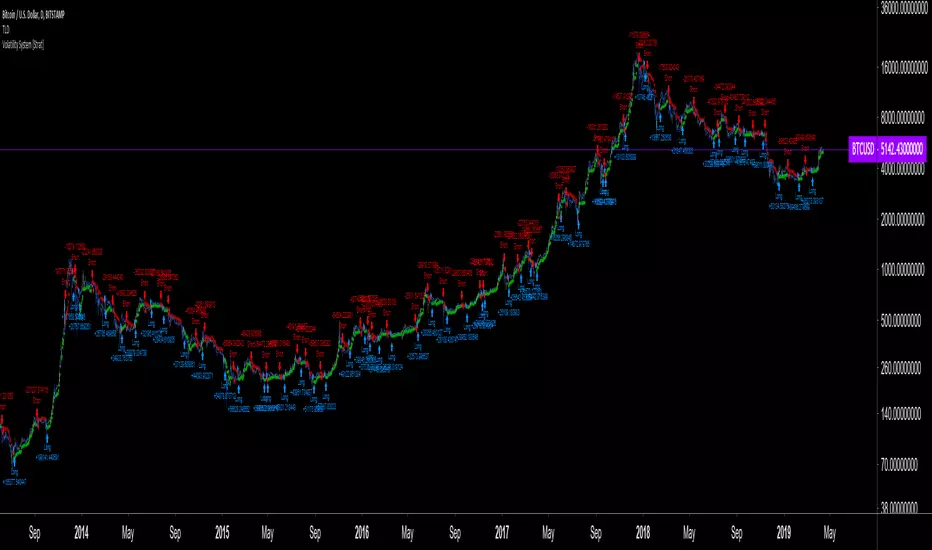
Volatility System by Wilder [LucF]The Volatility System was created by J. Welles Wilder, Jr. It first appeared in his seminal masterpiece, "New Concepts in Technical Trading Systems" (1978). He describes the system on pp.23-26, in the chapter discussing the first presentation ever of the "Volatility Index", built using a novel way of calculating a value representing volatility that he named Average True Range (ATR). The latter stuck.
The system is a pure reversal system (it is always either long or short). One of its characteristics is that its stop strategy moves up and down during a trade, widening the gap from price when volatility (ATR) increases. Because of this, this strategy can suffer large drawdowns and is not for the faint of heart.
The strategy uses a length (n) to calculate an ATR. ATR(n) is then multiplied by a factor to calculate the Average Range Constant (ARC). The ARC is then added to the lowest close n bars back to form the high Stop and Reverse points (SAR), and subtracted from the highest close n bars back to calculate the low SAR. Reversals occur when price closes above the high SAR or below the low SAR.
The system is best suited to higher time frames: 12H and above. Its performance depends heavily on calibration of the length and ARC factor. Wilder proposes a length of 7 and a factor between 2.8 to 3.1. My summary tests at 12H, 1D and 3D on stocks and cryptos yield better results with values of approximately 9-10/1.8-2.5 for cryptos and 9-10/3.0-4.0 for stocks. Small changes in the values will sometimes yield large variations in results, which I don’t particularly like because it tends to imply fragility, whereas I’d expect more robustness from a system with such simple rules. Additionally, backtests at 1D on cryptos provide so little data that no solid conclusions can be drawn from them.
All in all, the system is not very useful in my opinion; I publish it more for completeness, since as far as I can tell, it did not exist on this platform before. I also publish it out of respect for Wilder’s work. His book laid the foundation for many of the building blocks used by system designers, even today. In less than a hundred pages he presented RSI, ATR, DMI, ADXR and the Parabolic SAR indicators, some of which have become built-in functions in programming languages. This is a colossal feat and has not been repeated. Wilder is a monument.
Some lesser-known facts about his book:
It sells for the exact same price it cost in 1978: 65$,
The book has always been published by Wilder himself,
The layout hasn’t changed in 40 years,
He sells >35K copies/year.
Gotta love the guy.
The strategy is shown here on BTC /USD with settings of 12/1.8 (the defaults are 9/1.8). It shows the system under its best light. Other markets will most not reproduce such results. Also, the drawdown is as scary as the results are impressive.
Features
The code is written as a strategy but can easily be converted to an indicator if you want to use the alerts it can produce. Instructions are in the code.
You can change the length and ARC factor.
You can choose to trade only long or short positions.
You can choose to display the SARs (the stops) in multiple ways.
You can show trigger markers.
A date range can be defined.
3 alerts: reversals (both long and short), longs, shorts. Remember that for the moment, strategies cannot generate alerts in TradingView, so the strategy must be converted to an indicator in order to make the alerts available.
Volatility Compression BreakoutThe Volatility Compression Breakout indicator is designed to identify periods of low volatility followed by potential breakout opportunities in the market. It aims to capture moments when the price consolidates within a narrow range, indicating a decrease in volatility, and anticipates a subsequent expansion in price movement. This indicator can be applied to any financial instrument and timeframe.
When the close price is above both the Keltner Middle line and the Exponential Moving Average (EMA), the bars are colored lime green, indicating a potential bullish market sentiment. When the close price is positioned above the Keltner Middle but below the EMA, or below the Keltner Middle but above the EMA, the bars are colored yellow, signifying a neutral or indecisive market condition. Conversely, when the close price falls below both the Keltner Middle and the EMA, the bars are colored fuchsia, suggesting a potential bearish market sentiment.
Additionally, the coloration of the Keltner Middle line and the EMA provides further visual cues for assessing the trend. When the close price is above the Keltner Middle, the line is colored lime green, indicating a bullish trend. Conversely, when the close price is below the Keltner Middle, the line is colored fuchsia, highlighting a bearish trend. Similarly, the EMA line is colored lime green when the close price is above it, representing a bullish trend, and fuchsia when the close price is below it, indicating a bearish trend.
Parameters
-- Compression Period : This parameter determines the lookback period used to calculate the volatility compression. A larger value will consider a longer historical period for volatility analysis, potentially capturing broader market conditions. Conversely, a smaller value focuses on more recent price action, providing a more responsive signal to current market conditions.
-- Compression Multiplier : The compression multiplier is a factor applied to the Average True Range (ATR) to determine the width of the Keltner Channels. Increasing the multiplier expands the width of the channels, allowing for a larger price range before a breakout is triggered. Decreasing the multiplier tightens the channels and requires a narrower price range for a breakout signal.
-- EMA Period : This parameter sets the period for the Exponential Moving Average (EMA), which acts as a trend filter. The EMA helps identify the overall market trend and provides additional confirmation for potential breakouts. Adjusting the period allows you to capture shorter or longer-term trends, depending on your trading preferences.
How Changing Parameters Can Be Beneficial
Modifying the parameters allows you to adapt the indicator to different market conditions and trading styles. Increasing the compression period can help identify broader volatility patterns and major market shifts. On the other hand, decreasing the compression period provides more precise and timely signals for short-term traders.
Adjusting the compression multiplier affects the width of the Keltner Channels. Higher multipliers increase the breakout threshold, filtering out smaller price movements and providing more reliable signals during significant market shifts. Lower multipliers make the indicator more sensitive to smaller price ranges, generating more frequent but potentially less reliable signals.
The EMA period in the trend filter helps you align your trades with the prevailing market direction. Increasing the EMA period smoothes out the trend, filtering out shorter-term fluctuations and focusing on more sustained moves. Decreasing the EMA period allows for quicker responses to changes in trend, capturing shorter-term price swings.
Potential Downsides
While the Volatility Compression Breakout indicator can provide valuable insights into potential breakouts, it's important to note that no indicator guarantees accuracy or eliminates risk. False breakouts and whipsaw movements can occur, especially in volatile or choppy market conditions. It is recommended to combine this indicator with other technical analysis tools and consider fundamental factors to validate potential trade opportunities.
Making It Work for You
To maximize the effectiveness of the Volatility Compression Breakout indicator, consider the following:
-- Combine it with other indicators : Use complementary indicators such as trend lines, oscillators, or support and resistance levels to confirm signals and increase the probability of successful trades.
-- Practice risk management : Set appropriate stop-loss levels to protect your capital in case of false breakouts or adverse price movements. Consider implementing trailing stops or adjusting stop-loss levels as the trade progresses.
-- Validate with price action : Analyze the price action within the compression phase and look for signs of building momentum or weakening trends. Support your decisions by observing candlestick patterns and volume behavior during the breakout.
-- Backtest and optimize : Test the indicator's performance across different timeframes and market conditions. Optimize the parameters based on historical data to find the most suitable settings for your trading strategy.
Remember, no single indicator can guarantee consistent profitability, and it's essential to use the Volatility Compression Breakout indicator as part of a comprehensive trading plan. Regularly review and adapt your strategy based on market conditions and your trading experience. Monitor the indicator's performance and make necessary adjustments to parameter values if the market dynamics change.
By adjusting the parameters and incorporating additional analysis techniques, you can customize the indicator to suit your trading style and preferences. However, it is crucial to exercise caution, conduct thorough analysis, and practice proper risk management to increase the likelihood of successful trades. Remember that no indicator can guarantee profits, and continuous learning and adaptation are key to long-term trading success.

Volatility IndicatorThe volatility indicator presented here is based on multiple volatility indices that reflect the market’s expectation of future price fluctuations across different asset classes, including equities, commodities, and currencies. These indices serve as valuable tools for traders and analysts seeking to anticipate potential market movements, as volatility is a key factor influencing asset prices and market dynamics (Bollerslev, 1986).
Volatility, defined as the magnitude of price changes, is often regarded as a measure of market uncertainty or risk. Financial markets exhibit periods of heightened volatility that may precede significant price movements, whether upward or downward (Christoffersen, 1998). The indicator presented in this script tracks several key volatility indices, including the VIX (S&P 500), GVZ (Gold), OVX (Crude Oil), and others, to help identify periods of increased uncertainty that could signal potential market turning points.
Volatility Indices and Their Relevance
Volatility indices like the VIX are considered “fear gauges” as they reflect the market’s expectation of future volatility derived from the pricing of options. A rising VIX typically signals increasing investor uncertainty and fear, which often precedes market corrections or significant price movements. In contrast, a falling VIX may suggest complacency or confidence in continued market stability (Whaley, 2000).
The other volatility indices incorporated in the indicator script, such as the GVZ (Gold Volatility Index) and OVX (Oil Volatility Index), capture the market’s perception of volatility in specific asset classes. For instance, GVZ reflects market expectations for volatility in the gold market, which can be influenced by factors such as geopolitical instability, inflation expectations, and changes in investor sentiment toward safe-haven assets. Similarly, OVX tracks the implied volatility of crude oil options, which is a crucial factor for predicting price movements in energy markets, often driven by geopolitical events, OPEC decisions, and supply-demand imbalances (Pindyck, 2004).
Using the Indicator to Identify Market Movements
The volatility indicator alerts traders when specific volatility indices exceed a defined threshold, which may signal a change in market sentiment or an upcoming price movement. These thresholds, set by the user, are typically based on historical levels of volatility that have preceded significant market changes. When a volatility index exceeds this threshold, it suggests that market participants expect greater uncertainty, which often correlates with increased price volatility and the possibility of a trend reversal.
For example, if the VIX exceeds a pre-determined level (e.g., 30), it could indicate that investors are anticipating heightened volatility in the equity markets, potentially signaling a downturn or correction in the broader market. On the other hand, if the OVX rises significantly, it could point to an upcoming sharp movement in crude oil prices, driven by changing market expectations about supply, demand, or geopolitical risks (Geman, 2005).
Practical Application
To effectively use this volatility indicator in market analysis, traders should monitor the alert signals generated when any of the volatility indices surpass their thresholds. This can be used to identify periods of market uncertainty or potential market turning points across different sectors, including equities, commodities, and currencies. The indicator can help traders prepare for increased price movements, adjust their risk management strategies, or even take advantage of anticipated price swings through options trading or volatility-based strategies (Black & Scholes, 1973).
Traders may also use this indicator in conjunction with other technical analysis tools to validate the potential for significant market movements. For example, if the VIX exceeds its threshold and the market is simultaneously approaching a critical technical support or resistance level, the trader might consider entering a position that capitalizes on the anticipated price breakout or reversal.
Conclusion
This volatility indicator is a robust tool for identifying market conditions that are conducive to significant price movements. By tracking the behavior of key volatility indices, traders can gain insights into the market’s expectations of future price fluctuations, enabling them to make more informed decisions regarding market entries and exits. Understanding and monitoring volatility can be particularly valuable during times of heightened uncertainty, as changes in volatility often precede substantial shifts in market direction (French et al., 1987).
References
• Bollerslev, T. (1986). Generalized Autoregressive Conditional Heteroskedasticity. Journal of Econometrics, 31(3), 307-327.
• Christoffersen, P. F. (1998). Evaluating Interval Forecasts. International Economic Review, 39(4), 841-862.
• Whaley, R. E. (2000). Derivatives on Market Volatility. Journal of Derivatives, 7(4), 71-82.
• Pindyck, R. S. (2004). Volatility and the Pricing of Commodity Derivatives. Journal of Futures Markets, 24(11), 973-987.
• Geman, H. (2005). Commodities and Commodity Derivatives: Modeling and Pricing for Agriculturals, Metals and Energy. John Wiley & Sons.
• Black, F., & Scholes, M. (1973). The Pricing of Options and Corporate Liabilities. Journal of Political Economy, 81(3), 637-654.
• French, K. R., Schwert, G. W., & Stambaugh, R. F. (1987). Expected Stock Returns and Volatility. Journal of Financial Economics, 19(1), 3-29.
