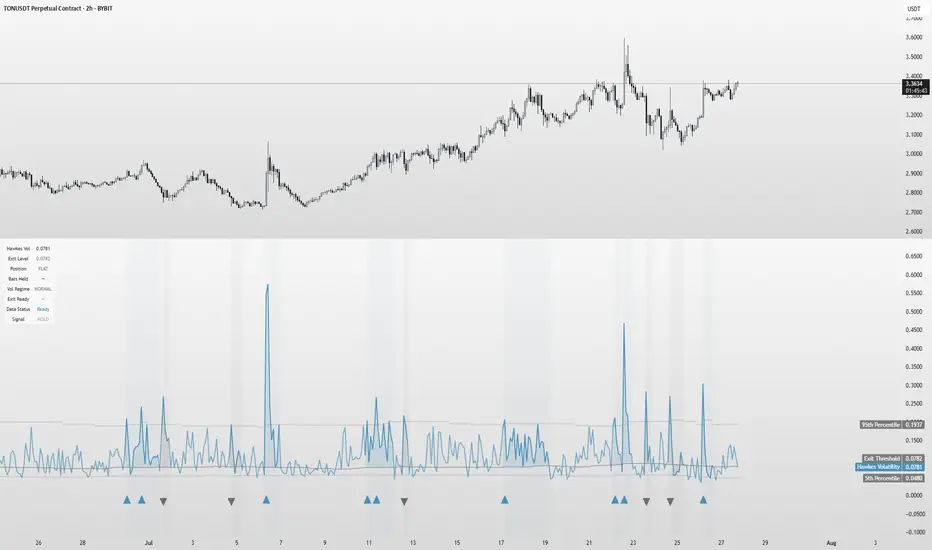
Hawkes Volatility Exit IndicatorOverview
The Hawkes Volatility Exit Indicator is a powerful tool designed to help traders capitalize on volatility breakouts and exit positions when momentum fades. Built on the Hawkes process, it models volatility clustering to identify optimal entry points after quiet periods and exit signals during volatility cooling. Designed to be helpful for swing traders and trend followers across markets like stocks, forex, and crypto.
Key Features Volatility-Based Entries: Detects breakouts when volatility spikes above the 95th percentile (adjustable) after quiet periods (below 5th percentile).
This indicator is probably better on exits than entries.
Smart Exit Signals: Triggers exits when volatility drops below a customizable threshold (default: 30th percentile) after a minimum hold period.
Hawkes Process: Uses a decay-based model (kappa) to capture volatility clustering, making it responsive to market dynamics.
Visual Clarity: Includes a volatility line, exit threshold, percentile bands, and intuitive markers (triangles for entries, X for exits).
Status Table: Displays real-time data on position (LONG/SHORT/FLAT), volatility regime (HIGH/LOW/NORMAL), bars held, and exit readiness.
Customizable Alerts: Set alerts for breakouts and exits to stay on top of trading opportunities.
How It Works Quiet Periods: Identifies low volatility (below 5th percentile) that often precede significant moves.
Breakout Entries: Signals bullish (triangle up) or bearish (triangle down) entries when volatility spikes post-quiet period.
Exit Signals: Suggests exiting when volatility cools below the exit threshold after a minimum hold (default: 3 bars).
Visuals & Table: Tracks volatility, position status, and signals via lines, shaded zones, and a detailed status table.
Settings
Hawkes Kappa (0.1): Adjusts volatility decay (lower = smoother, higher = more sensitive).
Volatility Lookback (168): Sets the period for percentile calculations.
ATR Periods (14): Normalizes volatility using Average True Range.
Breakout Threshold (95%): Volatility percentile for entries.
Exit Threshold (30%): Volatility percentile for exits.
Quiet Threshold (5%): Defines quiet periods.
Minimum Hold Bars (3): Ensures positions are held before exiting.
Alerts: Enable/disable breakout and exit alerts.
How to Use
Entries: Look for triangle markers (up for long, down for short) and confirm with the status table showing "ENTRY" and "LONG"/"SHORT."
Exits: Exit on X cross markers when the status table shows "EXIT" and "Exit Ready: YES."
Monitoring: Use the status table to track position, bars held, and volatility regime (HIGH/LOW/NORMAL).
Combine: Pair with price action, support/resistance, or other indicators for better context.
Tips : Adjust thresholds for your market: lower breakout thresholds for more signals, higher exit thresholds for earlier exits.
Test on your asset to ensure compatibility (best for markets with volatility clustering).
Use alerts to automate signal detection.
Limitations Requires sufficient data (default: 168 bars) for reliable signals. Check "Data Status" in the table.
Focuses on volatility, not price direction—combine with trend tools.
May lag slightly due to the smoothing nature of the Hawkes process.
Why Use It?
The Hawkes Volatility Exit Indicator offers a unique, data-driven approach to timing trades based on volatility dynamics. Its clear visuals, customizable settings, and real-time status table make it a valuable addition to any trader’s toolkit. Try it to catch breakouts and exit with precision!
This indicator is based on neurotrader888's python repo. All credit to him. All mistakes mine.
This conversion published for wider attention to the Hawkes method.
Cari dalam skrip untuk "Volatility"
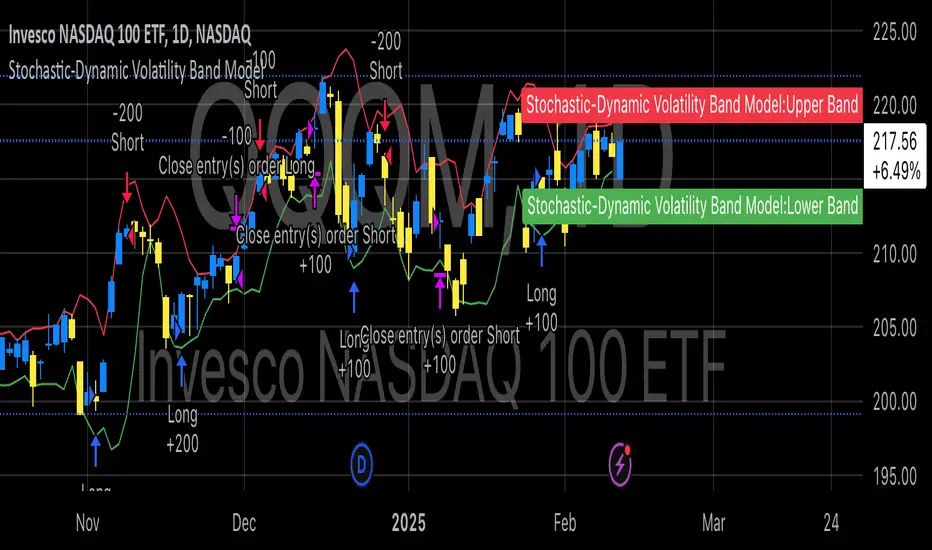
Stochastic-Dynamic Volatility Band ModelThe Stochastic-Dynamic Volatility Band Model is a quantitative trading approach that leverages statistical principles to model market volatility and generate buy and sell signals. The strategy is grounded in the concepts of volatility estimation and dynamic market regimes, where the core idea is to capture price fluctuations through stochastic models and trade around volatility bands.
Volatility Estimation and Band Construction
The volatility bands are constructed using a combination of historical price data and statistical measures, primarily the standard deviation (σ) of price returns, which quantifies the degree of variation in price movements over a specific period. This methodology is based on the classical works of Black-Scholes (1973), which laid the foundation for using volatility as a core component in financial models. Volatility is a crucial determinant of asset pricing and risk, and it plays a pivotal role in this strategy's design.
Entry and Exit Conditions
The entry conditions are based on the price’s relationship with the volatility bands. A long entry is triggered when the price crosses above the lower volatility band, indicating that the market may have been oversold or is experiencing a reversal to the upside. Conversely, a short entry is triggered when the price crosses below the upper volatility band, suggesting overbought conditions or a potential market downturn.
These entry signals are consistent with the mean reversion theory, which asserts that asset prices tend to revert to their long-term average after deviating from it. According to Poterba and Summers (1988), mean reversion occurs due to overreaction to news or temporary disturbances, leading to price corrections.
The exit condition is based on the number of bars that have elapsed since the entry signal. Specifically, positions are closed after a predefined number of bars, typically set to seven bars, reflecting a short-term trading horizon. This exit mechanism is in line with short-term momentum trading strategies discussed in literature, where traders capitalize on price movements within specific timeframes (Jegadeesh & Titman, 1993).
Market Adaptability
One of the key features of this strategy is its dynamic nature, as it adapts to the changing volatility environment. The volatility bands automatically adjust to market conditions, expanding in periods of high volatility and contracting when volatility decreases. This dynamic adjustment helps the strategy remain robust across different market regimes, as it is capable of identifying both trend-following and mean-reverting opportunities.
This dynamic adaptability is supported by the adaptive market hypothesis (Lo, 2004), which posits that market participants evolve their strategies in response to changing market conditions, akin to the adaptive nature of biological systems.
References:
Black, F., & Scholes, M. (1973). The Pricing of Options and Corporate Liabilities. Journal of Political Economy, 81(3), 637-654.
Bollinger, J. (1980). Bollinger on Bollinger Bands. Wiley.
Jegadeesh, N., & Titman, S. (1993). Returns to Buying Winners and Selling Losers: Implications for Stock Market Efficiency. Journal of Finance, 48(1), 65-91.
Lo, A. W. (2004). The Adaptive Markets Hypothesis: Market Efficiency from an Evolutionary Perspective. Journal of Portfolio Management, 30(5), 15-29.
Poterba, J. M., & Summers, L. H. (1988). Mean Reversion in Stock Prices: Evidence and Implications. Journal of Financial Economics, 22(1), 27-59.
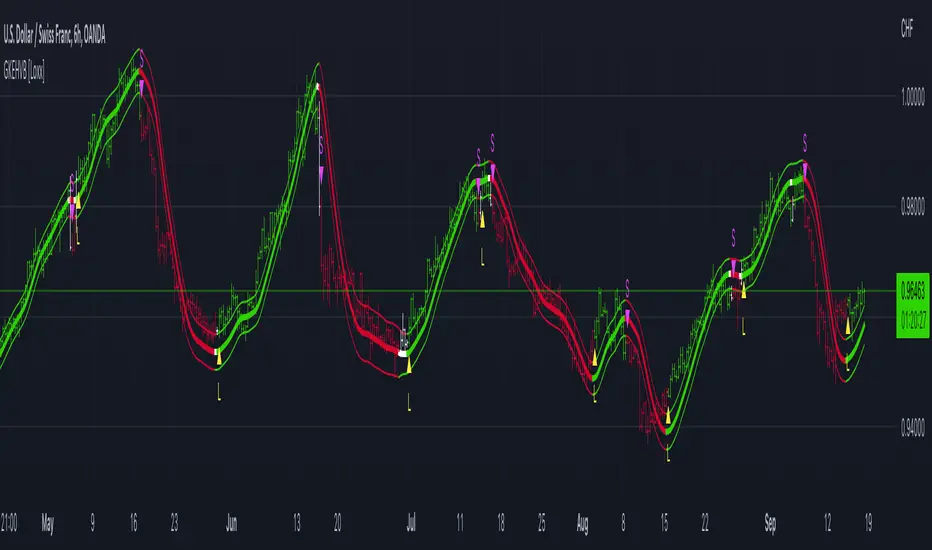
EMA Volatility Channel [QuantAlgo]EMA Volatility Channel 🌊📈
The EMA Volatility Channel by QuantAlgo is an advanced technical indicator designed to capture price volatility and trend dynamics through adaptive channels based on exponential moving averages. This sophisticated system combines EMA-based trend analysis with dynamic volatility-adjusted bands to help traders and investors identify trend direction, potential reversals, and market volatility conditions. By evaluating both price momentum and volatility together, this tool enables users to make informed trading decisions while adapting to changing market conditions.
💫 Dynamic Channel Architecture
The EMA Volatility Channel provides a unique framework for assessing market trends through a blend of exponential moving averages and volatility-based channel calculations. Unlike traditional channel indicators that use fixed-width bands, this system incorporates dynamic volatility measurements to adjust channel width automatically, helping users determine whether price movements are significant relative to current market conditions. By combining smooth EMA trends with adaptive volatility bands, it evaluates both directional movement and market volatility, while the smoothing parameters ensure stable yet responsive channel adjustments. This adaptive approach allows users to identify trending conditions while remaining aware of volatility expansions and contractions, enhancing both trend-following and reversal strategies.
📊 Indicator Components & Mechanics
The EMA Volatility Channel is composed of several technical components that create a dynamic channel system:
EMA Midline: Calculates a smoothed exponential moving average that serves as the channel's centerline, providing a clear reference for trend direction.
Volatility Measurement: Computes average price movement to determine dynamic channel width, adapting to changing market conditions automatically.
Smooth Band Calculation: Applies additional smoothing to the channel bands, reducing noise while maintaining responsiveness to significant price movements.
📈 Key Indicators and Features
The EMA Volatility Channel combines various technical tools to deliver a comprehensive analysis of market conditions.
The indicator utilizes exponential moving averages with customizable length and smoothing parameters to adapt to different trading styles. Volatility calculations are applied to determine channel width, providing context-aware boundaries for price movement. The trend detection component evaluates price action relative to the channel bands, helping validate trends and identify potential reversals.
The indicator incorporates multi-layered visualization with color-coded channels and bars to signal both trend direction and market position. These adaptive visual cues, combined with programmable alerts for channel breakouts, help traders and investors track both trend changes and volatility conditions, supporting both trend-following and mean-reversion strategies.
⚡️ Practical Applications and Examples
✅ Add the Indicator: Add the indicator to your TradingView chart by clicking on the star icon to add it to your favorites ⭐️
👀 Monitor Channel Position: Watch the price position relative to the channel bands to identify trend direction and potential reversals. When price moves outside the channel, consider potential trend changes or extreme conditions.
🔔 Set Alerts: Configure alerts for channel breakouts and trend changes, ensuring you can act on significant technical developments promptly.
🌟 Summary and Tips
The EMA Volatility Channel by QuantAlgo is a versatile technical tool, designed to support both trend following and volatility analysis across different market environments. By combining smooth EMA trends with dynamic volatility-based channels, it helps traders and investors identify significant price movements while measuring market volatility, providing reliable technical signals. The tool's adaptability across timeframes makes it suitable for both trend-following and reversal strategies, allowing users to capture opportunities while maintaining awareness of changing market conditions.

Low Volatility Range Breaks [BigBeluga]Low Volatility Range Breaks
The Low Volatility Range Breaks indicator is an advanced technical analysis tool designed to identify periods of low volatility and potential breakout opportunities. By visualizing low volatility ranges as ranges and tracking subsequent price movements, this indicator helps traders spot potential high-probability trade setups.
🔵 KEY FEATURES
● Low Volatility Detection
Identifies periods of low volatility based on highest and lowest periods and user-defined sensitivity
Uses a combination of highest/lowest price calculations and ATR for dynamic adaptation
● Volatility Box Visualization
Creates a box to represent the low volatility range
Box height is adjustable based on ATR multiplier
Includes a mid-line for reference within the box
● Breakout Detection
Identifies when price breaks above or below the volatility box
Labels breakouts as "Break Up" or "Break Dn" on the chart
Changes box appearance to indicate a completed breakout
● Probability Tracking
Counts the number of closes above and below the box's mid-line
Displays probability counters for potential upward and downward moves
Resets counters after a confirmed breakout
🔵 HOW TO USE
● Identifying Low Volatility Periods
Watch for the formation of volatility boxes on the chart
These boxes represent periods where price movement has been confined
● Anticipating Breakouts
Monitor price action as it approaches the edges of the volatility box
Use the probability counters to gauge the likely direction of the breakout
● Trading Breakouts
Consider posible entering trades when price breaks above or below the volatility box
Use the breakout labels ("Break Up" or "Break Dn") as a trading opportunity
● Managing Risk
Use the opposite side of the volatility box as a potential invalidation level
Consider the box height for position sizing and risk management
● Trend Analysis
Multiple upward breakouts may indicate a developing uptrend
Multiple downward breakouts may suggest a forming downtrend
Use in conjunction with other trend indicators for confirmation
🔵 CUSTOMIZATION
The Low Volatility Box Breaks indicator offers several customization options:
Adjust the volatility length to change the period for highest/lowest price calculations
Modify the volatility level to fine-tune the sensitivity of low volatility detection
Adjust the box height multiplier to change the size of volatility boxes
By fine-tuning these settings, traders can adapt the indicator to various market conditions and personal trading strategies.
The Low Volatility Range Breaks indicator provides a unique approach to identifying potential breakout opportunities following periods of consolidation. By visually representing low volatility periods and tracking subsequent price movements, it offers traders a powerful tool for spotting high-probability trade setups.
This indicator can be particularly useful for traders focusing on breakout strategies, mean reversion tactics, or those looking to enter trades at the beginning of new trends. The combination of visual cues (boxes and breakout labels) and quantitative data (probability counters) provides a comprehensive view of market dynamics during and after low volatility periods.
As with all technical indicators, it's recommended to use the Low Volatility Range Breaks indicator in conjunction with other forms of analysis and within the context of a well-defined trading strategy. While this indicator can provide valuable insights into potential breakouts, it should be considered alongside other factors such as overall market trends, volume, and fundamental analysis when making trading decisions.

Keltner Channel Volatility FilterOVERVIEW
The Keltner Channel Volatility Filter indicator is a technical indicator that gauges the amount of volatility currently present in the market. The purpose of this indicator is to filter out with-trend signals during ranging/non-trending/consolidating conditions.
CONCEPTS
This indicator assists traders in capitalizing on the assumption that trends are more likely to start during periods of high volatility compared to periods of low volatility . This is because high volatility indicates that there are bigger players currently in the market, which is necessary to begin a sustained trending move.
So, to determine whether the current volatility in the market is low, the KCVF will grey out all bars whose average price is within the Keltner Channels.
If the average price breaks out of the Keltner Channels , it is reasonable to assume we are in a high-volatility period. Thus, this is the ideal time to enter a trending trade due to the assumption that trends are more likely to start during these high-volatility periods.
HOW DO I READ THIS INDICATOR
When the candles are greyed out, don't take any trend trades since the current volatility is less than the usual volatility experienced in the market.
When the candles aren't greyed out, take all valid with-trend trades since the current volatility is greater than the usual volatility experienced in the market.

Garman & Klass Estimator Historical Volatility Bands [Loxx]Garman & Klass Estimator Historical Volatility Bands are constructed using:
Average as the middle line.
Upper and lower bands using the Garman & Klass Estimator Historical Volatility (instead of "regular" Historical Volatility ) for bands calculation.
What is Garman & Klaus Historical Volatility?
Garman Klass is a volatility estimator that incorporates open, low, high, and close prices of a security. The Garman and Klass estimator for estimating historical volatility assumes Brownian motion with zero drift and no opening jumps (i.e. the opening = close of the previous period). This estimator is 7.4 times more efficient than the close-to-close estimator. Garman-Klass volatility extends Parkinson's volatility by taking into account the opening and closing price. As markets are most active during the opening and closing of a trading session, it makes volatility estimation more accurate. Garman and Klass also assumed that the process of price change is a process of continuous diffusion (geometric Brownian motion). However, this assumption has several drawbacks. The method is not robust for opening jumps in price and trend movements. Despite its drawbacks, the Garman-Klass estimator is still more effective than the basic formula since it takes into account not only the price at the beginning and end of the time interval but also intraday price extremums.
The Garman & Klass Estimator is as follows:
GKE = sqrt((Z/n)* sum((0.5*(log(high./low)).^2) - (2*log(2) - 1).*(log(close./open)).^2))
The color of the middle line, unlike the bands colors, has 3 colors. When colors of the bands are the same, then the middle line has the same color, otherwise it's white.
Included
Alerts
Signals
Loxx's Expanded Source Types
Bar coloring
Related indicators:
Parkinson's Historical Volatility Bands
High/Low Historical Volatility Bands [Loxx]High/Low Historical Volatility Bands are constructed using:
Average as the middle line.
Upper and lower bands using the Historical Volatility high/low (instead of "regular" Historical Volatility) for bands calculation.
What is Historical Volatility?
Historical Volatility (HV) is a statistical measure of the dispersion of returns for a given security or market index over a given period of time. Generally, this measure is calculated by determining the average deviation from the average price of a financial instrument in the given time period. Using standard deviation is the most common, but not the only, way to calculate Historical Volatility .
The higher the Historical Volatility value, the riskier the security. However, that is not necessarily a bad result as risk works both ways - bullish and bearish , i.e: Historical Volatility is not a directional indicator and should not be used as other directional indicators are used. Use to to determine the rising and falling price change volatility .
SH is stock's High price in t day.
SL is stock's Low price in t day.
High/Low Return (xt^HL) is calculated as the natural logarithm of the ratio of a stock's High price to stock's Low price.
Return:
And Parkinson's number: 1 / (4 * math.log(2)) * 252 / n * Σ (n, t =1) {math.log(Ht/Lt)^2}
An important use of the Parkinson's number is the assessment of the distribution prices during the day as well as a better understanding of the market dynamics. Comparing the Parkinson's number and periodically sampled volatility helps traders understand the tendency towards mean reversion in the market as well as the distribution of stop-losses.
The color of the middle line, unlike the bands colors, has 3 colors. When colors of the bands are the same, then the middle line has the same color, otherwise it's white.
Included
Alerts
Signals
Loxx's Expanded Source Types
Bar coloring
Related indicators:
Parkinson's Historical Volatility Bands
Historical Volatility Bands

Williams Volatility Channel (Full Range Breakout)Overview
This indicator implements a volatility breakout system inspired by legendary trader Larry Williams. It plots daily breakout levels calculated as the previous day’s close ± the full previous day’s range (high – low). These levels act as extreme volatility expansion thresholds:
- Upper Level: Previous close + previous day’s range
- Lower Level: Previous close – previous day’s range
A price move beyond these levels signals a strong directional breakout driven by expanded volatility — a classic Larry Williams concept for identifying potential trend continuation or acceleration days.
This version uses the full prior range (multiplier = 1.0), making it more aggressive than Williams’ original examples (which often used smaller fractions like 0.25–0.5 × range). It is particularly useful on instruments with clear daily sessions and visible overnight gaps or volatility spikes.
Key Features
Daily breakout levels plotted as horizontal lines that update at the start of each new trading day.
Optional semi-transparent fill between upper and lower levels for better visual channel perception.
Subtle background shading on the first bar of each new day and new week for easier time orientation.
Configurable colors and visibility toggles.
Generic session duration input (informational only) to help estimate candles per day on non-standard markets (e.g., European indices ≈ 8.5h, US stocks ≈ 6.5h, crypto ≈ 24h).
How to Use the Indicator
Breakout Signals
Bullish Breakout: Price closes or sustains above the Upper Level → potential strong upward momentum. Consider long entries or adding to existing longs.
Bearish Breakout: Price closes or sustains below the Lower Level → potential strong downward momentum. Consider short entries or adding to existing shorts.
These breakouts often occur on news events, earnings, or when the market “wakes up” after low-volatility periods.
Trend Confirmation
Use the direction of the breakout to confirm the prevailing trend: In an uptrend, focus primarily on upside breakouts.
In a downtrend, focus primarily on downside breakouts.
Breakouts against the trend can signal potential reversals (use with caution and additional confirmation).
Support & Resistance
Once price has broken a level, that level often flips role: A broken Upper Level can act as support on pullbacks.
A broken Lower Level can act as resistance on bounces.
Risk Management
Place stops beyond the opposite level or use ATR-based stops.
Consider partial profit-taking at 1× or 2× the prior day’s range from entry.
Best Markets & Timeframes
Works well on: Stock indices (DAX, FTSE MIB, CAC, S&P 500 futures, etc.)
Individual stocks
Commodities and futures with defined daily sessions
Cryptocurrencies (adjust session hours to 24 for continuous markets)
Recommended intraday timeframes: 5–60 minutes. On higher timeframes (4H, daily), the levels still appear but are less frequently tested intraday.
Important Notes
This is a trend-following / momentum tool, not a mean-reversion or gap-fading strategy (unlike Larry Williams’ famous “OOPS” pattern).
False breakouts can occur in low-volatility or ranging markets — always use additional confluence (volume, trend filters, higher-timeframe context).
The session duration input is informational and allows definition of how many candles per day should be used in the calculation.
This indicator provides a clean, visually intuitive way to spot high-volatility breakout opportunities based on one of Larry Williams’ timeless volatility concepts. Add it to your charts and combine it with your existing trading system for enhanced entry timing on strong momentum days.

GARCH Adaptive Volatility & Momentum Predictor
💡 I. Indicator Concept: GARCH Adaptive Volatility & Momentum Predictor
-----------------------------------------------------------------------------
The GARCH Adaptive Momentum Speed indicator provides a powerful, forward-looking
view on market risk and momentum. Unlike standard moving averages or static
volatility indicators (like ATR), GARCH forecasts the Conditional Volatility (σ_t)
for the next bar, based on the principle of volatility clustering.
The indicator consists of two essential components:
1. GARCH Volatility (Level): The primary forecast of the expected magnitude of
price movement (risk).
2. Vol. Speed (Momentum): The first derivative of the GARCH forecast, showing
whether market risk is accelerating or decelerating. This component is the
main visual signal, displayed as a dynamic histogram.
⚙️ II. Key Features and Adaptive Logic
-----------------------------------------------------------------------------
* Dynamic Coefficient Adaptation: The indicator automatically adjusts the GARCH
coefficients (α and β) based on the chart's timeframe (TF):
- Intraday TFs (M1-H4): Uses higher α and lower β for quicker reaction
to recent shocks.
- Daily/Weekly TFs (D, W): Uses lower α and higher β for a smoother,
more persistent long-term forecast.
* Momentum Visualization: The Vol. Speed component is plotted as a dynamic
histogram (fill) that automatically changes color based on the direction of
acceleration (Green for up, Red for down).
📊 III. Interpretation Guide
-----------------------------------------------------------------------------
- GARCH Volatility (Blue Line): The predicted level of market risk. Use this to
gauge overall position sizing and stop loss width.
- Vol. Speed (Green Histogram): Momentum is ACCELERATING (Risk is increasing rapidly).
A strong signal that momentum is building, often preceding a breakout.
- Vol. Speed (Red Histogram): Momentum is DECELERATING (Risk is contracting).
Indicates momentum is fading, often associated with market consolidation.
🎯 IV. Trading Application
-----------------------------------------------------------------------------
- Breakout Timing: Look for a strong, high GREEN histogram bar. This suggests
the volatility pressure is increasing rapidly, and a breakout may be imminent.
- Consolidation: Small, shrinking RED histogram bars signal that market energy
is draining, ideal for tight consolidation patterns.

Disparity Index with Volatility ZonesDisparity Index with Volatility Zones
is a momentum oscillator that measures the percentage difference between the current price and its simple moving average (SMA). This allows traders to identify overbought/oversold conditions, assess momentum strength, and detect potential trend reversals or continuations.
🔍 Core Concept:
The Disparity Index (DI) is calculated as:
DI = 100 × (Price − SMA) / SMA
A positive DI indicates the price is trading above its moving average (potential bullish sentiment), while a negative DI suggests the price is below the average (potential bearish sentiment).
This version of the Disparity Index introduces a dual-zone volatility framework, offering deeper insight into the market's current state.
🧠 What Makes This Version Unique?
1. High Volatility Zones
When DI crosses above +1.0% or below –1.0%, it often indicates the start or continuation of a strong trend.
Sustained readings beyond these thresholds typically align with trending phases, offering opportunities for momentum-based entries.
A reversal back within ±1.0% after exceeding these levels can suggest a shift in momentum — similar to how RSI exits the overbought/oversold zones before reversals.
These thresholds act as dynamic markers for breakout confirmation and potential trend exhaustion.
2. Low Volatility Zones
DI values between –0.5% and +0.5% define the low-volatility zone, shaded for visual clarity.
This area typically indicates market indecision, sideways price action, or consolidation.
Trading within this range may favor range-bound or mean-reversion strategies, as trend momentum is likely limited.
The logic is similar to interpreting a flat ADX, tight Bollinger Bands, or contracting Keltner Channels — all suggesting consolidation.
⚙️ Features:
Customizable moving average length and input source
Adjustable thresholds for overbought/oversold and low-volatility zones
Optional visual fill between low-volatility bounds
Clean and minimal chart footprint (non-essential plots hidden by default)
📈 How to Use:
1. Trend Confirmation:
A break above +1.0% can be used as a bullish continuation signal.
A break below –1.0% may confirm bearish strength.
Long periods above/below these thresholds support trend-following entries.
2. Reversal Detection:
If DI returns below +1.0% after exceeding it, bullish momentum may be fading.
If DI rises above –1.0% after falling below, bearish pressure may be weakening.
These shifts resemble overbought/oversold transitions in oscillators like RSI or Stochastic, and can be paired with divergence, volume, or price structure analysis for higher reliability.
3. Sideways Market Detection:
DI values within ±0.5% indicate low volatility or a non-trending environment.
Traders may avoid breakout entries during these periods or apply range-trading tactics instead.
Observing transitions out of the low-volatility zone can help anticipate breakouts.
4. Combine with Other Indicators:
DI signals can be enhanced using tools like MACD, Volume Oscillators, or Moving Averages.
For example, a DI breakout beyond ±1.0% supported by a MACD crossover or volume spike can help validate trend initiation.
This indicator is especially powerful when paired with Bollinger Bands:
A simultaneous price breakout from the Bollinger Band and DI moving beyond ±1.0% can help identify early trend inflection points.
This combination supports entering positions early in a developing trend, improving the efficiency of trend-following strategies and enhancing decision-making precision.
It also helps filter false breakouts when DI fails to confirm the move outside the band.
This indicator is designed for educational and analytical purposes and works across all timeframes and asset classes.
It is particularly useful for traders seeking a clear framework to identify momentum strength, filter sideways markets, and improve entry timing within a larger trading system.

Pivot S/R with Volatility Filter## *📌 Indicator Purpose*
This indicator identifies *key support/resistance levels* using pivot points while also:
✅ Detecting *high-volume liquidity traps* (stop hunts)
✅ Filtering insignificant pivots via *ATR (Average True Range) volatility*
✅ Tracking *test counts and breakouts* to measure level strength
---
## *⚙ SETTINGS – Detailed Breakdown*
### *1️⃣ ◆ General Settings*
#### *🔹 Pivot Length*
- *Purpose:* Determines how many bars to analyze when identifying pivots.
- *Usage:*
- *Low values (5-20):* More pivots, better for scalping.
- *High values (50-200):* Fewer but stronger levels for swing trading.
- *Example:*
- Pivot Length = 50 → Only the most significant highs/lows over 50 bars are marked.
#### *🔹 Test Threshold (Max Test Count)*
- *Purpose:* Sets how many times a level can be tested before being invalidated.
- *Example:*
- Test Threshold = 3 → After 3 tests, the level is ignored (likely to break).
#### *🔹 Zone Range*
- *Purpose:* Creates a price buffer around pivots (±0.001 by default).
- *Why?* Markets often respect "zones" rather than exact prices.
---
### *2️⃣ ◆ Volatility Filter (ATR)*
#### *🔹 ATR Period*
- *Purpose:* Smoothing period for Average True Range calculation.
- *Default:* 14 (standard for volatility measurement).
#### *🔹 ATR Multiplier (Min Move)*
- *Purpose:* Requires pivots to show *meaningful price movement*.
- *Formula:* Min Move = ATR × Multiplier
- *Example:*
- ATR = 10 pips, Multiplier = 1.5 → Only pivots with *15+ pip swings* are valid.
#### *🔹 Show ATR Filter Info*
- Displays current ATR and minimum move requirements on the chart.
---
### *3️⃣ ◆ Volume Analysis*
#### *🔹 Volume Change Threshold (%)*
- *Purpose:* Filters for *unusual volume spikes* (institutional activity).
- *Example:*
- Threshold = 1.2 → Requires *120% of average volume* to confirm signals.
#### *🔹 Volume MA Period*
- *Purpose:* Lookback period for "normal" volume calculation.
---
### *4️⃣ ◆ Wick Analysis*
#### *🔹 Wick Length Threshold (Ratio)*
- *Purpose:* Ensures rejection candles have *long wicks* (strong reversals).
- *Formula:* Wick Ratio = (Upper Wick + Lower Wick) / Candle Range
- *Example:*
- Threshold = 0.6 → 60% of the candle must be wicks.
#### *🔹 Min Wick Size (ATR %)*
- *Purpose:* Filters out small wicks in volatile markets.
- *Example:*
- ATR = 20 pips, MinWickSize = 1% → Wicks under *0.2 pips* are ignored.
---
### *5️⃣ ◆ Display Settings*
- *Show Zones:* Toggles support/resistance shaded areas.
- *Show Traps:* Highlights liquidity traps (▲/▼ symbols).
- *Show Tests:* Displays how many times levels were tested.
- *Zone Transparency:* Adjusts opacity of zones.
---
## *🎯 Practical Use Cases*
### *1️⃣ Liquidity Trap Detection*
- *Scenario:* Price spikes *above resistance* then reverses sharply.
- *Requirements:*
- Long wick (Wick Ratio > 0.6)
- High volume (Volume > Threshold)
- *Outcome:* *Short Trap* signal (▼) appears.
### *2️⃣ Strong Support Level*
- *Scenario:* Price bounces *3 times* from the same level.
- *Indicator Action:*
- Labels the level with test count (3/5 = 3 tests out of max 5).
- Turns *red* if broken (Break Count > 0).
Deep Dive: How This Indicator Works*
This indicator combines *four professional trading concepts* into one powerful tool:
1. *Classic Pivot Point Theory*
- Identifies swing highs/lows where price previously reversed
- Unlike basic pivot indicators, ours uses *confirmed pivots only* (filtered by ATR)
2. *Volume-Weighted Validation*
- Requires unusual trading volume to confirm levels
- Filters out "phantom" levels with low participation
3. *ATR Volatility Filtering*
- Eliminates insignificant price swings in choppy markets
- Ensures only meaningful levels are plotted
4. *Liquidity Trap Detection*
- Spots institutional stop hunts where markets fake out traders
- Uses wick analysis + volume spikes for high-probability signals
---
## *📊 Parameter Encyclopedia (Expanded)*
### *1️⃣ Pivot Engine Settings*
#### *Pivot Length (50)*
- *What It Does:*
Determines how many bars to analyze when searching for swing highs/lows.
- *Professional Adjustment Guide:*
| Trading Style | Recommended Value | Why? |
|--------------|------------------|------|
| Scalping | 10-20 | Captures short-term levels |
| Day Trading | 30-50 | Balanced approach |
| Swing Trading| 50-200 | Focuses on major levels |
- *Real Market Example:*
On NASDAQ 5-minute chart:
- Length=20: Identifies levels holding for ~2 hours
- Length=50: Finds levels respected for entire trading day
#### *Test Threshold (5)*
- *Advanced Insight:*
Institutions often test levels 3-5 times before breaking them. This setting mimics the "probe and push" strategy used by smart money.
- *Psychology Behind It:*
Retail traders typically give up after 2-3 tests, while institutions keep testing until stops are run.
---
### *2️⃣ Volatility Filter System*
#### *ATR Multiplier (1.0)*
- *Professional Formula:*
Minimum Valid Swing = ATR(14) × Multiplier
- *Market-Specific Recommendations:*
| Market Type | Optimal Multiplier |
|------------------|--------------------|
| Forex Majors | 0.8-1.2 |
| Crypto (BTC/ETH) | 1.5-2.5 |
| SP500 Stocks | 1.0-1.5 |
- *Why It Matters:*
In EUR/USD (ATR=10 pips):
- Multiplier=1.0 → Requires 10 pip swings
- Multiplier=1.5 → Requires 15 pip swings (fewer but higher quality levels)
---
### *3️⃣ Volume Confirmation System*
#### *Volume Threshold (1.2)*
- *Institutional Benchmark:*
- 1.2x = Moderate institutional interest
- 1.5x+ = Strong smart money activity
- *Volume Spike Case Study:*
*Before Apple Earnings:*
- Normal volume: 2M shares
- Spike threshold (1.2): 2.4M shares
- Actual volume: 3.1M shares → STRONG confirmation
---
### *4️⃣ Liquidity Trap Detection*
#### *Wick Analysis System*
- *Two-Filter Verification:*
1. *Wick Ratio (0.6):*
- Ensures majority of candle shows rejection
- Formula: (UpperWick + LowerWick) / Total Range > 0.6
2. *Min Wick Size (1% ATR):*
- Prevents false signals in flat markets
- Example: ATR=20 pips → Min wick=0.2 pips
- *Trap Identification Flowchart:*
Price Enters Zone →
Spikes Beyond Level →
Shows Long Wick →
Volume > Threshold →
TRAP CONFIRMED
---
## *💡 Master-Level Usage Techniques*
### *Institutional Order Flow Analysis*
1. *Step 1:* Identify pivot levels with ≥3 tests
2. *Step 2:* Watch for volume contraction near levels
3. *Step 3:* Enter when trap signal appears with:
- Wick > 2×ATR
- Volume > 1.5× average
### *Multi-Timeframe Confirmation*
1. *Higher TF:* Find weekly/monthly pivots
2. *Lower TF:* Use this indicator for precise entries
3. *Example:*
- Weekly pivot at $180
- 4H shows liquidity trap → High-probability reversal
---
## *⚠ Critical Mistakes to Avoid*
1. *Using Default Settings Everywhere*
- Crude oil needs higher ATR multiplier than bonds
2. *Ignoring Trap Context*
- Traps work best at:
- All-time highs/lows
- Major psychological numbers (00/50 levels)
3. *Overlooking Cumulative Volume*
- Check if volume is building over multiple tests

Relative Measured Volatility (RMV) – Spot Tight Entry ZonesTitle: Relative Measured Volatility (RMV) – Spot Tight Entry Zones
Introduction
The Relative Measured Volatility (RMV) indicator is designed to highlight tight price consolidation zones , making it an ideal tool for traders seeking optimal entry points before potential breakouts. By focusing on tightness rather than general volatility, RMV offers traders a practical way to detect consolidation phases that often precede significant market moves.
How RMV Works
The RMV calculates short-term tightness by averaging three ATR (Average True Range) values over different lookback periods and then normalizing them within a specified lookback window. The result is a percentage-based scale from 0 to 100, indicating how tight the current price range is compared to recent history.
Here’s the breakdown:
Three ATR values are computed using user-defined short lookback periods to represent short-term price movements. An average of the ATRs provides a smoothed measure of current tightness. The RMV normalizes this average against the highest and lowest values over the defined lookback period, scaling it from 0 to 100.
This approach helps traders identify consolidation zones that are more likely to lead to breakouts.
Key Features of RMV
Multi-Period ATR Calculation : Uses three ATR values to effectively capture market tightness over the short term. Normalization : Converts the tightness measure to a 0-100 scale for easy interpretation. Dynamic Histogram and Background Colors : The RMV indicator uses a color-coded system for clarity.
How to Use the RMV Indicator
Identify Tight Consolidation Zones:
a - RMV values between 0-10 indicate very tight price ranges, making this the most optimal zone for potential entries before breakouts.
b - RMV values between 11-20 suggest moderate tightness, still favorable for entries.
Monitor Potential Breakout Areas:
As RMV moves from 21-30 , tightness reduces, signaling expanding volatility that may require wider stops or more flexible entry strategies.
Adjust Trading Strategies:
Use RMV values to identify tight zones for entering trades, especially in trending markets or at key support/resistance levels.
Customize the Indicator:
a - Adjust the short-term ATR lookback periods to control sensitivity.
b - Modify the lookback period to match your trading horizon, whether short-term or long-term.
Color-Coding Guide for RMV
ibb.co
How to Add RMV to Your Chart
Open your chart on TradingView.
Go to the “Indicators” section.
Search for "Relative Measured Volatility (RMV)" in the Community Scripts section.
Click on the indicator to add it to your chart.
Customize the input parameters to fit your trading strategy.
Input Parameters
Lookback Period : Defines the period over which tightness is measured and normalized.
Short-term ATR Lookbacks (1, 2, 3) : Control sensitivity to short-term tightness.
Histogram Threshold : Sets the threshold for differentiating between bright (tight) and dim (less tight) histogram colors.
Conclusion
The Relative Measured Volatility (RMV) is a versatile tool designed to help traders identify tight entry zones by focusing on market consolidation. By highlighting narrow price ranges, the RMV guides traders toward potential breakout setups while providing clear visual cues for better decision-making. Add RMV to your trading toolkit today and enhance your ability to identify optimal entry points!

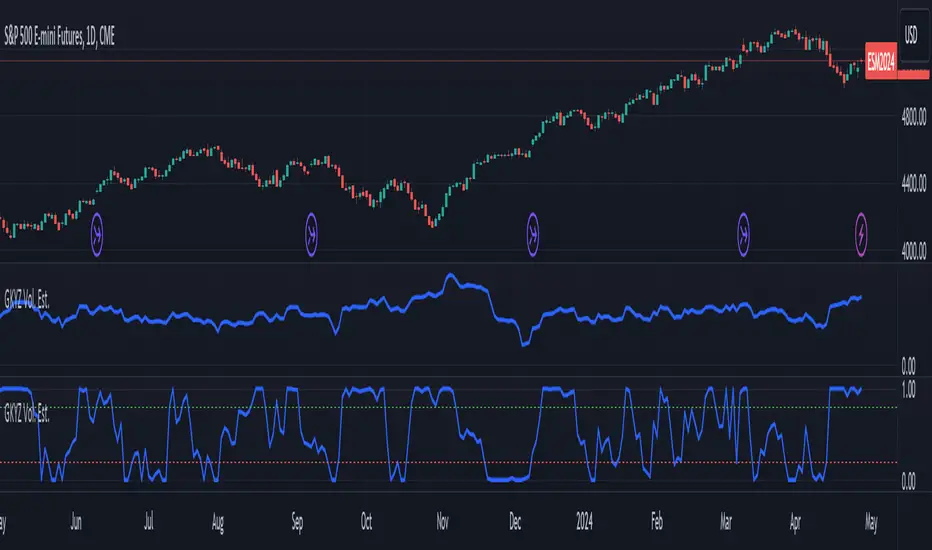
Garman-Klass-Yang-Zhang Volatility EstimatorThe Garman-Klass-Yang-Zhang Volatility Estimator (GKYZVE) is yet another attempt to robustly measure volatility, integrating intra-candle and inter-candle dynamics. It is an extension of the Garman-Klass Volatility Estimator (GKVE) incorporating insights from the Yang-Zhang Volatility Estimator (YZVE) . Like the YZVE, the GKYZVE holistically considers open, high, low, and close prices. The formula for GKYZ is:
GKYZVE = 0.5 * σ_HL² + * σ_CC² + σ_OC²
Where:
σ_HL² is the variance based on the high and low prices (σ_HL² = (high - low)² / (4 * math.log(2))), weighted at 0.5.
σ_CC² is the close-to-close variance (σ_CC² = (close - close)²), weighted at (2 ln 2) -1 for the logarithmic distribution of returns and emphasizing the impact of day-to-day price changes.
σ_OC² is the variance of the opening price against the closing price (σ_OC² = 0.5 * (open - close)²), weighted at 1.
The GKYZVE differs from the YZVE by using fixed weighing factors derived from theoretical calculations, leaning heavier into the assumption that returns are log-distributed.
This script also offers a choice for normalization between 0 and 1, turning the estimator into an oscillator for comparing current volatility to recent levels. Horizontal lines at user-defined levels are also available for clearer visualization. Both options are off by default.
References:
Garman, M. B., & Klass, M. J. (1980). On the estimation of security price volatilities from historical data. The Journal of Business, 53(1), 67-78.
Yang, D., & Zhang, Q. (2000). Drift-independent volatility estimation based on high, low, open, and close prices. The Journal of Business, 73(3), 477-492.
RSI Volatility Bands [QuantraSystems]RSI Volatility Bands
Introduction
The RSI Volatility Bands indicator introduces a unique approach to market analysis by combining the traditional Relative Strength Index (RSI) with dynamic, volatility adjusted deviation bands. It is designed to provide a highly customizable method of trend analysis, enabling investors to analyze potential entry and exit points in a new and profound way.
The deviation bands are calculated and drawn in a manner which allows investors to view them as areas of dynamic support and resistance.
Legend
Upper and Lower Bands - A dynamic plot of the volatility-adjusted range around the current price.
Signals - Generated when the RSI volatility bands indicate a trend shift.
Case Study
The chart highlights the occurrence of false signals, emphasizing the need for caution when the bands are contracted and market volatility is low.
Juxtaposing this, during volatile market phases as shown, the indicator can effectively adapt to strong trends. This keeps an investor in a position even through a minor drawdown in order to exploit the entire price movement.
Recommended Settings
The RSI Volatility Bands are highly customisable and can be adapted to many assets with diverse behaviors.
The calibrations used in the above screenshots are as follows:
Source = close
RSI Length = 8
RSI Smoothing MA = DEMA
Bandwidth Type = DEMA
Bandwidth Length = 24
Bandwidth Smooth = 25
Methodology
The indicator first calculates the RSI of the price data, and applies a custom moving average.
The deviation bands are then calculated based upon the absolute difference between the RSI and its moving average - providing a unique volatility insight.
The deviation bands are then adjusted with another smoothing function, providing clear visuals of the RSI’s trend within a volatility-adjusted context.
rsiVal = ta.rsi(close, rsiLength)
rsiEma = ma(rsiMA, rsiVal, bandLength)
bandwidth = ma(bandMA, math.abs(rsiVal - rsiEma), bandLength)
upperBand = ma(bandMA, rsiEma + bandwidth, smooth)
lowerBand = ma(bandMA, rsiEma - bandwidth, smooth)
long = upperBand > 50 and not (lowerBand < lowerBand and lowerBand < 50)
short= not (upperBand > 50 and not (lowerBand < lowerBand and lowerBand < 50))
By dynamically adjusting to market conditions, the RSI trend bands offer a unique perspective on market trends, and reversal zones.

LBR-Volatility Breakout BarsThe originator of this script is Linda Raschke of LBR Group.
This Pine Script code is the version 5 of LBR Paintbars for TradingView, called "LBR-Bars." It was originally coded for TradingView in version 3 by LazyBear. It is a complex indicator that combines various features such as coloring bars based on different conditions, displaying Keltner channels, and showing volatility lines.
Let me break down the key components and explain how it works:
1. Inputs Section: This section defines various input parameters that users can adjust when adding the indicator to their charts. These parameters allow users to customize the behavior and appearance of the indicator. Here are some of the key input parameters:
- Users can control whether to color bars under different conditions. For example,
they can choose to color LBR bars, color bars above/below Kelts, or color non-LBR
bars.
- Users can choose whether to show volatility lines or shade Keltner channels' area
with the Mid being the moving average on the chart.
- In the calculation of Keltner channels, users can set the length of the moving
average that the Keltner channels use as the mid and then set the Keltner multiplier.
If users want to use "True Range" to determine calculations, they can turn it on or
off; it defaults to off.
- Users can change the calculation of volatility lines and set the length for finding the
lowest and highest prices. The user sets the ATR length and multiplier for the ATR.
2. Calculation Section: This section defines the calculation of the upper and lower standard deviation bands based on the input parameters. It uses Exponential Moving Averages (EMAs) and optionally True Range to calculate these bands if turned on. These bands are used in the Keltner channel calculation.
3. Keltner Channel Section: This section calculates the upper, middle, and lower lines of the Keltner channels. It also plots these lines on the chart. The colors and visibility of these lines are controlled by user inputs.
4. Volatility Lines Section: This section calculates the upper and lower volatility lines based on the lowest and highest prices over a specified period and the ATR. It also checks whether the current close price is above or below these lines accordingly. The colors and visibility of these lines are controlled by user inputs.
5. Bar Colors Section: This section determines the color of the bars on the chart based on various conditions. It checks whether the current bar meets conditions like being an LBR bar, being above or below volatility lines, or being in "No Man's Land." The color of the bars is set accordingly based on user inputs.
This Pine Script creates an indicator that provides visual cues on the chart based on Keltner channels, volatility lines, and other customizable conditions. Users can adjust the input parameters to tailor the indicator's behavior and appearance to their trading preferences.
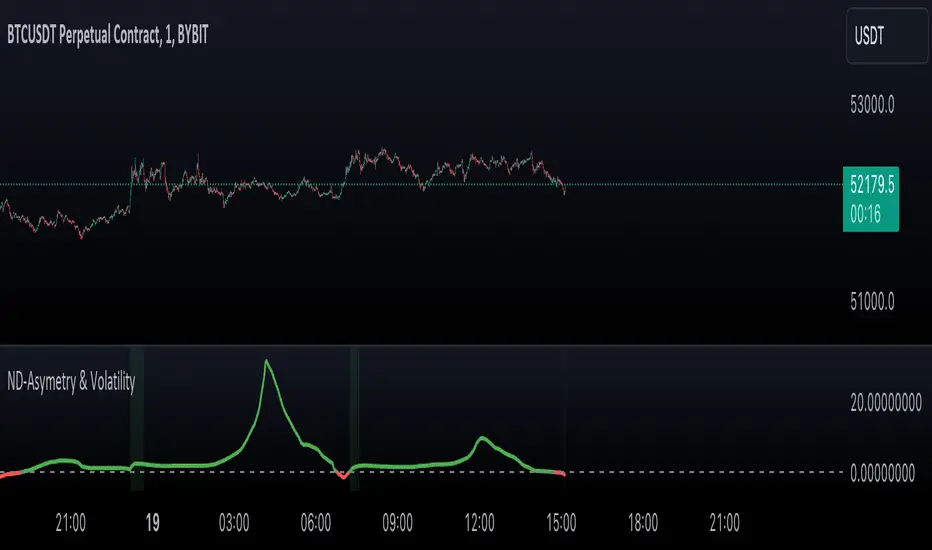
Normal Distribution Asymmetry & Volatility ZonesNormal Distribution Asymmetry & Volatility Zones Indicator provides insights into the skewness of a price distribution and identifies potential volatility zones in the market. The indicator calculates the skewness coefficient, indicating the asymmetry of the price distribution, and combines it with a measure of volatility to define buy and sell zones.
The key features of this indicator include :
Skewness Calculation : It calculates the skewness coefficient, a statistical measure that reveals whether the price distribution is skewed to the left (negative skewness) or right (positive skewness).
Volatility Zones : Based on the skewness and a user-defined volatility threshold, the indicator identifies buy and sell zones where potential price movements may occur. Buy zones are marked when skewness is negative and prices are below a volatility threshold. Sell zones are marked when skewness is positive and prices are above the threshold.
Signal Source Selection : Traders can select the source of price data for analysis, allowing flexibility in their trading strategy.
Customizable Parameters : Users can adjust the length of the distribution, the volatility threshold, and other parameters to tailor the indicator to their specific trading preferences and market conditions.
Visual Signals : Buy and sell zones are visually displayed on the chart, making it easy to identify potential trade opportunities.
Background Color : The indicator changes the background color of the chart to highlight significant zones, providing a clear visual cue for traders.
By combining skewness analysis and volatility thresholds, this indicator offers traders a unique perspective on potential market movements, helping them make informed trading decisions. Please note that trading involves risks, and this indicator should be used in conjunction with other analysis and risk management techniques.
Relative Bi-Directional Volatility RangeThe basic math behind this Indicator is very similar to the math behind the Relative Strength Index without using a standard deviation as used for the Relative Volatility Index. The Volatility Range is calculated by utilizing the highs and lows. However not in the same way as in the Relative Volatility Index. This approach leads to different values, but the overall result clearly reveals the intrinsic Volatility of the chart, so the user can be aware, when something fundamentally is going on behind the scenes. If the Volatility rises on positive and negative range (-100 to 100) it implies that something fundamental is changing.
An advantage of using this kind of calculation is the possibility of separating the data into positive (buy pressure) and negative (sell pressure) components. The bi-directional character shows a slightly overhang in one of the directions, which can be used to detect a trend. A Moving Average of the users choice shell smoothen the overhang of the Relative Bi-Directional Volatility and show a trend direction. Similar to the math of the Relative Strength Index as standard a Relative Moving Average is preferred. If the Moving Average is in the positive range (0 to 100) it indicates a bullish trend, else if the Moving Average is in the negative range (0 to -100) it indicates a bearish trend. External Indicators can use a provided Trend Shift Signal which switches from 0 to 1, if the trend becomes bullish or from 0 to -1, if the trend becomes bearish.
The user should know, that in this Indicator the starting point of the Moving Averages always begins at the first bar, because the starting progress is approximated appropriately. Most Moving Averages require a minimum number of bars to be calculated, which is chosen with the Moving Average Length. In this cases the length used will be automatically reduced in the background until the number of bars is sufficient to match the chosen length. So if data history is very short, the Indicator can be used never the less as good as possible.
It is feasible to switch the Indicator on a higher timeframe, while staying in a lower timeframe on the chart. This can be useful for making the indication cleaner, if the Moving Average is to choppy and shows too many false signals. On the other hand the benefit of a higher timeframe (or a higher Moving Average Length) is paid with higher latency of the signaling. So the user has to decide what the best setting in his case is.
This Indicator can be used with all kinds of charts. Even charts with percentage or negative values should work fine.

Parkinson's Historical Volatility Bands [Loxx]Parkinson's Historical Volatility Bands are constructed using:
Average as the middle line.
Upper and lower bands using the Parkinson's historical volatility (instead of "regular" Historical Volatility) for bands calculation.
What is Parkinson's Historical Volatility?
The Parkinson's number, or High Low Range Volatility developed by the physicist, Michael Parkinson in 1980, aims to estimate the Volatility of returns for a random walk using the High and Low in any particular period. IVolatility.com calculates daily Parkinson values. Prices are observed on a fixed time interval: n = 10, 20, 30, 60, 90, 120, 150, 180 days.
SH is stock's High price in t day.
SL is stock's Low price in t day.
High/Low Return (xt^HL) is calculated as the natural logarithm of the ratio of a stock's High price to stock's Low price.
Return:
And Parkinson's number: 1 / (4 * math.log(2)) * 252 / n * Σ (n, t =1) {math.log(Ht/Lt)^2}
An important use of the Parkinson's number is the assessment of the distribution prices during the day as well as a better understanding of the market dynamics. Comparing the Parkinson's number and periodically sampled volatility helps traders understand the tendency towards mean reversion in the market as well as the distribution of stop-losses.
The color of the middle line, unlike the bands colors, has 3 colors. When colors of the bands are the same, then the middle line has the same color, otherwise it's white.
Included
Alerts
Signals
Loxx's Expanded Source Types
Bar coloring

[CBB] Volatility Squeeze ToyThe main concept and features of this script are adapted from Mark Whistler's book "Volatility Illuminated". I have deviated from the use cases and strategies presented in the book, but the 3 Bollinger Bands use his optimized settings as the default length and standard deviation multiplier. Further insights into Mark's concepts and volatility research were gained by reading and watching some of TV user DadShark's materials (www.tradingview.com).
This script has been through many refinements and feature cycles, and I've added unrelated complimentary features not present in the book. The indicator is better studied than described, and unless you have read the book, any short summary of the material will just make you squint and think about the wrong things.
Here is a limited outline of features and concepts:
1. 3 Bollinger Bands of different length and/or deviation multiplier. Perhaps think of them as representing the various time frames that compression and expansion cycles and events manifest in, and also the expression of range, speed and price distribution within those time frames. You can gain insight into the magnitude of events based on how the three bands interact and stay contained, or not. If volatility is significant enough, all "time frames" represented by the bands will eventually record the event and subsequent price action, but the early signals will come from the spasms of the shortest, most volatile band. Many times the short band will contract again before, or just as it reaches a longer band, but in extreme cases, volatility will explode and all bands at all time frames will erupt in succession. In these cases you will see additional color representing shorter bands (lower time frame volatility in concept) traveling outside of longer bands. It is worth taking a look at the price levels and candles where these volatility bands cross each other.
2. In addition to the mean of the bands, there are a variety of other moving averages available to gauge trend, range, and areas of interest. This is accomplished with variable VWAP, ATR, smoothing, and a special derived loosely from the difference between them.
3. The bands are also used to derive conditions under which volatility is considered compressed, or in "squeeze" . Under these conditions the candles will turn yellow. Depending on your chart settings and indicator settings, these zones can be completely useless or drag on through fairly significant price action. Or, the can give you fantastic levels to watch for breakouts. The point is that volatility is compressed during these conditions, and you should expect the inevitable once this condition ends. Sometimes you can find yourself in a nice fat trend straight away, other times you may blow an account because you gorged your position based on arbitrary bar color. It's not like that. Pay attention to the highest and lowest bars of these squeeze ranges, and carefully observe future price action when it returns to these squeeze ranges. This info is more and more valuable at higher time frames.
The 3 bands, a smoothed long trend VWAP, and the squeeze condition colored bars are all active by default. All features can be shown or hidden on the control panel.
There are some deep market insights to mine if you live with this one for a while. As with any indicator, blunt "buy/sell here" approaches will lead to loss and frustration. however , if you pay attention to squeeze range, band/moving average confluence, high volume and/or large range candles their open/close behavior around these areas and squeeze ranges, you will start to catch the beginning of some powerful momentum moves.
Enjoy!

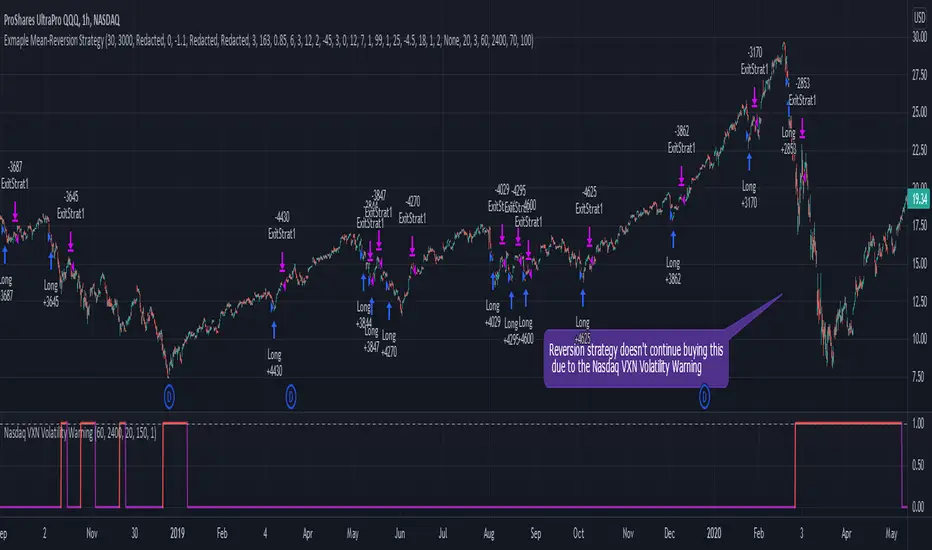
Nasdaq VXN Volatility Warning IndicatorToday I am sharing with the community a volatility indicator that uses the Nasdaq VXN Volatility Index to help you or your algorithms avoid black swan events. This is a similar the indicator I published last week that uses the SP500 VIX, but this indicator uses the Nasdaq VXN and can help inform strategies on the Nasdaq index or Nasdaq derivative instruments.
Variance is most commonly used in statistics to derive standard deviation (with its square root). It does have another practical application, and that is to identify outliers in a sample of data. Variance is defined as the squared difference between a value and its mean. Calculating that squared difference means that the farther away the value is from the mean, the more the variance will grow (exponentially). This exponential difference makes outliers in the variance data more apparent.
Why does this matter?
There are assets or indices that exist in the stock market that might make us adjust our trading strategy if they are behaving in an unusual way. In some instances, we can use variance to identify that behavior and inform our strategy.
Is that really possible?
Let’s look at the relationship between VXN and the Nasdaq100 as an example. If you trade a Nasdaq index with a mean reversion strategy or algorithm, you know that they typically do best in times of volatility . These strategies essentially attempt to “call bottom” on a pullback. Their downside is that sometimes a pullback turns into a regime change, or a black swan event. The other downside is that there is no logical tight stop that actually increases their performance, so when they lose they tend to lose big.
So that begs the question, how might one quantitatively identify if this dip could turn into a regime change or black swan event?
The Nasdaq Volatility Index ( VXN ) uses options data to identify, on a large scale, what investors overall expect the market to do in the near future. The Volatility Index spikes in times of uncertainty and when investors expect the market to go down. However, during a black swan event, historically the VXN has spiked a lot harder. We can use variance here to identify if a spike in the VXN exceeds our threshold for a normal market pullback, and potentially avoid entering trades for a period of time (I.e. maybe we don’t buy that dip).
Does this actually work?
In backtesting, this cut the drawdown of my index reversion strategies in half. It also cuts out some good trades (because high investor fear isn’t always indicative of a regime change or black swan event). But, I’ll happily lose out on some good trades in exchange for half the drawdown. Lets look at some examples of periods of time that trades could have been avoided using this strategy/indicator:
Example 1 – With the Volatility Warning Indicator, the mean reversion strategy could have avoided repeatedly buying this pullback that led to this asset losing over 75% of its value:
Example 2 - June 2018 to June 2019 - With the Volatility Warning Indicator, the drawdown during this period reduces from 22% to 11%, and the overall returns increase from -8% to +3%
How do you use this indicator?
This indicator determines the variance of VXN against a long term mean. If the variance of the VXN spikes over an input threshold, the indicator goes up. The indicator will remain up for a defined period of bars/time after the variance returns below the threshold. I have included default values I’ve found to be significant for a short-term mean-reversion strategy, but your inputs might depend on your risk tolerance and strategy time-horizon. The default values are for 1hr VXN data/charts. It will pull in variance data for the VXN regardless of which chart the indicator is applied to.
Disclaimer: Open-source scripts I publish in the community are largely meant to spark ideas or be used as building blocks for part of a more robust trade management strategy. If you would like to implement a version of any script, I would recommend making significant additions/modifications to the strategy & risk management functions. If you don’t know how to program in Pine, then hire a Pine-coder. We can help!
Parkinson Historical VolatilityFirst off, a huge thank you to the following people:
theheirophant: www.tradingview.com
alexgrover: www.tradingview.com
NGBaltic: www.tradingview.com
The Parkinson Historical Volatility (PHV), developed in 1980 by the physicist Michael Parkinson, aims to estimate the volatility of returns for a random walk using the high and low in any particular period. An important use of the PHV is the assessment of the distribution prices during the day as well as a better understanding of the market dynamics. Comparing the PHV and a periodically sampled volatility helps traders understand the tendency towards mean reversion in the market as well as the distribution of stop-losses.
This script allows you to transform the volatility reading. The intention of this is to be able to compare volatility across different assets and timeframes. Having a relative reading of volatility also allows you to better gauge volatility within the context of current market conditions.
For the signal lie I chose a repulsion moving average to remove choppy crossovers of the estimator and the signal. This may have been a mistake, so in the near-future I might update so that the MA can be selected. Let me know if you have any opinions either way.
References
www.rdocumentation.org
www.ivolatility.com
Want to Learn?
If you'd like the opportunity to learn Pine but you have difficulty finding resources to guide you, take a look at this rudimentary list: docs.google.com
The list will be updated in the future as more people share the resources that have helped, or continue to help, them. Follow me on Twitter to keep up-to-date with the growing list of resources.
Suggestions or Questions?
Don't even kinda hesitate to forward them to me. My (metaphorical) door is always open.

Historical Volatility Strategy Backtest Strategy buy when HVol above BuyBand and close position when HVol below CloseBand.
Markets oscillate from periods of low volatility to high volatility
and back. The author`s research indicates that after periods of
extremely low volatility, volatility tends to increase and price
may move sharply. This increase in volatility tends to correlate
with the beginning of short- to intermediate-term moves in price.
They have found that we can identify which markets are about to make
such a move by measuring the historical volatility and the application
of pattern recognition.
The indicator is calculating as the standard deviation of day-to-day
logarithmic closing price changes expressed as an annualized percentage.
Please, use it only for learning or paper trading. Do not for real trading.

Historical Volatility Strategy Strategy buy when HVol above BuyBand and close position when HVol below CloseBand.
Markets oscillate from periods of low volatility to high volatility
and back. The author`s research indicates that after periods of
extremely low volatility, volatility tends to increase and price
may move sharply. This increase in volatility tends to correlate
with the beginning of short- to intermediate-term moves in price.
They have found that we can identify which markets are about to make
such a move by measuring the historical volatility and the application
of pattern recognition.
The indicator is calculating as the standard deviation of day-to-day
logarithmic closing price changes expressed as an annualized percentage.
