Advanced Volatility-Adjusted Momentum IndexAdvanced Volatility-Adjusted Momentum Index (AVAMI)
The AVAMI is a powerful and versatile trading index which enhances the traditional momentum readings by introducing a volatility adjustment. This results in a more nuanced interpretation of market momentum, considering not only the rate of price changes but also the inherent volatility of the asset.
Settings and Parameters:
Momentum Length: This parameter sets the number of periods used to calculate the momentum, which is essentially the rate of change of the asset's price. A shorter length value means the momentum calculation will be more sensitive to recent price changes. Conversely, a longer length will yield a smoother and more stabilized momentum value, thereby reducing the impact of short-term price fluctuations.
Volatility Length: This parameter is responsible for determining the number of periods to be considered in the calculation of standard deviation of returns, which acts as the volatility measure. A shorter length will result in a more reactive volatility measure, while a longer length will produce a more stable, but less sensitive measure of volatility.
Smoothing Length: This parameter sets the number of periods used to apply a moving average smoothing to the AVAMI and its signal line. The purpose of this is to minimize the impact of volatile periods and to make the indicator's lines smoother and easier to interpret.
Lookback Period for Scaling: This is the number of periods used when rescaling the AVAMI values. The rescaling process is necessary to ensure that the AVAMI values remain within a consistent and interpretable range over time.
Overbought and Oversold Levels: These levels are thresholds at which the asset is considered overbought (potentially overvalued) or oversold (potentially undervalued), respectively. For instance, if the AVAMI exceeds the overbought level, traders may consider it as a possible selling opportunity, anticipating a price correction. Conversely, if the AVAMI falls below the oversold level, it could be seen as a buying opportunity, with the expectation of a price bounce.
Mid Level: This level represents the middle ground between the overbought and oversold levels. Crossing the mid-level line from below can be perceived as an increasing bullish momentum, and vice versa.
Show Divergences and Hidden Divergences: These checkboxes give traders the option to display regular and hidden divergences between the AVAMI and the asset's price. Divergences are crucial market structures that often signal potential price reversals.
Index Logic:
The AVAMI index begins with the calculation of a simple rate of change momentum indicator. This raw momentum is then adjusted by the standard deviation of log returns, which acts as a measure of market volatility. This adjustment process ensures that the resulting momentum index encapsulates not only the speed of price changes but also the market's volatility context.
The raw AVAMI is then smoothed using a moving average, and a signal line is generated as an exponential moving average (EMA) of this smoothed AVAMI. This signal line serves as a trigger for potential trading signals when crossed by the AVAMI.
The script also includes an algorithm to identify 'fractals', which are distinct price patterns that often act as potential market reversal points. These fractals are utilized to spot both regular and hidden divergences between the asset's price and the AVAMI.
Application and Strategy Concepts:
The AVAMI is a versatile tool that can be integrated into various trading strategies. Traders can utilize the overbought and oversold levels to identify potential reversal points. The AVAMI crossing the mid-level line can signify a change in market momentum. Additionally, the identification of regular and hidden divergences can serve as potential trading signals:
Regular Divergence: This happens when the asset's price records a new high/low, but the AVAMI fails to follow suit, suggesting a possible trend reversal. For instance, if the asset's price forms a higher high but the AVAMI forms a lower high, it's a regular bearish divergence, indicating potential price downturn.
Hidden Divergence: This is observed when the price forms a lower high/higher low, but the AVAMI forms a higher high/lower low, suggesting the continuation of the prevailing trend. For example, if the price forms a lower low during a downtrend, but the AVAMI forms a higher low, it's a hidden bullish divergence, signaling the potential continuation of the downtrend.
As with any trading tool, the AVAMI should not be used in isolation but in conjunction with other technical analysis tools and within the context of a well-defined trading plan.
Cari dalam skrip untuk "Volatility"

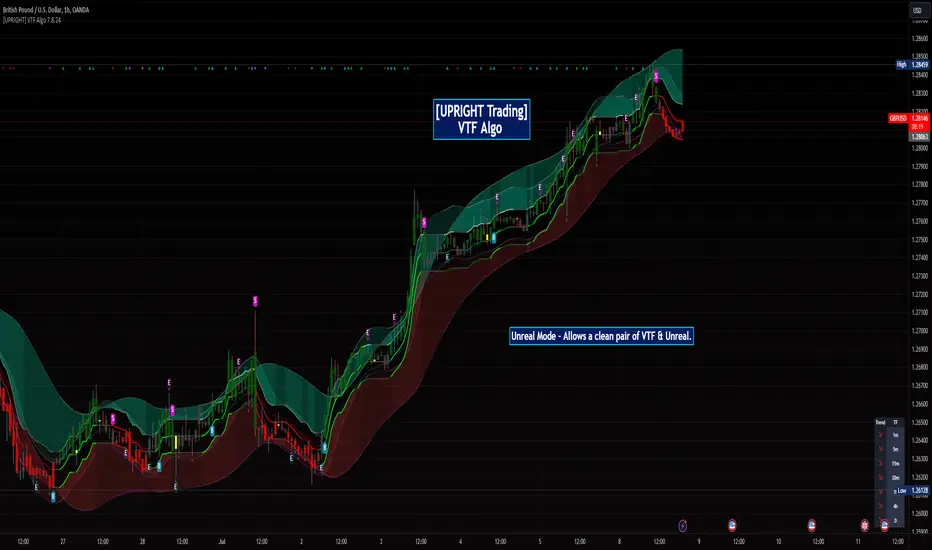
[UPRIGHT Trading] Volatility Trend Filter (VTF) AlgoHello Traders,
As some of you know, I have had this in Beta for a long while now and it's finally time for a full release.
I originally designed this to be an Unreal Algo add-on to track & stay in the trade a little better, but the VTF Algo has become a full Algorithm and can be used standalone with supreme accuracy.
It's for beginners and advanced traders alike. I've made the settings very customizable, but also easy to just jump right in.
How it works:
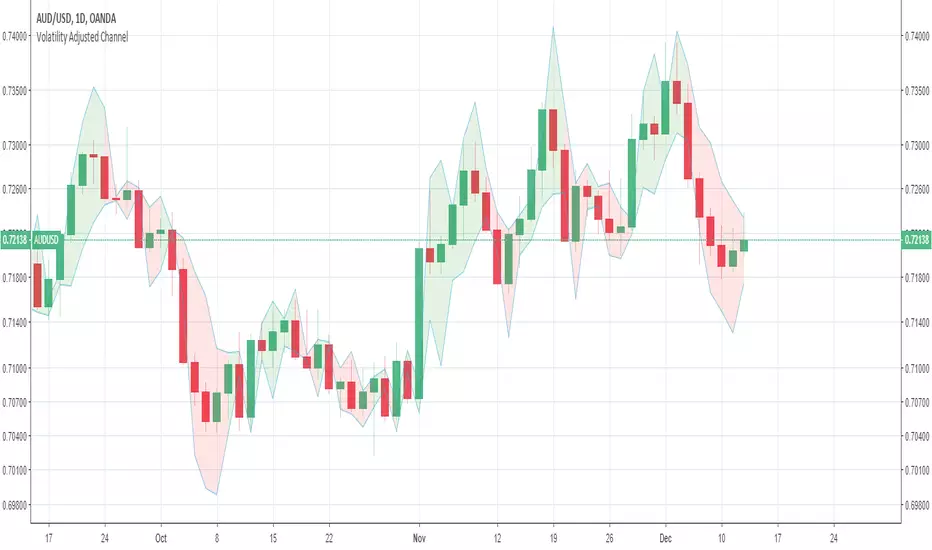
It uses volatility , deviations, and tons of statistical calculations, confirmations, moving averages, and filters to bring you the most accurate Supply & Demand predictive algorithm possible. The VTF Algo will automatically normalize different volatility in any type of market to help avoid getting Chopped up and give a forward-looking approach to accurate Price Action and confirmation. It will automatically show support and resistance in real-time. The channel that The VTF Algo creates will help traders confirm whether they should stay in the trade or get out fast. As the green top grows it naturally acts as Supply and as the red bottom grows it acts as Demand, when one of them far exceeds the other the direction price will proceed to is clear to see.
Features:
-Easy-to-read Price Action & Trend channel.
-Exceptional Chop Filter (grayed center).
-Accurate Buy/Sell and Topline Continuation Signals.
-Rejection Signals.
-Multiple-Timeframe Customizable Trend Table. Showing Directional Arrows (see bottom right of picture).
-Bullish / Bearish Growing Blocks.
-Fully Customizable with Clean and Cleaner Mode.
The VTF Algo was made with all different types of traders in mind.
Some like things Ultra Crispy Clean:
Others like things a little more clean but can move their focus to where it's needed:
Lastly, there are those who don't mind things looking a little busy:
Topline Continuation Signals, Auto-Supply/Demand, and a Real-Time Multiple Timeframe Trend Table (in the bottom-right) corner:
Meshes perfectly as an Algo Add-on for Unreal Algo © (as originally designed) to enhance "The Simple Strat" © :
I tried to make everything as customizable as possible. So adding or removing or color-changing is super easy.
Happy Trading.
Cheers,
Mike
Fibonacci Volatility BandsFibonacci Volatility Bands are just an alternative that allows for more margin than regular Bollinger Bands. They are created based on an average of moving averages that use the Fibonacci sequence as lookback periods.
The use of the Fibonacci Volatility Bands is exactly the same as the Bollinger Bands.

Wavetrend in Dynamic Zones with Kumo Implied VolatilityI was asked to do one of those, so here we go...
As always free and open source as it should be. Do not pay for such indicators!
A WaveTrend Indicator or also widely known as "Market Cipher" is an Indicator that is based on Moving Averages, therefore its an "lagging indicator". Lagging indicators are best used in combination with leading indicators. In this script the "leading indicator" component are Daily, Weekly or Monthly Pivots . These Pivots can be used as dynamic Support and Resistance , Stoploss, Take Profit etc.
This indicator combination is best used in larger timeframes. For lower timeframes you might need to change settings to your liking.
The general Wavetrend settings are the same that are used in Market Cipher, Market Liberator and such popular indicators.
What are these circles?
-These are the WaveTrend Divergences. Red for Regular-Bearish. Orange for Hidden-Bearish. Green for Regular-Bullish. Aqua for Hidden-Bullish.
What are these white, orange and aqua triangles?
-These are the WaveTrend Pivots. A Pivot counter was added. Every time a pivot is lower than the previous one, an orange triangle is printed, every time a pivot is higher than the previous one an aqua triangle is printed. That mimics a very common way Wavetrend is being used for trading when using those other paid Wavetrend indicators.
What are these Orange and Aqua Zones?
-These are Dynamic Zones based on the indicator itself, they offer more information than static zones. Of course static lines are also included and can be adjusted.
What are the lines between the waves?
-This is a Kumo Cloud Implied Volatility indicator. It is color coded and can be used to indicate if a major market move/bottom/top happened.
What are those numbers on the right?
-The first number is a Bollinger Band indicator that shows if said Bollinger Band is in a state of Oversold/Overbought, the second number is the actual Bollinger Band Width that indicates if the Bollinger Band squeezes, normally that happens right before the market makes an explosive move.
Please keep in mind that this indicator is a tool and not a strategy, do not blindly trade signals, do your own research first! Use this indicator in conjunction with other indicators to get multiple confirmations.

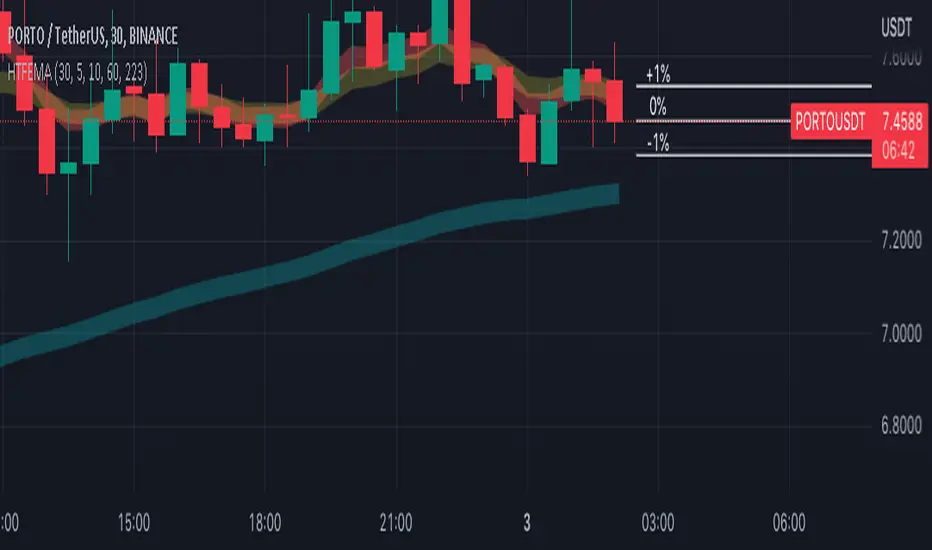
Higher Time Frame EMAs and 1% volatility indicatorSet the "higher time frame" (HTF) from which the EMAs will be calculated in all timeframes.
Example: I chose timeframe 1D and I will see the EMAs from TF 1D also in smaller TF as 1, 5, 30, 60 minutes.
There are 4 EMAs. The default values are 5, 10, 60 and 223 periods from "Scalping the Bull" indicator.
You can change the periods of each EMA.
The indicator have also a volatility indication, showing -1% and +1% price levels.
Multi-Symbol Volatility Tracker with Range DetectionMulti-Symbol Volatility Tracker with Range Detection
🎯 Main Purpose:
This indicator is specifically designed for scalpers to quickly identify symbols with high volatility that are currently in ranging conditions . It helps you spot the perfect opportunities for buying at lows and selling at highs repeatedly within the same trading session.
📊 Table Data Explanation:
The indicator displays a comprehensive table with 5 columns for 4 major symbols (GOLD, SILVER, NASDAQ, SP500):
SYMBOL: The trading instrument being analyzed
VOLATILITY: Color-coded volatility levels (NORMAL/HIGH/EXTREME) based on ATR values
Last Candle %: The percentage range of the most recent 5-minute candle
Last 5 Candle Avg %: Average percentage range over the last 5 candles
RANGE: Shows "YES" (blue) or "NO" (gray) indicating if the symbol is currently ranging
🔍 How to Identify Trading Opportunities:
Look for symbols that combine these characteristics:
RANGE column shows "YES" (highlighted in blue) - This means the symbol is moving sideways, perfect for range trading
VOLATILITY shows "HIGH" or "EXTREME" - Ensures there's enough movement for profitable scalping
Higher candlestick percentages - Indicates larger candle ranges, meaning more profit potential per trade
⚡ Optimal Usage:
Best Timeframe: Works optimally on 5-minute charts where the ranging patterns are most reliable for scalping
Trading Strategy: When you find a symbol with "YES" in the RANGE column, switch to that symbol and look for opportunities to buy near the lows and sell near the highs of the ranging pattern
Risk Management: Higher volatility symbols offer more profit potential but require tighter risk management
⚙️ Settings:
ATR Length: Adjusts the Average True Range calculation period (default: 14)
Range Sensitivity: Fine-tune range detection sensitivity (0.1-2.0, lower = more sensitive)
💡 Pro Tips:
The indicator updates in real-time, so monitor for symbols switching from "NO" to "YES" in the RANGE column
Combine HIGH/EXTREME volatility with RANGE: YES for the most profitable scalping setups
Use the candlestick percentages to gauge potential profit per trade - higher percentages mean more movement
The algorithm uses advanced statistical analysis including standard deviation, linear regression slopes, and range efficiency to accurately detect ranging conditions
Perfect for day traders and scalpers who want to quickly identify which symbols offer the best ranging opportunities for consistent buy-low, sell-high strategies.

Clustering Volatility (ATR-ADR-ChaikinVol) [Sam SDF-Solutions]The Clustering Volatility indicator is designed to evaluate market volatility by combining three widely used measures: Average True Range (ATR), Average Daily Range (ADR), and the Chaikin Oscillator.
Each indicator is normalized using one of the available methods (MinMax, Rank, or Z-score) to create a unified metric called the Score. This Score is further smoothed with an Exponential Moving Average (EMA) to reduce noise and provide a clearer view of market conditions.
Key Features:
Multi-Indicator Integration: Combines ATR, ADR, and the Chaikin Oscillator into a single Score that reflects overall market volatility.
Flexible Normalization: (Supports three normalization methods)
MinMax: Scales values between the observed minimum and maximum.
Rank: Normalizes based on the relative rank within a moving window.
Z-score: Standardizes values using mean and standard deviation.
Dynamic Window Selection: Offers an automatic window selection option based on a specified lookback period, or a fixed window size can be used.
Customizable Weights: Allows the user to assign individual weights to ATR, ADR, and the Chaikin Oscillator. Optionally, weights can be normalized to sum to 1.
Score Smoothing: Applies an EMA to the computed Score to smooth out short-term fluctuations and reduce market noise.
Cluster Visualization: Divides the smoothed Score into a number of clusters, each represented by a distinct color. These colors can be applied to the price bars (if enabled) for an immediate visual indication of the current volatility regime.
How It Works:
Input & Window Setup: Users set parameters for indicator periods, normalization methods, weights, and window size. The indicator can automatically determine the analysis window based on the number of lookback days.
Calculation of Metrics: The indicator computes the ATR, ADR (as the average of bar ranges), and the Chaikin Oscillator (based on the difference between short and long EMAs of the Accumulation/Distribution line).
Normalization & Scoring: Each indicator’s value is normalized and then weighted to form a raw Score. This raw Score is scaled to a range using statistics from the chosen window.
Smoothing & Clustering: The raw Score is smoothed using an EMA. The resulting smoothed Score is then multiplied by the number of clusters to assign a cluster index, which is used to choose a color for visual signals.
Visualization: The smoothed Score is plotted on the chart with a color that changes based on its value (e.g., lime for low, red for high, yellow for intermediate values). Optionally, the price bars are colored according to the assigned cluster.
_____________
This indicator is ideal for traders seeking a quick and clear assessment of market volatility. By integrating multiple volatility measures into one comprehensive Score, it simplifies analysis and aids in making more informed trading decisions.
For more detailed instructions, please refer to the guide here:

Integrated Implied Volatility C/FThe integrated version of IV CAP/FLOOR Premium and Bitcoin IV C/F.
Illustrating Cap-Floor bands based on statistical calculations using the implied volatility of Bitcoin, foreign currency pairs, commodities, bonds, and indexes.

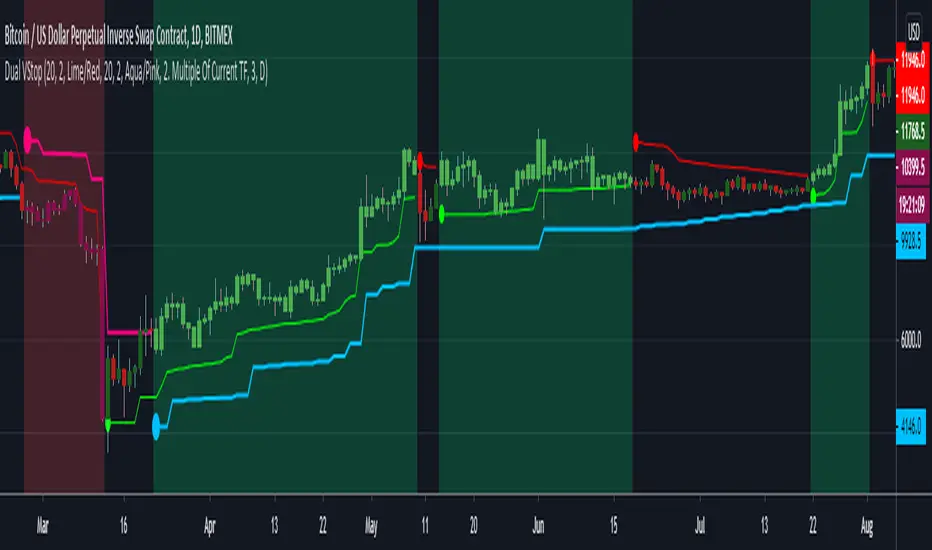
Dual Volatility StopThis merges Volatility Stop & its MTF version both published by u/TradingView . Background is colored green or red when both the current timeframe Vstop and higher timeframe Vstop point in same direction. Aim is to take the standard Vstop script which differentiates market from only uptrend/downtrend to uptrend/downtrend/sideways. There is a tradeoff with this, that there is no need for the Vstop to be always in a position which reduces trade time & frees up capital. However this leads to situations where it takes slightly more time to catch on to a trend after a reversal.
Green Background = Buy
Red Background = Sell
No Background = Flat
Standard Deviation Levels with Settlement Price and VolatilityStandard Deviation Levels with Settlement Price and Volatility.
This indicator plots the standard deviation levels based on the settlement price and the implied volatility. It works for all Equity Stocks and Futures.
For Futures
Symbol Volatility Symbol (Implied Volatility)
NQ VXN
ES VIX
YM VXD
RTY RVX
CL OVX
GC GVZ
BTC DVOL
The plot gives you an ideas that the price has what probability staying in the range of 1SD,2SD,3SD ( In normal distribution method)
Please provide the feedback or comments if you find any improvements

VWMA Volatility OscillatorVWMA Volatility Oscillator
This oscillator uses Volume Weighted Moving Averages to plot the volume. When the average is on the bottom then there is a chance that volatility contractions could be happening and a expansion could happen soon. When the average can be seen "high" like peaking then this could mean that there already is a lot of volume and the expansion is already happening.
What are contractions and expansions?
Contractions are periods in the markets where the price range gets tighter signifying decreasing volatility.
After contractions, Expansions will occur which is a strong movement upwards or downwards and the range increases, which shows an increase in volatility.
How to use this indicator
The indicator has 3 VWMA lines. The indicator also has a bottom range by getting the lowest points of each of the VWMA lines. If the VWMA lines are at the bottom ranges this can signify low volatility and a contraction. This can mean that at any moment a expansion will happen and a possible pump or dump.

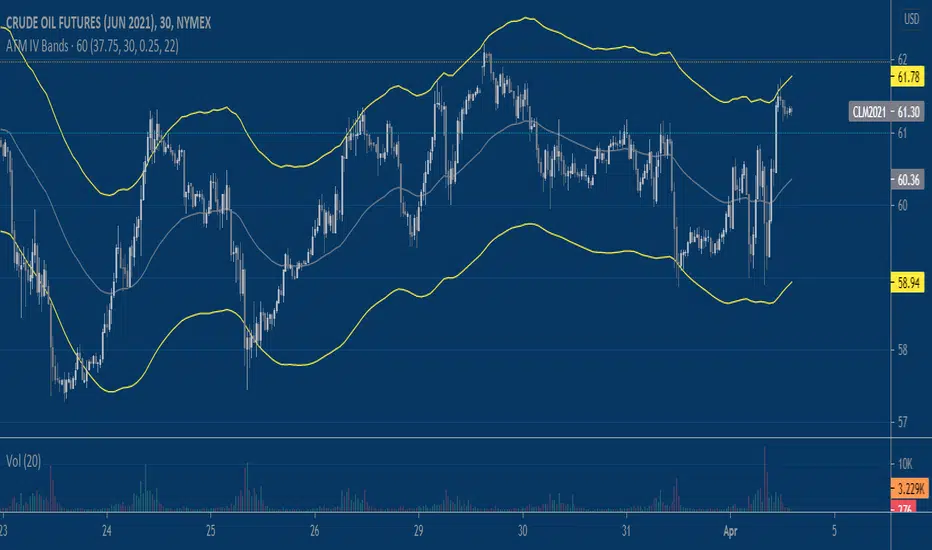
Implied Volatility BandsThis script produces price bands around an EMA based on a manually inputted Implied Volatility. The idea builds on my previous "Implied Move" script which helps visualize the distribution of prices that the market is 'pricing in' via options/implied volatility. It's up to the user to determine the implied volatility level they use, I like using the free version of QuikStrike that you can access via the CME Group website and then update the script's input daily. Another way to use the script is to input the implied volatility based on a forecast that you produce independently. Say implied volatility on June 2021 Crude Oil is 30% and you think it's rich by 2%, you can input 28% into the script to tweak the bands for a declining vol regime.

UM VIX30/VIX Regime & Volatility Roll Yield
SUMMARY
A front-of-the-curve volatility indicator that compares spot VIX to a synthetic 30-day VIX (VIX30) built from VX1/VX2 futures, revealing early volatility pressure, regime shifts, and roll-yield transitions. Ideal for timing long/short volatility trades in VXX, UVXY, SVIX, and VIX futures.
DESCRIPTION
This indicator compares spot VIX to a synthetic 30-day constant-maturity volatility estimate (“VIX30”) built from VX1 and VX2 futures. The VIX30/VIX Ratio reveals short-term volatility pressure and regime shifts that traditional VX1/VX2 roll-yield alone often misses.
VIX30 is constructed using true calendar-day interpolation between VX1 and VX2, with VX1% and VX2% showing the real-time weights behind the 30-day volatility anchor. The table displays the volatility regime, the VX1/VX2 weights, spot-term roll yield (VIX30/VIX), and futures-term roll yield (VX2/VX1), giving a complete, front-of-the-curve perspective on volatility dynamics.
Use this to spot early volatility expansions, collapsing contango, and regime transitions that influence VXX, UVXY, SVIX, VX options, and VIX futures.
HOW IT WORKS
The script calculates the exact calendar days to expiration for the front two VIX futures. It then applies linear interpolation to blend VX1 and VX2 into a 30-day constant-maturity synthetic volatility measure (“VIX30”). Comparing VIX30 to spot VIX produces the VIX30/VIX Ratio, which highlights short-term volatility pressure and regime direction. A full term-structure table summarizes regime, VX1%/VX2% weights, and both spot-term and futures-term roll yields.
DEFAULT SETTINGS
VX1! and VX2! are used by default for front-month and second-month futures. These may be manually overridden if TradingView rolls contracts early. The default timeframe is 30 minutes, and the VIX30/VIX Ratio uses a 21-period EMA for regime smoothing. The historical threshold is set to 1.08, reflecting the long-run average relationship between VIX30 and VIX.
SUGGESTED USES
• Identify early volatility expansions before they appear in VX1/VX2 roll yield.
• Confirm contango/backwardation shifts with front-of-curve context.
• Time long/short volatility trades in VXX, UVXY, SVIX, and VX options.
• Monitor regime transitions (Low → Cautionary → High) to anticipate trend inflections.
• Combine with price action, Nadaraya-Watson trends, or MA color-flip systems for higher-confidence entries.
• MA red → green flips may signal opportunities to short volatility or increase equity exposure.
• MA green → red flips may signal opportunities to go long volatility, reduce equity exposure, or take short-equity positions.
ALERTS
Alerts trigger when the ratio crosses above or below the historical threshold or when the moving-average slope flips direction. A green flip signals rising volatility pressure; a red flip signals fading or collapsing volatility. These alert conditions can be used to automate long/short volatility bias shifts or trade-entry notifications.
FURTHER HINTS
• Increasing orange/red in the table suggests an emerging higher-volatility environment.
• SVIX (inverse volatility ETF) can trend strongly when volatility decays; on a 6-hour chart, MA green flips often align with attractive short-volatility opportunities.
• For long-volatility trades, consider shrinking to a 30-minute chart and watching for MA green → red flips as early entry cues.
• Experiment with different timeframes and smoothing lengths to match your trading style.
• Higher VIX30/VIX and VX2/VX1 roll yields generally imply faster decay in VXX, UVXY, and UVIX — or stronger upside momentum in SVIX.
• The author likes the 6-hour chart for short vol, and the 30-minute chart for long vol. Long vol trades are fast and furious so you want to be quick.

[AlbaTherium] MTF Volatility Edge Zones Premium for Price Action Volatility Edge Zones Premium for Price Action (HTF)
The MTF Volatility Edge Zones Premium for Price Action is an advanced Multiple Timeframes (MTF) trading indicator that combines the power of volume analysis with price action, designed to reveal key volatility zones and assess market participants’ engagement levels . This tool offers unique insights into the dynamics of higher timeframes (HTF), helping traders identify critical zones of decision-making, such as potential reversals, continuations, or breakout areas.
Introduction to the MTF Volatility Edge Zones Premium
This indicator is built upon a deep understanding of the interaction between price action and volume. By mapping volume data onto price action, Volatility Edge Zones Premium (HTF) pinpoints areas of heightened market engagement. These zones represent where buyers and sellers have shown significant activity, allowing traders to identify market intent and anticipate key movements.
Key Features:
Higher Timeframe Analysis: Focuses on significant price and volume interactions over HTFs (e.g., 4H, Daily, Weekly) for a broader perspective on market trends.
Volatility Zones : Highlights areas where market participants show increased activity, signaling potential market turning points or strong continuations.
Volume-Driven Insights: Tracks the behavior of aggressive buyers and sellers, showing their engagement levels relative to price changes.
Overlayon Price Action: Provides a clear and actionable visual representation of volatility and engagement zones directly on price charts.
Chapter 1: Understanding Volatility and Engagement
1.1 Volatility Edge Zones
Volatility Edge Zones are areas where price and volume interact to signal potential changes in market direction or momentum. These zones are derived from high-volume clusters where significant market activity occurs.
1.2 Participant Engagement
Market participants can be categorized based on their level of engagement in these zones:
Aggressive Buyers: Represented by sharp spikes in volume and upward price action.
Aggressive Sellers: Represented by high volume during downward price movement.
Passive Participants: Identified in zones of consolidation or low volatility.
By isolating these behaviors, traders can gain a clearer picture of market sentiment and the relative strength of buyers versus sellers.
Chapter 2: The Principle of Volume and Price Interplay
2.1 Volume as a Leading Indicator
Volume often precedes price movements, and the Volatility Edge Zones Premium captures this relationship by overlaying volume activity onto price charts. This allows traders to:
Identify where volume supports price movement (trend confirmation).
Spot divergences where price moves without volume support (potential reversals).
2.2 The Role of Higher Timeframes
HTFs filter out market noise, revealing macro trends and key levels of engagement. The indicator uses this perspective to highlight long-term volatility zones, helping traders align their strategies with the broader market context.
Chapter 3: Visualizing Volatility Edge Zones
3.1 Color-Coded Zones for Engagement
The indicator uses a color-coded system to represent volatility zones and market engagement levels. These colors correspond to different market conditions:
Red Zones: High selling pressure and aggressive bearish activity.
Blue Zones: High buying pressure and aggressive bullish activity.
Yellow Zones: Transitional zones, representing indecision or balance between buyers and sellers.
White Zones: Neutral areas, where low engagement is observed but could serve as potential breakout points.
3.2 Key Metrics Tracked
Volume Clusters: Areas of concentrated buying or selling activity.
Directional Bias: Net buying or selling dominance.
Momentum Shifts: Sudden changes in volume relative to price action.
These metrics provide actionable insights into market dynamics, making it easier to predict key movements.
Chapter 4: Practical Applications in Trading
4.1 Identifying High-Impact Zones
By focusing on HTFs, traders can use the Volatility Edge Zones Premium to identify high-impact areas where market participants are most engaged. These zones often align with:
Support and Resistance Levels: High-volume areas that act as barriers or catalysts for price movement.
Breakout Points: Zones of heightened volatility where price is likely to escape consolidation.
4.2 Detecting Bull and Bear Campaigns
The indicator highlights early signs of bullish or bearish campaigns by analyzing volume surges in critical volatility zones. These campaigns often signal the beginning of significant trends.
Chapter 5: Real-World Examples and Strategies
5.1 Spotting Market Reversals
Real-world examples demonstrate how the indicator can identify volatility zones signaling potential reversals, allowing traders to enter positions early.
5.2 Riding the Trend
By tracking volatility zones in alignment with HTF trends, traders can maximize profit potential by entering during periods of high engagement and riding the trend until it weakens.
Conclusion
The MTF Volatility Edge Zones Premium for Price Action is an essential tool for traders looking to master market dynamics through a combination of volume and price action analysis. By focusing on higher timeframes and overlaying volatility zones onto price charts, this indicator provides unparalleled insights into market participant engagement.
Whether you’re trading intraday, swing, or long-term strategies, the MTF Volatility Edge Zones Premium equips you with the information needed to make confident and precise trading decisions. Stay tuned as we continue to enhance this tool for even greater accuracy and usability.

Expected Move w/ Volatility Panel (advanced) [Loxx]This indicator shows the expected range of movement of price given the assumption that price is log-normally distributed. This includes 3 multiples of standard deviation and 1 user selected level input as a multiple of standard deviation. Expected assumes that volatility remains static on the next bar. In reality, this may or may not be the case, so use caution when making broad assumptions about the levels shown when using this indicator. However, these levels match the same levels on Loxx's backtests and Multi-Panel indicator. These static levels are used as the take profit targets and stoploss on all Loxx's scripts previously posted.
This indicator can be be used on all timeframes, but the internal timeframe must be higher than the current timeframe or an error is thrown. The purpose for internal MTF is so that you can track the deviation range from higher timeframes on lower timeframes. When "current bar" is selected, this indicator will change with live prices changes. This is useful if you wish to enter a trade before the current bar closes and need to know the deviation ranges before the close. Current bar is also useful to see the past ranges of literally that bar. When "past bar" is selected, then the values shown on the current bar are values that were calculated on the last bar. The previous bar setting is useful to track price changes with the assumption that you entered a trade at the close of the previous bar. The default set to the previous bar. (careful, this default setting won't match Loxx's Muti-Panel tool since the Multi-Panel is built using the current bar. To make them match, you must change this setting to current bar)
I've included the ability for you to smooth the output around a moving average. Included are Loxx's Moving Averages. There are 41 to choose from. See more details here:
Smoothing applied yielding Keltner Channels
Also included are various UI options to manipulate line styling and colors.
Volatility Panel
Shows information about user selected volatility included confidence range of the chosen volatility. The following volatility types are included with additional volatility types to added in future releases.
Close-to-Close
Close-to-Close volatility is a classic and most commonly used volatility measure, sometimes referred to as historical volatility .
Volatility is an indicator of the speed of a stock price change. A stock with high volatility is one where the price changes rapidly and with a bigger amplitude. The more volatile a stock is, the riskier it is.
Close-to-close historical volatility calculated using only stock's closing prices. It is the simplest volatility estimator. But in many cases, it is not precise enough. Stock prices could jump considerably during a trading session, and return to the open value at the end. That means that a big amount of price information is not taken into account by close-to-close volatility .
Despite its drawbacks, Close-to-Close volatility is still useful in cases where the instrument doesn't have intraday prices. For example, mutual funds calculate their net asset values daily or weekly, and thus their prices are not suitable for more sophisticated volatility estimators.
Parkinson
Parkinson volatility is a volatility measure that uses the stock’s high and low price of the day.
The main difference between regular volatility and Parkinson volatility is that the latter uses high and low prices for a day, rather than only the closing price. That is useful as close to close prices could show little difference while large price movements could have happened during the day. Thus Parkinson's volatility is considered to be more precise and requires less data for calculation than the close-close volatility .
One drawback of this estimator is that it doesn't take into account price movements after market close. Hence it systematically undervalues volatility . That drawback is taken into account in the Garman-Klass's volatility estimator.
Garman-Klass
Garman Klass is a volatility estimator that incorporates open, low, high, and close prices of a security.
Garman-Klass volatility extends Parkinson's volatility by taking into account the opening and closing price. As markets are most active during the opening and closing of a trading session, it makes volatility estimation more accurate.
Garman and Klass also assumed that the process of price change is a process of continuous diffusion (geometric Brownian motion). However, this assumption has several drawbacks. The method is not robust for opening jumps in price and trend movements.
Despite its drawbacks, the Garman-Klass estimator is still more effective than the basic formula since it takes into account not only the price at the beginning and end of the time interval but also intraday price extremums.
Researchers Rogers and Satchel have proposed a more efficient method for assessing historical volatility that takes into account price trends. See Rogers-Satchell Volatility for more detail.
Rogers-Satchell
Rogers-Satchell is an estimator for measuring the volatility of securities with an average return not equal to zero.
Unlike Parkinson and Garman-Klass estimators, Rogers-Satchell incorporates drift term (mean return not equal to zero). As a result, it provides a better volatility estimation when the underlying is trending.
The main disadvantage of this method is that it does not take into account price movements between trading sessions. It means an underestimation of volatility since price jumps periodically occur in the market precisely at the moments between sessions.
A more comprehensive estimator that also considers the gaps between sessions was developed based on the Rogers-Satchel formula in the 2000s by Yang-Zhang. See Yang Zhang Volatility for more detail.
Yang-Zhang
Yang Zhang is a historical volatility estimator that handles both opening jumps and the drift and has a minimum estimation error.
We can think of the Yang-Zhang volatility as the combination of the overnight (close-to-open volatility ) and a weighted average of the Rogers-Satchell volatility and the day’s open-to-close volatility . It considered being 14 times more efficient than the close-to-close estimator.
Garman-Klass-Yang-Zhang
Garman Klass is a volatility estimator that incorporates open, low, high, and close prices of a security.
Garman-Klass volatility extends Parkinson's volatility by taking into account the opening and closing price. As markets are most active during the opening and closing of a trading session, it makes volatility estimation more accurate.
Garman and Klass also assumed that the process of price change is a process of continuous diffusion (geometric Brownian motion). However, this assumption has several drawbacks. The method is not robust for opening jumps in price and trend movements.
Despite its drawbacks, the Garman-Klass estimator is still more effective than the basic formula since it takes into account not only the price at the beginning and end of the time interval but also intraday price extremums.
Researchers Rogers and Satchel have proposed a more efficient method for assessing historical volatility that takes into account price trends. See Rogers-Satchell Volatility for more detail.
Exponential Weighted Moving Average
The Exponentially Weighted Moving Average (EWMA) is a quantitative or statistical measure used to model or describe a time series. The EWMA is widely used in finance, the main applications being technical analysis and volatility modeling.
The moving average is designed as such that older observations are given lower weights. The weights fall exponentially as the data point gets older – hence the name exponentially weighted.
The only decision a user of the EWMA must make is the parameter lambda. The parameter decides how important the current observation is in the calculation of the EWMA. The higher the value of lambda, the more closely the EWMA tracks the original time series.
Standard Deviation of Log Returns
This is the simplest calculation of volatility . It's the standard deviation of ln(close/close(1))
Pseudo GARCH(2,2)
This is calculated using a short- and long-run mean of variance multiplied by θ.
θavg(var ;M) + (1 − θ) avg (var ;N) = 2θvar/(M+1-(M-1)L) + 2(1-θ)var/(M+1-(M-1)L)
Solving for θ can be done by minimizing the mean squared error of estimation; that is, regressing L^-1var - avg (var; N) against avg (var; M) - avg (var; N) and using the resulting beta estimate as θ.
Average True Range
The average true range (ATR) is a technical analysis indicator, introduced by market technician J. Welles Wilder Jr. in his book New Concepts in Technical Trading Systems, that measures market volatility by decomposing the entire range of an asset price for that period.
The true range indicator is taken as the greatest of the following: current high less the current low; the absolute value of the current high less the previous close; and the absolute value of the current low less the previous close. The ATR is then a moving average, generally using 14 days, of the true ranges.
True Range Double
A special case of ATR that attempts to correct for volatility skew.
Chi-squared Confidence Interval:
Confidence interval of volatility is calculated using an inverse CDF of a Chi-Squared Distribution. You can change the volatility input used to either realized, upper confidence interval, or lower confidence interval. This is included in case you'd like to see how far price can extend if volatility hits it's upper or lower confidence levels. Generally, you'd just used realized volatility , so I wouldn't change this setting.
Inverse CDF of a Chi-Squared Distribution
The chi-square distribution is a one-parameter family of curves. The parameter ν is the degrees of freedom.
The icdf of the chi-square distribution is
x=F^−1(p∣ν) = {x:F(x∣ν) = p}
where
p=F(x∣ν)= ∫ (t^(v-2)/2 * e^t/2) / (2^(v/2) / Γ(v/2))
ν is the degrees of freedom, and Γ( · ) is the Gamma function. The result p is the probability that a single observation from the chi-square distribution with ν degrees of freedom falls in the interval .
Related Indicators
Multi-Panel: Trade-Volatility-Probability
Variety Distribution Probability Cone

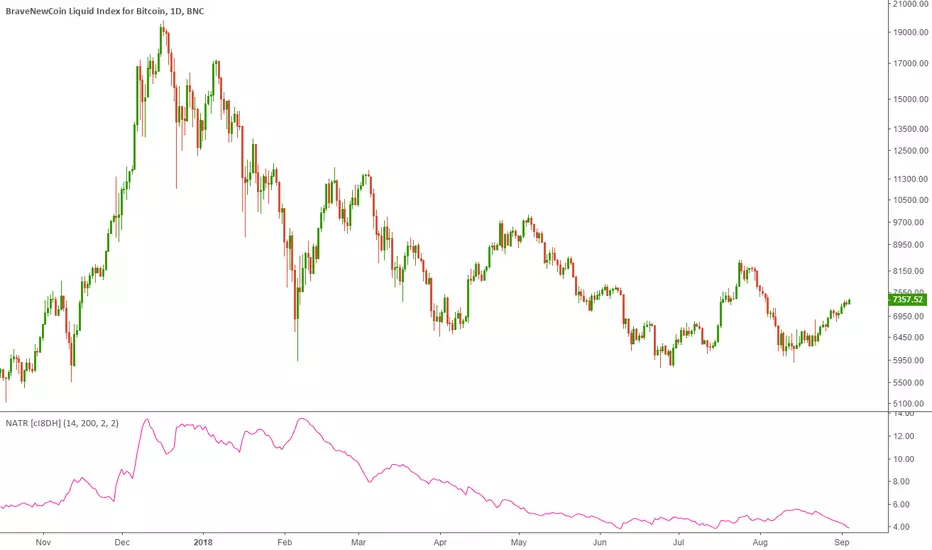
Normalized Average True Range (NATR) (Volatility) [cI8DH]As you can see in the chart below, regular ATR is not useful for long term analysis. Normalizing it, fixes the issue. This indicator can be used to measure absolute volatility. It has a built-in stochastic as well for relative volatility. ATR counts high and low in the equation unlike Bolinger Band Width.
Stochastic:
ATR Volatility and Trend AnalysisATR Volatility and Trend Analysis
Unlock the power of the Average True Range (ATR) with the ATR Volatility and Trend Analysis indicator. This comprehensive tool is designed to provide traders with a multi-faceted view of market dynamics, combining volatility analysis, dynamic support and resistance levels, and trend detection into a single, easy-to-use indicator.
How It Works
The ATR Volatility and Trend Analysis indicator is built upon the core concept of the ATR, a classic measure of market volatility. It expands on this by providing several key features:
Dynamic ATR Bands: The indicator plots three sets of upper and lower bands around the price. These bands are calculated by multiplying the current ATR value by user-defined multipliers. They act as dynamic support and resistance levels, widening during volatile periods and contracting during calm markets.
Volatility Breakout Signals: Identify potential breakouts with precision. The indicator generates a signal when the current ATR value surges above its own moving average by a specified threshold, indicating a significant increase in volatility that could lead to a strong price move.
Trend Detection: The indicator determines the market trend by analyzing both price action and ATR behavior. A bullish trend is signaled when the price is above its moving average and volatility is increasing. Conversely, a bearish trend is signaled when the price is below its moving average and volatility is increasing.
How to Use the ATR Multi-Band Indicator
Identify Support and Resistance: Use the ATR bands as key levels. Price approaching the outer bands may indicate overbought or oversold conditions, while a break of the bands can signal a strong continuation.
Confirm Breakouts: Look for a volatility breakout signal to confirm the strength behind a price move. A breakout from a consolidation range accompanied by a volatility signal is a strong indicator of a new trend.
Trade with the Trend: Use the background coloring and trend signals to align your trades with the dominant market direction. Enter long positions during confirmed bullish trends and short positions during bearish trends.
Set Up Alerts: The indicator includes alerts for band crosses, trend changes, and volatility breakouts, ensuring you never miss a potential trading opportunity.
What makes it different?
While many indicators use ATR, the ATR Volatility and Trend Analysis tool is unique in its integration of multiple ATR-based concepts into a single, cohesive system. It doesn't just show volatility; it interprets it in the context of price action to deliver actionable trend and breakout signals, making it a complete solution for ATR-based analysis.
Disclaimer
This indicator is designed as a technical analysis tool and should be used in conjunction with other forms of analysis and proper risk management.
Past performance does not guarantee future results, and traders should thoroughly test any strategy before implementing it with real capital.

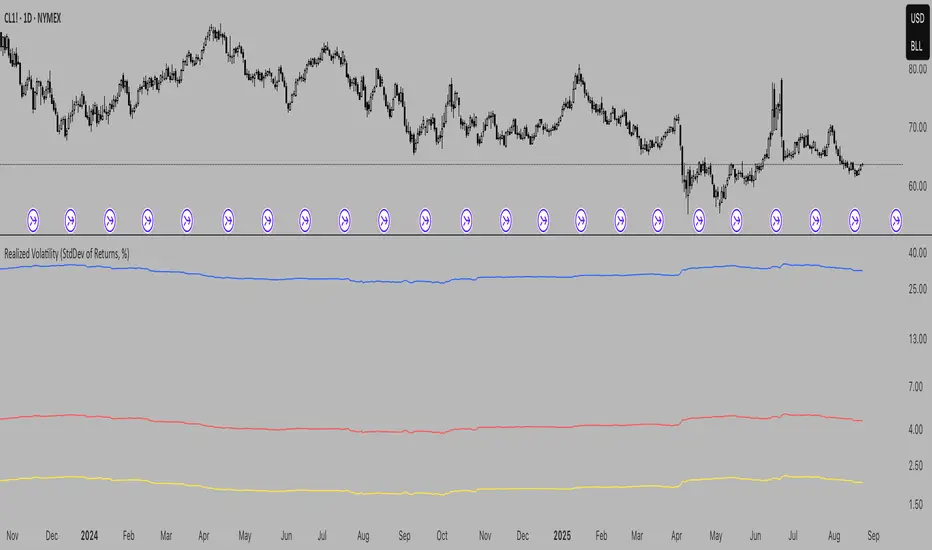
Realized Volatility (StdDev of Returns, %)Realized Volatility (StdDev of Returns, %)
This indicator measures realized (historical) volatility by calculating the standard deviation of log returns over a user-defined lookback period. It helps traders and analysts observe how much the price has varied in the past, expressed as a percentage.
How it works:
Computes close-to-close logarithmic returns.
Calculates the standard deviation of these returns over the selected lookback window.
Provides three volatility measures:
Daily Volatility (%): Standard deviation over the chosen period.
Annualized Volatility (%): Scaled using the square root of the number of trading days per year (default = 250).
Horizon Volatility (%): Scaled to a custom horizon (default = 5 days, useful for short-term views).
Inputs:
Lookback Period: Number of bars used for volatility calculation.
Trading Days per Year: Used for annualizing volatility.
Horizon (days): Adjusts volatility to a shorter or longer time frame.
Notes:
This is a statistical measure of past volatility, not a forecasting tool.
If you change the scale to logarithmic, the indicator readibility improves.
It should be used for analysis in combination with other tools and not as a standalone signal.
Average VolatilityThis script offers a unique and practical approach to visualizing average volatility by calculating a simple moving average of the daily high-low ranges, directly reflecting price fluctuations over a user-defined period. Unlike standard volatility indicators, it provides customizable options such as adjustable period length, display of absolute and percentage volatility values, and flexible text formatting for clear and tailored insights. This makes it a valuable tool for traders seeking to better understand market volatility trends and manage risk more effectively. Its straightforward visualization supports informed decision-making across various instruments and timeframes.
The indicator displays the average volatility over a configurable period as a bar chart (originally designed for daily intervals). It visualizes the price range (difference between high and low) across a selectable number of periods, as well as its ratio to the closing price, offering various customization options.
For many traders, assets with daily moves of 1% or more may offer greater profit opportunities, especially for short-term trading strategies. Instruments with lower volatility are generally less favored and often not recommended in such approaches due to reduced trading potential. Please note that higher volatility also implies increased risk, and potential losses can be significant. Always use proper risk management.
Detailed description:
The script calculates average volatility as a simple moving average of the high-low ranges (default: 5 periods, intended for daily timeframes). Volatility can be shown as either a bar or line chart. Users can choose to display the absolute volatility values and/or the volatility expressed as a percentage of the closing price. Text size and spacing between labels are adjustable to ensure readability across different instruments. Additionally, the last (unconfirmed) bar can be shown or hidden, since its value depends on the current price. Overall, the script provides a flexible and clear visualization of an instrument’s volatility.
---
Russian:
Индикатор отображает среднюю волатильность как простое скользящее среднее диапазонов «максимум-минимум» (по умолчанию 5 периодов, предназначено для дневных таймфреймов). Волатильность может отображаться в виде столбчатой или линейной диаграммы. Пользователи могут выбрать отображение абсолютных значений волатильности и/или волатильности, выраженной в процентах от цены закрытия. Размер текста и расстояния между надписями регулируются для удобочитаемости на разных инструментах. Кроме того, последний (неподтверждённый) столбец можно показать или скрыть, так как его значение зависит от текущей цены. В общем, скрипт обеспечивает гибкое и наглядное отображение волатильности инструмента.
Активы с волатильностью от 1% и выше дают больше возможностей для краткосрочной торговли, но риск также выше. Инструменты с низкой волатильностью не рекомендуются для таких подходов из-за ограниченного торгового потенциала и сложности в реализации прибыльных сделок. Всегда применяйте риск-менеджмент.
---
Spanish:
El script calcula la volatilidad promedio como un promedio móvil simple de las diferencias entre máximos y mínimos (por defecto 5 periodos, pensado para intervalos diarios). La volatilidad puede mostrarse como gráfico de barras o de líneas. El usuario puede elegir mostrar los valores absolutos de la volatilidad y/o los valores expresados en porcentaje respecto al precio de cierre. El tamaño del texto y el espacio entre las etiquetas son ajustables para garantizar la legibilidad en diferentes instrumentos. Además, se puede mostrar u ocultar la última barra (no confirmada), ya que su valor depende del precio actual. En conjunto, el script proporciona una visualización flexible y clara de la volatilidad del instrumento.
Los activos con una volatilidad del 1% o más ofrecen mayores oportunidades para el trading a corto plazo, pero también conllevan un mayor riesgo. Los instrumentos con baja volatilidad no se recomiendan para este tipo de estrategias debido a su limitado potencial de trading y la dificultad para obtener ganancias. Siempre utilice una gestión de riesgos adecuada.

[NIC] Volatility Anomaly Indicator (Inspired by Jeff Augen)Volatility Anomaly Indicator (Inspired by Jeff Augen)
The Volatility Anomaly Indicator, inspired by Jeff Augen’s The Volatility Edge in Options Trading, helps traders spot price distortions by analyzing volatility imbalances. It compares short-term (10-day) and long-term (30-day) historical volatility (HV), plotting the ratio in a subgraph with clusters of dots to highlight anomalies—red for volatility spikes (potential sells) and green for calm periods (potential buys).
Originality: This indicator uniquely adapts Augen’s volatility concepts into a visual tool, focusing on relative volatility distortions rather than absolute levels, making it ideal for volatile assets like $TQQQ.
Features:
Calculates the ratio of short-term to long-term volatility.
Detects spikes (ratio > 1.5) and calm periods (ratio < 0.67) with customizable thresholds.
Plots volatility ratio as a blue line, with red/green dots for anomalies.
Includes optional buy/sell signals on the main chart (if overlay is enabled).
How It Works
The indicator computes historical volatility using log returns, then calculates the short-term to long-term volatility ratio. Spikes and calm periods are marked with dots in the subgraph, and threshold lines (1.5 and 0.67) provide context. Buy signals (green triangles) trigger during calm periods, and sell signals (red triangles) during spikes.
How to Use
Apply to any chart (e.g., NASDAQ:TQQQ daily).
Adjust inputs: Short Volatility Period (10), Long Volatility Period (30), Volatility Spike Threshold (1.5).
Watch for red dot clusters (spikes, potential sells) and green dot clusters (calm, potential buys).
Combine with price action or RSI for confirmation.
Why Use This Indicator?
Focuses on volatility-driven price inefficiencies.
Clear visualization with dot clusters.
Customizable for different assets and timeframes.
Limitations
Not a standalone system; requires confirmation.
May give false signals in choppy markets.
