Cari dalam skrip untuk "Volume"
Volume PressureThis script modified from @the_akechi's VolumePressure
The sum of buying and selling volume is NOT always equal to the total volume using the original script because the 2 columns are overlaid, not stacked

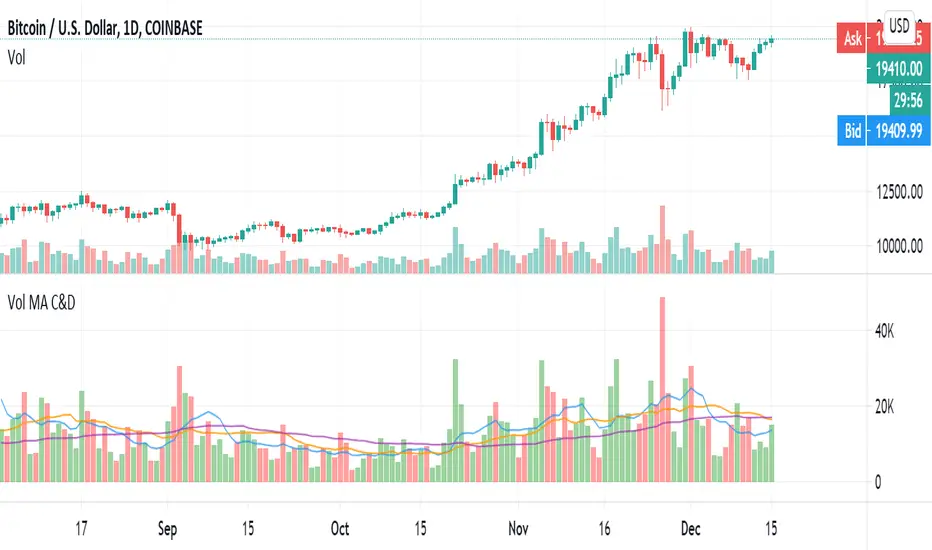
Volume & Configurable Moving Averages [LevelUp]Volume with Configurable Moving Averages displays volume based on the current timeframe. For example, on a daily chart the volume shown is for the day. On a weekly chart, the volume is cumulative for the week.
There is also an option to configure the volume moving average lengths. The default for a daily chart is to calculate the 50-day moving average. On a weekly chart, the default is the 10-week moving average.
Features:
■ Configure moving average lengths for various chart timeframes.
■ Set width of volume bars.
■ Option to set bar color based on the previous close.
Learning Pine Script / Creating Your Own Indicators
One goal of this indicator is help others who are interested to learn Pine Script. The code is open source and I've included an abundance of comments. In future updates, I'll show additional Pine Script features and scripting concepts.

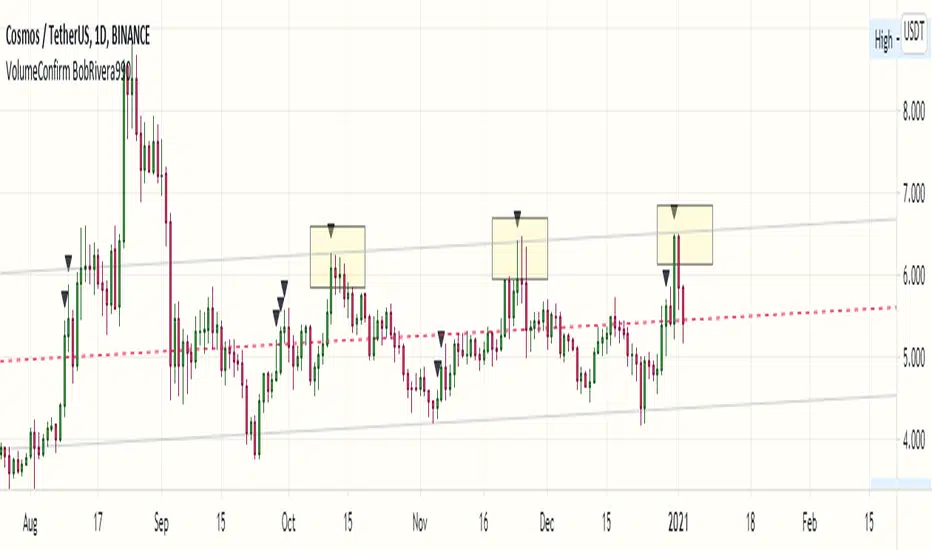
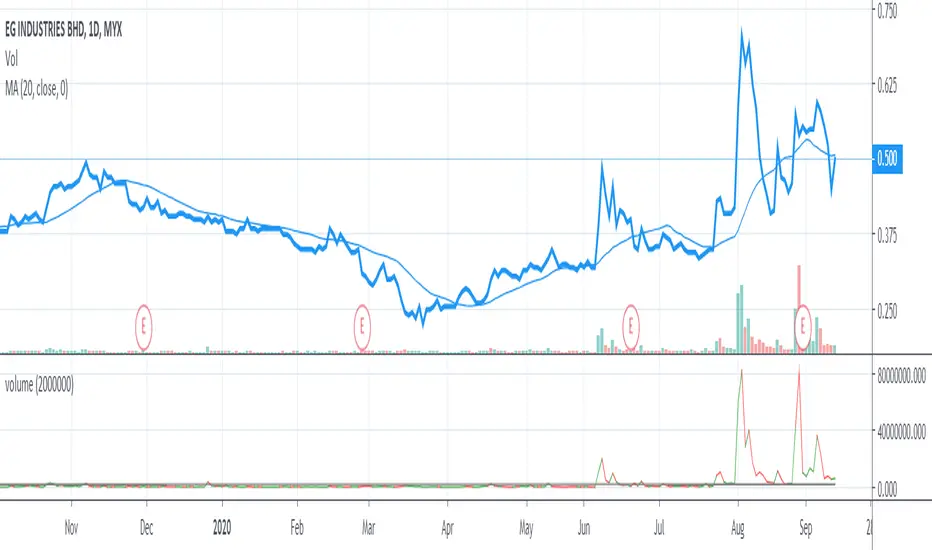
Volume Confirmation Signal by BobRivera990The purpose of this script is to determine the response of trading volume to price action
This is not an indicator but a set of four signals
1 - Bullish Strength Signal (Upward Green Triangle) :
If the resistance is broken at the same time is valid
this signal indicates the continuation of the bullish trend
the trading volume is relatively high.
If the bar is closed above the resistance level, It will probably turn into support.
2 - Bullish Reversal Signal (Upward Black Triangle) :
if the bar is closed above the support level is valid
this signal indicates trend reversal after a bearish candle
the trading volume is very high.
3 - Bearish Strength Signal (Downward Red Triangle) :
If the Support is broken at the same time is valid
this signal indicates the continuation of the bearish trend
the trading volume is relatively high.
If the bar is closed below the support level, It will probably turn into resistance.
4 - Bearish Reversal Signal (Downward Black Triangle) : if the bar is closed below the resistance level is valid
this signal indicates trend reversal after a bullish candle
the trading volume is very high.
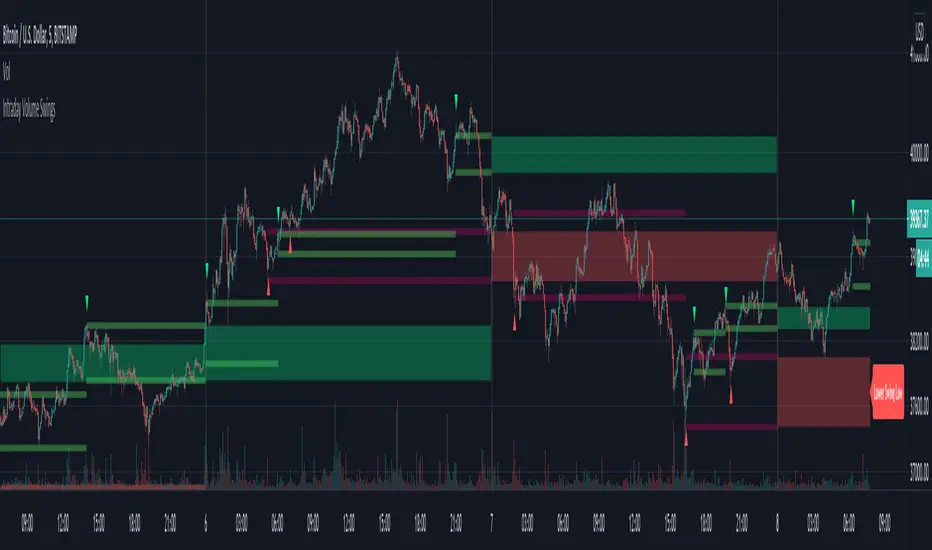
Intraday Volume SwingsVolume swings are defined as increasing volume and higher highs/lower lows over a minimum of three bars.
This script tracks volume swings over an intraday chart and stores the final lowest low swing / highest high swing over the course of the day. The final high swing and low swing are then plotted over the following day as possible retracement / support & resistance levels.
Intraday levels for the current day can also be displayed, which may or may not be the final swings for the day, but are also possible areas of interest.
See code for additional notes.
Volume-Supported Linear Regression TrendHello Traders,
Linear Regression gives us some abilities to calculate the trend and if we combine it with volume then we may get very good results. Because if there is no volume support at up/downtrends then the trend may have a reversal soon. we also need to check the trend in different periods. With all this info, I developed Volume-Supported Linear Regression Trend script. The script checks linear regression of price and volume and then calculates trend direction and strength.
You have option to set Source, Short-Term Period and Long-Term Period. you can set them as you wish.
By default:
Close is used as "Source"
Short-Term Period is 20
Long-Term Period is 50
in following screenshot I tried to explain short term trend (for uptrend). Volume supports the trend? any volume pressure on trend? possible reversal? same idea while there is downtrend.
in following screenshot I tried to explain long term trend:
You can also check Positive/Negative Divergences to figure out possible reversals (to automate it, you can use Divergence for Many Indicators v4 , it has ability to check divergences on external indicators)
Enjoy!

Volume Color By Moving Average - RSJThis simple indicator paints with a darker color on the volume bar when the quantity traded is above the average of 20 periods of the volume itself, highlighting the moments when there was a large volume of deals above the average.
-----------------------------------------------------------------------------------------------------------
Este simples indicador pinta de uma cor mais escura a barra do volume quando a quantidade negociada no candle fica acima a média de 20 períodos do próprio volume, apresentando desta forma os momentos aonde houve um grande volume de negociações acima da média.

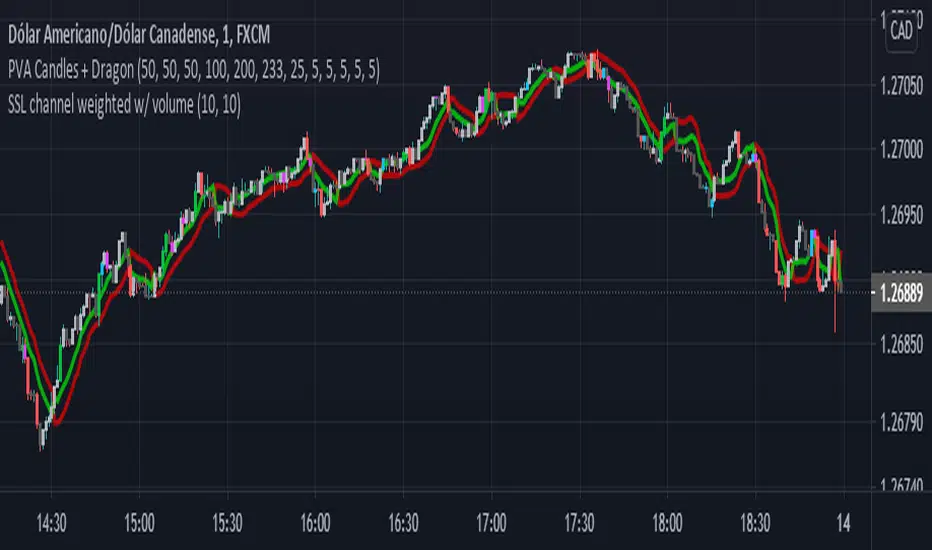
Volume Weighted SSL ChannelVolume-weighted SSl channel.
new concept of indicator that does not have in the entire library, different from SSL based on EMA or MA, this indicator can identify turns faster than a conventional indicator that only takes into account the price.
Enjoy and give the feedback.
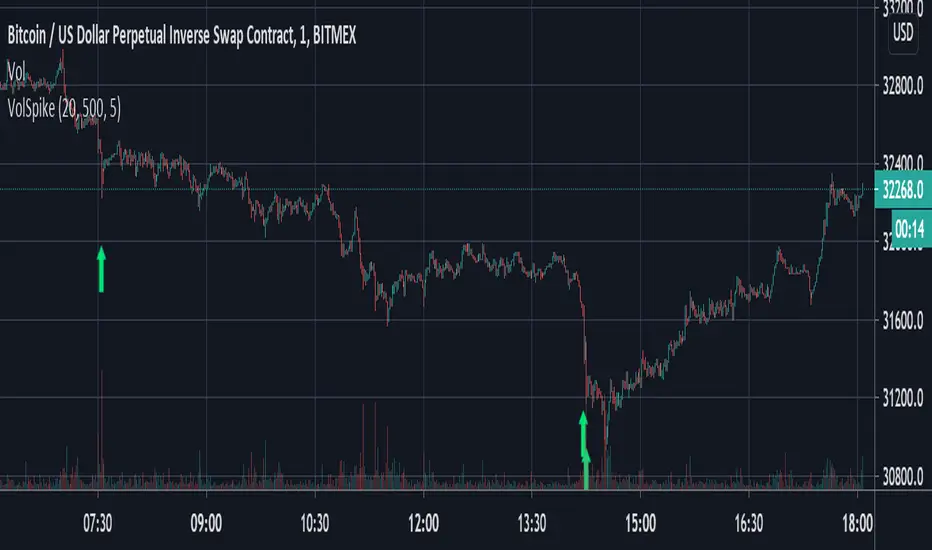
Volume Spike Strategy This is a Pine Script implementation of “Capitalize AI: Volume Spike Strategy" by Bitcoin Trading Challenge (copied with permission).
Original Capital AI formula :
If BTC/USD 1 minute volume > BTC/USD average volume in 20-1m bar by at least 500% and if BTC/USD is below the MA (5,1m,close) of BTC/USD then buy 10,000 USD WORTH of BTC/USD
Tested on XBTUSD 1 minute.
Original strategy is buy-only. Option for sells was added (enable in settings).
First published script -- comments/feedback appreciated
Volume Weighted Aggregated Premium Index v0.20.2 version of the indicator that determines the aggregate premium, weighted by volume, from all leading derivatives exchanges. The main difference was the change in the volume weighing algorithm from static to real time, and ETH was added to the indicator.
Exchanges:
Binance
OKEx
Huobi
Bybit
FTX
BitMEX
Deribit

Volume MA Convergence and DivergenceGreetings, I imagine there is already some similar scripts as this one but I couldn't find one so I decided to add something.
We are looking at convergence and divergence signals of moving-average values of 3 different volume time frames. The time frames can of course be tweaked to ones liking, I set up Vol-MA8, 20 and 50. A strong enough divergence in at least 2 of the MAs may perhaps signal an exhausting trend or the beginning of a new one. Convergence of all three to a single point, or close enough to, may signal impending volatility potentially. The latter would best be complimented with another volatility predicative indicator or correlating impending price change data. There are more signals to be studied within this single indicator such as a converging occurrence above OR below the mean, etc, etc.
@OptiSean on Twitter
Enjoy, Cheers
BE - Volume v2.8Volume´s Indicator Draft
Intend to determinate the volume strengh (whales movements) for comodities and forex
Defaults Set for a regular Volume indicator
Not so Obvious Inputs...
AV = Absolute values (if not, show as negatives, weak´s vol movements)
MA Source = Volume, Positive Vol, Negative Vol. (Identifies Upcommings Price changes)
As already said..
Its a Draft, comments will be appreciated

Volume Bars and Regions of InterestThe bars are colored according to the volume traded. The volume weights were distributed logically for a better analysis.
<0.666 low volume
0.666 to 1.333 median volume
1,333 to 2,666 high volume
> 2,666 'institutional' volume
The moving average bands are the average of the highs and lows. They show a region of interest and not just a 'line'.

Volume direction candles - JDThis indicator displays the inflow and outflow of money into a stock or security
and is calculated by constructing op or down candles according to the direction of price movement,
with a size corresponding to the volume size.
The ema bands can be used to find the mean total volume for the last short term and long term period
Enoy !
JD.
#DYOR
#NotTradingAdvice

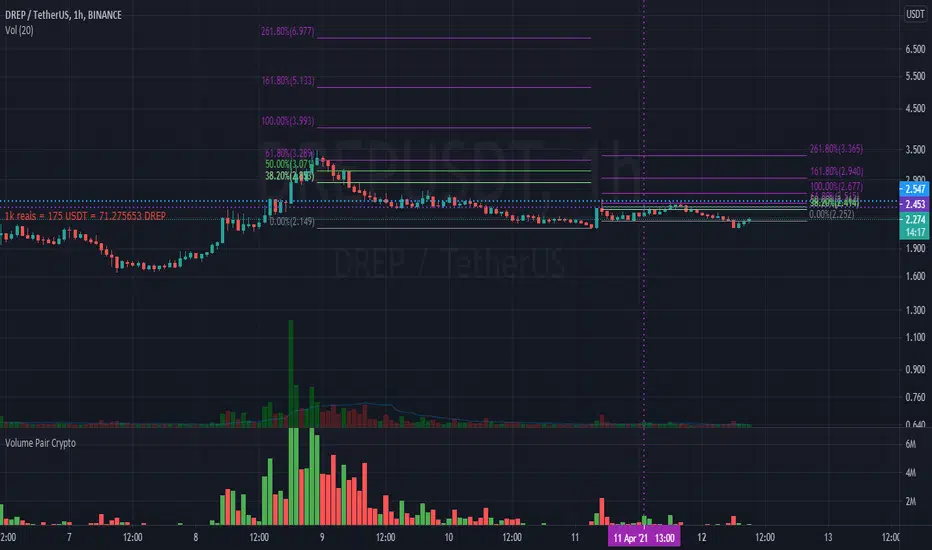
volume with PriceThis script is for calculation for volume x price. Also include with target ( default =2M).

Volume Color Bar (KETT)Highlights important bars with increased volume during the selected period. It is convenient to use for building a trend line or strong levels.

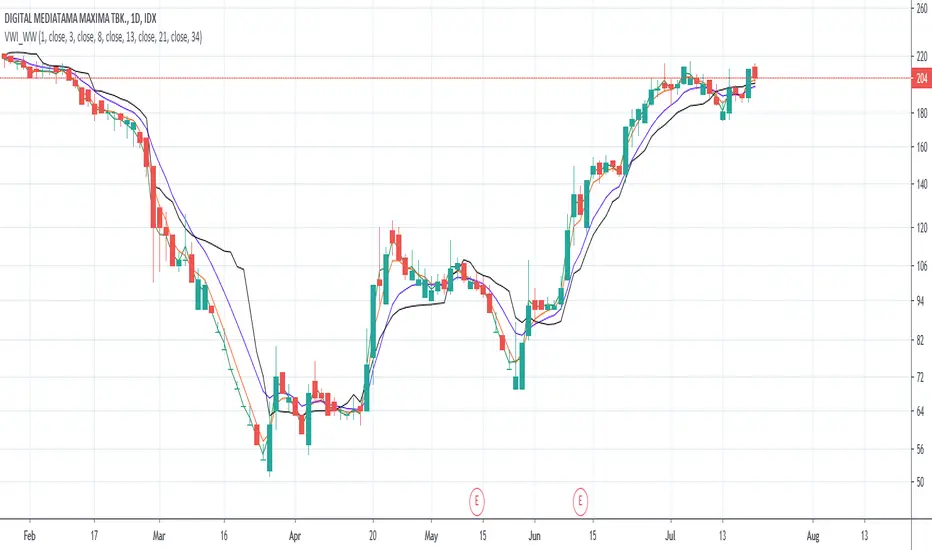
Volume-Weighted Indicators VWMA/VWAP/EMA_by WWAs traders and investors now urge to console volume factors into their price action analysis. This script is an attempt to combine volume-weighted moving average (VWMA), volume-weighted average price (VWAP), along with the exponential moving average (EMA). I have found that this indicator works quite well with the stock market.
How to use the indicator:
Buy when the VWAP and EMA lines crossing up VWMA.
Sell when the VWAP and EMA crossing down each other OR both VWAP and EMA crossing down VWAP
Any modificatio is welcomed, but please let me know.
Volume, Simple Relative Volume HighlightThis script plots volume bars and highlight bars that have an unusual activity, compare to the average (Standard: Simple Moving Average, 50 periods).
The script is useful for checking daily volume levels on equities. Where there is high volume, there is likely volatility, wich is good for day trading and swing trading entries.

Volume Moving Average - evoThis script shows regular volume bars with two separate moving averages using only bullish and only bearish candles. The moving average uses the last known value of its calculation.
Using the Heikin Ashi function will smooth the colors and moving averages (good for trends):
The crossovers are a good way to see what the dominant direction of a trend is, if you test them on your time frame and instrument they might be good to trade on their own, I have not tested this and the default settings are not tuned for that.
As always, let me know if you like it or found a good way to use it :)

Volume xSMA ModSimple Volume indicator. showing rounded ratio of Current volume and simple moving average as xSMA (read as times SMA).
Quick metric to understand the impact of volume in trends, etc.
Example:
if Vol = 50 and SMA = 5
xSMA = 50/5 = 10
Indicated as the Third Number in Volume label.

Volume AccumulationA simple tool that accumulates the trading volume of an instrument for a specified period of time.
Available modes:
Minutely
Hourly
Session
Daily
Monthly
Quarterly
Yearly

Volume Body CandlesEnglish description:
This script sets the transparency of candles body according to volume, using two metohds:
- Exact Volume of certain candle
- EMA of Volume from given candles back
Default setting are 'EMA of Volume' with 14 candles back.
If you have other scripts changing colors of candles, please turn them off to see the effect of this one.
This script is invite-only for the members of our trading group (info in signature).
---------------------------------------------------------------------------------------------------
Polish description:
Niniejszy skrypt ustawia przezroczystość korpusów świec zależnie od wolumenu, przy użyciu dwóch metod do wyboru:
- 'Exact Volume' czyli dokładnie ten sam wolumen jaki wystąpił na danej świecy
- 'EMA of Volume' czyli średnia EMA z wolumenu z ustalonej ilości świec wstecz.
Domyślnymi ustawieniamim są 'EMA of Volume' z okresu 14stu świec wstecz.
Jeśli masz włączone jakieś inne skrypty zmieniające kolory świec, proszę wyłącz je, lub wyłącz w nich ustawienia kolorujące świece, aby zobaczyć efekty tego skryptu.
Skrypt jest publikowany na zasadzie invite-only(konieczność przydzielenia dostępu na TradingView), a zatem dostępny jest tylko dla aktywnych użytkowników naszej grupy traderskiej, do której link można znaleść w mojej sygnaturze poniżej.
