Time and sales volume final 1 hello, this is a volume script that depicts the basics of time and sales onto an accurate volume scale. what this can be used for is finding reversal to enter shorts, or puts and strong bullish movement to enter longs or calls. The green indicates buying and red indicates selling inside a candlestick. obviously when securities are exchanged there is an equal amount but this works off relative to the candle close and open to help determine a certain direction.
Cari dalam skrip untuk "Volume"

Specific Bar Volume RatioSimple.
NYSE only.
0930am-1130am only.
The colors are based on the popular Zanger Ratio.
The code compares the current volume (5m candles) to the average of precisely the same candle on the same day over the past 20 trading days.
Below 60 = drying up / low (grey)
Above 60 = below average (orange)
Above 80 = average (pink)
Above 120 = High (magenta)
Above 200 = Extreme (red)
The example you see is in Central time.
Contact me if you are interested.

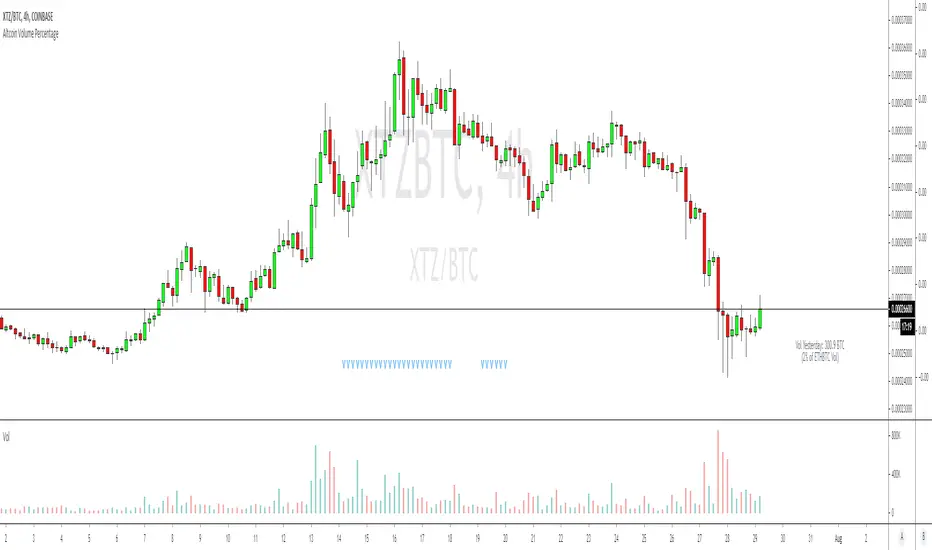
Altcoin Volume StatsShows how much BTC volume an alt has done in the past 24 hours as a label, with a comparison of that volume versus ETHBTC on Binance, as a percentage. Something I have been hoping the good people at Tradingview would add to the interface for years. It also shows some other stats in the data window on the right: i.imgur.com
Big thanks to the talented @Daveatt who helped unbake my noodle with some label code I couldn't figure out.
Tradeer Volume Change Identifier This separate indicator shows classical volume on each bar, but it can also show volume increase in three steps, every step has his own color, default setting is 33% increase by yellow, 66% by red, 100% incerase by white color. For the increase to be displayed it must be also bigger than average volume set in default by 10 MA.

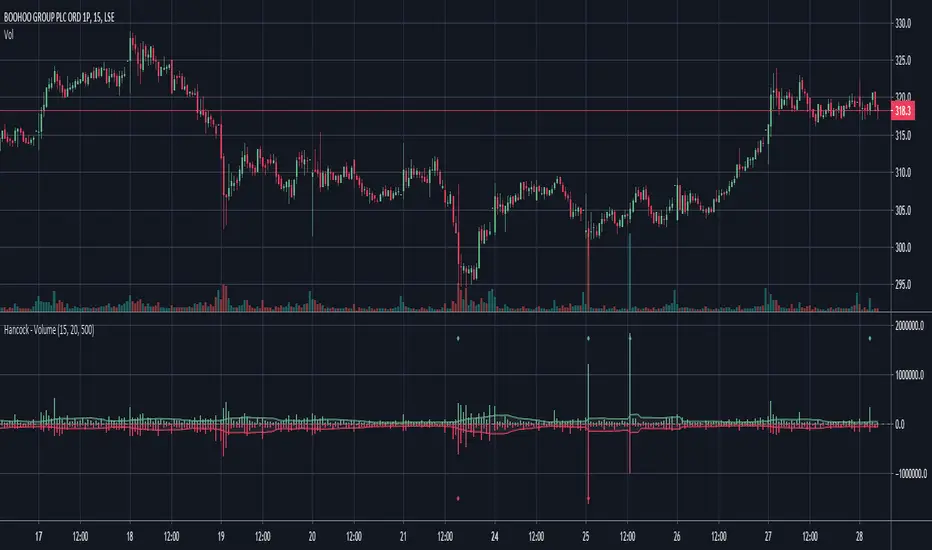
Hancock - VolumeEstimates the buy and sell volume of each candle by using a configurable lower time-frame and displays the volume in a colored histogram.
Happy trading
Hancock
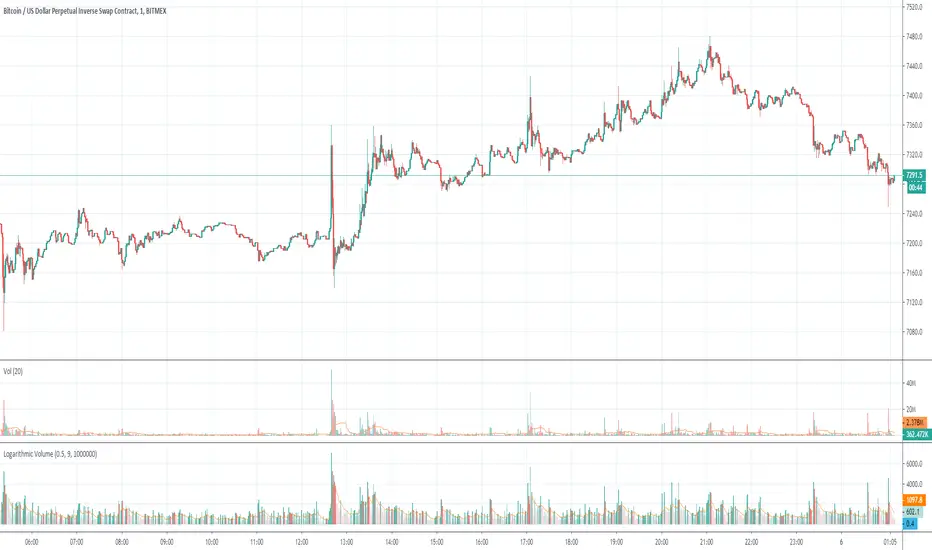
Logarithmic VolumeIn volatile markets, normal indicator suffer from volume spikes that make the rest of plot seem non-existent.
Using logarithmic exponent, this indicator normalizes the volume, so this makes it easier to read.
The obvious drawback is that it does not display the actual volume amount, only a relative value.

커스텀볼륨 - custom volume indicatorthis is custom volume for know active market status
base line is 240M of Volume and signal line is 20M of volume
if it close over active
otherside is inactive

Simple Volume VerificationEnglish
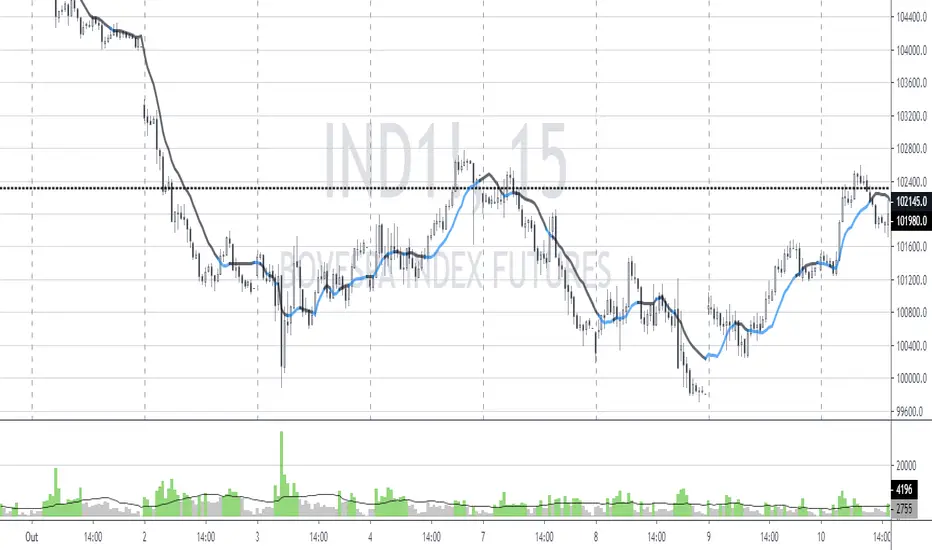
Using a simple moving average, this indicator uses a coloring rule to highlight when volume is above or below average. According to Dow's theory where volume can be used to confirm a price trend.
Português
Utilizando de uma média móvel simples, esse indicador utiliza de uma regra de coloração para destacar quando o volume está acima ou abaixo da média. Conforme teoria de Dow onde volume pode ser utilizado para confirmar uma tendencia de preço.
Espanhol
Utilizando uma média móvel simples, esse indicador utiliza uma regra de cor para destacar quando o volume está acima ou abaixo da média. Conforme teoria de Dow, onde o volume pode ser usado para confirmar uma tendência de preço.

AOO - Volumethe indicators is reading volume movements and when you see background is green, then you can go buy and your stop loss is the red background.


[PX] Volume Peak LevelsThe indicator identifies peaks in volume and plots horizontal level accordingly.
If you are looking for someone to develop your own indicator or trading strategy, don't hesitate to get in touch with me here on TradingView or below.
Contact:
www.pascal-simon.de
info@pascal-simon.de

Bitfinex BTC Volume from LONGS & SHORTSIt is an indicator to calculate the volume from LONGS and SHIORTS of Bitcoin bitcoin, to see the increase / decrease of the positive, the strength of buying and selling at a stretch
The part of the thick bar above 0 is LONGS, and the part below 0 is SHORTS increase / decrease.
A dark color means an increase in position creation, and a light color means a decrease in profit loss.
Green means buying and red means selling.
The thin bar is considered to be equivalent to Volume by the increase or decrease of the total position.
A thin black bar means real trading strength.
BitfinexのビットコインのLONGSとSHIORTSからVolumeを計算、ポジの増減、売り買いの強さを一気に見ようというインジケーターです
太いバーの0以上の部分がLONGS、0以下の部分がSHORTSの増減です。
濃い色がポジション作成で増加、薄い色が利確か損切りで減少を意味します。
緑色は買いで赤色は売りという意味です。
細いバーは総ポジションの増減でVolumeに相当すると思われます。
細い黒いバーは実質の売買の強さを意味します。


ETH World Volume (Multi-Exchange) [v2019-07-20]This is a fork of but applied to Ethereum instead of BTC

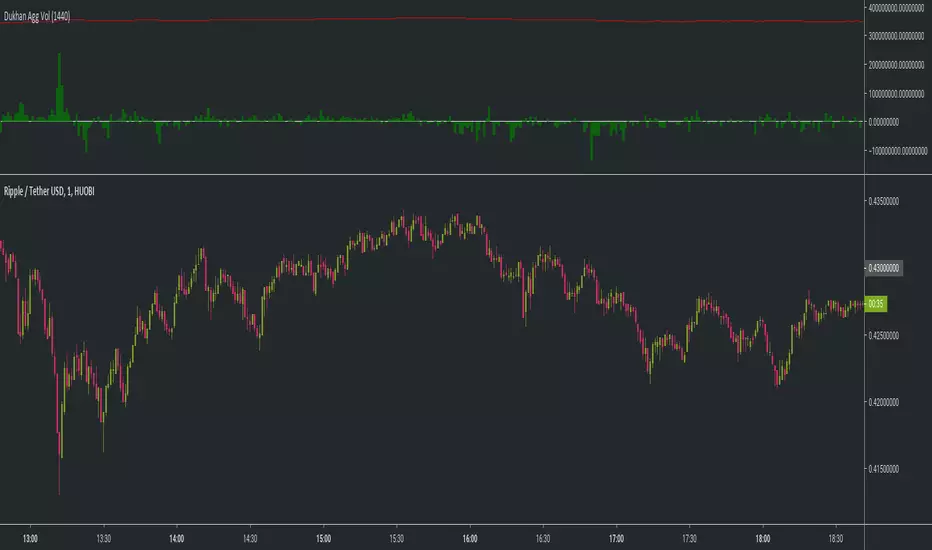
Dukhan 24 Hours rolling volume similar to exchanges Shows 24 hour rolling volume similar to the exchange - Done for BTC but works on anything
input is number of candle to calculate back
usage:
1m candle : 24h * 60 = 1440
5m candle: (24h * 60) / 5 = 288
etc
La Familia - VolumeThe realest volume indicator in the game
Support the development of new indicators:
BTC: 1LRHrA9wChPyZgCtWj3vBxv8FwHKWKmmmU
LTC: Lfw6FfeZhJofLJSackJ5uDam2BnDqh8Acp
ETH: 0xeE7abEc3303D5Ca4c05b876B2cE8E2406481365a
ZCASH: t1gSCHrcRN1GcCP2YWGh6xG9hSxSkxMoofF


