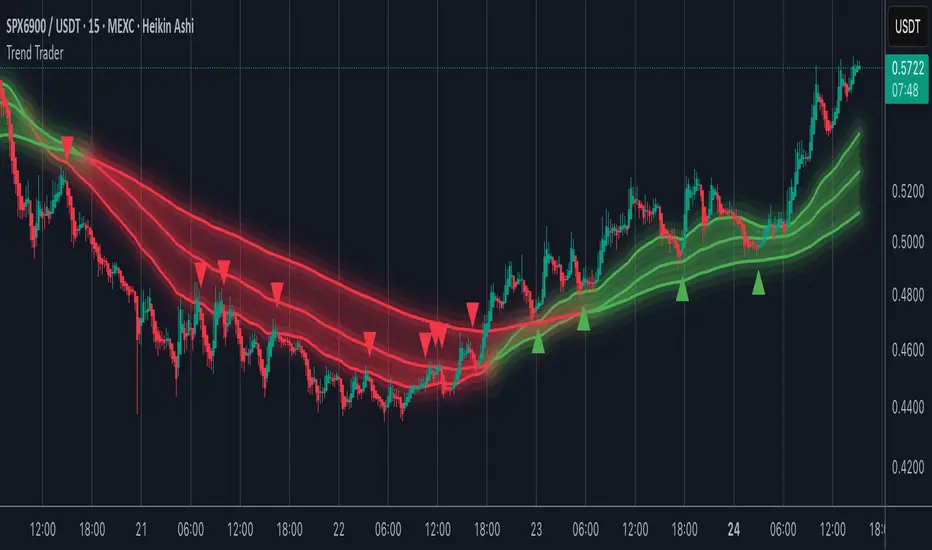
Trend TraderMost trend indicators don’t offer continuation signals or accurate bounce points, so I created this indicator that uses one of the most common trading levels (EMAs). This indicator uses the 50, 100, and 200 EMAs along with WaveTrend signals to trade trends. Buy Signals are filtered so that they only show up when the 100 EMA is above the 200. And Inverse for Sell Signals.
This indicator works well with both Stocks and Crypto. Default settings work best on 15 min, 1H, 2H, and 4H.
(Chart examples are using Heikin Ashi Candles, on Log Scale.)
*Buy and Sell Signals do not repaint.
Settings:
- Ability to show all buy and sell signals regardless of trend.
- To change the sensitivity of the buy and sell signals, change the “Average Length”
- (The lower the number the more sensitive, the higher the number the less they pop up)
- Ability to change EMA Lengths
imgur.com
Cari dalam skrip untuk "WaveTrend"
CSS_LFU_v0.1Overview:
A multi-factor, market-adaptive swing strategy designed for intraday and short-term crypto trading. It synthesizes momentum, volatility, and trend signals into a unified composite score over a configurable lookback window. The strategy leverages a modular, signal-weighted approach to ensure robust entry timing while remaining compatible with human-in-the-loop validation and algorithmic execution.
Core Modules:
AJFFRSI (RSX-based Momentum): Measures smoothed price momentum with noise-reduction filters to detect crossovers relative to the QQE trailing stop.
QQE (Quantitative Qualitative Easing RSI): A modified RSI with a dynamic trailing stop that adapts to short-term volatility, identifying exhaustion and potential reversal points.
Keltner Channel Zones: Determines overextension relative to trend, providing buy/sell zones based on ATR-banded EMA.
WaveTrend Oscillator: Confirms short-term swings and market direction through smoothed oscillator cross signals.
Rolling Composite Score: Aggregates module signals over a unified lookback (e.g., 144 bars) to normalize noise and capture consistent trends.
Signal Logic:
Each module outputs a discrete score (+1 / 0 / -1).
The rolling composite score sums all module scores over the lookback period.
Long positions trigger when the rolling score meets or exceeds the long threshold.
Short positions trigger when the rolling score meets or falls below the short threshold.
Multi-dimensional signal aggregation reduces false positives from single indicators.
Rolling lookback ensures score normalization across different volatility regimes.
Highly modular: easy to adapt modules or weights to different instruments or timeframes.
Fully compatible with automated execution pipelines, including custom exchange screener bots.
Use Case:
Ideal for quant-driven altcoin or multi-asset strategies where high-frequency validation is critical and sequential module weighting enhances trend flip detection.

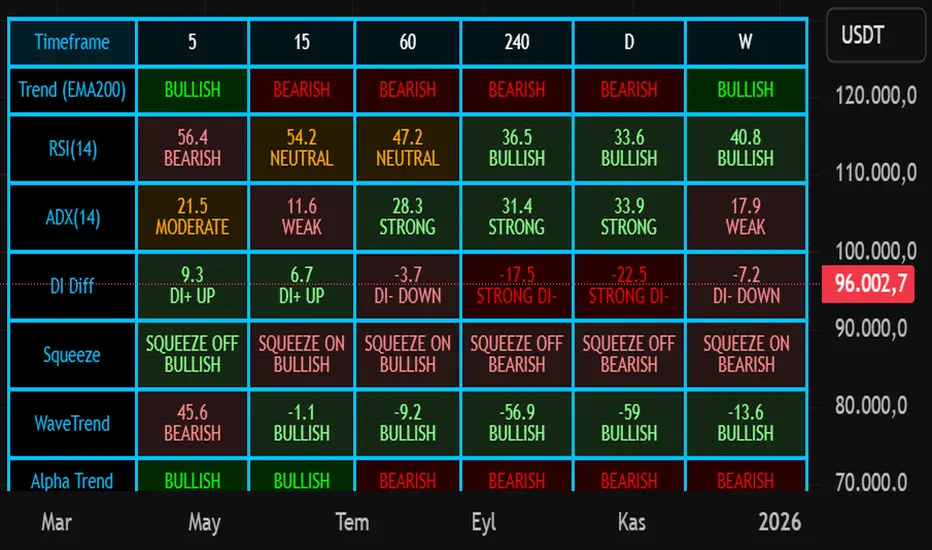
Nuh's Multi-Timeframe DashboardAll 10 indicators (EMA, RSI, ADX, RI, Squeezee, WaveTrend, Alpha Trend, SuperTrend, Stoch RSI, Vix Fix) across 7 time frames (5m, 15m, 1h, 2h, 4h, 1D, 1W) consolidated into a single table.
Cipher B Free | WaveTrend (v6)Uh.. I call this.. Mona Lisa kek. Tried creating my own version of Cipher B with Grok. Feel free to tweak to your heart's content

Hello Crypto! Modern Combo Snapshot
Unified long/short analyzer blending EMA structure, SuperTrend, WaveTrend, QQE, and volume pressure.
Background shading flags “watch” and “ready” states; optional long/short modules let you focus on one side.
Alerts fire when every checklist item aligns, while the side-panel table summarizes trend, momentum, liquidity, and overall score in real time.
Indicator → Trend Analysis
Indicator → Momentum Oscillators
Indicator → Volume Indicators
Tags:
cryptocurrency, bitcoin, altcoins, trend-following, momentum, volume, ema, supertrend, intraday, swing-trading, alerts, checklist, trading-strategy, risk-management

Modern Combo Crypto SuiteBlends long and short playbooks in one overlay with quick toggles.
Tracks EMA stacks, SuperTrend, WaveTrend, QQE, and volume to score bias.
Colors the chart background when watch/ready conditions align.
Fires alerts for imminent or fully aligned long/short setups.
Displays a live checklist table summarizing trend, momentum, and volume confidence.

SulLaLuna — HTF M2 x Ultimate BB (Fusion) 🌕 **SulLaLuna — HTF M2 x Ultimate BB (Fusion)** 🚀💵
**By SulLaLuna Trading**
(Portions of the Bollinger Band logic adapted with permission/credit from the *Ultimate Buy & Sell Indicator* by its original author — thank you for the brilliance!)
---
🧭 **What This Is**
This is not just another price-following tool.
This is **a macro liquidity detector** — a **Daily Higher Timeframe Hull Moving Average of the Global M2 Money Supply**, smoothed via lower timeframe candles (default 5m, 48 Hull length), overlaid with **Ultimate-style double Bollinger Bands** to reveal *over-extension & mean reversion zones*.
It doesn’t chase candles.
It watches the tides beneath the market — the **money supply currents** that have a **direct correlation** to asset price behavior.
When liquidity expands → risk-on assets tend to rise.
When liquidity contracts → risk-off waves hit.
We ride those waves.
---
🔍 **What It Does**
* **Tracks Global M2** across major economies, FX-adjusted, and scales it to your chart’s price.
* **HTF Hull MA** (Daily, smoothed via 5m base) → gives you the macro liquidity trend.
* **Ultimate BB logic** applied to the HTF M2 Hull → inner/outer bands for volatility envelopes.
* **Pivot Labels** → ideal entry/exit zones on macro turns.
* **Over-Extension Alerts** → when HTF M2 Hull pushes outside the outer bands.
* **Re-Entry Alerts** → mean reversion triggers when liquidity moves back inside the range.
* **Background Paint** from chart TF M2 slope → for confluence on your entry timeframe.
---
📜 **Suggested How-To**
1. **Choose your execution chart** — e.g., 1–15m for scalps, 1H–4H for swings.
2. **Use the background paint** as your *local tide check* (chart TF M2 slope).
3. **Trade in the direction of the HTF M2 Hull** — green line = liquidity rising, red line = liquidity falling.
4. **Watch pivot labels** — these are potential “macro inflection” points.
5. **Confluence stack** — pair with ZLSMA, WaveTrend divergences, VWAP volume, or your favorite price-action setups.
6. **Size down** when HTF M2 Hull is flat/gray (chop zone).
7. **Scale in/out** on over-extension + re-entry alerts for higher probability swings.
---
⚠️ **Important Note**
This indicator **does not predict price** — it tracks macro liquidity flows that *influence* price.
Think of it as your market’s **tide chart**: when the water’s coming in, you can swim out; when it’s going out, you’d better be ready for the undertow.
---
📢 **Alerts Available**
* HTF Pivot HIGH / LOW
* Over-Extension (HTF Hull outside outer BB)
* Re-Entry (return from overbought/oversold)
---
🤝 **Join the SulLaLuna Tribe**
If this indicator helps you capture better entries, follow & share so more traders can learn to trade *math, not emotion*.
We rise together — **and we’ll meet you on the Moon** 🌕🚀💵.

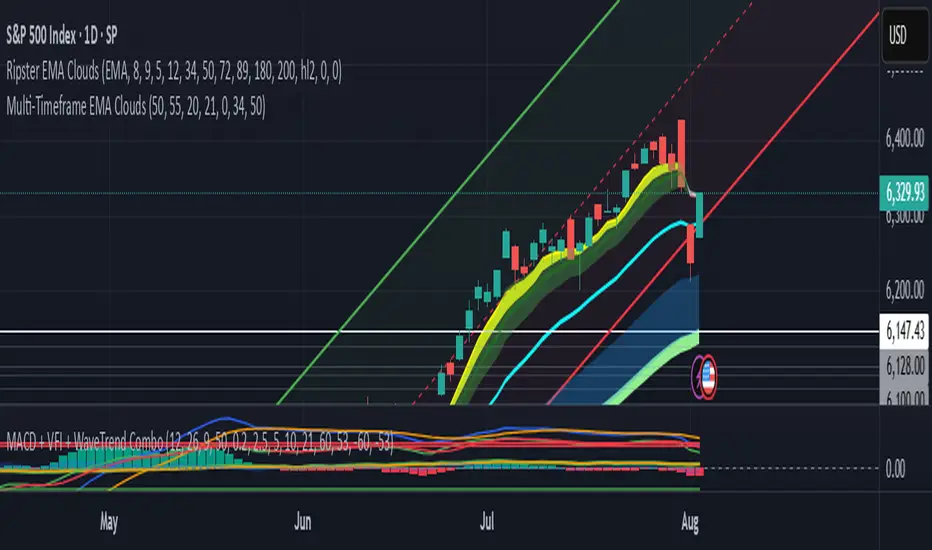
Divergence TridentA Combination of MACD + VFI + WaveTrend
Tradingview hates me and is making me explain this in greater detail so maybe this is enough????
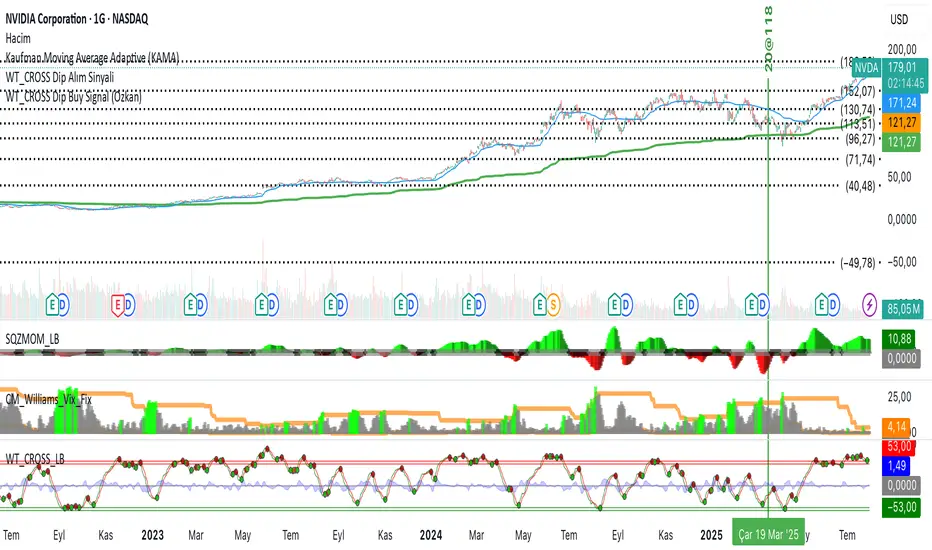
WT_CROSS Dip Buy Signal(ozkan)This script identifies potential buy opportunities based on WaveTrend (WT_CROSS) momentum crossing below the -60 level — often indicating oversold conditions.
Additional filters include price being above the Kaufman Adaptive Moving Average (KAMA) and volume below the 5-period average, which helps isolate pullbacks within an uptrend.
Buy Signal Conditions:
WT1 < -60
Price > KAMA
Volume < 5-period SMA of volume
Purpose:
To capture early entries at possible local bottoms during bullish trends while avoiding high-volume breakdown traps.
🔔 You can also set an alert based on this condition.
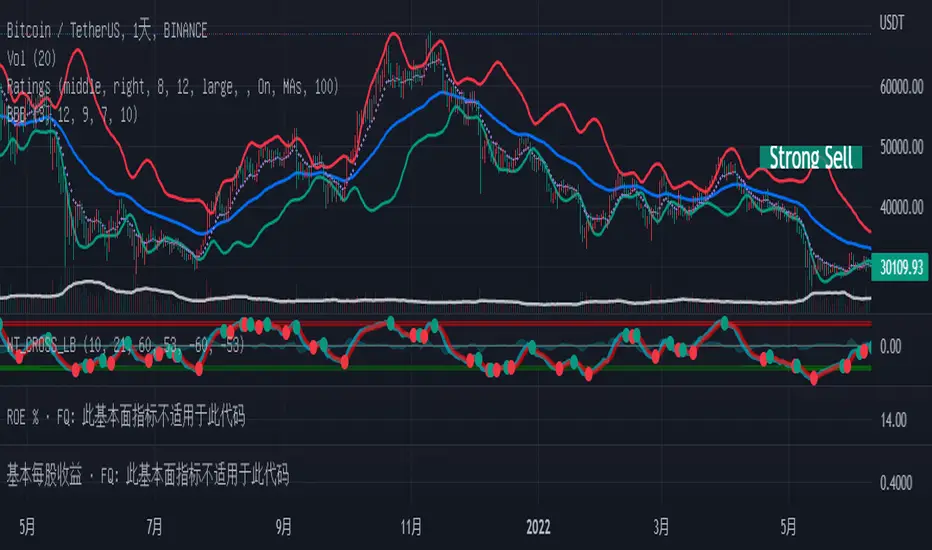
Macd, Wt Cross & HVPMacd Wt Cross & HVP – Advanced Multi-Signal Indicator
This script is a custom-designed multi-signal indicator that brings together three proven concepts to provide a complete view of market momentum, reversals, and volatility build-ups. It is built for traders who want to anticipate key market moves, not just react to them.
Why This Combination ?
While each tool has its strengths, their combined use creates powerful signal confluence.
Instead of juggling multiple indicators separately, this script synchronizes three key perspectives into a single, intuitive display—helping you trade with greater clarity and confidence.
1. MACD Histogram – Momentum and Trend Clarity
At the core of the indicator is the MACD histogram, calculated as the difference between two exponential moving averages (EMAs).
Color-coded bars represent momentum direction and intensity:
Green / blue bars: bullish momentum
Red / pink bars: bearish momentum
Color intensity shows acceleration or weakening of trend.
This visual makes it easy to detect trend shifts and momentum divergence at a glance.
2. WT Cross Signals – Early Reversal Detection
Overlaid on the histogram are green and red dots, based on the logic of the WaveTrend oscillator cross:
Green dots = potential bullish cross (buy signal)
Red dots = potential bearish cross (sell signal)
These signals are helpful for identifying reversal points during both trending and ranging phases.
3. Historical Volatility Percentile (HVP) – Volatility Compression Zones
Behind the histogram, purple vertical zones highlight periods of low historical volatility, based on the HVP:
When volatility compresses below a specific threshold, these zones appear.
Such periods are often followed by explosive price moves, making them prime areas for pre-breakout positioning.
By integrating HVP, the script doesn’t just tell you where the trend is—it tells you when the trend is likely to erupt.
How to Use This Script
Use the MACD histogram to confirm the dominant trend and its strength.
Watch for WT Cross dots as potential entry/exit signals in alignment or divergence with the MACD.
Monitor HVP purple zones as warnings of incoming volatility expansions—ideal moments to prepare for breakout trades.
Best results occur when all three elements align, offering a high-probability trade setup.
What Makes This Script Original?
Unlike many mashups, this script was not created by simply merging indicators. Each component was carefully integrated to serve a specific, complementary purpose:
MACD detects directional bias
WT Cross adds precision timing
HVP anticipates volatility-based breakout timing
This results in a strategic tool for traders, useful on multiple timeframes and adaptable to different trading styles (trend-following, breakout, swing).

Squeeze Momentum Indicator Strategy [LazyBear + PineIndicators]The Squeeze Momentum Indicator Strategy (SQZMOM_LB Strategy) is an automated trading strategy based on the Squeeze Momentum Indicator developed by LazyBear, which itself is a modification of John Carter's "TTM Squeeze" concept from his book Mastering the Trade (Chapter 11). This strategy is designed to identify low-volatility phases in the market, which often precede explosive price movements, and to enter trades in the direction of the prevailing momentum.
Concept & Indicator Breakdown
The strategy employs a combination of Bollinger Bands (BB) and Keltner Channels (KC) to detect market squeezes:
Squeeze Condition:
When Bollinger Bands are inside the Keltner Channels (Black Crosses), volatility is low, signaling a potential upcoming price breakout.
When Bollinger Bands move outside Keltner Channels (Gray Crosses), the squeeze is released, indicating an expansion in volatility.
Momentum Calculation:
A linear regression-based momentum value is used instead of traditional momentum indicators.
The momentum histogram is color-coded to show strength and direction:
Lime/Green: Increasing bullish momentum
Red/Maroon: Increasing bearish momentum
Signal Colors:
Black: Market is in a squeeze (low volatility).
Gray: Squeeze is released, and volatility is expanding.
Blue: No squeeze condition is present.
Strategy Logic
The script uses historical volatility conditions and momentum trends to generate buy/sell signals and manage positions.
1. Entry Conditions
Long Position (Buy)
The squeeze just released (Gray Cross after Black Cross).
The momentum value is increasing and positive.
The momentum is at a local low compared to the past 100 bars.
The price is above the 100-period EMA.
The closing price is higher than the previous close.
Short Position (Sell)
The squeeze just released (Gray Cross after Black Cross).
The momentum value is decreasing and negative.
The momentum is at a local high compared to the past 100 bars.
The price is below the 100-period EMA.
The closing price is lower than the previous close.
2. Exit Conditions
Long Exit:
The momentum value starts decreasing (momentum lower than previous bar).
Short Exit:
The momentum value starts increasing (momentum higher than previous bar).
Position Sizing
Position size is dynamically adjusted based on 8% of strategy equity, divided by the current closing price, ensuring risk-adjusted trade sizes.
How to Use This Strategy
Apply on Suitable Markets:
Best for stocks, indices, and forex pairs with momentum-driven price action.
Works on multiple timeframes but is most effective on higher timeframes (1H, 4H, Daily).
Confirm Entries with Additional Indicators:
The author recommends ADX or WaveTrend to refine entries and avoid false signals.
Risk Management:
Since the strategy dynamically sizes positions, it's advised to use stop-losses or risk-based exits to avoid excessive drawdowns.
Final Thoughts
The Squeeze Momentum Indicator Strategy provides a systematic approach to trading volatility expansions, leveraging the classic TTM Squeeze principles with a unique linear regression-based momentum calculation. Originally inspired by John Carter’s method, LazyBear's version and this strategy offer a refined, adaptable tool for traders looking to capitalize on market momentum shifts.

Sigma 2.0 - Advanced Buy and Sell Signal IndicatorOverview:
Sigma 2.0 is a sophisticated trading indicator designed to help traders identify potential buy and sell opportunities across various financial markets. By leveraging advanced mathematical calculations and incorporating multiple analytical tools, Sigma 2.0 aims to enhance trading strategies by providing precise entry and exit signals.
Key Features:
Advanced Sigma Calculations:
Utilizes a combination of Exponential Moving Averages (EMAs) and price deviations to calculate the Sigma lines (sigma1 and sigma2).
Detects potential trend reversals through the crossover of these Sigma lines.
Customizable Signal Filtering:
Offers the ability to filter buy and sell signals based on user-defined thresholds.
Helps reduce false signals in volatile markets by setting overbought and oversold levels.
Overbought and Oversold Detection:
Identifies extreme market conditions where price reversals are more likely.
Changes the background color of the chart to visually indicate overbought or oversold states.
Integration of Exponential Moving Averages (EMAs):
Includes EMAs of different lengths (10, 21, 55, 200) to assist in identifying market trends.
EMAs act as dynamic support and resistance levels.
Higher Timeframe Signal Incorporation:
Allows users to include signals from a higher timeframe to align trades with the broader market trend.
Enhances the reliability of signals by considering multiple timeframes.
Custom Alerts:
Provides alert conditions for both buy and sell signals.
Enables traders to receive notifications, ensuring timely decision-making.
How It Works:
Sigma Calculation Methodology:
The indicator calculates an average price (ap) and applies EMAs to derive the Sigma lines.
sigma1 represents the smoothed price deviation, while sigma2 is a moving average of sigma1.
A crossover of sigma1 above sigma2 generates a buy signal, indicating potential upward momentum.
Conversely, a crossover of sigma1 below sigma2 generates a sell signal.
Signal Filtering and Thresholds:
Users can enable filtering to only consider signals when sigma1 is below or above certain thresholds.
This helps in focusing on more significant market movements and reducing noise.
Overbought/Oversold Levels:
The indicator monitors sigma1 to detect when the market is in extreme conditions.
Background color changes provide a quick visual cue for these conditions.
EMA Analysis:
The plotted EMAs help in confirming the trend direction.
They can be used alongside Sigma signals to validate trade entries and exits.
Higher Timeframe Signals:
Incorporates signals from a user-selected higher timeframe.
Helps in aligning trades with the overall market trend, increasing the potential success rate.
How to Use:
Adding the Indicator to Your Chart:
Search for "Sigma 2.0" in the TradingView Indicators menu and add it to your chart.
Configuring the Settings:
Adjust the Sigma configurations (Channel Length, Average Length, Signal Line Length) to suit your trading style.
Set the overbought and oversold levels according to your risk tolerance.
Choose whether to filter signals by thresholds.
Select the higher timeframe for additional signal confirmation.
Interpreting the Signals:
Buy Signals:
Indicated by a green triangle below the price bar.
Occur when sigma1 crosses above sigma2 and other conditions are met.
Sell Signals:
Indicated by a red triangle above the price bar.
Occur when sigma1 crosses below sigma2 and other conditions are met.
Higher Timeframe Signals:
Plotted with lime (buy) and maroon (sell) triangles.
Help confirm signals in the current timeframe.
Utilizing EMAs:
Observe the EMAs to gauge the overall trend.
Consider aligning buy signals when the price is above key EMAs and sell signals when below.
Setting Up Alerts:
Use the built-in alert conditions to receive notifications for buy and sell signals.
Customize alert messages as needed.
Credits:
Original Concept Inspiration:
This indicator is inspired by the WaveTrend oscillator and other momentum-based indicators.
Special thanks to the original authors whose work laid the foundation for this enhanced version.
Disclaimer:
Trading involves significant risk, and past performance is not indicative of future results.
This indicator is a tool to assist in analysis and should not be the sole basis for any trading decision.
Always perform thorough analysis and consider multiple factors before entering a trade.
Note:
Ensure your chart is clean and only includes this indicator when publishing.
The script is open-source and can be modified to fit individual trading strategies.
For any questions or support, feel free to reach out or comment.

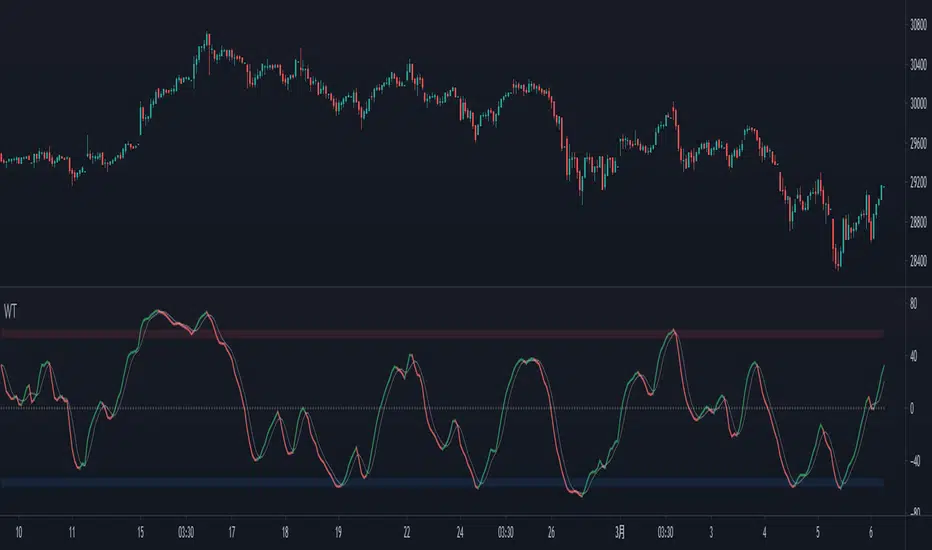
AWR_WaveTrend Multitimeframe [adapted from LazyBear]I've adapted a script from Lazy Bear (WT trend oscillator)
WaveTrend Oscillator is a port of a famous TS/MT indicator.
When the oscillator (WT1 designed as a line) is above the overbought band (50 to 60) and crosses down the WT2 (dotted line), it is usually a good SELL signal. Similarly, when the oscillator crosses above the signal when below the Oversold band ( (-50 to -60)), it is a good BUY signal.
In this indicator, you can display at the same time, different time frames.
Choice possible are 1 mn, 15 mn, 30 mn, 60 mn, 120 mn, 240 mn, 1D, Week, Month.
Small time frames (1 to 30 mn) are represented by a blue lines (light to dark)
1H is in grey
2H & 4H are in purple (light to dark)
1D is in green
1W is in orange
1M is in black
You can choose which timeframes you want to display for the current period or for the last period closed.
In a few seconds, you perfectly see the selected timeframes trends.
There is also at the bottom right a table summing up all the different values of WT1, WT2 and difference between them.
Positive difference means an upside trend
Negative difference means a downside trend.
Another way of using this indicator is displaying only the difference between WT1 & WT2. It's giving the speed & the direction of all trends. Trends are our friends ...
You can observe the significent times frames and look if they are all positives or negatives or if the speed of lower timeframe cross a longer timeframe of if the speed is decreasing or increasing...
Difference values goes generaly from -20 to 20 (it can exceed a bit but really rare). 12 is already high level of speed.
Many uses possible.
In the exemple posted, I've selected WT1 and WT2 for timeframes 4H, Daily & Weekly.
Marker 1:
Orange lines (WT1) are far below - 50 (-67 here) and cross WT2 pointed lines : weekly buy signal
But this buy signal is balanced by 4H & Daily sell signal = it's marking start of hesitations of main trend !!!!
Marker 2 :
Next buy signal in 4H or daily would normaly confirm the start
Marker 3 :
Sell signal in 4H and daily but weekly has an upside trend ! Start of a counter trend in the trend. To find the perfect timing of that you have to look to lower time frames, because 4H and daily are giving many hesitations signals crossing down & crossing up many times in an overbought zone.
Marker 4 :
End of the counter trend. Most of the time, the countertrend don't go in the "over" zone. That's why if you trading in an counter trend, you have to keep it in mind.
Then a few days later you can see the sell signal. And what a sell signal ! 4H & daily are smashed down really fastly ! Trends change warning !
Marker 5
Long hesitation/change of the trend. Daily WT and 4H are below the weekly trends. Weekly start to go down.
Start of a counter trend inside the trend giving us the best selling signal at her end !
Marker 6 :
Long hesitation/change of the trend.
You have to look in lower time frames to identify the short trend. Difficult to find the best timing to get in. ....
I've add many alerts. When a time frame become positive or negative. When many time frames are positive or negative or above or below 47 level...
Please feel free to explore.
Hope it will help you.
Thanks to Lazybear ! Thousands thanks to Lazybear !
Exemple with difference

Range of a source displayed in thirdsThis indicator will take the value of any external source input and display how it has changed over time (the lookback period in settings). For the purposes of display here I'm using the WT1 line from Wavetrend with Crosses by LazyBear to provide a source input.
The highest and lowest value of the source over the lookback period are used to determine the highest and lowest point - the green and red lines at the top and bottom of the bands. This region is then mathematically split into three, such that the source (and its optional moving average line) can be defined as being in the top third, the middle or the bottom third.
Applications for this could be in risk management where you may wish to take on a larger position size when a certain indicator is in the top third, or decide that you want to enter / leave positions when the source crosses in / out of the extreme points.

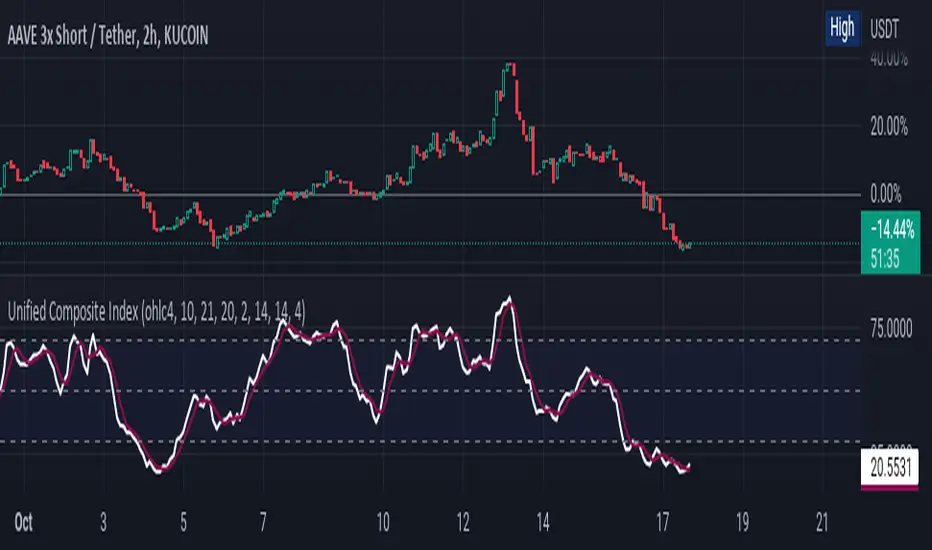
Unified Composite Index [UCI] [KuraiBlu] [LazyBear]The purpose of this indicator is to combine the four basic types of indicators (Trend, Volatility, Momentum and Volume) to create a singular, composite index in order to provide a more holistic means of observing potential changes within the market, known as the Unified Composite Index . The indicators used in this index are as follows:
Trend - Trend Composite Index
Volatility - Bollinger Bands %b
Momentum - Relative Strength Index
Volume - Money Flow Index
The average price source can’t be altered as I’ve made it an average between ((open + close) / 2) and ((high + low) / 2).
The best way to use this is by observing several of the indicators at once in conjunction with the average, rather than simply using the average produced to determine the right moment to enter, or exit a trade by itself. I've found when one indicator goes way out of bounds relative to the other three (and subsequently, the average array), then it presents a good buying, or selling opportunity.
Some adjustments were made to several of the indicators in order to standardize them on a scale of 1-100 so that they could better accommodate the average array that was finally produced. Thanks to LazyBear for letting me strip down the WaveTrend Oscillator.
Bollinger but BetterA better Bollinger Band with an average of 20 EMAs as pivot price, which makes its standard deviation way more sensitive compared to traditional Bollinger Band.
-- My Tips --
Long flat convergence suggests a big potential price movement.
Short quick convergence of short supportive ema(default: 10days) and upper band suggests a safe middle entry point.
Recommended auxiliary indicator: Wavetrend by Lazybear, which points out entry and exit points quite accurately in bull market.
-- PS --
This system is a hybrid of EMA Ribbons and Bollinger Band.
MA ClustersBackground :
This study allows to define ranges for contraction and expansion of a defined set of MA to analyse the the momentum at those specific situations.
In general all functions used are very basic but allows the user to set alerts when a cluster of MA enters a defined range within or outside the MAX and MIN of a selected MA cluster. The predefined length of the EMAs were put together by HurstHorns within a trading learning discord group and are designed for 1M timeframe to read the momentum for scalping entries - Thanks again for sharing.
Functions :
currently the following MA are available:
- ema
- sma
- smma
- wma
- vwma
- vma
the variable moving average is based on the calculation from lazybear.
- RSI Stoch Filter
- Wavetrend OB/OS filter
Currently only alerts for contraction are enabled to not overload the study but in case expansion would be from interest this can be added quickly.
Outlook:
Additional filters were added to see if they can add value in. the decision making or by simply filtering out noise. This is still quite experimental. Please share any useful observation I should add as additional filter option to find good setups. in relation to contractions or expansions.
Next version will get Bollinger bands for 1 selectable MA from the list for additional study options.
In case you are interested in more options such as more MA types or vwap.. just let me know. for VMA I need to do more research to add useful function for laddering or things like that.
In general The script itself can be easily extended by additional functions. As this is one of my first scripts the code itself might not be optimal or there are more elegant ways to come to the same goal. However please use for study purposes only and report bugs or enhancement requests.
good luck and happy trading!

Too Many Cooks trend indicatorToo many Cooks in The Kitchen
You have probably heard the adage "Too many cooks spoils the broth" before. The meaning behind it is obviously that when to many people are trying to work on the same task at once it simply devolves into a fight for control and creates a mess of the situation. But is this true for indicators is the question I had and thus I made this indicator, a simple combination of 8 random trend finding indicators I assembled (A list of these indicators and their authors will be available at the bottom of this page) . Is it any good though ? In short yes, it is a decent trend finding indicator and could likely be used in your strategy in the place of your current trend finding indicator if you so wish. However much of the versatility of the individual indicators IS lost and would not be possible to get back in this big mess of a broth, so this indicator will not be the be all end all of trend indicators nor will it be a free money machine like you may be expecting looking at the list of included indicators so the adage was correct to a degree.
List of Authors and their included indicators
Trading View defaults:
MACD (Modified by me)
Stochastic RSI (Modified by me)
Lazy Bear:
Wavetrend Oscilator (Modified by me)
Traders Dynamic Index (Modified by me)
HACOLT (Modified by me)
Algokid
AK Trend
Racer8
Average Force
KivancOzbilgic
Average Sentiment Osclilator
Wave Trend OscillatorThis is a very standard version of the Wave Trend Oscillator.
The Channel and Average values are displayed as lines, most people display them as areas.
The Channel and Average difference is displayed as a histogram, most people display it as a tiny noisy area.
I was unable to find a standard version of the Wave Trend Oscillator.
The colorful hyped up versions of this indicator made me feel like a clown while using them.
I have essentially copied the style of the MACD with this indicator, to keep things professional.
With this WTO, you can change the timeframe and source.
You can also change the histogram average length and multiplier, making it usable.
The typical way that people display the histogram is completely unusable and just for appearance.
Now it does a decent job showing when the momentum of the WTO's downward movement is slowing down, just like how the MACD histogram works.
This indicator is essentially a normalized MACD, though they are calculated differently.
The Wave Trend Oscillator is useful for spotting/monitoring changed in mid-trend momentum.
In my experience, divergence in this indicator is a strong signal.
If the MACD is too slow for you, then this is a great alternative; without all the extra fluff people usually add to it.

Wave Trend w/ VWMA overlayThis is a trend-following strategy and indicator which combines the Wave Trend Strategy (Lazy Bear) by thomas.gigure with the cRSI + Waves Strategy with VWMA overlay by Dr_Roboto .
You may update the parameters of the Wave Trend oscillator or the VWMA indicator to match your own preferences. You may also adjust the Base Quantity used for determining trade size (as described below) to suit your account size and risk tolerance.
The strategy identifies potential signals based on the on the Wave Trend oscillator, originally ported to TradingView by LazyBear. When a signal is produced by the Wave Trend oscillator, trade size is determined by the VWMA.
When the VWMA is trending against the direction of the Wave Trend signal, Base Quantity x 1 is used
When the VWMA is trending neutral, Base Quantity x 2 is used
When the VWMA is trending with the direction of the Wave Trend signal, Base Quantity x 4 is used
The strategy includes the ability to limit trade signals to certain defined periods of time ("Sessions") during the trading day and, optionally, to close any open position at the end of either or both "Sessions." This may be enabled/disabled via the Limit Signals to Trading Sessions? option on the "Inputs" tab of the strategy's "Settings" window.
If you are trading on a daily chart (or longer) you must disable the Limit Signals to Trading Sessions? in order for the strategy to produce signals.

MarketVision BWith Special Thanks to Everyone who has gone before me, and who have both allowed me given me permission to bring my version of Market Cipher to the World
Especially LazyBear for his amazing Wave Trend Oscillator and for Aevir, falconCoin, vumanchu, Crypto_Spike and others who have freely brought MarketCipher to the Tradingview Community
Also special mention to RicardoSantos for his Divergence script
MarketVision B - My take on MarketCipher B / Market Cipher B, Ive just put outlines on the Wave Trend to add to the Visual Appeal and Added a Trend Meter and a few more options for the Oscillators
Nice To Look At
Oscillator 1 Choose Between - RSI, MFI and Ultimate Oscillator
For Stochastics Choose Between Standard and RSI Stochastics and for the source you can choose On Balance Volume
Wave Trend
Money Flow
Trend Meter & Signals Bar
Divergences are marked, However they are easy to spot and it is better to train your eyes to spot them before the indicator marks them out
Lots of Alerts and Loads of ways to trade using MarketVision
PS: You can make this look like the original by adjusting the parameters in the menu

Simple Wave Trend Wave Trend Oscillator with minimal functionality.
- Change color by crossing
- Overboughtr and Oversold band
- Zero line
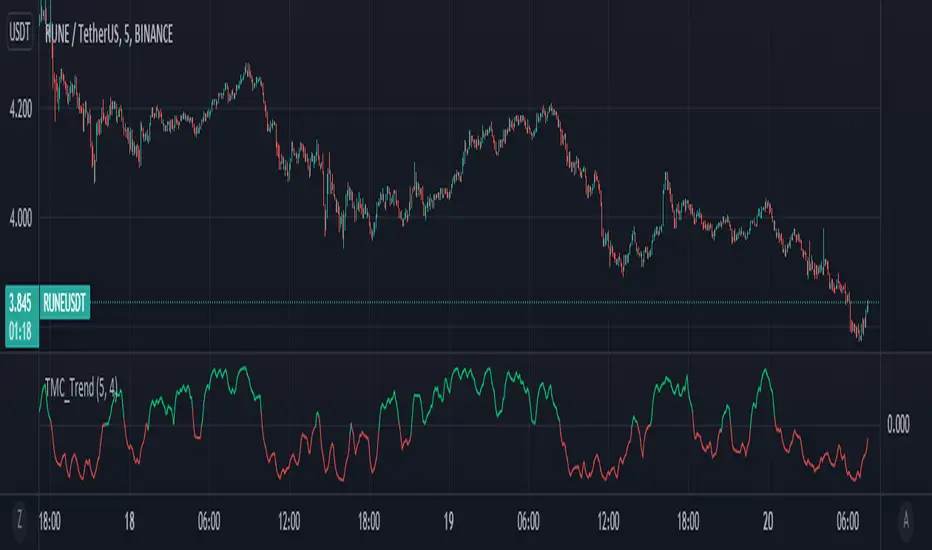
True Momentum Oscillator"TMO calculates momentum using the delta of price. Giving a much better picture of trend, trend reversals and divergence than momentum oscillators using price". This is comparable to the WaveTrend Oscillator, gives more or less better or worse signals depending on the time frame and markets. This is a free and open source indicator found in many platforms, now ported to TV.
This indicator uses the closing and opening of the price in a way that reminds me of the Qstick indicator but it seems different. It's an oscillator with overbought and oversold zones and crossovers for entry and exits. I included the option of changing the moving averages from the standard exponential types used in its 3 functions to calculate the main and signal lines just in case the settings need to be changed further or if anyone wants to experiment to find better settings on top of just changing the lengths for each length type. I added dots for when the Main line crosses the Signal line. The Main line is darkened in case anyone needs to see it better.
