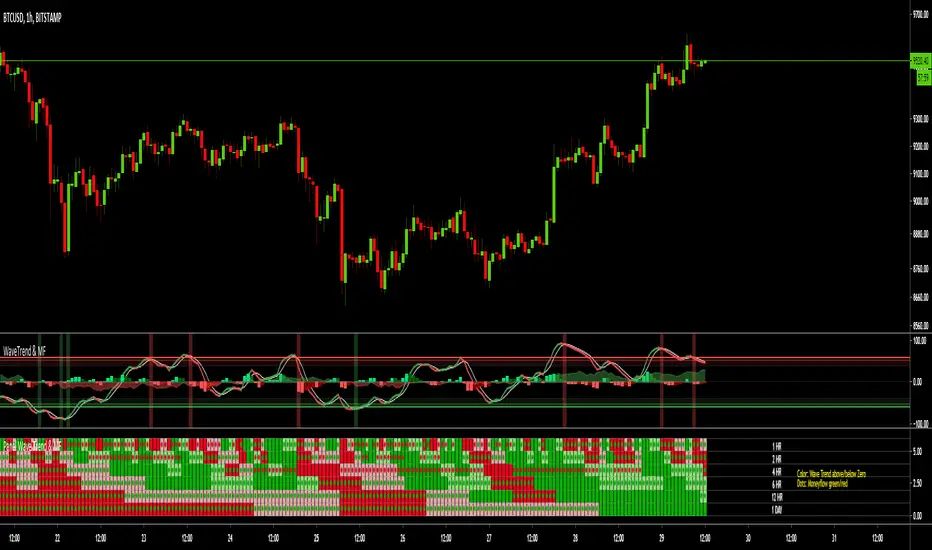
MTF Wave Trend & Money Flow - Monitoring PanelAnother indicator based on the famous "Wave Trend Oscillator" by LazyBear.
Monitoring panel showing the Wave Trend as color for 6 different timeframes. Additionaly the Money Flow (positive or negative) is indicated as green or red dots.
I find it helpful that with one glance the current Wave Trend and Money Flow on many timeframes is visible.
(Timeframes can be changed, but the description labels are currently hardcoded - if you want to change it, just copy the script and change them)
Meanings of the Colors:
WT above Zero and rising : Dark Green
WT above Zero and declining : Light Green
WT below Zero and declining : Dark Red
WT below Zero and rising : Light Red
Money flow positive : Green dot
Monet flow negative : Red dot
(Currently there are two additional timeframes commented in the code - if you want to use them, just copy the script and uncomment them)
Have fun and as always I am open for constructive feedback.
Cheers!
Cari dalam skrip untuk "WaveTrend"
MTF Wave Trend CrossThis indicator is based on the famous "Wave Trend Oscillator" by LazyBear.
I have noticed that the Wave Trend Crosses (not the waves themselves) give a pretty good indication on the current status of the market (above Zero = bullish / below Zero = bearish ).
This new indicator is a Multi TF Version of this where it is possible to define 4 fixed Higher Time Frames and 4 fixed Lower Time Frames.
The results are then plotted above (higher TF) and below (lower TF) of the result of the current TF. (Offset can be flexibly changed in the settings)
This allows to judge the trend based on the various TFs.
Basically the greener it looks, the more bullish the situation is at the moment. More red color indicates a more bearish situation.
Enjoy.

Squeeze Momentum Indicator [LazyBear] vHMAThis is a remake of the famous LazyBear Indicator, the Squeeze Momentum Indicator.
All i did was take out the SMA's and replace them with HMA's. HMA is a more responsive moving average.
Hull Moving Average.
This is a derivative of John Carter's "TTM Squeeze" volatility indicator, as discussed in his book "Mastering the Trade" (chapter 11).
Black crosses on the midline show that the market just entered a squeeze ( Bollinger Bands are with in Keltner Channel). This signifies low volatility , market preparing itself for an explosive move (up or down). Gray crosses signify "Squeeze release".
Mr.Carter suggests waiting till the first gray after a black cross, and taking a position in the direction of the momentum (for ex., if momentum value is above zero, go long). Exit the position when the momentum changes (increase or decrease --- signified by a color change). My (limited) experience with this shows, an additional indicator like ADX / WaveTrend, is needed to not miss good entry points. Also, Mr.Carter uses simple momentum indicator , while I have used a different method (linreg based) to plot the histogram.
More info:
- Book: Mastering The Trade by John F Carter
Here is the original version:

Trading Public School ST1This is a derivative of Trading Public School "TTM Squeeze" volatility indicator, as discussed in his book "Mastering the Trade" (chapter 11).
Black crosses on the midline show that the market just entered a squeeze ( Bollinger Bands are with in Keltner Channel). This signifies low volatility , market preparing itself for an explosive move (up or down). Gray crosses signify "Squeeze release".
Mr.Carter suggests waiting till the first gray after a black cross, and taking a position in the direction of the momentum (for ex., if momentum value is above zero, go long). Exit the position when the momentum changes (increase or decrease --- signified by a color change). My (limited) experience with this shows, an additional indicator like ADX / WaveTrend, is needed to not miss good entry points. Also, Mr.Carter uses simple momentum indicator , while I have used a different method (linreg based) to plot the histogram. 100% Profit & loss 10% Only

Zenith TraderWarning, all trading involves risk. Be sure to do your own research before placing in a trade and do not realize solely on this indicator.
Zenith Trader is made up of 3 parts
RSI , WaveTrend by LazyBear, & GMMA Oscillator by JustUncleL
It uses crosses of the 0 and/or 50 line on all indicators as a buy/sell indication
You can change which indicator is showing on the main screen in the settings.
You can all change the time frame when the alerts will pop up in order to customize your own time for alerts to go off.

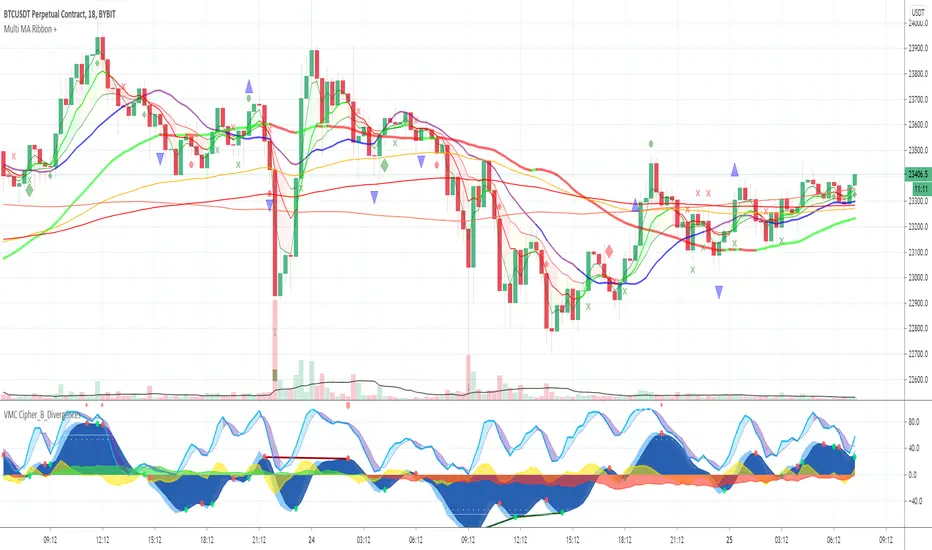
Multi MA Ribbon +Draws an MA Ribbon that highlights major MA's and for easier visibility separates them into different groups including Custom MA's, Baseline MA's, T Line MA's, Short Term MA's and Long Term MA's.
Choose between 11 different types of MA's thanks to JustUncleL and John F. Ehlers super smoother.
The + is for various signals and alerts derived from Market Cipher / Wave Trend indicators and TCG etc.
Happy Trading and remember just follow the flow of the river!
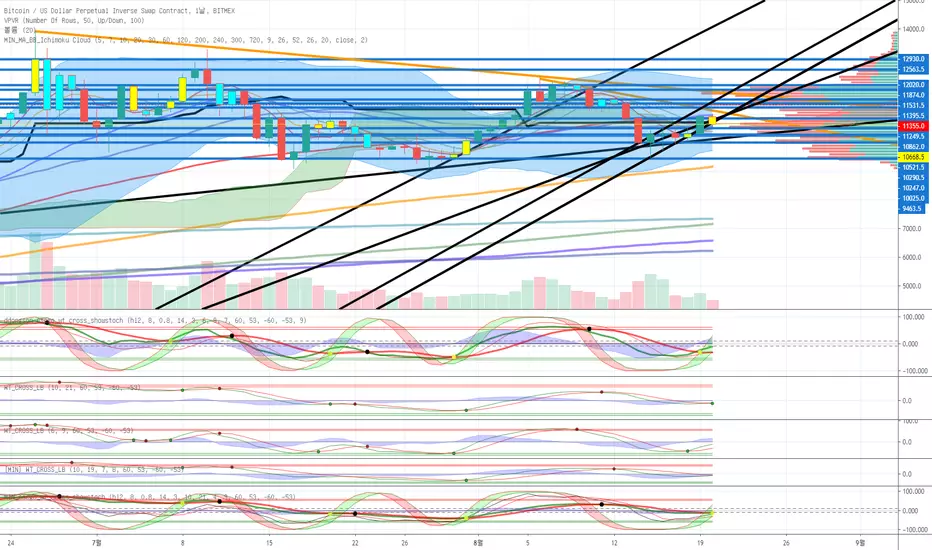
MIN_escgo_wt_cross_showstochehlers stochastic CG oscillator
wavetrend with crosses
slow stochastic
3가지 통합지표입니다.
원지않는 지표는 끌수있습니다.
BitGin 3 Scalping Method AlertCombined 3 indicators
WaveTrend with Crosses
Ehlers Stochastic CG Oscillator
Slow Stochastic

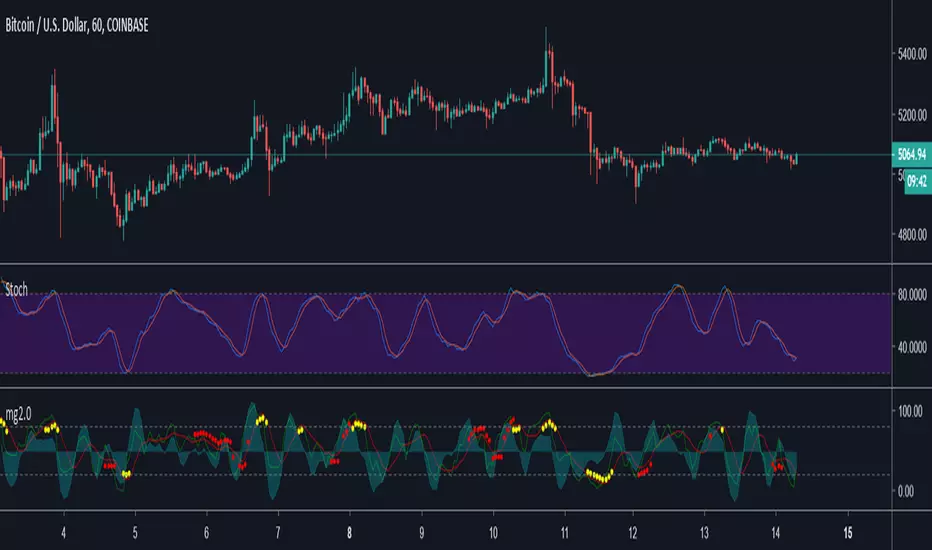
Minimal Godmode 2.0Second iteration of Minimal Godmode with in-line TTM Squeeze linked to godmode channel length, TTSI from godmode 4.0.0, and new LRSI + CBCI calculations for godmode engine.
Note: Like the original godmode, this indicator is designed specifically for use in trading BTC/XBT pairs.

Noro's SILA v1.6LIn 1.6:
1) WaveTrend Oscilator (LazyBear's code)
2) Locomotive-pattern
3) A new distance for SILA lines
Noro's SILA v1.6L - the original and new system of finding of a trend.
SILA is not one trend indicator, but 8 different trend indicators in one. Therefore high precision.
For:
- any pair
- any timeframe >= H1

Fractal Quad Components8 Fractal Resonance Component indicators on a chart eats up LOTS of vertical space, so we're providing this Fractal Quad Components script to group 4 components a bit more compactly (eliminating the margin whitespace between indicator rows).
To view 8 components you'll need to add a second instance of this script to your chart and set its Base Timescale Multiplier to 16. Then grab the dividers to stretch both instances to a good viewing height.
One disadvantage of this grouping method is that to read off the x2, x4, and x8 lead and lag line values, you'll need to mentally add 200, 400 or 600 respectively.
We also replaced the "Extreme" > +-100% black crosses (+) with more subtle purple circle outlines. These extreme crosses are often (but not always) too early to be a major reversal so it's best not to overemphasize them.
Significant crosses (> +-75%) are still highlighted with black circle outlines, and are the most likely to be major reversals for buy/sell.
Note how the 30-minute oscillator (2nd row) showed the cleanest (black-outlined) reversals on the S&P for the last week of 2016, with just a bit more profit-eating lag than the 15-minute oscillator above.

Squeeze Momentum Indicator [LazyBear]
Fixed a typo in the code where BB multiplier was stuck at 1.5. Thanks @ucsgears for bringing it to my notice.
Updated source: pastebin.com
Use the updated source instead of the what TV shows below.
This is a derivative of John Carter's "TTM Squeeze" volatility indicator, as discussed in his book "Mastering the Trade" (chapter 11).
Black crosses on the midline show that the market just entered a squeeze (Bollinger Bands are with in Keltner Channel). This signifies low volatility, market preparing itself for an explosive move (up or down). Gray crosses signify "Squeeze release".
Mr.Carter suggests waiting till the first gray after a black cross, and taking a position in the direction of the momentum (for ex., if momentum value is above zero, go long). Exit the position when the momentum changes (increase or decrease --- signified by a color change). My (limited) experience with this shows, an additional indicator like ADX / WaveTrend, is needed to not miss good entry points. Also, Mr.Carter uses simple momentum indicator, while I have used a different method (linreg based) to plot the histogram.
More info:
- Book: Mastering The Trade by John F Carter
List of all my indicators:
