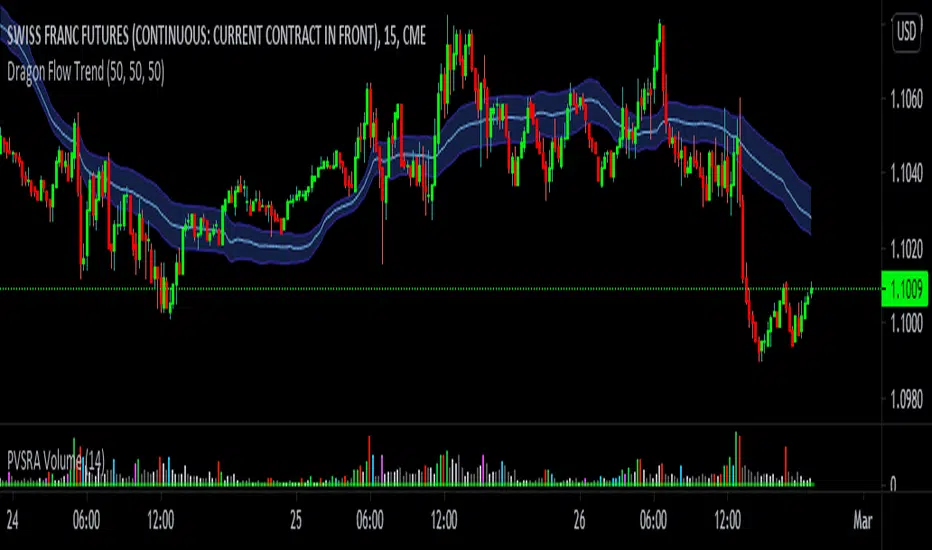
Volume Price Balance by serkany88This idea has been in my mind for a while. We all know how important volume is to technical analysis but volume and price itself doesn't mean much when volatility and momentum of the current trend is not taken into account. With this oscillator we try to combine all these factors into one indicator and provide a simplified interpretation of this relationship with spread analysis. This indicator can be used in all timeframes but higher timeframes like 1 hour and above will provide most stable results.
How it works?
This oscillator tries to analyze volume spread along with price spread based on wyckoff methods and attains certain "strength value" for each candle and it's relationship with the volume. After this calculation preferably we remove detected rejection candles from overall calculation and draw them as plots. The multipliers of the strengths can be changed from the settings.
Green Line Above Red Line = Bullish momentum stronger
Red Line Above Green Line = Bearish momentum stronger
Top circles mean possible bullish reversal candle detected. Gray is weak, White is normal and Red top circle means strong possible reversal detected.
Bottom circles mean possible bearish reversal candle detected. Gray is weak, White is normal and Green bottom circle means strong possible reversal detected.
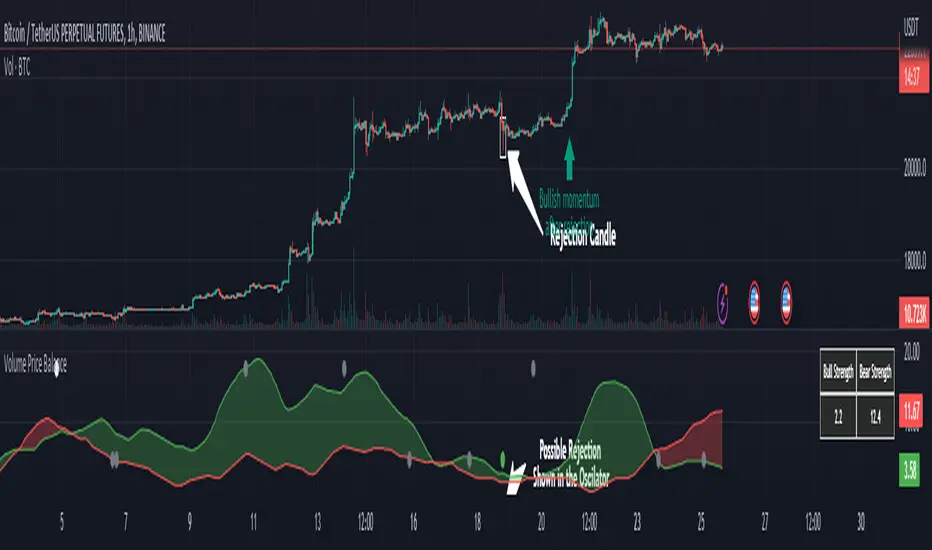
Let's check the example below
As you can see we see a green dot appear in a somewhat weakening bullish momentum, this can mean possible reversal can happen soon and it does.
Below is a bearish example
In this example we see a possible strong reversal signal in a increasing bullish momentum and the price reacts immediately after the candle.
We also have a table that shows the current non-smoothed result of trend strength based on calculated price-volume spread at top right of the oscillator.
Cari dalam skrip untuk "Wyckoff"
XPace* XPACE INDICATOR *
The XPace indicator represents a histogram view of the Tape Speed of the Floor. The Tape Speed (aka Pace) is represented as red and green bars drawn in a histogram view.
As the red histogram bars grow larger and increase in frequency, this shows that the BIDS are in kontrol at that time. And conversely, when the green histogram bars grow larger and instead in frequency, this shows that the OFFERS are in kontrol.
Weighing in whether the BIDS or OFFERS are in kontrol can be a helpful indicator to decide what direction the market could move in.
What is helpful about XPace is that it will show you the raw value of the BID and OFFER kontrol. This can be combined with XKontrol which will classify the kontrol as either Initial, Strong, and Total. Using these 2 indicators combined has added value.
* WHAT MAKES IT ORIGINAL *
Up to this point, there is not another indicator that represents the BIDS and OFFERS that correlate and represent the Tape Speed of the Floor.
* XKONTROL INDICATOR *
The other indicator on this chart is XKontrol, as shown as dots of varying sizes on the chart. The dots are a visual representation of who is in Kontrol relative to the Tape Speed of the Floor. The XKontrol indicator will show you who is in Kontrol, the BIDS or the OFFERS. This is a very powerful indicator. Great for long term plays and a *SCALPERS* paradise.
The XKontrol indicator reads the BIDS Being hit and the OFFERS being lifted, and then represents the strength of the Bids being hit and Offers being lifted as dots on the chart. The various dot sizes produced by XKontrol show the level of control the Bids or the Offers have at that point of time in the chart.
As the Dots grow larger, the level of Kontrol is increased. There are 3 dot sizes ranging from Small, Medium, and Large. Respectively they represent Intial Kontrol, Strong Kontrol, and Total Kontrol. Total Kontrol is achieved when either the BIDS or the OFFERS are dominating at the time. This is generally the direction you want to place your trades in and show that either the Bids or the Offers are flooding the market.
As the BID dots increase in frequency and in size this shows that the BIDS are in kontrol and dominating. Vice versa, when the OFFER dots increase in frequency and in size this shows that the offers are in kontrol and dominating. When you see the large dot that is generally a strong sign of the direction price may go. However, it also can be climactic and price could reverse. That would symbolize a case of Effort / No Result. For Example, when the BIDS are in Kontrol and dominating, make a lower low, and then price quickly reverses, it could symbolize a climax.
Usually XKontrol is used in conjunction with XPace, as XKontrol deciphers the Tape Speed of the Floor and draws graphical dots to show whether the BIDS or the OFFERS are dominating right on the chart. Reading XPace will show visually in the histogram the strength of the BID and OFFER Kontrol in the histogram.
* XKONTROL ALERTS *
Alerts can be set very easily with the instructions below.
1. Right Click Chart -> Add Alert...
2. Select Condition to be "XKontrol"
3. Select any level of Kontrol. For example you can Select "Offers Total Kontrol"
4. Select "Greater Than" with Value = 0
5. Options set "Once Per Bar Close" to only fire alert after bar closes
6. Customize Any other Alert Options you want
* EXAMPLE AND USE CASES *
Some practical examples of using XKontrol + XPace combined could be the following:
1. XKontrol Large Green Dot + XPace Large Green Bar could be that the OFFERS have gained total kontrol and are dominating against the Bids. Once would want to watch for higher prices to be potentially reached after that.
2. XKontrol Small Red Dot + XPace Large Red Bar could be that there was a lot of effort on behalf of the BIDS, but they failed to achieve any significant kontrol. The small red dot in XKontrol represents only initial kontrol which is weak kontrol. An application would be to watch for a potential break out on the up side and that will confirm that the BIDS overexerted their effort and was oversold.
3. XKontrol Red and Green Dots mixed could show that it has not been decided whether the BIDS or OFFERS are dominating and the outlook is neutral. If the XPace histogram bars don't stand out either, it would add another point for a neutral analysis.
* AUTHOR *
This script is published by MBoxWave LLC

XKontrol* XKONTROL INDICATOR *
Is a visual representation of who is in Kontrol relative to the Tape Speed of the Floor. The XKontrol indicator will show you who is in Kontrol, the BIDS or the OFFERS. This is a very powerful indicator. Great for long term plays and a *SCALPERS* paradise.
* WHAT THE SCRIPT DOES *
The XKontrol indicator reads the BIDS Being hit and the OFFERS being lifted, and then represents the strength of the Bids being hit and Offers being lifted as dots on the chart. The various dot sizes produced by XKontrol show the level of control the Bids or the Offers have at that point of time in the chart.
* HOW IT WORKS *
As the Dots grow larger, the level of Kontrol is increased. There are 3 dot sizes ranging from Small, Medium, and Large. Respectively they represent Intial Kontrol, Strong Kontrol, and Total Kontrol. Total Kontrol is achieved when either the BIDS or the OFFERS are dominating at the time. This is generally the direction you want to place your trades in and show that either the Bids or the Offers are flooding the market.
* HOW TO USE IT *
As the BID dots increase in frequency and in size this shows that the BIDS are in kontrol and dominating. Vice versa, when the OFFER dots increase in frequency and in size this shows that the offers are in kontrol and dominating. When you see the large dot that is generally a strong sign of the direction price may go. However, it also can be climactic and price could reverse. That would symbolize a case of Effort / No Result. For Example, when the BIDS are in Kontrol and dominating, make a lower low, and then price quickly reverses, it could symbolize a climax.
Usually XKontrol is used in conjunction with XPace, as XKontrol deciphers the Tape Speed of the Floor and draws graphical dots to show whether the BIDS or the OFFERS are dominating right on the chart. Reading XPace will show visually in the histogram the strength of the BID and OFFER Kontrol in the histogram.
* WHAT MAKES IT ORIGINAL *
Up to this point, there is not another indicator that shows BID and OFFER Kontrol on the chart, that correlates and represents the Tape Speed of the Floor.
* XKONTROL ALERTS *
Alerts can be set very easily with the instructions below.
1. Right Click Chart -> Add Alert...
2. Select Condition to be "XKontrol"
3. Select any level of Kontrol. For example you can Select "Offers Total Kontrol"
4. Select "Greater Than" with Value = 0
5. Options set "Once Per Bar Close" to only fire alert after bar closes
6. Customize Any other Alert Options you want
* XPACE INDICATOR *
The other indicator on the chart shown in the Histogram is called XPace. It represents a histogram view of the Tape Speed of the Floor. It correlates to XKontrol, but instead of Dots will draw histogram bars showing the extent of the BID or OFFER Control.
As the red histogram bars grow larger and increase in frequency, this shows that the BIDS are in kontrol at that time. And conversely, when the green histogram bars grow larger and instead in frequency, this shows that the OFFERS are in kontrol.
Weighing in whether the BIDS or OFFERS are in kontrol can be a helpful indicator to decide what direction the market could move in.
What is helpful about XPace is that it will show you the raw value of the BID and OFFER kontrol whereas XKontrol will classify the kontrol as either Initial, Strong, and Total. Using these 2 indicators combined has added value.
* EXAMPLE AND USE CASES *
Some practical examples of using XKontrol + XPace combined could be the following:
1. XKontrol Large Green Dot + XPace Large Green Bar could be that the OFFERS have gained total kontrol and are dominating against the Bids. Once would want to watch for higher prices to be potentially reached after that.
2. XKontrol Small Red Dot + XPace Large Red Bar could be that there was a lot of effort on behalf of the BIDS, but they failed to achieve any significant kontrol. The small red dot in XKontrol represents only initial kontrol which is weak kontrol. An application would be to watch for a potential break out on the up side and that will confirm that the BIDS overexerted their effort and was oversold.
3. XKontrol Red and Green Dots mixed could show that it has not been decided whether the BIDS or OFFERS are dominating and the outlook is neutral. If the XPace histogram bars don't stand out either, it would add another point for a neutral analysis.
* AUTHOR *
This script is published by MBoxWave LLC

[VC] Cumulative Delta PLUS It is a Merged Version of our following two indicators.
V.C Box Chart Histogram
&
V.C Cumulative Delta Histogram.
We merged them at the user's request & convenience. This merged version also helps to save space for other indicators.
Description & Usage
Description & Usage will remain the same as described in individual descriptions of the above-mentioned parent indicators. Only one additional input is added to adjust the scale, named "Scale_Setting''.
Because now it's a merged version of 2 different indicators & both indicators have their different scale levels. To bring both indicators on an equal scale so that they can be visualised better, we have added scale adjustment settings that are easy to understand. Let's elaborate it.
Scale adjustment settings belong to the Cumulative length of the ' 'Cumulative Delta Indicator'' . Keep in mind that the best scale setting is keeping the scale setting values near or equal to cumulative length.
For example:
If you set cumulative length 20, the scale setting value should also be 20 or near 20 (like 17, 18, 19 etc.). (It depends on you, how large cumulative columns you want to see relative to Box chart Histogram)
Note: Any scale setting value can be used, it only affects visuals, not the actual calculations.
Disclaimer Note:
V.C Cumulative Delta Histogram It is purely Volume, Delta, Demand & Supply imbalance and comparative analysis-based tool. Before applying this Indicator to your study, you should clear your concepts about Volume, Delta & Spread, Demand & Supply, and Aggressive & Passive behaviour of buyers/sellers.
Some basic understanding of Sir Richerd Wyckoff's Theory can also be helpful.

[VC] Cumulative Delta Histogram V1.0The V.C Cumulative Delta Histogram shows the market's ongoing Buying/Selling pressure. It helps to determine whether Supply or Demand is dominating and in control.
➤If the Cumulative Delta Increases, the buyers are in control.➚
➤If the Cumulative Delta Decreases, the sellers are in control.➘
The use cases for this Indicator are vast and correlated with our other Delta Indicators. The following examples will explain how to use this Indicator.
Example 1 EUR / USD
In the above example, Negative Cumulative Delta Decreased & Turned into Positive Cumulative Delta. That indicates that sellers are losing control & buyers are getting power.
As a confirmation on the ' 'Box Chart Histogram'' it is evident that Demand is also increasing.
And on ''Wave Chart Index'' as a 3rd confirmation, you can see that the Delta has also increased compared to previous waves.
Example 2
Positive Delta on Cumulative Delta Histogram is decreasing & Negative Delta started increasing.
On the Box Chart Histogram , Demand is decreasing & Supply is increasing.
Additionally, on the Wave Chart Index , the Delta of the wave is also decreasing.
(in short, besides ''Cumulative Delta Histogram," Box chart Histogram & Wave Chart Index is also adding additional confirmation)
Note: Two types of Delta sources are included in this Cumulative Delta Indicator.
Type A: Simple Delta
Type B: Delta %
Simple Delta is the difference between Net Buying - Selling pressure.
Delta % also works in the same calculation, but a Volume weighted algorithm is applied on it.
You may use any of them that suits your analysis.
VC Cumulative Delta Histogram Settings & Inputs
Source:
Allows you to choose the source, Between Simple Delta & Delta %.
Cumulative Length:
Allows you to Change the cumulative length.
Positive & Negative Color:
It allows you to change the colors.
Style Menue
Allows you to change the style & color of the histogram.
Disclaimer Note:
V.C Cumulative Delta Histogram It is purely Volume , Delta, Demand & Supply imbalance and comparative analysis-based tool. Before applying this Indicator to your study, you should know about Volume , Delta & Spread, Demand & Supply, and Aggressive & Passive behaviour of buyers/sellers.
Some basic understanding of Sir Richerd Wyckoff's Theory can also be helpful.

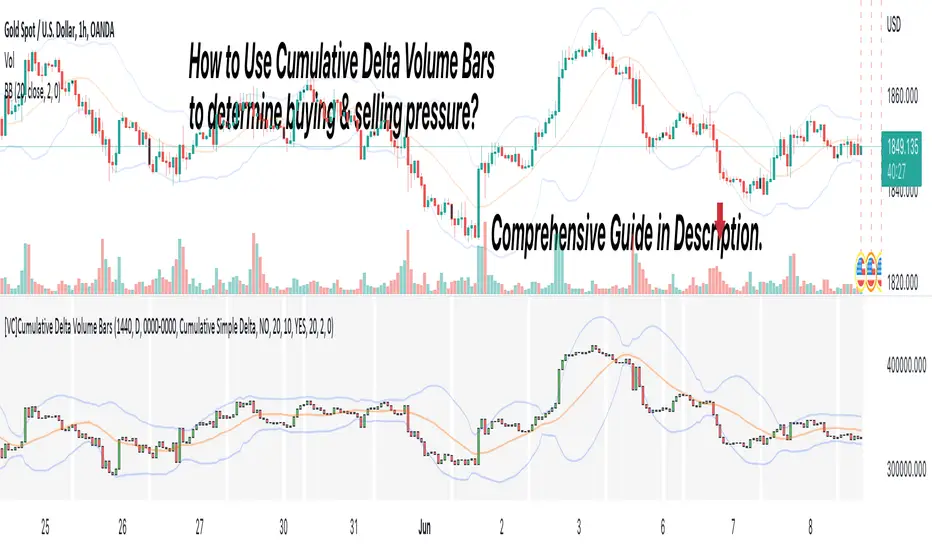
[VC] Cumulative Delta Volume BarsLet's first learn what is Delta & How to Use Cumulative Delta Volume Bars?
Cumulative Delta Volume Bars is one of the leading indicators that you can use when trading order flow. It gives you an instant snapshot of the buying and selling pressure in a market.
After reading the detailed description of "Cumulative Delta Volume Bars," you will understand how volume delta provides a critical edge by allowing you to spot significant potential reversals in the market. You will also learn to use this Cumulative Delta indicator in depth. (including rest session usability features)
What is Delta Volume?
Delta Volume is the difference between Buying and Selling Power. Delta Volume is calculated by taking the difference between the volume traded at the offer price and the volume traded at the bid price. (in simple words, the difference between buying pressure & selling pressure)
If delta volume is more than zero, you have more buying pressure than selling & vice versa, and if delta volume is less than zero, you have more selling pressure than buying.
In Order-Flow Analysis , traders used Cumulative Delta to measure the relationship between the Buying & Selling pressure Vs Price.
Cumulative delta volume takes the delta values for every bar and successively adds them together to provide a graph, as seen below visually.
Let me demonstrate by giving examples of how cumulative Delta can help measure the buying or selling pressure relative to the price move.
★ Trading Absorption & Exhaustion concepts with Delta
See the chart below & try to analyze the next possible move on the basses on the analysis mentioned on the chart.
➽➽ If you said Short, you were correct. ✅
Till Point A , both price & cumulative were aligned. (means there were no imbalances between Delta & Price).
But on Point B , the Cumulative Delta broke the previous resistance clearly and moved even further away from the resistance level, but the Price couldn't break the last resistance. It interprets that buyers applied a lot of buying pressure but no result. (Aggressive buying pressure absorbed by Passive sellers)
Due to this vast effort or failed attempt, buyers were exhausted and had no more strength to pull the Price up. That's why the Price reversed from Point B . See below image
★ Cumulative Delta Volume Bars is helpful when determining buying or selling pressure at different key price levels, such as swing highs or lows.
Let's recap on swing highs and swing lows.
➽ A swing high (S.H) is formed when the high reaches higher than the price action around it. Once the Price moves above a prior swing high and begins to retrace, a new swing high is formed.
➽ A swing low (S.L) is formed when the low reaches lower than price action around it. Once the Price moves below a prior swing low and begins to retrace, a new swing low is formed.
➽ When the Price makes higher highs and higher lows, a market is considered an uptrend.
➽ When the Price is making lower lows followed by lower highs, a market is considered a downtrend.
When evaluating Delta, it's beneficial to compare delta values at swing lows or swing highs to determine the amount of selling or buying pressure and how the market reacts.
The actual Power of Delta is revealed when we use it to determine the market's reaction to powerful buying or selling. We want to see if the market has reacted as we would expect or not.
In the above Example, you will notice that every time price breaks a swing, Delta does as well.
It makes sense as it takes selling pressure to break a swing low or buying pressure to break a swing high. In simple words, we can say that there is no anomaly between delta direction & price direction.
In simple words (No Absorption or Exhaustion)
But what's occurring when this isn't the case, and we have divergence between Price and Delta? Let's analyze it with real examples.
★ Understanding Delta Divergence.
(Lack of Harmony in Buying/Selling Pressure & Price Move)
Notice how the Price breaks out of the previous resistance level on the above chart, but the Delta didn't yet reach even close to its last resistance level. It's a clear divergence between Price and Delta. Buyers may be slightly exhausted at the previous resistance level, and Price & Delta may retrace slightly. But in a broader view, it reflects a strong bullish signal.
See the above chart & see when and why the Price moved. I hope it will help you understand the underlying relation & story between Price & Delta.
Cumulative Delta & Trade Management
Delta will help you spot significant reversals, but it can also be used to help manage your open trade. You want to see a high correlation between Delta and Price when in a long or short position.
Suppose you're short while the Price is breaking a new low. You want to see Delta breaking low if sellers aren't interested in selling at the recent lows, represented by Delta not breaking lows. The probability of a short term reversal or a significant retrace increases.
When in a position, always be on the lookout for exhaustion and absorption, signalling a reversal potential.
What Includes in V.C Cumulative Delta Volume Bars Indicator
Inputs & Settings
Reset accumulation on new session:
Allows you to rest accumulation at the start of each session (you may choose your customized starting & ending time as well by enabling ''Customize Rest Session Time''
Start/End of Session & During Session:
Allows you to show/hide & choose the background color & separator of each session
''Customize Rest Session Time''
When this setting is enabled, your customized given time will be applied, which can be set from the below box. Note: set your time in minutes. For Example, if you want to reset the session after every hour, you need to put 60. If you're going to reset after every 8 hours, you need to put 480. Additionally, your chart time frame must be lower than your customized rest time.
Reset Each Minutes:
Allows you to put your desired rest time in minutes. For Example, for 1 hour 60, for 8 hours 480. (8x60)
Reset Each:
Allows you to choose rest time from the drop-down menu. Note: To apply this setting, don't enable the ''CUSTOMIZE RESET SESSION TIME''.
Select Session:
Allows you to set customized starting & ending times of the session instead of the exchange's default time. For Example, the exchange reset time is 20:00, but if you want 22:00, first, you need to set your chart time as an exchange from the right bottom of the chart, and then you need to put 22:00 22:00 in both fields. Note: Put the same starting & ending time. In simple words, it should not be greater than or less than 24 hours.
Type:
It allows you to select Delta type. (there are two delta types you can choose from, 1st Simple Delta, 2nd Delta % or Volume Weighted Delta)
Candle Colors:
Allows you to change the color of candles.
Envelope Indicator:
Allows you to apply to Envelop Indicator on the delta candle. (all default settings of the Envelop Indicator can be customized as well)
See the below chart with Envelop applied to Delta Candles & Price Candles. (can be used to measure the Delta & Price movement at the micro-level)
Bollinger Bands Indicator:
Allows you to apply to Bollinger Bands Indicator on the delta candle. (all default settings of the Bollinger Bands Indicator can be customized as well)
See the below chart with Bollinger Bands applied to Delta Candles & Price Candles. (can be used to measure the Delta & Price movement at the micro-level)
Start/End of Session on Chart
Allows you to change the first & last candle of the session.
Style Settings:
Allows you to control all the visual settings of delta candles, Envelop & Bollinger bands.
-------------------------------------------------
➽Conclusion:
Cumulative Volume Delta Bars is one of the leading indicators you can include as an order flow trader in your arsenal. It gives you an inside look at buying and selling pressure and how the market reacts.
But Keep in mind, in trading & technical analysis, nothing is 100% certain. No indicator can give you a 100% success rate. There is no holy grail in the financial market. As a trader, with the help of technical & fundamental indicators, our goal is to find an edge over the market. A simple definition of an edge is: Anything that adds a few points to the winning side of an equation builds an edge that lasts a lifetime. A trading edge defines your technical or strategic advantage in the highly competitive market environment. Traders can establish multiple edges by starting with popular strategies and customizing rules to lower the risk of getting trapped with the emotional crowd.
Disclaimer Note:
V.C Cumulative Delta Volume Bars It is purely Volume, Delta, Demand & Supply imbalance and comparative analysis based tool. Before applying this Indicator to your study, you should know about Volume, Delta & Spread, Demand & Supply, and Aggressive & Passive behaviour of buyers/sellers.
Some basic understanding of Sir Richerd Wyckoff's Theory can also be helpful.
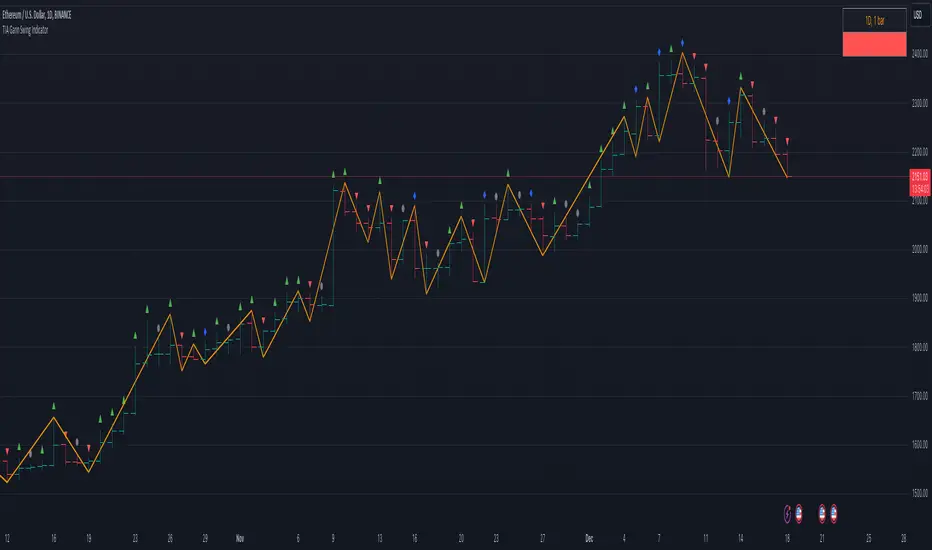
TIA Gann Swing IndicatorTIA Gann Swing Indicator
This indicator is a mechanical tool that tells the user exactly what the market trend is at any time, based on the teachings of Legendary trader, Mr. William D. Gann .
Gann called this tool the “Trendline Indicator,” but it has popularly become known as the “Swing Chart” by present-day traders.
In October 1909, Richard Wyckoff watched Gann for 25 market days (the markets traded on Saturdays back then), where Gann made 286 trades, both long and short. Two hundred sixty-four (264) of these trades were profits.
The Swing Chart was Gann’s primary trading tool helping him achieve these phenomenal trading results.
This indicator, now available to you in TradingView, automatically displays the swing chart and trend on any timeframe.
Selecting “Show Trend,” will light the background of the chart up, showing if the trend is “Up,” “Down,” or “Uncertain.”
The indicator is also fully customizable to display “Break Lines,” which indicate potential trend changes ahead of time.
Additional features include data about each bar and swing to give the user vital information, and the data points currently available include:
Bar Type
This indicator selection allows the user to identify precisely what each bar is, as per WD Gann’s Instructions.
Each of the 4 bar types includes:
Up bars, Down bars, Inside bars, Outside bars
Date
Displaying the date of swing tops and bottoms allows the user to stay on top of significant announcements and events in the economy. Often, market reversals occur right around critical economic events.
Time
This indicator selection allows the user to identify the time of the swing tops and swing bottoms. Designed for intra-day traders, this setting displays the exact time of tops and bottoms on any timeframe to help stay ahead of any important announcement.
Price
Price analysis is critical for every technical analyst, and displaying the price of swing tops and bottoms allows the trader or investor to stay on top of essential pivot points in the market. Identifying potential support and resistance levels keeps traders ahead of the herd.
Range
Identifying each swing’s price range gives the trader or investor critical information. Have you ever wondered if a market is gaining momentum or losing momentum? Knowing if price ranges are expanding or contracting is key, and this setting quickly displays what every swing range is doing.
Bar Count
What is the average number of bars up or down? Markets can only move in one direction for so many bars before a reversal. Simply displaying the number of bars between each swing gives the analyst valuable insights into overbought or oversold trends. Gann's famous “7-10 bar” rule identifies potential reversals, and this simple indicator setting can help any market participant stay ahead of the pack.
The TIA Gann Swing Indicator is an indicator that EVERY trader & investor should have at their fingertips. It is critical for long-term investors and short-term traders to know the trend of their market and vital information about the upswings and downswings. The TIA Gann Swing Indicator is the indicator to help.
See the Author's instructions below to get access to this package.
[VC] Effort & Result Index V1.0V.C. Effort & Result Index draws the Price change, Volume, Delta & Delta % as a histogram. On the positive side of the histogram, it marks the price change & on the negative side of the histogram, it marks volume, delta & delta %. And the best part of the indicator is that it allows you to see all the mentioned data types simultaneously.
See the below chart for a comprehensive understanding.
Before moving further, understand the below analogy first.
Volume & Delta = Fule or Effort
Price Movement = Result
Think of Volume & Delta as FULE or EFFORT and Price Movement as Result.
If the price travels a significant distance with less fule & effort, it indicates that no barriers or inverse forces are stopping the price movement.
On the other hand, if the price is travelling a less distance & consuming comparatively more fule & effort, it indicates some barriers or inverse forces stopping the price movement.
V.C. Effort & Result Index empowers you to read, compare & analyse Volume, Delta & Price effortlessly. It helps to measure the relative price change in different combinations. Such as, you can compare the price change with total volume, delta volume & delta percentage.
See the below relative comparison analysis by using Price Change, Volume Change & Delta Change.
In the above example, you can see that on candle A, there is a very significant price move with a small volume & delta. But on the next candle B, there is a minor price move compared to the previous candle A, but the volume is relatively high & delta is almost the same. In simple words, the same effort was applied to candle B but got fewer results than candle A. It indicates that buyers applied the same effort but failed to get the same results. It reveals that sellers are taking control, leading to a trend reversal.
This comparative analysis method & approach can add an extra edge to your analysis spacially on key levels & breakouts.
V.C Effort & Result Index Settings & Inputs
Price Change:
Allow you to show/hide the price change bars on the positive side of the histogram.
Volume:
Allow you to show/hide the total volume on the negative side of the histogram.
Delta%:
Allow you to show/hide the delta % on the negative side of the histogram.
Delta:
Allow you to show/hide the delta on the negative side of the histogram.
Style Settings
The Style section allows you to change the colors & the view format of all data types.
Disclaimer Note:
V.C Effort & Result Index is not a BUY/SELL signal based indicator or a holy grail trading system.
It is purely Volume, Delta, Demand & Supply imbalance and comparative analysis based tool kit. Before applying this indicator to your analysis, you should know about Volume, Delta & Spread, and Demand & Supply.
Some basic understanding of Sir Richerd Wyckoff's Theory can also be helpful.

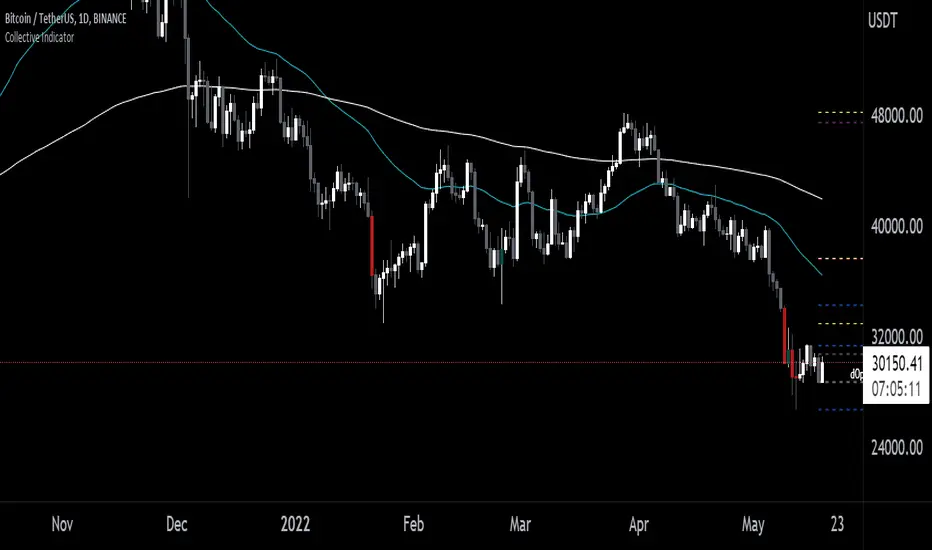
Collective IndicatorKey notes are that this indicators markets the High and Low of the previous day, week month and quarter. It also marks the open of the day, week, month and quarter. These are levels that can be important areas to take trades towards and away from.
It includes additional features some may wish to use that I've included for your convenience that I don't personally use anymore. This is the 50 and 200 EMAs and high volume candle coloring. EMAs can be helpful for identifying the average markup and markdown of a a trend on any given timeframe. Be careful with mean reversion strategies alone since they tend not to have great entries and could result in high losses if used in isolation.
The "Length" and "High Volume" settings control how the coloration of candles is applied. Length is the amount of bars it will use to calculate a volume average. "High Volume" is the multiplier used to distinguish how much additional volume you want to be considered "high" volume. 1x meaning average 2x meaning double volume and etc.
High volume identification can help show distributive or accumulative characteristics around key areas.
I personally focus on the Open, Low, High close data, apply SMC concepts and Wyckoff concepts to look for trades around these key areas.
[VC] Box Chart Histogram V1.0V.C Box Chart Histogram draws the cumulative delta that correlates to another indicator named ''V.C Box Chart Index'' .
(In other words, ''V.C Box Chart Histogram'' & ''V.C Box Chart Index'' are correlated.)
V.C Box Chart Histogram draws the cumulative delta as histogram based on ''V.C Box Chart Index''. Combining these two indicators empowers you to see the cumulative demand & supply / cumulative buying & selling quantity of each box.
You can also switch from cumulative delta mode to cumulative delta % from input settings. See the difference between simple delta & delta % mode from these examples.
Simple Delta Mode (Cumulative Demand & Supply)
In the above example, green & red boxes on the histogram show the cumulative delta of each box from the main chart. In simple words, these boxes show the cumulative net demand & supply of the corresponding box from the main chart. In this example, Big green boxes indicate demand is increasing, whereas small red boxes indicate that supply is decreasing.
Delta % Mode (Cumulative Volume-Weighted Demand & Supply)
Similar to the simple delta mode, in the above example, blue & red boxes on the histogram show the cumulative delta % of each box from the main chart. In simple words, these boxes show the cumulative & volume-weighted demand & supply of the corresponding box from the main chart.
In this example, Big blue boxes indicate that demand is increasing, whereas small red boxes indicate that supply is decreasing.
V.C Box Chart Histogram Properties & Settings
Inputs
Choose Your Source:
Allow you to switch from simple delta to delta %
Choose color of the box on simple delta:
Allow you to change the color of the box
Choose color of the box on delta %:
Allow you to change the color of the box
Style
Positive & Negative Simple Delta:
Allow you to see the simple delta in the column format.
Positive & Negative Delta %:
Allow you to see the delta % in the column format.
Boxes:
Allow you to show/hide the boxes
NOTE: You can also see both delta formats in dual view mode. (in column & box at the same time to have a more precise & detailed look)
See Below Example
Disclaimer Note:
V.C Box Chart Histogram is not a Buy/Sell signal based indicator or a holy grail trading system. It is purely a leading indicator that can help you to analyse demand & supply and buying & selling forces of the market in a smart & effortless way. Before applying this indicator to your analysis, you should have some basic knowledge about volume, delta, & supply & demand. Some basic understanding of Sir Richerd Wyckoff's Theory can also be helpful.

[UPRIGHT Trading] OrderZones - Supply & Demand (Predictive) (cc)Hello Traders,
This is one that I've been working on a very, Very long time. As easy as it is to draw after the fact, as someone well versed in Supply and Demand; it's a bit more difficult to create all the calculations to show them, code them out, and then I went a step further — attempting to predict future ones as well.
Let's talk about what Supply & Demand Zones are. They are a pattern and technical analysis technique used in day and swing trading. Demand zone represents the area with strongest buying pressure and Supply zone represents selling pressure. Often these zones will show Institutional/Large buyers and sellers executing their orders causing price to move up or down very quickly, creating a long wick on a small and sometimes momentum that feeds into the larger timeframes. Therefore, in the simplest terms, the Supply and Demand Orderzones are the zones the price often gets rejected from or returned to; when Demand exceeds Supply, price jumps up and vice versa.
Unlike lines of support and resistance , these are zones more closely than precise lines, but can help gauge Support and Resistance on the fly.
Richard Wykoff was one of the first market analysts to explain the interaction of these phases, giving them four labels. It is in the understanding of Wyckoff's explanation of market price action, that supply and demand zones are also known as Accumulation and Distribution zones (Accumulation, Markup, Distribution, Markdown).
Shows potential entries on break from zone. Pivots. Large breakdowns or breakouts signalling possible trend change.
Super Fast Real-time Orderzone creation. Resistance line at Supply, shows multiple dimensions of each zone when large enough.
Different calculation, line, transparency settings
Minimalist mode with autobox
Features:
Multiple calculation modes with different lengths and displays.
AutoBox (Predictive Orderzones).
Buy/Sell Highlights.
UPRIGHT – Ultimate Reversals (Support/Resistance version).
Breakouts/Breakdowns + Signals.
Pivot Labels (HH, HL, etc).
Pivot Bar.
Pivot Buy /Sell Signals.
Fully Customizable—Change line types, transparency, colors, etc).
I am still working on the calculations for one more addition, but as it is, this should help anyone automate their S/D technical analysis.
Please see author instructions for access.
Cheers,
Mike
(UPRIGHT Trading)

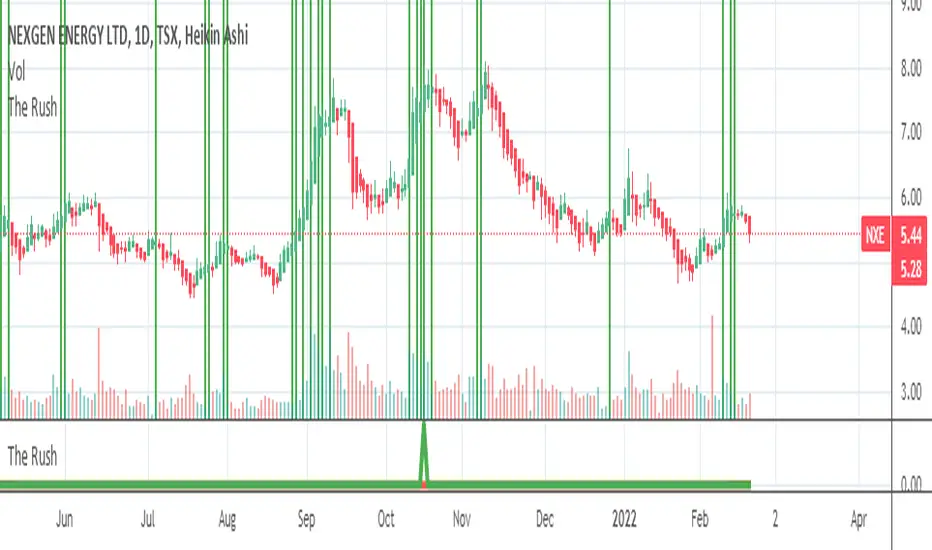
The Rush
█ OVERVIEW
This script shows when buyers are in a rush to buy and when sellers are in a rush to sell
═════════════════════════════════════════════════════════════════════════
█ CONCEPTS
Prophet Mohamed Peace be upon Him once said something similar to this "It is not advisable to trade if you do not know the
Volume".
In his book "The Day Trader's Bible - Or My Secret In Day trading Of Stocks", Richard D. Kickoff wrote in page 55
"This shows that there was only 100 shares for sale at 180 1/8, none at all at 180f^, and only 500 at 3/8. The jump from 1 to 8 to 3/8
Emphasizes both the absence of pressure and persistency on the part of the buyers. They are not content to wait patiently until they can
Secure the stock at 180^/4; they "reach" for it."
This script was inspired by these two great men.
Prophet Mohamed Peace be upon Him showed the importance of the volume and Richard D. Kickoff explained what Prophet
Mohamed Peace be upon Him meant.
So I created this script that gauge the movement of the stock and the sentiments of the traders.
═════════════════════════════════════════════════════════════════════════
• FEATURES: The script calculates The Percentage Difference of the price and The Percentage Difference of the volume between
two success bullish candles (or two success bearish candles) and then it creates a ratio between these two Percentage
Differences and in the end the ratio is compared to the previous one to see if there is an increase or a decrease.
═════════════════════════════════════════════════════════════════════════
• HOW TO USE: if you see 2 or more successive red bars that mean bears are in hurry to sell and you can expect a bearish trend soon
if the Market Maker allows it or later if the Market Maker wants to do some distribution.
if you see 2 or more successive green bars that mean bulls are in hurry to buy and you can expect a bullish trend soon if the Market
Maker allows it or later if the Market Maker wants to do some accumulation.
═════════════════════════════════════════════════════════════════════════
• LIMITATIONS:
1- Use only Heikin Ashi chart
2- Good only if volume data is correct , meaning good for a centralized Market. (You can use it for forex or
crypto but at your own risk because those markets are not centralized)
═════════════════════════════════════════════════════════════════════════
• THANKS: I pay homage to Prophet Mohamed Peace be upon Him and Richard D. Kickoff who inspired the creation of this
Script.
═════════════════════════════════════════════════════════════════════════
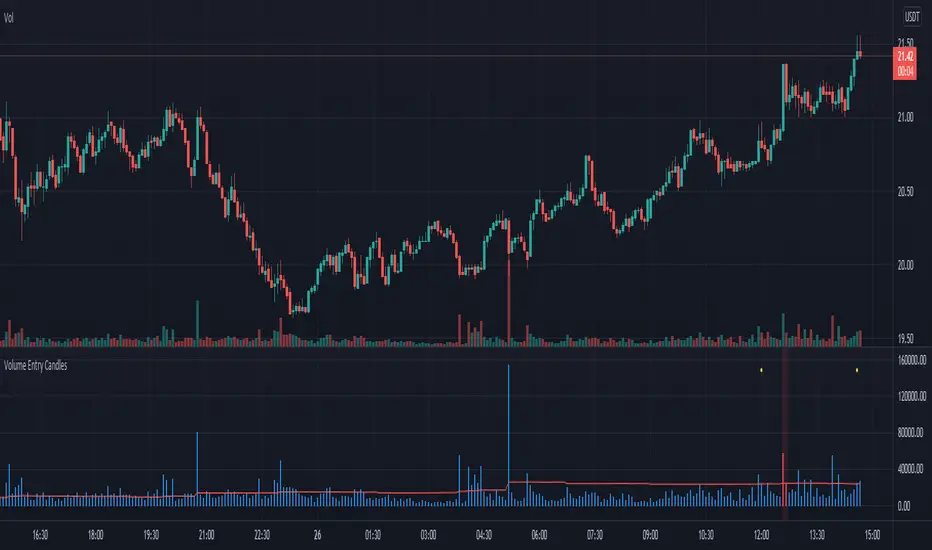
Volume Entry CandlesIntroduction
For Wyckoff, three things are important in analyzing the market: price, time, and volume . This indicator provides two types of signals:
- linked to large movements of volumes (red and purple circles on top);
- large price movements concerning volatility (green/red triangle up/down);
In the first case, it highlights the volumes that differ from the most common values, allowing us to trace the levels that the market feels.
Two levels highlight the volume peaks and two calculation methods can be chosen: by exponential moving average or by standard deviation.
In the second case, the signal is based on Volatility and highlights the cases in which the high and low of the last three candles exceed the ATR by a certain number of times. This may indicate situations where the market corrects the price after a fairly large move.
in addition, a table will give us statistical information that tells us:
- from how many candles a condition does not occur
- the average of the candles for which it occurs
- the maximum number of candles for which this condition has not occurred
Obviously, like any statistical tool, it is not intended as absolute certainty
Settings
Analyze all / Minutes: By checking the box, we analyze all the candles in the chart, removing the check will only analyze the period set in minutes.
Type of Level: Select the strategy to calculate the critical levels of the volumes, we can choose Ema or Standard Deviation.
Minimum tail in %: here we can exclude candles where tails aren't enough big, for example if we want to exclude candles without a tail. Use a negative value to ignore this control
We then have three groups:
- the first for the EMA ;
- the second for the Standard Deviation;
- the third for the ATR and its multiplier;
each has configuration parameters such as period and multiplier
Period: length for Ema , or Standard Deviation or ATR function
level1 and level2: they are the multipliers for the two levels
ATR multiplier: multiply the ATR value that must be exceeded by ( high-low ) of the last few candles
n candles: set the number of candles
Help
Show Vol Histogram to fine-tuning: if checked show histogram and lines to tune the indicator
Dimension: to set the histogram dimension
Base: set the price level where we want the histogram, in fact, the histogram is not dynamically displayed, it needs a price to appear
How to use
I follow this step for scalping trading:
- Select time frame 1 minute;
- Personally, I deselect "show the first level", and use only the second level;
- In the candles indicated by the purple circle and I draw a horizontal line on the closing of the candle;
- I can use the levels plotted with time frames at 1min also the time frames at 3min and 5 min
the volatility trigger appears as green/red columns in the histogram.
- green colors indicate a bullish reversal;
- red colors indicate a bearish reversal;
Example Bullish reversal
Moderate risk:
Entry point: above high
Stop loss: below low
High risk:
Entry point: a half body of the trigger candle
Stop loss: 1 ATR below the low of the trigger candle
Tips
Pair this indicator with some Moving Average and/or divergence indicator.
This is the twin of an indicator that I made, called "Volume Analysis". It's better if you prefer to analyze levels by yourself and keep the volume values always visible
Volume Analysis Chart v2.0Introduction
For Wyckoff, three things are important in analyzing the market: price, time, and volume . This indicator provides two types of signals:
- linked to large movements of volumes (red and purple circles on top);
- large price movements concerning volatility (green/red triangle up/down);
In the first case, it highlights the volumes that differ from the most common values, allowing us to trace the levels that the market feels.
Two levels highlight the volume peaks and two calculation methods can be chosen: by exponential moving average or by standard deviation.
In the second case, the signal is based on Volatility and highlights the cases in which the high and low of the last three candles exceed the ATR by a certain number of times. This may indicate situations where the market corrects the price after a fairly large move.
in addition, a table will give us statistical information that tells us:
- from how many candles a condition does not occur
- the average of the candles for which it occurs
- the maximum number of candles for which this condition has not occurred
Obviously, like any statistical tool, it is not intended as absolute certainty
Settings
Analyze all / Minutes: By checking the box, we analyze all the candles in the chart, removing the check will only analyze the period set in minutes.
Type of Level: Select the strategy to calculate the critical levels of the volumes, we can choose Ema or Standard Deviation.
Minimum tail in %: here we can exclude candles where tails aren't enough big, for example if we want to exclude candles without a tail. Use a negative value to ignore this control
We then have three groups:
- the first for the EMA ;
- the second for the Standard Deviation;
- the third for the ATR and its multiplier;
each has configuration parameters such as period and multiplier
Period: length for Ema , or Standard Deviation or ATR function
level1 and level2: they are the multipliers for the two levels
ATR multiplier: multiply the ATR value that must be exceeded by ( high-low ) of the last few candles
n candles: set the number of candles
Help
Show Vol Histogram to fine-tuning: if checked show histogram and lines to tune the indicator
Dimension: to set the histogram dimension
Base: set the price level where we want the histogram, in fact, the histogram is not dynamically displayed, it needs a price to appear
How to use
I follow this step for scalping trading:
- Select time frame 1 minute;
- Personally, I deselect "show the first level", and use only the second level;
- In the candles indicated by the purple circle and I draw a horizontal line on the closing of the candle;
- I can use the levels plotted with time frames at 1min also the time frames at 3min and 5 min
the volatility trigger appears as green/red columns in the histogram.
- green colors indicate a bullish reversal;
- red colors indicate a bearish reversal;
Example Bullish reversal
Moderate risk:
Entry point: above high
Stop loss: below low
High risk:
Entry point: a half body of the trigger candle
Stop loss: 1 ATR below the low of the trigger candle
Tips
Pair this indicator with some Moving Average and/or divergence indicator.
This is the twin of an indicator that I made, called "Volume Analysis". It's better if you prefer to analyze levels by yourself and keep the volume values always visible

Column XOColumn XO is an indicator in Prashant Shah's book Trading The Markets The Point & Figure Way. It counts a number of Xs and Os in every column for the long period. Then, the result is divided by the number of columns which is set by length.
This indicator is designed to identify changes in volatility and works well with Wyckoff's Law of Cause and Effect. The longer the price spends in the consolidation, the more volatile and far-reaching should the expansion phase be.
Good luck!

Heatmap Volume ColorBar trial v7FTJR20 This indicator is a heatmap of financial volume by repainting the candlesticks, I use three different ways to define the heatmap separating it into 3 phases:
Phase A: low volume
Phase B: average volume
Phase C: high volume
Don't worry about this data, the trial indicator is configured to auto-interpret the information.
The heat map uses the following colors and specifications
Red = Ultra High Volume
Orange = High volume
Yellow = Average Volume (balance)
Blue = Low volume
White = Volume below average
The heat map compares the phases to identify if it finds a standard deviation over time, that is, it is possible to see a smaller volume with the same red bar as before, because the aggressions are updated in real time.
I also created a trend line moved by the accumulated volume x the average price, there will always be an important zone, where the long/short can defend or not their position.
Tutorial:
1.0 - It is necessary that you have the minimum knowledge of waves, a quick explanation is that the market always works in 5 (1 to 5) or in 3 waves (ABC).
1.1- The Concept: When identifying the 3 wave or the C wave with a red cadle and a spread 2 to 3x larger than the average, mark the bottom and top of this red cadle.
-Note that in the example I marked it and named it "Support 3"
Note 1: Note that I had already marked the "Support 1" line from the moment the asset went down.
This candlestick is important for two reasons, it is a red candlestick with ultra volume and it was the beginning of the bullish impulse, if there was a place for the buyer to defend it was there.
Note 2: We don't know if the top or bottom of the candle was a support or resistance, check, be patient, watch the movement inside this red cadle and what the color of the cadles will be in the movements.
1.2 - see that the market makes several zig zags within our marking, and the color of the cadles turned white and blue (low volumes) someone was acting passively (probably who absorbed the red bar, we don't know yet).
1.3 - see that the price comes very close to the trend line and as it approaches the price drops with an aggression at the end, see that the cadle turned orange, even with the aggression the price goes back up, at this moment we already see that there is someone buying and defending the position.
Note: red, orange and yellow candles are aggressors.
1.4 - In the marking of point , see that the price falls in the region of the orange bar...
*remember, aggression bars are important regions, tick!
Note that the price drops with blue and white bars, breaks the previous bottom without aggression, see that the bars are blue, the seller has been absorbed and the buyer starts to attack.
On this occasion, see how many factors led you to believe that there was institutional defense there, be patient and study the attitudes within the chart.
1.5 - look at point 2 we see the price breaking the trend line,
there was a resistance there was a lot of money, so another red bar, the market from the sequence on the high and stops exactly at the line marked with "support 3", there was a region to protect the operation, my stop is below the red bar near 35k , where there is defense.
1.6 - Sequence market in the move and test the "resistance 1" and feel offer, see the perfection of the corrective zig zag in (ABC) on top of the red bar "the biggest red bar" of that move in point 4.
-see market tests 2x the top of "support 3" and takes the bear out of the game.
1.7 - From point 4 onwards, the market of the bullish sequence with aggression an orange bar and at point 5 we have another red bar, that is, we are close to a new resistance, "resistance 2", at this time the market is above this red bar from point 5, it is still bullish, below it, it may seek the trendline and its breakout may seek the "support 1" line.
- I like your feedback and leave your settings and experiences in the comments.

Smoothed Wave ScalperThis one is a little different.
Instead of layering lots of indicators to filter noise, I'm instead using two different kinds of price averaging to smooth the candles and better define the direction. Just select a smoothing value that fits your chart and timeframe. In theory, this should remove a fair bit of noise (although nothing's perfect)
I've managed to determine when the candles change colour, signifying a potential new trend. When the candle colours do change, an alert is fired. It's as simple as that! Wyckoff wave volume analysis is then applied to each alert to validate the move. Further filtering can be achieved using heikin ashi candles if this is your preference.
Alerts are built in for both the candle colour change and the wave filtered signals (long/short). Use long/short for entries and the colour changes for exits.
I'm currently trading with linear regression to help indentify obvious channels and areas of support/resistance. The candles bouncing down off of the upper band can confirm a downward trend, and bouncing off of the lower band can signify an up trend. It's much easier to see with smoothed candles like these and can give you confidence when trading manually. These bands are rendered automatically, but aren't essential to taking a trade.

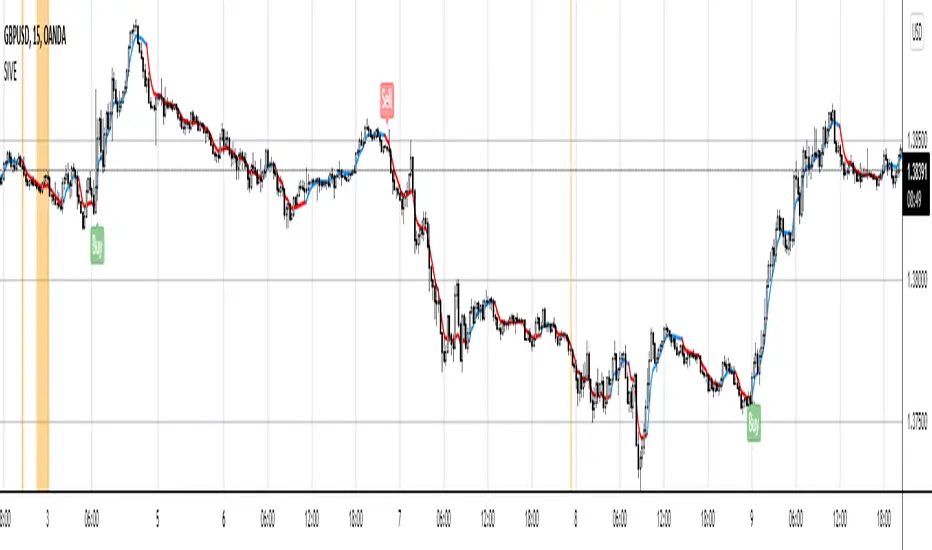
SIVE 1.0SIVE 1.0
What is SIVE?
SIVE stands for Systematic Institutional Volatility Expansion , SIVE uses a variety of different statistical indicators to gauge volatility along with trend correlation and other measures to filter and define a price move. This system was originally set out to redefine what a 'Trend Following System' could be; we achieved more than just that. We had created what is considered to be one of the first retail quantitative trading system, that incorporates trend following mechanics as well as trend reversal techniques. All while being aligned/correlated to trend and volatility. Something truly powerful to put into the hands of the every day trader, demystifying what quant trading can be while easily presenting it in a way where even your mom could learn how to use the system without being overwhelmed.
What makes this different from any other trading system?
SIVE raises the bar on what traditional indicators and trading systems can do, traditionally you have lagging indicators that only tell you what happened in the past with no correlation to the market or what can happen in the future. Really providing little to no statistical value, yet completely idolized by the retail world. Where SIVE exceeds these systems is all in the math and the application of those formulas to the time/price, finding the synchronicities to exploit for profits as well as exploiting the high probabilities of non-random events. How we do it? well that's in the secret crabby patty formula.
Where we are now, and where we plan to go
SIVE as it stands right now is the very first iteration of the retail quantitative trading system, it is performing exceptionally well but we aren't take that as our standard as we want to always raise the bar. as it stands, we are already working on the updates to come that will dwarf anything we've done in the past.
Our goal with SIVE is to be able to provide an easy to learn and easy to profit trading system that will provide the retail public with a trust worthy system to use. In the future our updates will carry heavier weight on key aspects like Risk to Reward, Win rates and capturing those big parabolic movements that everyone dreams of. Far fetched? for the traditional indicator junkies, but for a Quant it is just a matter of time.
What does it perform best on?
Simply put, yes... We set out to create this to be used for any trading instrument and any timeframe. Intraday timeframes have been shown to give more trades and typically higher reward trades as your able to execute with a high degree of accuracy 1:2 is very modest and can easily be achieved but we have also seen so so many trades run higher than 1:10 and even 1:20!! but as you already may know the market doesn't always give those favorable conditions to trade that high of a Risk to Reward all the time.
Stocks, Crypto, Forex, Metals, Energies, Indices, etc. are all tradeable with SIVE
We hope to see you in the discord!
]https://discord.gg/rqPBKbGtyu
Images provided below are just the tip of the iceberg on what SIVE can do!
AMD-ImbalanceThis script looks at three consecutive candles and if there is an area between the wicks of the first and third candle, it will paint a box to mark the area.
The marked area is considered an imbalance or inefficiency in the market. Price usually finds its way back to that area of imbalance to clear it.
As price clears part of the area of imbalance, the box turns from a solid border to a dashed border.
Quantum Volume Point of Control (VPOC)Many forex traders are familiar with the concepts of volume price analysis as enshrined in Wyckoff’s three laws of effort and result, cause and effect and supply and demand. This is the linear relationship between volume and price. Now with the Volume Point of Control, this relationship is taken to the next level adding the concept of time and inspired by the ideas behind market profile.
The Quantum Volume Point of Control, or VPOC indicator blends ALL THREE of these important aspects of trading into a single powerful and visual indicator.
The Quantum VPOC indicator takes the analysis of volume and price to a higher level, which both complements and expands the VPA relationship. Whilst the Quantum tick volumes indicator considers the relationship between a single volume bar and its associated candle on the price time x-axis or groups of candles and volume bars, the Quantum VPOC indicator analyses the density and intensity of volume over time against price. In other words, the volume price relationship on the y axis. It does this in three distinct ways as follows:
First, the Quantum VPOC indicator constructs the Volume Profile from a set number of bars in history to the most current bar. The Volume Profile is then presented as a vertical histogram shown at the right edge of the chart – a stack of horizontal bars of varying lengths, but of equal height representing the amount of activity at each price level.
Second, the Quantum VPOC analyzes the Volume Profile to find the key price levels where activity is strong and rising, or weak and falling. In other words, the indicator looks for peaks (long bars) of the Volume Profile where price tends to be attracted as these are areas where price was previously accepted. These are called High Volume Nodes (HVN). The indicator also looks for troughs or valleys (short bars) of the Volume Profile where price tends to be repelled as these are areas where price was previously rejected. These are referred to as Low Volume Nodes (LVN). Both types of price level act as precise zones of support and resistance and as such are projected across the chart within the given period.
Third, the Quantum VPOC indicator looks for the Highest Volume Node or the highest peak in the Volume Profile and marks it as the Volume Point of Control – the price level which acts as the fulcrum from which price pivots. The indicator completes its calculations and updates as each new volume bar is delivered.
The result is a chart revealing the overarching influence of volume at price, coupled with time.
The Quantum VPOC indicator displays several key pieces of information on the chart as follows:
- Volume Profile – this appears as a histogram of volume on the vertical price axis on the right-hand side of the chart. The peaks and troughs are clearly displayed highlighting both High and Low Volume nodes.
- High volume node (HVN) – this is where we have a bulge in the volume profile generally because of an extended phase of price congestion. As a result, as the market approaches these regions on the chart price action is likely to become waterlogged with further congestion likely with the node acting as a strong area of support or resistance. As we have seen a strong acceptance of price at this level in the past, this is likely to be repeated with the market swinging in a range. Ultimately the market may reverse off these levels, with any move through then confirming the current sentiment.
- Low volume node (LVN) – this is where we see low volume in the volume profile. In these regions, the market has only paused temporarily – in other words a region where price has been rejected in the past. As such we are likely to see the market move quickly through these regions with little in the way of resistance or support acting to prevent a further advance of decline in price. The current sentiment is likely to continue and build quickly through these levels.
- Support and Resistance Zones – these are drawn at the High and Low Volume nodes to highlight the various HVN and LVN levels on the price axis.
- Volume Point of Control Line – this is drawn as a single line on the highest volume of the High Volume Node in the timeframe and clearly defines the tipping point of sentiment. This moves dynamically and represents the fulcrum of market sentiment where price has reached agreement, before moving on. If it is above the price action, then the current market sentiment is bearish. If it is below the current price action, then the current market sentiment is bullish. The VPOC Line reveals this balance simply, quickly, and clearly allowing you to judge market sentiment with accuracy and confidence.
As with all the Quantum Trading indicators, the VPOC indicator is dynamic, constantly changing and updating to reflect the relentless shift in sentiment as the market moves from bullish to bearish and back again. The indicator works in all timeframes and provides a powerful and much deeper understanding of support and resistance through the prism of volume and the associated High and Low Volume Nodes, with the Point of Control itself, acting as the fulcrum of the market.

Quantum Dynamic Accumulation and DistributionIf you’ve been trading for any time, you will almost certainly have come across the concept of support and resistance. This powerful and simple concept lies at the heart of technical analysis. It forms the cornerstone of price action trading.
However, you can also think of support and resistance in another way. After all, these are also price areas where a market has paused, reversed, or moved into a congestion phase before moving on. As a result, these price regions are associated with sustained buying and selling, or what Wyckoff called Accumulation and Distribution. These two concepts go hand in hand, and you can think of these in simple terms as follows:
- Accumulation relates to how an area of support performs
- Distribution relates to how an area of resistance performs
It is these two powerful concepts which come together in the Quantum Accumulation and Distribution indicator. It is the act of accumulation (buying) over a sustained period which creates the support region, whilst the act of distribution (selling) over a sustained period creates the resistance region. Having the power to see both, gives you unparalleled insights into price behaviour at these key levels, and the confidence to forecast future market behaviour as a result.
Most traders still draw their lines manually, leading to a crude interpretation of these key levels. Even those companies who have developed a trading indicator, have developed an equally imprecise tool. No doubt you’ve seen them. Generally, these appear as wide bands on the chart, indicating vague areas of congestion, with associated support and resistance bands. These are virtually useless. They lack precision, or definition.
So, why has no one ever considered accumulation and distribution and the associated support and resistance as dynamic? After all, wouldn’t a dynamic indicator deliver high quality information where you need it most – at the live edge of the market?
Well perhaps no one has ever thought about it in this way before. After all, price action is dynamic.
Well, that’s what we thought too, and here it is at last – the Quantum Dynamic Accumulation and Distribution indicator. The first, and only dynamic indicator in the world which displays two things simultaneously. The regions of accumulation and distribution, and from that, the associated price levels of support and resistance. Even more so, it also displays the strength of these regions, the number of times they have been tested, and from which direction. This translates into a visual picture of the accumulation and distribution zones.
Finally, on your TradingView platform, you will have an indicator that truly defines, with pinpoint accuracy, those areas of price support and resistance associated with accumulation and distribution which are so important to you as a trader.
It’s an immensely powerful indicator which maps out the direction of price at any given moment. For most traders, the profit that springs from trading, comes from determining these levels precisely. This indicator will give you the confidence to forecast where the market is likely to move next, giving you the ability to gauge:
- Optimum entry levels
- Safe exit levels
- Proper stop loss levels
- Excellent take profit levels
But as with all Quantum Trading indicators, there’s more, a great deal more!
The indicator shows you both graphically and numerically, how many times the price region has been tested. Levels which have been tested several times, will appear as deeper lines, whilst those levels tested only once or twice will appear as narrower lines. This instantly reveals the depth of any accumulation or distribution regions, and hence the likelihood of the level holding or being breached. Each level is painted blue or red to show you whether that level has seen accumulation or distribution in the past. If the level is painted red, then this has been an area of price distribution, and if painted blue then this is accumulation. An area of price accumulation is likely to act as support if approached from above, and if breached from below, to then provide bullish support to a further move higher. Conversely, an area of price distribution is likely to act as resistance if approached from below, and if breached from above, to then provide bearish resistance to a further move lower. The indicator is dynamic, which means the support and resistance lines generated coincide with the current price action.
Every market behaves slightly differently. They each have their own price characteristics which are then reflected in the price action, which in turn is reflected in the dynamic accumulation and distribution levels. So, once again, we have included your own fine control. Using the custom option, you can increase or decrease the number of zones that appear on each chart, to suit your own trading style and approach. Some traders prefer more detail, others prefer less. The indicator caters for everyone. It’s a personal choice. It simply means you have full control to customise the indicator the way you want it. Matching the tool to the job means greater consistency and greater profitability.

MS POIVThis indicator was introduced by Larry Williams in 2007 and is very similar to the well known OBV indicator.
As such, it should be examined for convergence and divergence with the price trend. The interpretation can be done using the Wyckoff principles.
* Price rises, POIV stays behind => no subsequent demand
* Price meets resistance, POIV reaches new highs => supply (distribution) in the background
* Price and POIV rise synchronously => price trend is intact
These statements can of course be applied correspondingly to falling prices.
Larry Williams wrote for explanation:
Despite the problem, volume indictors have proven their worth, but while it is
a good idea to watch the cumulative flow of buying and selling pressure, you
should not assign all of this buying and selling to bulls and bears. Combined
with other concepts, such as keying off the open, we can focus on something
more germane to trading based just on volume, or what some might consider
related volatility indicators, such as daily ranges.
Futures traders can consider at least one solution to this problem: open
interest. Open interest is the number of outstanding contracts in a particular
market. (...))
The formula is calculating the cumulative sum of open interest times the net
change in price, divided by the true range. We then add the OBV value to this
cumulative sum.
So we first take the net change in price (today’s close minus yesterday’s close)
to get a percentage of where within the range the close was. Not all of the
activity will be buying or selling; the market “tells” us what percentage of
open interest goes to the buy or sell side.
Not only that, it also means we are incorporating price and trend change into
the formula.
(...)
One note of warning is necessary. The Williams POIV AD is a specific formula
that compensates for the close within the range relationship, as well telling
us how much OI to use, but it is an indicator, not a trading system. In
practice, it is useful to confirm a trade or to focus attention on a potential
trade. It is not intended to stand as the sole reason to initiate a position
in the market.

vDragon Flow Trend I will share one of the tools that I use daily with you. Based on PVSRA (a methodology developed by Trade at Home using, price action, volume wyckoff, support / resistance, trends all in one method), it is composed of exponential averages, which I think is plausible, however, it would not be more easy if the main moving average was not made with its own volume?
Having this idea, I created this indicator, but let’s its functions and WHY you don’t waste time and use this indicator once and for all. Firstly, we know that a moving average is used to identify long-term trends, but because it is a price indicator, it takes into account PRICE, that is, being a late indicator, that is, who looks at prices, looks back and not forward, so I decided to use moving averages weighted by volume, to then make this delay in the moving average decrease considerably.
What are the benefits of using vDragon Trend instead of a normal and convenient average.
* The benefit of this indicator is to track the flow of a long-term trend, being similar to the session's VWAP, for example, but as VWAP has a limitation of only being able to show the average price of Market Makers only on the intraday, vDragon can do this, even showing the average price of these players in the long run.
* It is a fast and accurate moving average, depending on the flow entering the market, its curve will be greater than an average that reflects the price.
* The band, can increase or decrease depending on the volatility and the volume that happens.
* It takes from the Maximum to the Minimum for a certain period, just so you don't fall into springs.
* Most moving averages are not efficient on fast graphs like ticks or 1-minute graphs, but vDragon manages to adapt the graphical time, thanks to the volume, which is where we located the performance of Smart Money, remembering, I tested the vDragon within a 15-second chart on the FDAX inside the EUREX bag, and it serves a lot.
* Perhaps the best support or resistance you will find, I can give you an example, if it happens that the price rises with remarkable volume on top of vDragon, it can possibly be characterized as an absorption, sometimes too;
* can be used to identify zones of HFTs or algorithms that work with average prices in liquidity regions, since volume is also liquidity.
* can be used to identify linked accumulations in the accumulation or distribution.
There are several things for you to use vDragon as a strategy, use in a way that fits your strategy or operational.
Remembering, this indicator is my authorship
© Victor Eduardo Meireles
available to tradingview for free, be wary of anyone trying to sell you this indicator.