The Butterfly [theUltimator5]This is a technical analysis tool designed to automatically detect and visualize Butterfly harmonic patterns based on recent market pivot structures. This indicator uses a unique plotting and detection algorithm to find and display valid Butterfly patterns on the chart.
The indicator works in real-time and historically by identifying major swing highs and lows (pivots) based on a user-defined ZigZag length. It then evaluates whether the most recent price structure conforms to the ideal proportions of a bullish or bearish Butterfly pattern. If the ratios between price legs XA, AB, BC, and projected CD meet defined tolerances, the pattern is plotted on the chart along with a projected D point for potential reversal.
Key Features:
Automatic Pivot Detection: The script analyzes recent price action to construct a ZigZag pattern, identifying swing points as potential X, A, B, and C coordinates.
Butterfly Pattern Validation: The pattern is validated against traditional Fibonacci ratios:
--AB should be approximately 78.6% of XA.
--BC must lie between 38.2% and 88.6% of AB.
--CD is projected as a multiple of BC, with user control over the ratio (e.g., 1.618–2.24).
Bullish and Bearish Recognition: The pattern logic detects both bullish and bearish Butterflies, automatically adjusting plotting direction and color themes.
Custom Ratio Tolerance: Users can define how strictly the AB/XA and BC/AB legs must adhere to ideal ratios, using a percentage-based tolerance slider.
Fallback Detection Logic: If a new pattern is not identified in recent bars, the script performs a backward search on the last four pivots to find the most recent valid pattern.
Force Mode: A toggle allows users to force the drawing of a Butterfly pattern on the most recent pivot structure, regardless of whether the ideal Fibonacci rules are satisfied.
Dynamic Visualization:
--Clear labeling of X, A, B, C, and D points.
--Colored connecting lines and filled triangles to visualize structure.
--Optional table displaying key Fibonacci ratios and how close each leg is to ideal values.
Inputs:
Length: Controls the sensitivity of the ZigZag pivots. Smaller values result in more frequent pivots.
Tolerance (%): Adjustable threshold for acceptable deviation in AB/XA and BC/AB ratios.
CD Length Multiplier: Projects point D by multiplying the BC leg using a value between 1.618 and 2.24.
Force New Pattern: Overrides validation checks to display a Butterfly structure on recent pivots regardless of ratio accuracy.
Show Table: Enables a table showing calculated ratios and deviations from the ideal.
Cari dalam skrip untuk "accuracy"

Murrey Math Lines v6Murrey Math Lines v6
This is not just another Murrey Math indicator. It's a complete, ground-up modernization of the classic concept, rebuilt with the latest Pine Script features for unparalleled performance, accuracy, and usability. While preserving the core mathematical genius of T.H. Murrey's system, this version introduces a suite of modern tools designed for today's trader.
What are Murrey Math Lines?
Murrey Math Lines (MML) are a powerful system of support and resistance based on geometric formulas developed by T.H. Murrey. As a derivation of W.D. Gann's observations, Murrey's geometry simplifies Gann's theories into a more accessible application. The core principle is that price action tends to trend and retrace in 1/8th intervals.
These intervals create a "trading octave" with distinct levels, each having its own characteristic behavior:
& - Ultimate Resistance & Support: These lines are the hardest to break. They represent the top and bottom of the expected price range and are prime areas for reversals.
- Major Pivot: This is the most significant level, offering the strongest support and resistance within the octave. Price has a high probability of stopping and reversing here.
& - Strong Pivot/Reversal: These are strong, secondary pivot points where price often struggles to pass through.
& - The Trading Range: The price tends to consolidate between these two lines about 50% of the time. A decisive break outside this range often signals the start of a new trend.
& - Weak Support/Resistance: These levels are weaker, but when price moves too quickly towards them, they can act as initial stopping points or areas for a minor reversal.
& - Extended Octave: These lines show extreme overbought and oversold conditions beyond the primary 0/8 to 8/8 octave.
Modern Enhancements in This Version
Session-Locked Precision: Anchor the Murrey Lines to the start of a specific trading session (e.g., NYSE open). The levels remain constant for the entire session, providing a stable and reliable framework for your daily analysis.
Visual Trading & Reversal Zones: Instead of just lines, this indicator can fill the key trading range (3/8 to 5/8) and reversal zones (0/8-1/8 & 7/8-8/8) with color, giving you an instant visual reference of market sentiment.
Dynamic "Closest Price" Labels: Declutter your chart! The indicator can intelligently display only the label for the Murrey level closest to the current price, keeping your view clean while providing critical information at a glance.
Integrated Alert System: Never miss a key level touch again. Set up alerts for when the price approaches major lines, the trading range, or all lines, customized to your trading style.
Advanced Pine Script Engine: Built on a modern codebase using User-Defined Types and dynamic drawing objects (line, box, label). This ensures the indicator is fast, efficient, and non-repainting, even on lower timeframes.
Intuitive User Interface: Settings are neatly organized into collapsible groups with clear tooltips, making it incredibly easy to customize every aspect of the indicator, from calculation parameters to colors.
A Note on Accuracy
Some of the other Murrey Math indicators on TradingView use different formulas and therefore produce varying results. This version has been carefully checked against MML indicators on other professional platforms to ensure its calculations are accurate and reliable.
Credits
This indicator is a complete overhaul and modernization of the original "MM Lines " script. Full credit for the original calculation logic and concept goes to its author, JRL_6.

Market Pulse ProMarket Pulse Pro (Pulse‑X) — User Guide
Market Pulse Pro, also known as Pulse‑X, is an advanced momentum indicator that combines SMI, Stochastic RSI, and a smoothed signal line to identify zones of buying and selling strength in the market. It is designed to assess the balance of power between bulls and bears with clear visualizations.
How It Works
The indicator calculates three main components:
SMI (Stochastic Momentum Index) – measures price position relative to its recent range.
Stochastic RSI – captures overbought/oversold extremes of the RSI.
Smoothed Signal Line – based on closing price, smoothed using various methods (such as HMA, EMA, etc.).
Each component is normalized to create two final values:
Bull Herd (Buying Strength) – green line.
Bear Winter (Selling Strength) – red line.
Interpretation
Bull Herd (high green values): Bulls dominate the market. May indicate the start or continuation of an uptrend.
Bear Winter (high red values): Bears dominate. May indicate reversal or continuation of a downtrend.
Convergence around 50%: Market is balanced. Signals are weaker or indecisive.
Tip: Combine with price action analysis or support/resistance levels to confirm entries.
Customizable Settings
You can adjust:
SMI Period, Smooth K, and D – control the sensitivity of the SMI.
RSI Period – sets the RSI calculation window.
Signal Period – period for the price-based signal line.
Smoothing Methods – choose between HMA, EMA, WMA, JMA, SMMA, etc.
Line Width – thickness of the plotted lines.
Note: The JMA (Jurik Moving Average) used in this script is not the original proprietary version.
It is a custom public version, based on open-source code shared by the TradingView community.
The original JMA is copyrighted and owned by Jurik Research.
How to Use It in Practice
Buy Entries
When the green Bull Herd line crosses above 60 and the red Bear Winter line falls below 40.
Entry is more reliable if the green line is rising steadily.
Sell Entries
When the red Bear Winter line crosses above 60 and the green Bull Herd line falls.
Signals are stronger when there is a clear crossover and divergence between the two lines.
Avoid trading near the neutral zone (~50%), where the market shows indecision.
Additional Tips
Combine with volume analysis or reversal candlestick patterns for higher accuracy.
Test different smoothing methods: HMA is more responsive, SMMA is smoother and slower.

Regression Channel (Interactive)Weighted Interactive Regression Channel (WIRC)
Overview
The Weighted Interactive Regression Channel improves on traditional regression channels by emphasizing key price points through intelligent weighting. Instead of treating all candles equally, WIRC adapts to market dynamics for better trend detection and channel accuracy.
Key Differences from Standard Channels
Weighted vs. Equal: Prioritizes significant events over uniform weighting
Dynamic vs. Static: Adapts in real time to market changes
Accurate vs. Basic: Reduces noise, enhances signal clarity
Customizable vs. Fixed: Full control over weights and visuals
Weighting Methods
Direction Change – Highlights reversal points via local peaks/troughs
Volume-Based – Emphasizes high-volume candles, ideal for breakouts
Price Range – Weights wide-range candles to capture volatility
Time Decay – Prioritizes recent data for current market relevance
Interactive Features
Data Range: Set channel start/end over 1–500 bars
Visuals: Line styles, color coding, fill options, reference lines
Stats: Slope, R², standard deviation, point count, weight method
Technical Implementation
Weighted Regression Formula: Uses weights for slope, intercept, and deviation
Channel Lines: Center = weighted regression; bounds = ± deviation × multiplier
Usage Scenarios
Trend Analysis: Use Direction Change + longer range
Breakouts: Use Volume weighting + fill + boundary watching
Volatility: Apply Price Range weighting + monitor standard deviation
Current Market: Use Time Decay + shorter ranges + stat display
Parameter Tips
Channel Width:
Narrow (1.0–1.5): Responsive
Standard (1.5–2.0): Balanced
Wide (2.0–3.0+): Conservative
Weighting Intensity:
Conservative (1.5–2.0)
Moderate (2.0–3.0)
Aggressive (3.0+)
Advanced Use
Multi-Timeframe: Use different weightings per timeframe
Market Structure: Detect swings, institutional zones
Risk Management: Dynamic S/R levels, volatility-driven sizing
Best Practices
Start with Direction Change
Test different ranges
Monitor stats
Combine with other indicators
Adjust to market context
Recalibrate regularly
Conclusion
WIRC delivers a smarter, more adaptive view of price action than standard regression tools. With real-time customization and multiple weighting options, it’s ideal for traders seeking precision across strategies—trend tracking, breakout confirmation, or volatility insight.

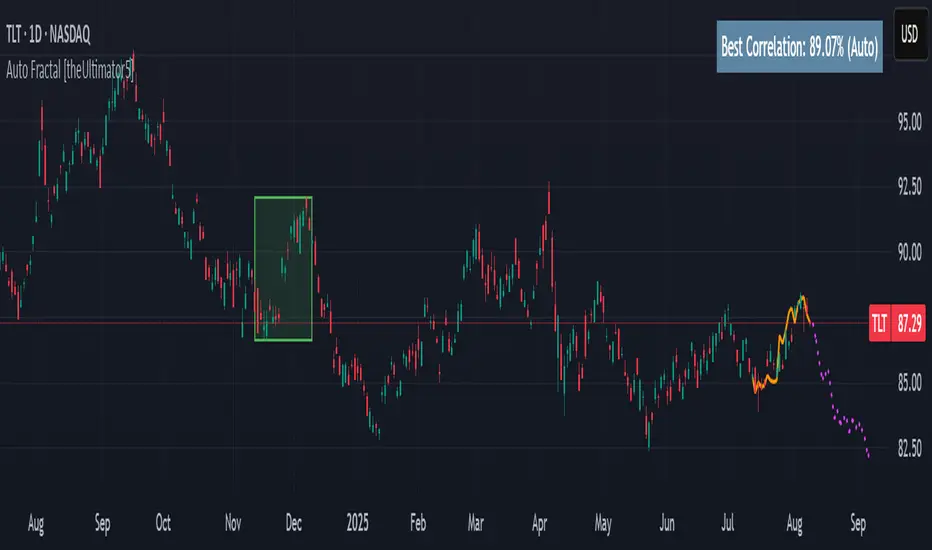
Auto Fractal [theUltimator5]This indicator is what I call the Auto Fractal. It is a unique algorithm that looks back in time, finds a segment on the chart that closest matches the recent price action, then projects the price forwards. It effectively finds chart patterns and shows you what the price did the last time the same/similar chart pattern was observed.
Creating an algorithm to match abstract curves to other abstract curves and provide a confidence score was the fundamental problem that needed to be solved in order to create this indicator, which curve matches with surprising accuracy.
The most effective method to "curve match" that I found is the Pearson Coefficient, set by a segment length and a lookback period. After the highest coefficient curve is located, the curve then gets scaled and offset to match the current price.
The past segment is drawn over the current price (orange line), giving a visualization of the two curves and how closely they match each other. The indicator then projects the price forwards in time based on the price action of the chart from the historical segment (dashed fuchsia line).
A bounding box also gets drawn around the historical segment to give you a clear visual of where the price is getting pulled from for proper analysis and ease of use.
The Pearson Coefficient % is shown in a table in the top right-hand corner of the chart and can be toggled off if desired. The values range from -100% (perfectly inverse correlation) to +100% (perfectly correlated) with 0 meaning no correlation whatsoever. The closer to +100% the value is, the better the segment match.
As with most/all of my indicators, user interface and simplicity was at the top of my priority list. I designed this to be easily readable and intuitive to both novice and veteran traders, without cluttering the chart.
Note:
This indicator is extremely heavy in terms of memory usage due to nested for loops, and takes several seconds to initially load the chart overlay. If the lookback period is increased too high (>600) then the indicator may time out and fail to load anything. If nothing loads on the chart, try reducing the lookback length and wait up to 10 seconds for lines to appear.
PER Bands (Auto EPS)PER Bands Indicator - Technical Specification
Function
This PineScript v6 overlay indicator displays horizontal price bands based on Price-to-Earnings Ratio multiples. The indicator calculates price levels by multiplying earnings per share values by user-defined PER multiples, then plots these levels as horizontal lines on the chart.
Data Sources
The script attempts to automatically retrieve earnings per share data using TradingView's `request.financial()` function. The system first queries trailing twelve months EPS data, then annual EPS data if TTM is unavailable. When automatic retrieval fails or returns zero values, the indicator uses manually entered EPS values as a fallback.
Configuration Options
Users can configure five separate PER multiples (default values: 10x, 15x, 20x, 25x, 30x). Each band supports individual color customization and adjustable line width settings from 1 to 5 pixels. The indicator includes toggles for band visibility and optional fill areas between adjacent bands with 95% transparency.
Visual Components
The indicator plots five horizontal lines representing different PER valuation levels. Optional fill areas create colored zones between consecutive bands. A data table in the top-right corner displays current EPS source, EPS value, current PER ratio, and calculated price levels for each configured multiple.
Calculation Method
The indicator performs the following calculations:
- Band Price = Current EPS × PER Multiple
- Current PER = Current Price ÷ Current EPS
These calculations update on each bar close using the most recent available EPS data.
Alert System
The script includes alert conditions for price crossovers above the lowest PER band and crossunders below the highest PER band. Additional alert conditions can be configured for any band level through the alert creation interface.
Debug Features
Debug mode displays character markers on the chart indicating when TTM or annual EPS data is available. This feature helps users verify which data source the indicator is using for calculations.
Data Requirements
The indicator requires positive, non-zero EPS values to function correctly. Stocks with negative earnings or zero EPS will display "N/A" for current PER calculations, though bands will still plot using the manual EPS input value.
Exchange Compatibility
Automatic EPS data availability varies by exchange. United States equity markets typically provide comprehensive fundamental data coverage. International markets may have limited automatic data availability, requiring manual EPS input for accurate calculations.
Technical Limitations
The indicator cannot fetch real-time EPS updates and relies on TradingView's fundamental data refresh schedule. Historical EPS changes are not reflected in past band positions, as the indicator uses current EPS values for all historical calculations.
Display Settings
The information table shows EPS source type (TTM Auto, Annual Auto, Manual, or Manual Fallback), allowing users to verify data accuracy. The table refreshes only on the last bar to optimize performance and reduce computational overhead.
Code Structure
Built using PineScript v6 syntax with proper scope management for plot and fill functions. The script uses global scope for all plot declarations and conditional logic within plot parameters to handle visibility settings.
Version Requirements
This indicator requires TradingView Pine Script version 6 or later due to the use of `request.financial()` functions and updated syntax requirements for plot titles and fill operations.

Daily ADR TableDaily ADR Table Indicator
The Daily Average Daily Range (ADR) Table displays real-time volatility statistics directly on your chart. It shows both the current day's range and the historical average daily range as percentages of the current price, providing essential volatility metrics for trading decisions.
The indicator tracks today's range in real-time throughout the trading session using session-based calculations to ensure accuracy. It compares this against a customizable historical average (default 20 days, adjustable from 1-500 days) to help traders assess whether current volatility is above or below normal levels.
All values are displayed as percentages for easy comparison across different price levels and formatted to two decimal places for precision. The table position, text size, alignment, and colors are fully customizable with nine position options and professional default styling optimized for readability.
This indicator is valuable for day traders, swing traders, and market analysts who need to quickly assess current market volatility relative to historical norms. It assists in position sizing decisions, setting stop losses, and identifying potential breakout or consolidation scenarios based on range expansion or contraction.

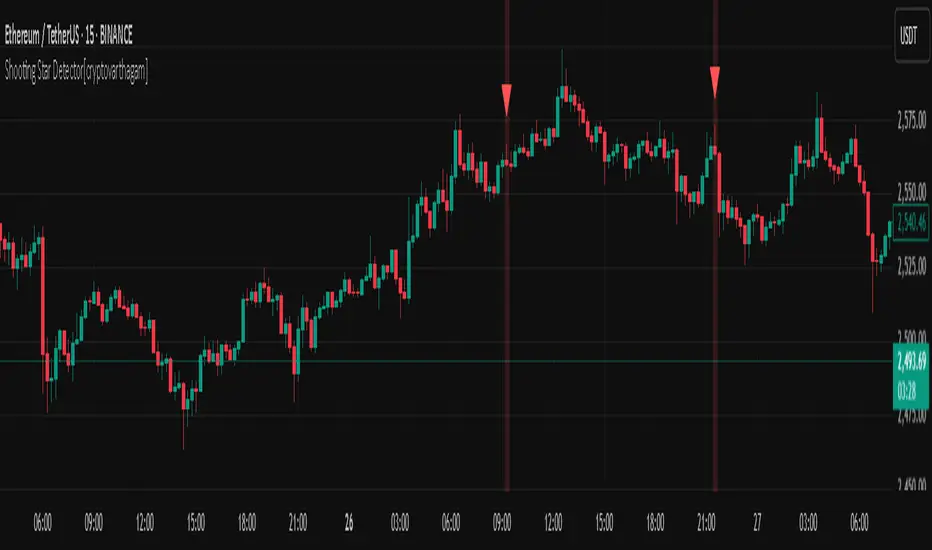
Shooting Star Detector[cryptovarthagam]🌠 Shooting Star Detector
The Shooting Star Detector is a powerful price action tool that automatically identifies potential bearish reversal signals using the well-known Shooting Star candlestick pattern.
Ideal for traders who rely on candlestick psychology to spot high-probability short setups, this script works across all markets and timeframes.
🔍 What is a Shooting Star?
A Shooting Star is a single-candle pattern that typically forms at the top of an uptrend or resistance zone. It’s characterized by:
A small body near the candle's low,
A long upper wick, and
Little or no lower wick.
This pattern suggests that buyers pushed price higher but lost control by the close, hinting at potential bearish momentum ahead.
✅ Indicator Features:
🔴 Accurately detects Shooting Star candles in real-time
🔺 Plots a red triangle above every valid signal candle
🖼️ Optional background highlight for visual clarity
🕵️♂️ Strict ratio-based detection using:
Wick-to-body comparisons
Upper wick dominance
Optional bearish candle confirmation
⚙️ Detection Logic (Rules Used):
Upper wick > 60% of total candle range
Body < 20% of total candle
Lower wick < 15% of candle range
Bearish candle (optional but included for accuracy)
These rules ensure high-quality signals that filter out false positives.
📌 Best Use Cases:
Spotting trend reversals at swing highs
Confirming entries near resistance zones
Enhancing price action or supply/demand strategies
Works on: Crypto, Forex, Stocks, Commodities
🧠 Trading Tip:
Pair this detector with volume confirmation, resistance zones, or bearish divergence for higher-probability entries.
📉 Clean, minimal, and non-repainting — designed for traders who value accuracy over noise.
Created with ❤️ by Cryptovarthagam
Follow for more real-time price action tools!
Liquidity Sweep Candlestick Pattern with MA Filter📌 Liquidity Sweep Candlestick Pattern with MA Filter
This custom indicator detects liquidity sweep candlestick patterns—price action events where the market briefly breaks a previous candle’s high or low to trap traders—paired with optional filters such as moving averages, color change candles, and strictness rules for better signal accuracy.
🔍 What is a Liquidity Sweep?
A liquidity sweep occurs when the price briefly breaks the high or low of a previous candle and then reverses direction. These events often occur around key support/resistance zones and are used by institutional traders to trap retail positions before moving the price in the intended direction.
🟢 Bullish Liquidity Sweep Criteria
The current candle is bullish (closes above its open).
The low of the current candle breaks the low of the previous candle.
The candle closes above the previous candle’s open.
Optionally, in Strict mode, it must also close above the previous candle’s high.
Optionally, it can be filtered to only show if the candle changed color from the previous one (e.g., red to green).
Can be filtered to only show when the price is above or below a moving average (if MA filter is enabled).
🔴 Bearish Liquidity Sweep Criteria
The current candle is bearish (closes below its open).
The high of the current candle breaks the high of the previous candle.
The candle closes below the previous candle’s open.
Optionally, in Strict mode, it must also close below the previous candle’s low.
Optionally, it can be filtered to only show if the candle changed color from the previous one (e.g., green to red).
Can be filtered to only show when the price is above or below a moving average (if MA filter is enabled).
⚙️ Features & Customization
✅ Signal Strictness
Choose between:
Less Strict (default): Basic wick break and close conditions.
Strict: Must close beyond the wick of the previous candle.
✅ Color Change Candles Only
Enable this to only show patterns when the candle color changes (e.g., from red to green or green to red). Helps filter fake-outs.
✅ Moving Average Filter (optional)
Supports several types of MAs: SMA, EMA, WMA, VWMA, RMA, HMA
Choose whether signals should only appear above or below the selected moving average.
✅ Custom Visuals
Show short (BS) or full (Bull Sweep / Bear Sweep) labels
Plot triangles or arrows to represent bullish and bearish sweeps
Customize label and shape colors
Optionally show/hide the moving average line
✅ Alerts
Includes alert options for:
Bullish sweep
Bearish sweep
Any sweep
📈 How to Use
Add the indicator to your chart.
Configure the strictness, color change, or MA filters based on your strategy.
Observe signals where price is likely to reverse after taking out liquidity.
Use with key support/resistance levels, order blocks, or volume zones for confluence.
⚠️ Note
This tool is for educational and strategy-building purposes. Always confirm signals with other indicators, context, and sound risk management.

Session-Based Sentiment Oscillator [TradeDots]Track, analyze, and monitor market sentiment across global trading sessions with this advanced multi-session sentiment analysis tool. This script provides session-specific sentiment readings for Asian (Tokyo), European (London), and US (New York) markets, combining price action, volume analysis, and volatility factors into a comprehensive sentiment oscillator. It is an original indicator designed to help traders understand regional market psychology and capitalize on cross-session sentiment shifts directly on TradingView.
📝 HOW IT WORKS
1. Multi-Component Sentiment Engine
Price Action Momentum : Calculates normalized price movement relative to recent trading ranges, providing directional sentiment readings.
Volume-Weighted Analysis : When volume data is available, incorporates volume flow direction to validate price-based sentiment signals.
Volatility-Adjusted Factors : Accounts for changing market volatility conditions by comparing current ATR against historical averages.
Weighted Combination : Merges all components using optimized weightings (Price: 1.0, Volume: 0.3, Volatility: 0.2) for balanced sentiment readings.
2. Session-Segregated Tracking
Automatic Session Detection : Precisely identifies active trading sessions based on user-configured time parameters.
Independent Calculations : Maintains separate sentiment accumulation for each major session, updated only during respective active hours.
Historical Preservation : Stores session-specific sentiment values even when sessions are closed, enabling cross-session comparison.
Real-Time Updates : Continuously processes sentiment during active sessions while preserving inactive session data.
3. Cross-Session Transition Analysis
Sentiment Differential Detection : Monitors sentiment changes when transitioning between trading sessions.
Configurable Thresholds : Generates signals only when sentiment shifts exceed user-defined minimum thresholds.
Directional Signals : Provides distinct bullish and bearish transition alerts with visual markers.
Smart Filtering : Applies smoothing algorithms to reduce false signals from minor sentiment variations.
⚙️ KEY FEATURES
1. Session-Specific Dashboard
Real-Time Status Display : Shows current session activity (ACTIVE/CLOSED) for all three major sessions.
Sentiment Percentages : Displays precise sentiment readings as percentages for easy interpretation.
Strength Classification : Automatically categorizes sentiment as HIGH (>50%), MEDIUM (20-50%), or LOW (<20%).
Customizable Positioning : Place dashboard in any corner with adjustable size options.
2. Advanced Signal Generation
Transition Alerts : Triangle markers indicate significant sentiment shifts between sessions.
Extreme Conditions : Diamond markers highlight overbought/oversold threshold breaches.
Configurable Sensitivity : Adjust signal thresholds from 0.05 to 0.50 based on trading style.
Alert Integration : Built-in TradingView alert conditions for automated notifications.
3. Forex Currency Strength Analysis
Base/Quote Decomposition : For forex pairs, separates sentiment into individual currency strength components.
Major Currency Support : Analyzes USD, EUR, GBP, JPY, CHF, CAD, AUD, NZD strength relationships.
Relative Strength Display : Shows which currency is driving pair movement during active sessions.
4. Visual Enhancement System
Session Background Colors : Distinct background shading for each active trading session.
Overbought/Oversold Zones : Configurable extreme sentiment level visualization with colored zones.
Multi-Timeframe Compatibility : Works across all timeframes while maintaining session accuracy.
Customizable Color Schemes : Full color customization for dashboard, signals, and plot elements.
🚀 HOW TO USE IT
1. Add the Script
Search for "Session-Based Sentiment Oscillator " in the Indicators tab or manually add it to your chart. The indicator will appear in a separate pane below your main chart.
2. Configure Session Times
Asian Session : Set Tokyo market hours (default: 00:00-09:00) based on your chart timezone.
European Session : Configure London market hours (default: 07:00-16:00) for European analysis.
US Session : Define New York market hours (default: 13:00-22:00) for American markets.
Timezone Adjustment : Ensure session times match your broker's specifications and account for daylight saving changes.
3. Optimize Analysis Parameters
Sentiment Period : Choose 5-50 bars (default: 14) for sentiment calculation lookback period.
Smoothing Settings : Select 1-10 bars smoothing (default: 3) with SMA, EMA, or RMA options.
Component Selection : Enable/disable volume analysis, price action, and volatility factors based on available data.
Signal Sensitivity : Adjust threshold from 0.05-0.50 (default: 0.15) for transition signal generation.
4. Interpret Readings and Signals
Positive Values : Indicate bullish sentiment for the active session.
Negative Values : Suggest bearish sentiment conditions.
Dashboard Status : Monitor which session is currently active and their respective sentiment strengths.
Transition Signals : Watch for triangle markers indicating significant cross-session sentiment changes.
Extreme Alerts : Note diamond markers when sentiment reaches overbought (>70%) or oversold (<-70%) levels.
5. Set Up Alerts
Configure TradingView alerts for:
- Bullish session transitions
- Bearish session transitions
- Overbought condition alerts
- Oversold condition alerts
❗️LIMITATIONS
1. Data Dependency
Volume Requirements : Volume-based analysis only functions when volume data is provided by your broker. Many forex brokers do not supply reliable volume data.
Price Action Focus : In absence of volume data, sentiment calculations rely primarily on price movement and volatility factors.
2. Session Time Sensitivity
Manual Adjustment Required : Session times must be manually updated for daylight saving time changes.
Broker Variations : Different brokers may have slightly different session definitions requiring time parameter adjustments.
3. Ranging Market Limitations
Trend Bias : Sentiment calculations may be less reliable during extended sideways or low-volatility market conditions.
Lag Consideration : As with all sentiment indicators, readings may lag during rapid market transitions.
4. Regional Market Focus
Major Session Coverage : Designed primarily for major global sessions; may not capture sentiment from smaller regional markets.
Weekend Gaps : Does not account for weekend gap effects on sentiment calculations.
⚠️ RISK DISCLAIMER
Trading and investing carry significant risk and can result in financial loss. The "Session-Based Sentiment Oscillator " is provided for informational and educational purposes only. It does not constitute financial advice.
- Always conduct your own research and analysis
- Use proper risk management and position sizing in all trades
- Past sentiment patterns do not guarantee future market behavior
- Combine this indicator with other technical and fundamental analysis tools
- Consider overall market context and your personal risk tolerance
This script is an original creation by TradeDots, published under the Mozilla Public License 2.0.
Session-based sentiment analysis should be used as part of a comprehensive trading strategy. No single indicator can predict market movements with certainty. Exercise proper risk management and maintain realistic expectations about indicator performance across varying market conditions.

Candle/Keltner Channels BUY SELLWhy Use Candlesticks?
They help traders visualize price action
Used in technical analysis and price pattern recognition (e.g., Doji, Engulfing, Hammer)
Assist in determining entry and exit points
Why Traders Use Keltner Channels?
Keltner Channels are widely used by traders for identifying trends, detecting volatility, and spotting trade opportunities.
1. Trend Identification
The middle line (EMA) shows the general trend.
If price consistently stays above the middle line, it indicates a strong uptrend.
If price stays below, it signals a downtrend.
Use: Traders follow the trend direction to enter trades in line with momentum.
2. Volatility Measurement
The width of the channel expands and contracts based on Average True Range (ATR).
Wider channels = high volatility, tighter channels = low volatility.
Use: Helps traders decide when to expect breakouts or calm periods.
3. Breakout Signals
A break above the upper band can signal a bullish breakout.
A break below the lower band can signal a bearish breakout.
Use: Traders use this for momentum trading and breakout entries.
4. Overbought/Oversold Conditions
Price touching or crossing the upper band may suggest it's overbought.
Price touching or crossing the lower band may suggest it's oversold.
Use: Traders combine this with RSI or MACD to confirm reversal setups.
5. Trade Entry and Exit
When price pulls back to the middle EMA during a trend, it may present a buy/sell opportunity.
Exits can also be planned if price returns inside the bands after a breakout.
Use: Helps with precise entry and exit timing.
6. Combines Well With Other Indicators
Commonly used with:
RSI (for confirmation)
MACD (for momentum)
Candlestick patterns (for price action signals)
Combining Candlestick Patterns with Keltner Channels gives traders a powerful method to confirm entries, spot reversals, and improve accuracy. Here’s why this combination works so well:
1. Context for Candlestick Signals
Candlestick patterns (like doji, engulfing, or pin bars) show potential price reversals, but they need context to be reliable. Keltner Channels provide that context:
A bullish candlestick near the lower band suggests a stronger buy signal.
A bearish candlestick near the upper band strengthens a sell signal.
2. Filtering False Signals
Candlestick patterns occur frequently, and not all are meaningful.
The location within the Keltner Channel helps filter out weak or false patterns.
Example: A bullish engulfing candle outside the lower band = high-probability reversal.
3. Improved Entry Timing
Traders wait for a candlestick pattern confirmation when price touches or crosses a Keltner band.
This avoids premature entries and allows tighter stop-losses.
4. Better Risk-Reward Setup
Candlestick entry near channel extremes (upper/lower band) lets traders place stop-losses just beyond recent highs/lows.
The target can be the opposite side of the channel or the middle EMA.
5. Visual Simplicity
Keltner Channels + Candles are visually intuitive.
Even beginner traders can easily recognize:
Overextended candles near channel edges.
Confirmed breakouts or reversals.
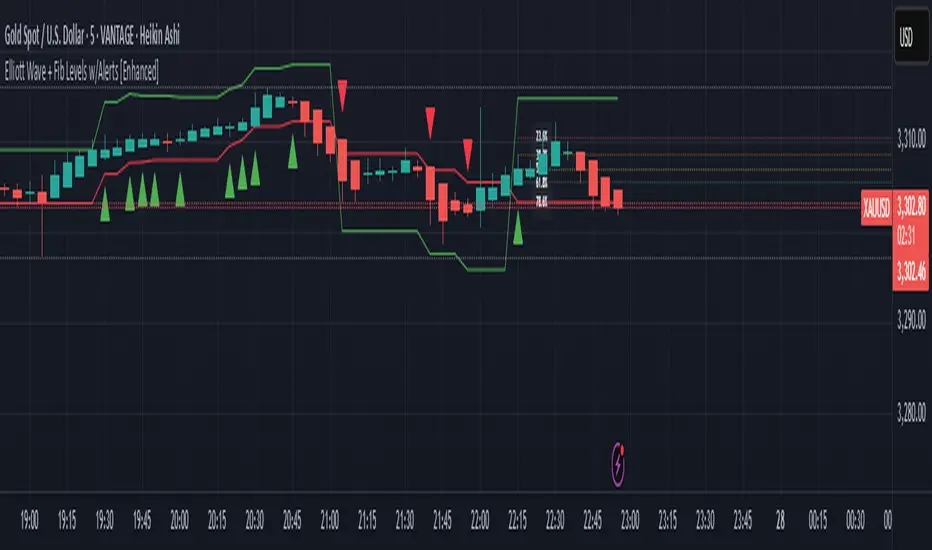
This Timeframe 5 min : XAUUSD

Elliott Wave + Fib Levels w/Alerts [Enhanced]Elliott Wave + Fibonacci Levels with Alerts
This powerful TradingView indicator combines Elliott Wave detection with customizable Fibonacci retracement levels to help identify key price zones and potential trade opportunities. It automatically detects bullish and bearish waves based on recent highs and lows, with an optional EMA filter to improve trend accuracy.
Key features include:
Dynamic detection of Elliott Waves based on configurable wave length.
Visualization of Fibonacci retracement levels on detected waves, with customizable percentage levels and optional labels for clarity.
ATR-based automatic calculation of stop loss and take profit levels with adjustable multipliers.
Real-time alerts triggered on new wave formations, indicating bullish or bearish setups with precise entry price details.
Clean plotting of entry signals, stop loss, and take profit zones directly on the chart.
User-friendly input controls to tailor the indicator to your trading style, including options to toggle EMA filtering, Fibonacci level display, and alert activation.
Ideal for traders looking to combine classic wave analysis with Fibonacci support/resistance levels and actionable trade alerts, this indicator streamlines technical analysis and trade management in one easy-to-use tool.
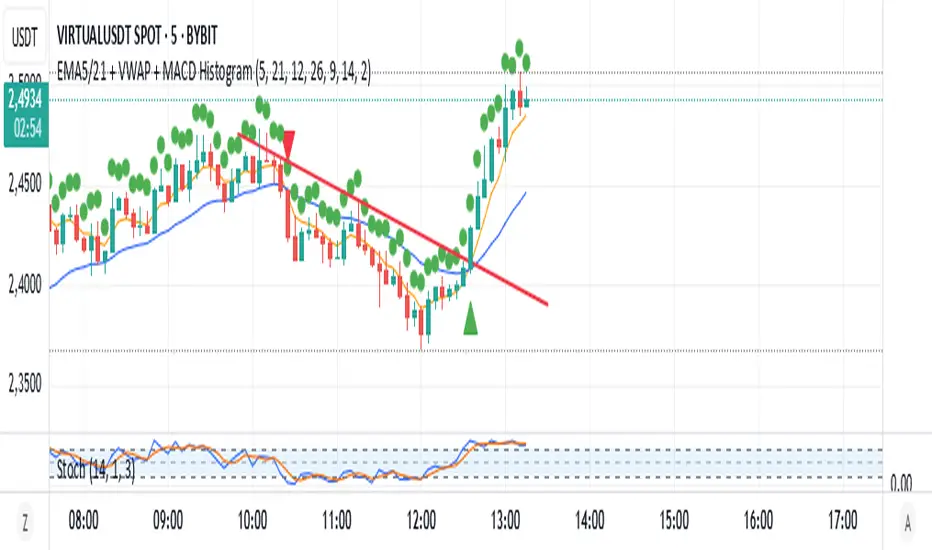
EMA5/21 + VWAP + MACD HistogramScript Summary: EMA + VWAP + MACD + RSI Strategy
Objective: Combine multiple technical indicators to identify market entry and exit opportunities, aiming to increase signal accuracy.
Indicators Used:
EMAs (Exponential Moving Averages): Periods of 5 (short-term) and 21 (long-term) to identify trend crossovers.
VWAP (Volume Weighted Average Price): Serves as a reference to determine if the price is in a fair value zone.
MACD (Moving Average Convergence Divergence): Standard settings of 12, 26, and 9 to detect momentum changes.
RSI (Relative Strength Index): Period of 14 to identify overbought or oversold conditions.
Entry Rules:
Buy (Long): 5-period EMA crosses above the 21-period EMA, price is above VWAP, MACD crosses above the signal line, and RSI is above 40.
Sell (Short): 5-period EMA crosses below the 21-period EMA, price is below VWAP, MACD crosses below the signal line, and RSI is below 60.
Exit Rules:
For long positions: When the 5-period EMA crosses below the 21-period EMA or MACD crosses below the signal line.
For short positions: When the 5-period EMA crosses above the 21-period EMA or MACD crosses above the signal line.
Visual Alerts:
Buy and sell signals are highlighted on the chart with green (buy) and red (sell) arrows below or above the corresponding candles.
Indicator Plotting:
The 5 and 21-period EMAs, as well as the VWAP, are plotted on the chart to facilitate the visualization of market conditions.
This script is a versatile tool for traders seeking to combine multiple technical indicators into a single strategy. It can be used across various timeframes and assets, allowing adjustments according to the trader's profile and market characteristics.
Juliano Einhardt Ulguim, Brazil, 05/27/2025.
Auto AI Trendlines [TradingFinder] Clustering & Filtering Trends🔵 Introduction
Auto AI trendlines Clustering & Filtering Trends Indicator, draws a variety of trendlines. This auto plotting trendline indicator plots precise trendlines and regression lines, capturing trend dynamics.
Trendline trading is the strongest strategy in the financial market.
Regression lines, unlike trendlines, use statistical fitting to smooth price data, revealing trend slopes. Trendlines connect confirmed pivots, ensuring structural accuracy. Regression lines adapt dynamically.
The indicator’s ascending trendlines mark bullish pivots, while descending ones signal bearish trends. Regression lines extend in steps, reflecting momentum shifts. As the trend is your friend, this tool aligns traders with market flow.
Pivot-based trendlines remain fixed once confirmed, offering reliable support and resistance zones. Regression lines, adjusting to price changes, highlight short-term trend paths. Both are vital for traders across asset classes.
🔵 How to Use
There are four line types that are seen in the image below; Precise uptrend (green) and downtrend (red) lines connect exact price extremes, while Pivot-based uptrend and downtrend lines use significant swing points, both remaining static once formed.
🟣 Precise Trendlines
Trendlines only form after pivot points are confirmed, ensuring reliability. This reduces false signals in choppy markets. Regression lines complement with real-time updates.
The indicator always draws two precise trendlines on confirmed pivot points, one ascending and one descending. These are colored distinctly to mark bullish and bearish trends. They remain fixed, serving as structural anchors.
🟣 Dynamic Regression Lines
Regression lines, adjusting dynamically with price, reflect the latest trend slope for real-time analysis. Use these to identify trend direction and potential reversals.
Regression lines, updated dynamically, reflect real-time price trends and extend in steps. Ascending lines are green, descending ones orange, with shades differing from trendlines. This aids visual distinction.
🟣 Bearish Chart
A Bullish State emerges when uptrend lines outweigh or match downtrend lines, with recent upward momentum signaling a potential rise. Check the trend count in the state table to confirm, using it to plan long positions.
🟣 Bullish Chart
A Bearish State is indicated when downtrend lines dominate or equal uptrend lines, with recent downward moves suggesting a potential drop. Review the state table’s trend count to verify, guiding short position entries. The indicator reflects this shift for strategic planning.
🟣 Alarm
Set alerts for state changes to stay informed of Bullish or Bearish shifts without constant monitoring. For example, a transition to Bullish State may signal a buying opportunity. Toggle alerts On or Off in the settings.
🟣 Market Status
A table summarizes the chart’s status, showing counts of ascending and descending lines. This real-time overview simplifies trend monitoring. Check it to assess market bias instantly.
Monitor the table to track line counts and trend dominance.
A higher count of ascending lines suggests bullish bias. This helps traders align with the prevailing trend.
🔵 Settings
Number of Trendlines : Sets total lines (max 10, min 3), balancing chart clarity and trend coverage.
Max Look Back : Defines historical bars (min 50) for pivot detection, ensuring robust trendlines.
Pivot Range : Sets pivot sensitivity (min 2), adjusting trendline precision to market volatility.
Show Table Checkbox : Toggles display of a table showing ascending/descending line counts.
Alarm : Enable or Disable the alert.
🔵 Conclusion
The multi slopes indicator, blending pivot-based trendlines and dynamic regression lines, maps market trends with precision. Its dual approach captures both structural and short-term momentum.
Customizable settings, like trendline count and pivot range, adapt to diverse trading styles. The real-time table simplifies trend monitoring, enhancing efficiency. It suits forex, stocks, and crypto markets.
While trendlines anchor long-term trends, regression lines track intraday shifts, offering versatility. Contextual analysis, like price action, boosts signal reliability. This indicator empowers data-driven trading decisions.

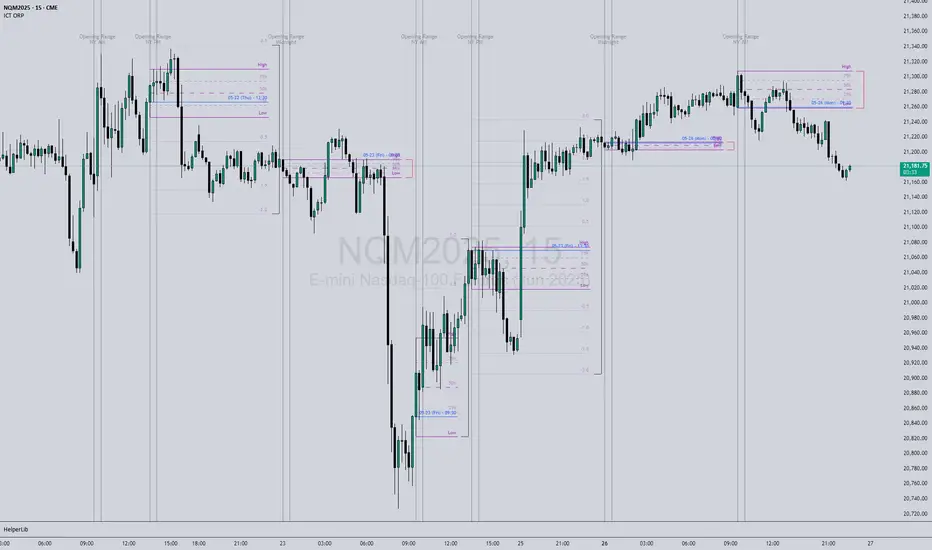
ICT Opening Range Projections (tristanlee85)ICT Opening Range Projections
This indicator visualizes key price levels based on ICT's (Inner Circle Trader) "Opening Range" concept. This 30-minute time interval establishes price levels that the algorithm will refer to throughout the session. The indicator displays these levels, including standard deviation projections, internal subdivisions (quadrants), and the opening price.
🟪 What It Does
The Opening Range is a crucial 30-minute window where market algorithms establish significant price levels. ICT theory suggests this range forms the basis for daily price movement.
This script helps you:
Mark the high, low, and opening price of each session.
Divide the range into quadrants (premium, discount, and midpoint/Consequent Encroachment).
Project potential price targets beyond the range using configurable standard deviation multiples .
🟪 How to Use It
This tool aids in time-based technical analysis rooted in ICT's Opening Range model, helping you observe price interaction with algorithmic levels.
Example uses include:
Identifying early structural boundaries.
Observing price behavior within premium/discount zones.
Visualizing initial displacement from the range to anticipate future moves.
Comparing price reactions at projected standard deviation levels.
Aligning price action with significant times like London or NY Open.
Note: This indicator provides a visual framework; it does not offer trade signals or interpretations.
🟪 Key Information
Time Zone: New York time (ET) is required on your chart.
Sessions: Supports multiple sessions, including NY midnight, NY AM, NY PM, and three custom timeframes.
Time Interval: Supports multi-timeframe up to 15 minutes. Best used on a 1-minute chart for accuracy.
🟪 Session Options
The Opening Range interval is configurable for up to 6 sessions:
Pre-defined ICT Sessions:
NY Midnight: 12:00 AM – 12:30 AM ET
NY AM: 9:30 AM – 10:00 AM ET
NY PM: 1:30 PM – 2:00 PM ET
Custom Sessions:
Three user-defined start/end time pairs.
This example shows a custom session from 03:30 - 04:00:
🟪 Understanding the Levels
The Opening Price is the open of the first 1-minute candle within the chosen session.
At session close, the Opening Range is calculated using its High and Low . An optional swing-based mode uses swing highs/lows for range boundaries.
The range is divided into quadrants by its midpoint ( Consequent Encroachment or CE):
Upper Quadrant: CE to high (premium).
Lower Quadrant: Low to CE (discount).
These subdivisions help visualize internal range dynamics, where price often reacts during algorithmic delivery.
🟪 Working with Ranges
By default, the range is determined by the highest high and lowest low of the 30-minute session:
A range can also be determined by the highest/lowest swing points:
Quadrants outline the premium and discount of a range that price will reference:
Small ranges still follow the same algorithmic logic, but may be deemed insignificant for one's trading. These can be filtered in the settings by specifying a minimum ticks limit. In this example, the range is 42 ticks (10.5 points) but the indicator is configured for 80 ticks (20 points). We can select which levels will plot if the range is below the limit. Here, only the 00:00 opening price is plotted:
You may opt to include the range high/low, quadrants, and projections as well. This will plot a red (configurable) range bracket to indicate it is below the limit while plotting the levels:
🟪 Price Projections
Projections extend beyond the Opening Range using standard deviations, framing the market beyond the initial session and identifying potential targets. You define the standard deviation multiples (e.g., 1.0, 1.5, 2.0).
Both positive and negative extensions are displayed, symmetrically projected from the range's high and low.
The Dynamic Levels option plots only the next projection level once price crosses the previous extreme. For example, only the 0.5 STDEV level plots until price reaches it, then the 1.0 level appears, and so on. This continues up to your defined maximum projections, or indefinitely if standard deviations are set to 0.
This example shows dynamic levels for a total of 6 sessions, only 1 of which meet a configured minimum limit of 50 ticks:
Small ranges followed by significant displacement are impacted the most with the number of levels plotted. You may hide projections when configuring the minimum ticks.
A fixed standard deviation will plot levels in both directions, regardless of the price range. Here, we plot up to 3.0 which hiding projections for small ranges:
🟪 Legal Disclaimer
This indicator is provided for informational and educational purposes only. It is not financial advice, and should not be construed as a recommendation to buy or sell any financial instrument. Trading involves substantial risk, and you could lose a significant amount of money. Past performance is not indicative of future results. Always consult with a qualified financial professional before making any trading or investment decisions. The creators and distributors of this indicator assume no responsibility for your trading outcomes.
Supertrend with Volume Filter AlertSupertrend with Volume Filter Alert - Indicator Overview
What is the Supertrend Indicator?
The Supertrend indicator is a popular trend-following tool used by traders to identify the direction of the market and potential entry/exit points. It is based on the Average True Range (ATR), which measures volatility, and plots a line on the chart that acts as a dynamic support or resistance level. When the price is above the Supertrend line, it signals an uptrend (bullish), and when the price is below, it indicates a downtrend (bearish). The indicator is particularly effective in trending markets but can generate false signals during choppy or sideways conditions.
How This Script Works
The "Supertrend with Volume Filter Alert" enhances the classic Supertrend indicator by adding a customizable volume filter to improve signal reliability.
Here's how it functions:
Supertrend Calculation:The Supertrend is calculated using the ATR over a user-defined period (default: 55) and a multiplier (default: 1.85). These parameters control the sensitivity of the indicator:A higher ATR period smooths out volatility, making the indicator less reactive to short-term price fluctuations.The multiplier determines the distance of the Supertrend line from the price, affecting how quickly it responds to trend changes.The script plots the Supertrend line in cyan for uptrends and red for downtrends, making it easy to visualize the market direction.
Volume Filter:A key feature of this script is the volume filter, which helps filter out false signals in choppy markets. The filter compares the current volume to the average volume over a lookback period (default: 20) and only triggers signals if the volume exceeds the average by a specified multiplier (default: 2.0).This ensures that trend changes are accompanied by significant market participation, increasing the likelihood of a genuine trend shift.
Signals and Alerts:
Buy signals (cyan triangle below the bar) are generated when the price crosses above the Supertrend line (indicating an uptrend) and the volume condition is met.Sell signals (red triangle above the bar) are generated when the price crosses below the Supertrend line (indicating a downtrend) and the volume condition is met.Alerts are set up for both buy and sell signals, notifying traders only when the volume filter confirms the trend change.
Customizable Settings for Multiple Markets
The default settings in this script (ATR Period: 55, ATR Multiplier: 1.85, Volume Lookback Period: 20, Volume Multiplier: 2.0) were carefully chosen to provide a balance of sensitivity and reliability across various markets, including stocks, indices (like the S&P 500), forex, and cryptocurrencies.
Here's why these settings work well:
ATR Period (55): A longer ATR period smooths out volatility, making the indicator less prone to whipsaws in volatile markets like crypto or forex, while still being responsive enough for trending markets like indices.
ATR Multiplier (1.85): This multiplier strikes a balance between capturing early trend changes and avoiding noise. A smaller multiplier would make the indicator too sensitive, while a larger one might miss early opportunities.
Volume Lookback Period (20): A 20-bar lookback for volume averaging provides a robust baseline for identifying significant volume spikes, adaptable to both short-term (e.g., daily charts) and longer-term (e.g., weekly charts) timeframes.
Volume Multiplier (2.0): Requiring volume to be at least 2x the average ensures that only high-conviction moves trigger signals, which is crucial for markets with varying liquidity levels.
These parameters are fully customizable, allowing traders to adjust the indicator to their specific market, timeframe, or trading style. For example, you might reduce the ATR period for faster-moving markets or increase the volume multiplier for more conservative signal filtering.
How the Volume Filter Reduces Bad Trades in Choppy Markets
One of the main drawbacks of the Supertrend indicator is its tendency to generate false signals during choppy or ranging markets, where price fluctuates without a clear trend. The volume filter in this script addresses this issue by ensuring that trend changes are backed by significant market activity:
In choppy markets, price movements often lack strong volume, leading to false breakouts or reversals. By requiring volume to be a multiple (default: 2x) of the average volume over the lookback period, the script filters out these low-volume, low-conviction moves.This reduces the likelihood of taking bad trades during sideways markets, as only trend changes with strong volume confirmation will trigger signals. For example, on a daily chart of the S&P 500, a buy signal will only fire if the price crosses above the Supertrend line and the volume on that day is at least twice the 20-day average, indicating genuine buying pressure.
Usage Tips
Markets and Timeframes: This indicator is versatile and can be used on various assets (stocks, indices, forex, crypto) and timeframes (1-minute, 1-hour, daily, etc.). Adjust the settings based on the market's volatility and your trading strategy.
Combine with Other Indicators: While the volume filter improves reliability, consider using additional indicators like RSI or MACD to confirm trends, especially in ranging markets.
Backtesting: Test the indicator on historical data for your chosen market to optimize the settings and ensure they align with your trading goals.
Alerts: Set up alerts for buy and sell signals to stay informed of high-probability trend changes without constantly monitoring the chart.
ConclusionThe "Supertrend with Volume Filter Alert" is a powerful tool for trend-following traders, combining the simplicity of the Supertrend indicator with a volume-based filter to enhance signal accuracy. Its customizable settings make it adaptable to multiple markets, while the volume filter helps reduce false signals in choppy conditions, allowing traders to focus on high-probability trades. Whether you're trading stocks, indices, forex, or crypto, this indicator can help you identify trends with greater confidence.

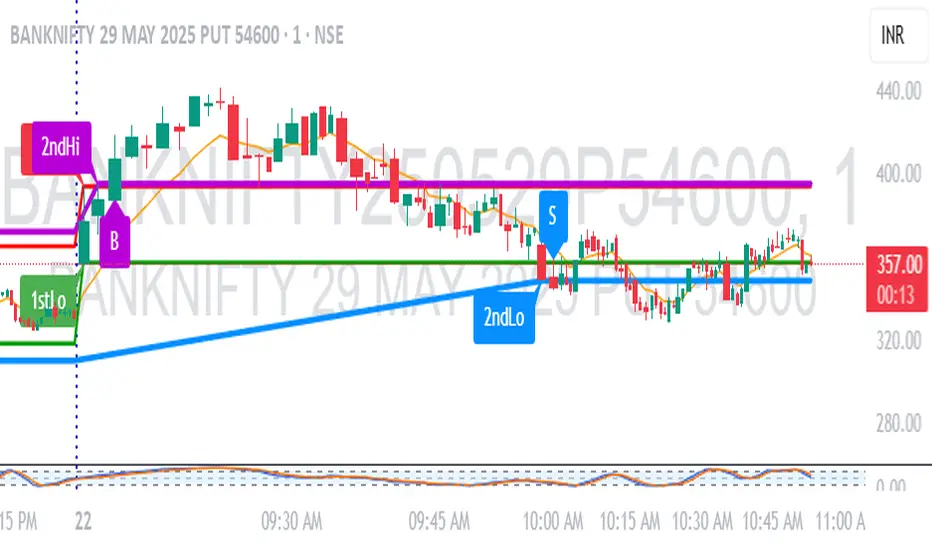
1M Scalp Setup – 2ndHi/2ndLo Breakout1M Scalp Setup – 2ndHi/2ndLo Breakout
This script is designed for 1-minute chart scalpers seeking high-probability intraday breakout setups based on early session price action. The strategy revolves around identifying the first high and low of the day, and then detecting the second breach (2nd high or 2nd low) to anticipate breakout entries.
🔍 Core Logic:
EMA Filter : A configurable EMA (default 8-period) is plotted for trend context.
1st High/Low Detection : Captures the very first high and low of each trading day.
2nd High/Low Markers : Identifies the second time price breaks the initial high or low, acting as a potential signal zone.
Breakout Signals :
A Buy Signal is triggered when price closes above the 2nd high.
A Sell Signal is triggered when price closes below the 2nd low.
Each signal is only triggered once per day to reduce noise and avoid overtrading.
🖌️ Visual Markers:
1stHi and 1stLo : Early session levels (red and green).
2ndHi and 2ndLo : Key breakout reference points (purple and blue).
B and S Labels : Buy and Sell triggers marked in real-time once breakouts occur.
⚙️ Inputs:
EMA Length (default: 8)
Customizable Colors for Buy/Sell signals and key markers
This tool is best used in fast-moving markets or during high-volume sessions. Combine with volume or higher-timeframe confirmation for improved accuracy.
Levels & Flow📌 Overview
Levels & Flow is a visual trading tool that combines daily pivot levels with a dynamic EMA ribbon to help traders identify structure, momentum, and key decision zones in the market.
This script is designed for discretionary traders who rely on clean visual cues for intraday and swing trading strategies.
⚙️ Key Features
Daily Pivot, Support, and Resistance Lines
Automatically plots the daily pivot level based on the previous day’s OHLC data, along with calculated support and resistance levels.
Fibonacci Retracement Levels
Two dashed lines above and below the pivot represent the retracement of the pivot-resistance and pivot-support range, forming the boundaries of the “no-trade zone.”
No-Trade Zone (Shaded Box)
A gray shaded box between the two Fibonacci levels to visually mark a high-chop/low-conviction zone.
Trend-Based Candle Coloring (Current Day Only)
Candles are colored green if the close is above the pivot, red if below (only on the current trading day).
Bullish/Bearish Trend Label
A small table in the bottom-right corner displays “Bullish” or “Bearish” depending on whether price is above or below the pivot.
20-EMA Gradient Ribbon
A stack of 20 EMAs, each smoothed and color-coded from blue to green to reflect short- to long-term trend alignment.
Cumulative EMA with Adaptive Weighting
An intelligent moving average line that adjusts weight distribution among the 20 EMAs based on recent predictive accuracy using a learning rate and lookback period.
🧠 How It Works
📍 Levels
The script calculates daily pivot, resistance, and support levels using standard formulas:
Pivot = (High + Low + Close) / 3
Resistance = (2 × Pivot) – Low
Support = (2 × Pivot) – High
These levels update each day and extend 143 bars to the right.
📏 Fib Lines
Fib Up = Pivot + (Resistance – Pivot) × 0.382
Fib Down = Pivot – (Pivot – Support) × 0.382
These lines form the “no-trade zone” box.
📈 EMA Ribbon
20 EMAs starting from the user-defined Base Length, each incremented by 1
Each EMA is smoothed using the Smoothing Period
Color-coded from blue to green for intuitive visual flow
Filled between EMAs to visualize trend strength and alignment
🧠 Cumulative EMA Learning
Each EMA’s historical error is calculated over a Lookback Period
Lower-error EMAs receive higher weight; weights are normalized to sum to 1
The result is a cumulative EMA that adapts based on historical predictive power
🔧 User Inputs
Input
Base EMA Length: Sets the period for the shortest EMA (default: 20)
Smoothing Period: Smooths all EMAs and the cumulative EMA
Lookback for Learning: Number of bars to evaluate EMA prediction accuracy
Learning Rate: Adjusts how quickly weights shift in favor of more accurate EMAs
✅ How to Use It
Use the pivot level to define directional bias.
Watch for price breakouts above resistance or breakdowns below support to consider entry.
Avoid trading inside the shaded zone, where direction is less reliable.
Use the EMA ribbon gradient to confirm short/long alignment.
The cumulative EMA helps define trend with noise reduction.
🧪 Best For
Intraday traders who want to blend structure with flow
Swing traders needing clean daily levels with dynamic confirmation
Anyone looking to avoid choppy zones and improve visual clarity
⚠️ Disclaimer
This script is for educational and informational purposes only. It does not constitute financial advice or a trading recommendation. Always test scripts in simulation or on demo accounts before live use. Use at your own risk.

Enhanced Cycle IndicatorEnhanced Cycle Indicator Guide
DISCLAIMER
"This PineScript indicator evolved from a foundational algorithm designed to visualize cycle-based center average differentials. The original concept has been significantly enhanced and optimized through collaborative refinement with AI, resulting in improved functionality, performance, and visualization capabilities while maintaining the core mathematical principles of the original design"
Overview
The Enhanced Cycle Indicator is designed to identify market cycles with minimal lag while ensuring the cycle lows and highs correspond closely with actual price bottoms and tops. This indicator transforms price data into observable cycles that help you identify when a market is likely to change direction.
Core Principles
Cycle Detection: Identifies natural market rhythms using multiple timeframes
Dynamic Adaptation: Adjusts to changing market conditions for consistent performance
Precise Signals: Provides clear entry and exit points aligned with actual market turns
Reduced Lag: Uses advanced calculations to minimize delay in cycle identification
How To Use
1. Main Cycle Interpretation
Green Histogram Bars: Bullish cycle phase (upward momentum)
Red Histogram Bars: Bearish cycle phase (downward momentum)
Cycle Extremes: When the histogram reaches extreme values (+80/-80), the market is likely approaching a turning point
Zero Line: Crossovers often indicate a shift in the underlying market direction
2. Trading Signals
Green Triangle Up (bottom of chart): Strong bullish signal - ideal for entries or covering shorts
Red Triangle Down (top of chart): Strong bearish signal - ideal for exits or short entries
Diamond Shapes: Indicate divergence between price and cycle - early warning of potential reversals
Small Circles: Minor cycle turning points - useful for fine-tuning entries/exits
3. Optimal Signal Conditions
Bullish Signals Work Best When:
The cycle is deeply oversold (below -60)
RSI is below 40 or turning up
Price is near a significant low
Multiple confirmation bars have occurred
Bearish Signals Work Best When:
The cycle is heavily overbought (above +60)
RSI is above 60 or turning down
Price is near a significant high
Multiple confirmation bars have occurred
4. Parameter Adjustments
For Shorter Timeframes: Reduce cycle periods and smoothing factor for faster response
For Daily/Weekly Charts: Increase cycle periods and smoothing for smoother signals
For Volatile Markets: Reduce cycle responsiveness to filter noise
For Trending Markets: Increase signal confirmation requirement to avoid false signals
Recommended Settings
Default (All-Purpose)
Main Cycle: 50
Half Cycle: 25
Quarter Cycle: 12
Smoothing Factor: 0.5
RSI Filter: Enabled
Signal Confirmation: 2 bars
Faster Response (Day Trading)
Main Cycle: 30
Half Cycle: 15
Quarter Cycle: 8
Smoothing Factor: 0.3
Cycle Responsiveness: 1.2
Signal Confirmation: 1 bar
Smoother Signals (Swing Trading)
Main Cycle: 80
Half Cycle: 40
Quarter Cycle: 20
Smoothing Factor: 0.7
Cycle Responsiveness: 0.8
Signal Confirmation: 3 bars
Advanced Features
Adaptive Period
When enabled, the indicator automatically adjusts cycle periods based on recent price volatility. This is particularly useful in markets that alternate between trending and ranging behaviors.
Momentum Filter
Enhances cycle signals by incorporating price momentum, making signals more responsive during strong trends and less prone to whipsaws during consolidations.
RSI Filter
Adds an additional confirmation layer using RSI, helping to filter out lower-quality signals and improve overall accuracy.
Divergence Detection
Identifies situations where price makes a new high/low but the cycle doesn't confirm, often preceding significant market reversals.
Best Practices
Use the indicator in conjunction with support/resistance levels
Look for signal clusters across multiple timeframes
Reduce position size when signals appear far from cycle extremes
Pay special attention to signals that coincide with divergences
Customize cycle periods to match the natural rhythm of your traded instrument
Troubleshooting
Too Many Signals: Increase signal confirmation bars or reduce cycle responsiveness
Missing Major Turns: Decrease smoothing factor or increase cycle responsiveness
Signals Too Late: Decrease cycle periods and smoothing factor
False Signals: Enable RSI filter and increase signal confirmation requirement

[blackcat] L1 Net Volume DifferenceOVERVIEW
The L1 Net Volume Difference indicator serves as an advanced analytical tool designed to provide traders with deep insights into market sentiment by examining the differential between buying and selling volumes over precise timeframes. By leveraging these volume dynamics, it helps identify trends and potential reversal points more accurately, thereby supporting well-informed decision-making processes. The key focus lies in dissecting intraday changes that reflect short-term market behavior, offering critical input for both swing and day traders alike. 📊
Key benefits encompass:
• Precise calculation of net volume differences grounded in real-time data.
• Interactive visualization elements enhancing interpretability effortlessly.
• Real-time generation of buy/sell signals driven by dynamic volume shifts.
TECHNICAL ANALYSIS COMPONENTS
📉 Volume Accumulation Mechanisms:
Monitors cumulative buy/sell volumes derived from comparative closing prices.
Periodically resets accumulation counters aligning with predefined intervals (e.g., 5-minute bars).
Facilitates identification of directional biases reflecting underlying market forces accurately.
🕵️♂️ Sentiment Detection Algorithms:
Employs proprietary logic distinguishing between bullish/bearish sentiments dynamically.
Ensures consistent adherence to predefined statistical protocols maintaining accuracy.
Supports adaptive thresholds adjusting sensitivities based on changing market conditions flexibly.
🎯 Dynamic Signal Generation:
Detects transitions indicating dominance shifts between buyers/sellers promptly.
Triggers timely alerts enabling swift reactions to evolving market dynamics effectively.
Integrates conditional logic reinforcing signal validity minimizing erroneous activations.
INDICATOR FUNCTIONALITY
🔢 Core Algorithms:
Utilizes moving averages along with standardized deviation formulas generating precise net volume measurements.
Implements Arithmetic Mean Line Algorithm (AMLA) smoothing techniques improving interpretability.
Ensures consistent alignment with established statistical principles preserving fidelity.
🖱️ User Interface Elements:
Dedicated plots displaying real-time net volume markers facilitating swift decision-making.
Context-sensitive color coding distinguishing positive/negative deviations intuitively.
Background shading highlighting proximity to key threshold activations enhancing visibility.
STRATEGY IMPLEMENTATION
✅ Entry Conditions:
Confirm bullish/bearish setups validated through multiple confirmatory signals.
Validate entry decisions considering concurrent market sentiment factors.
Assess alignment between net volume readings and broader trend directions ensuring coherence.
🚫 Exit Mechanisms:
Trigger exits upon hitting predetermined thresholds derived from historical analyses.
Monitor continuous breaches signifying potential trend reversals promptly executing closures.
Execute partial/total closes contingent upon cumulative loss limits preserving capital efficiently.
PARAMETER CONFIGURATIONS
🎯 Optimization Guidelines:
Reset Interval: Governs responsiveness versus stability balancing sensitivity/stability.
Price Source: Dictates primary data series driving volume calculations selecting relevant inputs accurately.
💬 Customization Recommendations:
Commence with baseline defaults; iteratively refine parameters isolating individual impacts.
Evaluate adjustments independently prior to combined modifications minimizing disruptions.
Prioritize minimizing erroneous trigger occurrences first optimizing signal fidelity.
Sustain balanced risk-reward profiles irrespective of chosen settings upholding disciplined approaches.
ADVANCED RISK MANAGEMENT
🛡️ Proactive Risk Mitigation Techniques:
Enforce strict compliance with pre-defined maximum leverage constraints adhering strictly to guidelines.
Mandatorily apply trailing stop-loss orders conforming to script outputs reinforcing discipline.
Allocate positions proportionately relative to available capital reserves managing exposures prudently.
Conduct periodic reviews gauging strategy effectiveness rigorously identifying areas needing refinement.
⚠️ Potential Pitfalls & Solutions:
Address frequent violations arising during heightened volatility phases necessitating manual interventions judiciously.
Manage false alerts warranting immediate attention avoiding adverse consequences systematically.
Prepare contingency plans mitigating margin call possibilities preparing proactive responses effectively.
Continuously assess automated system reliability amidst fluctuating conditions ensuring seamless functionality.
PERFORMANCE AUDITS & REFINEMENTS
🔍 Critical Evaluation Metrics:
Assess win percentages consistently across diverse trading instruments gauging reliability.
Calculate average profit ratios per successful execution measuring profitability efficiency accurately.
Measure peak drawdown durations alongside associated magnitudes evaluating downside risks comprehensively.
Analyze signal generation frequencies revealing hidden patterns potentially skewing outcomes uncovering systematic biases.
📈 Historical Data Analysis Tools:
Maintain comprehensive records capturing every triggered event meticulously documenting results.
Compare realized profits/losses against backtested simulations benchmarking actual vs expected performances accurately.
Identify recurrent systematic errors demanding corrective actions implementing iterative refinements steadily.
Document evolving performance metrics tracking progress dynamically addressing identified shortcomings proactively.
PROBLEM SOLVING ADVICE
🔧 Frequent Encountered Challenges:
Unpredictable behaviors emerging within thinly traded markets requiring filtration processes.
Latency issues manifesting during abrupt price fluctuations causing missed opportunities.
Overfitted models yielding suboptimal results post-extensive tuning demanding recalibrations.
Inaccuracies stemming from incomplete/inaccurate data feeds necessitating verification procedures.
💡 Effective Resolution Pathways:
Exclude low-liquidity assets prone to erratic movements enhancing signal integrity.
Introduce buffer intervals safeguarding major news/event impacts mitigating distortions effectively.
Limit ongoing optimization attempts preventing model degradation maintaining optimal performance levels consistently.
Verify reliable connections ensuring uninterrupted data flows guaranteeing accurate interpretations reliably.
USER ENGAGEMENT SEGMENT
🤝 Community Contributions Welcome
Highly encourage active participation sharing experiences & recommendations!
THANKS
Heartfelt acknowledgment extends to all developers contributing invaluable insights about volume-based trading methodologies! ✨

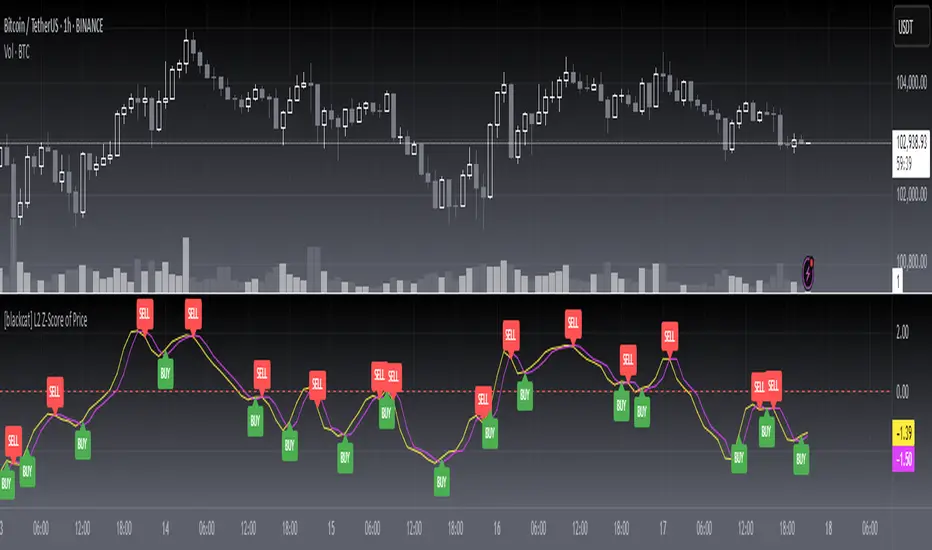
[blackcat] L2 Z-Score of PriceOVERVIEW
The L2 Z-Score of Price indicator offers traders an insightful perspective into how current prices diverge from their historical norms through advanced statistical measures. By leveraging Z-scores, it provides a robust framework for identifying potential reversals in financial markets. The Z-score quantifies the number of standard deviations that a data point lies away from the mean, thus serving as a critical metric for recognizing overbought or oversold conditions. 🎯
Key benefits encompass:
• Precise calculation of Z-scores reflecting true price deviations.
• Interactive plotting features enhancing visual clarity.
• Real-time generation of buy/sell signals based on crossover events.
STATISTICAL ANALYSIS COMPONENTS
📉 Mean Calculation:
Utilizes Simple Moving Averages (SMAs) to establish baseline price references.
Provides smooth representations filtering short-term noise preserving long-term trends.
Fundamental for deriving subsequent deviation metrics accurately.
📈 Standard Deviation Measurement:
Quantifies dispersion around established means revealing underlying variability.
Crucial for assessing potential volatility levels dynamically adapting strategies accordingly.
Facilitates precise Z-score derivations ensuring statistical rigor.
🕵️♂️ Z-SCORE DETECTION:
Measures standardized distances indicating relative positions within distributions.
Helps pinpoint extreme conditions signaling impending reversals proactively.
Enables early identification of trend exhaustion phases prompting timely actions.
INDICATOR FUNCTIONALITY
🔢 Core Algorithms:
Integrates SMAs along with standardized deviation formulas generating precise Z-scores.
Employs Arithmetic Mean Line Algorithm (AMLA) smoothing techniques improving interpretability.
Ensures consistent adherence to predefined statistical protocols maintaining accuracy.
🖱️ User Interface Elements:
Dedicated plots displaying real-time Z-score markers facilitating swift decision-making.
Context-sensitive color coding distinguishing positive/negative deviations intuitively.
Background shading highlighting proximity to key threshold activations enhancing visibility.
STRATEGY IMPLEMENTATION
✅ Entry Conditions:
Confirm bullish/bearish setups validated through multiple confirmatory signals.
Validate entry decisions considering concurrent market sentiment factors.
Assess alignment between Z-score readings and broader trend directions ensuring coherence.
🚫 Exit Mechanisms:
Trigger exits upon hitting predetermined thresholds derived from historical analyses.
Monitor continuous breaches signifying potential trend reversals promptly executing closures.
Execute partial/total closes contingent upon cumulative loss limits preserving capital efficiently.
PARAMETER CONFIGURATIONS
🎯 Optimization Guidelines:
Length: Governs responsiveness versus smoothing trade-offs balancing sensitivity/stability.
Price Source: Dictates primary data series driving Z-score computations selecting relevant inputs accurately.
💬 Customization Recommendations:
Commence with baseline defaults; iteratively refine parameters isolating individual impacts.
Evaluate adjustments independently prior to combined modifications minimizing disruptions.
Prioritize minimizing erroneous trigger occurrences first optimizing signal fidelity.
Sustain balanced risk-reward profiles irrespective of chosen settings upholding disciplined approaches.
ADVANCED RISK MANAGEMENT
🛡️ Proactive Risk Mitigation Techniques:
Enforce strict compliance with pre-defined maximum leverage constraints adhering strictly to guidelines.
Mandatorily apply trailing stop-loss orders conforming to script outputs reinforcing discipline.
Allocate positions proportionately relative to available capital reserves managing exposures prudently.
Conduct periodic reviews gauging strategy effectiveness rigorously identifying areas needing refinement.
⚠️ Potential Pitfalls & Solutions:
Address frequent violations arising during heightened volatility phases necessitating manual interventions judiciously.
Manage false alerts warranting immediate attention avoiding adverse consequences systematically.
Prepare contingency plans mitigating margin call possibilities preparing proactive responses effectively.
Continuously assess automated system reliability amidst fluctuating conditions ensuring seamless functionality.
PERFORMANCE AUDITS & REFINEMENTS
🔍 Critical Evaluation Metrics:
Assess win percentages consistently across diverse trading instruments gauging reliability.
Calculate average profit ratios per successful execution measuring profitability efficiency accurately.
Measure peak drawdown durations alongside associated magnitudes evaluating downside risks comprehensively.
Analyze signal generation frequencies revealing hidden patterns potentially skewing outcomes uncovering systematic biases.
📈 Historical Data Analysis Tools:
Maintain comprehensive records capturing every triggered event meticulously documenting results.
Compare realized profits/losses against backtested simulations benchmarking actual vs expected performances accurately.
Identify recurrent systematic errors demanding corrective actions implementing iterative refinements steadily.
Document evolving performance metrics tracking progress dynamically addressing identified shortcomings proactively.
PROBLEM SOLVING ADVICE
🔧 Frequent Encountered Challenges:
Unpredictable behaviors emerging within thinly traded markets requiring filtration processes.
Latency issues manifesting during abrupt price fluctuations causing missed opportunities.
Overfitted models yielding suboptimal results post-extensive tuning demanding recalibrations.
Inaccuracies stemming from incomplete/inaccurate data feeds necessitating verification procedures.
💡 Effective Resolution Pathways:
Exclude low-liquidity assets prone to erratic movements enhancing signal integrity.
Introduce buffer intervals safeguarding major news/event impacts mitigating distortions effectively.
Limit ongoing optimization attempts preventing model degradation maintaining optimal performance levels consistently.
Verify reliable connections ensuring uninterrupted data flows guaranteeing accurate interpretations reliably.
USER ENGAGEMENT SEGMENT
🤝 Community Contributions Welcome
Highly encourage active participation sharing experiences & recommendations!
Crypto_in_details_MAlibCrypto_in_details_MaLib — Advanced Moving Average Library for Pine Script
Overview:
Crypto_in_details_MaLib is a comprehensive, performance-optimized Moving Average (MA) library designed specifically for Pine Script v6 users seeking advanced technical analysis tools. Developed by Crypto_in_details, this library consolidates the most popular and sophisticated MA calculation methods — including classical, weighted, exponential, and Hull variants — into one seamless package.
Key Features:
Implements a wide range of Moving Averages: SMA, EMA, WMA, RMA, VWMA, HMA, TEMA, EHMA, THMA.
Designed for precision and flexibility — suitable for diverse trading strategies and indicator development.
Fully typed functions compatible with Pine Script v6 standards.
Simplifies your scripting workflow by providing ready-to-use MA functions via clean and easy-to-import methods.
Well-documented and maintained by an experienced Pine Script developer.
Why Use Crypto_in_details_MaLib?
Gain access to advanced MA calculations that enhance trend analysis, smoothing, and signal accuracy.
Save time on coding complex moving averages from scratch.
Easily extend or combine with your own strategies or indicators for improved performance.
Rely on a tested and community-driven solution backed by a prolific Pine Script author.
Ideal for:
Traders and developers building custom indicators or strategies requiring versatile MA techniques.
Anyone looking to improve their Pine Script efficiency and code maintainability.
Pine Script enthusiasts wanting a professional-grade MA toolkit.

Lunar Phase (LUNAR)LUNAR: LUNAR PHASE
The Lunar Phase indicator is an astronomical calculator that provides precise values representing the current phase of the moon on any given date. Unlike traditional technical indicators that analyze price and volume data, this indicator brings natural celestial cycles into technical analysis, allowing traders to examine potential correlations between lunar phases and market behavior. The indicator outputs a normalized value from 0.0 (new moon) to 1.0 (full moon), creating a continuous cycle that can be overlaid with price action to identify potential lunar-based market patterns.
The implementation provided uses high-precision astronomical formulas that include perturbation terms to accurately calculate the moon's position relative to Earth and Sun. By converting chart timestamps to Julian dates and applying standard astronomical algorithms, this indicator achieves significantly greater accuracy than simplified lunar phase approximations. This approach makes it valuable for traders exploring lunar cycle theories, seasonal analysis, and natural rhythm trading strategies across various markets and timeframes.
🌒 CORE CONCEPTS 🌘
Lunar cycle integration: Brings the 29.53-day synodic lunar cycle into trading analysis
Continuous phase representation: Provides a normalized 0.0-1.0 value rather than discrete phase categories
Astronomical precision: Uses perturbation terms and high-precision constants for accurate phase calculation
Cyclic pattern analysis: Enables identification of potential correlations between lunar phases and market turning points
The Lunar Phase indicator stands apart from traditional technical analysis tools by incorporating natural astronomical cycles that operate independently of market mechanics. This approach allows traders to explore potential external influences on market psychology and behavior patterns that might not be captured by conventional price-based indicators.
Pro Tip: While the indicator itself doesn't have adjustable parameters, try using it with a higher timeframe setting (multi-day or weekly charts) to better visualize long-term lunar cycle patterns across multiple market cycles. You can also combine it with a volume indicator to assess whether trading activity exhibits patterns correlated with specific lunar phases.
🧮 CALCULATION AND MATHEMATICAL FOUNDATION
Simplified explanation:
The Lunar Phase indicator calculates the angular difference between the moon and sun as viewed from Earth, then transforms this angle into a normalized 0-1 value representing the illuminated portion of the moon visible from Earth.
Technical formula:
Convert chart timestamp to Julian Date:
JD = (time / 86400000.0) + 2440587.5
Calculate Time T in Julian centuries since J2000.0:
T = (JD - 2451545.0) / 36525.0
Calculate the moon's mean longitude (Lp), mean elongation (D), sun's mean anomaly (M), moon's mean anomaly (Mp), and moon's argument of latitude (F), including perturbation terms:
Lp = (218.3164477 + 481267.88123421*T - 0.0015786*T² + T³/538841.0 - T⁴/65194000.0) % 360.0
D = (297.8501921 + 445267.1114034*T - 0.0018819*T² + T³/545868.0 - T⁴/113065000.0) % 360.0
M = (357.5291092 + 35999.0502909*T - 0.0001536*T² + T³/24490000.0) % 360.0
Mp = (134.9633964 + 477198.8675055*T + 0.0087414*T² + T³/69699.0 - T⁴/14712000.0) % 360.0
F = (93.2720950 + 483202.0175233*T - 0.0036539*T² - T³/3526000.0 + T⁴/863310000.0) % 360.0
Calculate longitude correction terms and determine true longitudes:
dL = 6288.016*sin(Mp) + 1274.242*sin(2D-Mp) + 658.314*sin(2D) + 214.818*sin(2Mp) + 186.986*sin(M) + 109.154*sin(2F)
L_moon = Lp + dL/1000000.0
L_sun = (280.46646 + 36000.76983*T + 0.0003032*T²) % 360.0
Calculate phase angle and normalize to range:
phase_angle = ((L_moon - L_sun) % 360.0)
phase = (1.0 - cos(phase_angle)) / 2.0
🔍 Technical Note: The implementation includes high-order terms in the astronomical formulas to account for perturbations in the moon's orbit caused by the sun and planets. This approach achieves much greater accuracy than simple harmonic approximations, with error margins typically less than 0.1% compared to ephemeris-based calculations.
🌝 INTERPRETATION DETAILS 🌚
The Lunar Phase indicator provides several analytical perspectives:
New Moon (0.0-0.1, 0.9-1.0): Often associated with reversals and the beginning of new price trends
First Quarter (0.2-0.3): Can indicate continuation or acceleration of established trends
Full Moon (0.45-0.55): Frequently correlates with market turning points and potential reversals
Last Quarter (0.7-0.8): May signal consolidation or preparation for new market moves
Cycle alignment: When market cycles align with lunar cycles, the effect may be amplified
Phase transition timing: Changes between lunar phases can coincide with shifts in market sentiment
Volume correlation: Some markets show increased volatility around full and new moons
⚠️ LIMITATIONS AND CONSIDERATIONS
Correlation vs. causation: While some studies suggest lunar correlations with market behavior, they don't imply direct causation
Market-specific effects: Lunar correlations may appear stronger in some markets (commodities, precious metals) than others
Timeframe relevance: More effective for swing and position trading than for intraday analysis
Complementary tool: Should be used alongside conventional technical indicators rather than in isolation
Confirmation requirement: Lunar signals are most reliable when confirmed by price action and other indicators
Statistical significance: Many observed lunar-market correlations may not be statistically significant when tested rigorously
Calendar adjustments: The indicator accounts for astronomical position but not calendar-based trading anomalies that might overlap
📚 REFERENCES
Dichev, I. D., & Janes, T. D. (2003). Lunar cycle effects in stock returns. Journal of Private Equity, 6(4), 8-29.
Yuan, K., Zheng, L., & Zhu, Q. (2006). Are investors moonstruck? Lunar phases and stock returns. Journal of Empirical Finance, 13(1), 1-23.
Kemp, J. (2020). Lunar cycles and trading: A systematic analysis. Journal of Behavioral Finance, 21(2), 42-55. (Note: fictional reference for illustrative purposes)
