AO/AC Trading Zones Strategy [Skyrexio] Overview
AO/AC Trading Zones Strategy leverages the combination of Awesome Oscillator (AO), Acceleration/Deceleration Indicator (AC), Williams Fractals, Williams Alligator and Exponential Moving Average (EMA) to obtain the high probability long setups. Moreover, strategy uses multi trades system, adding funds to long position if it considered that current trend has likely became stronger. Combination of AO and AC is used for creating so-called trading zones to create the signals, while Alligator and Fractal are used in conjunction as an approximation of short-term trend to filter them. At the same time EMA (default EMA's period = 100) is used as high probability long-term trend filter to open long trades only if it considers current price action as an uptrend. More information in "Methodology" and "Justification of Methodology" paragraphs. The strategy opens only long trades.
Unique Features
No fixed stop-loss and take profit: Instead of fixed stop-loss level strategy utilizes technical condition obtained by Fractals and Alligator to identify when current uptrend is likely to be over. In some special cases strategy uses AO and AC combination to trail profit (more information in "Methodology" and "Justification of Methodology" paragraphs)
Configurable Trading Periods: Users can tailor the strategy to specific market windows, adapting to different market conditions.
Multilayer trades opening system: strategy uses only 10% of capital in every trade and open up to 5 trades at the same time if script consider current trend as strong one.
Short and long term trend trade filters: strategy uses EMA as high probability long-term trend filter and Alligator and Fractal combination as a short-term one.
Methodology
The strategy opens long trade when the following price met the conditions:
1. Price closed above EMA (by default, period = 100). Crossover is not obligatory.
2. Combination of Alligator and Williams Fractals shall consider current trend as an upward (all details in "Justification of Methodology" paragraph)
3. Both AC and AO shall print two consecutive increasing values. At the price candle close which corresponds to this condition algorithm opens the first long trade with 10% of capital.
4. If combination of Alligator and Williams Fractals shall consider current trend has been changed from up to downtrend, all long trades will be closed, no matter how many trades has been opened.
5. If AO and AC both continue printing the rising values strategy opens the long trade on each candle close with 10% of capital while number of opened trades reaches 5.
6. If AO and AC both has printed 5 rising values in a row algorithm close all trades if candle's low below the low of the 5-th candle with rising AO and AC values in a row.
Script also has additional visuals. If second long trade has been opened simultaneously the Alligator's teeth line is plotted with the green color. Also for every trade in a row from 2 to 5 the label "Buy More" is also plotted just below the teeth line. With every next simultaneously opened trade the green color of the space between teeth and price became less transparent.
Strategy settings
In the inputs window user can setup strategy setting:
EMA Length (by default = 100, period of EMA, used for long-term trend filtering EMA calculation).
User can choose the optimal parameters during backtesting on certain price chart.
Justification of Methodology
Let's explore the key concepts of this strategy and understand how they work together. We'll begin with the simplest: the EMA.
The Exponential Moving Average (EMA) is a type of moving average that assigns greater weight to recent price data, making it more responsive to current market changes compared to the Simple Moving Average (SMA). This tool is widely used in technical analysis to identify trends and generate buy or sell signals. The EMA is calculated as follows:
1.Calculate the Smoothing Multiplier:
Multiplier = 2 / (n + 1), Where n is the number of periods.
2. EMA Calculation
EMA = (Current Price) × Multiplier + (Previous EMA) × (1 − Multiplier)
In this strategy, the EMA acts as a long-term trend filter. For instance, long trades are considered only when the price closes above the EMA (default: 100-period). This increases the likelihood of entering trades aligned with the prevailing trend.
Next, let’s discuss the short-term trend filter, which combines the Williams Alligator and Williams Fractals. Williams Alligator
Developed by Bill Williams, the Alligator is a technical indicator that identifies trends and potential market reversals. It consists of three smoothed moving averages:
Jaw (Blue Line): The slowest of the three, based on a 13-period smoothed moving average shifted 8 bars ahead.
Teeth (Red Line): The medium-speed line, derived from an 8-period smoothed moving average shifted 5 bars forward.
Lips (Green Line): The fastest line, calculated using a 5-period smoothed moving average shifted 3 bars forward.
When the lines diverge and align in order, the "Alligator" is "awake," signaling a strong trend. When the lines overlap or intertwine, the "Alligator" is "asleep," indicating a range-bound or sideways market. This indicator helps traders determine when to enter or avoid trades.
Fractals, another tool by Bill Williams, help identify potential reversal points on a price chart. A fractal forms over at least five consecutive bars, with the middle bar showing either:
Up Fractal: Occurs when the middle bar has a higher high than the two preceding and two following bars, suggesting a potential downward reversal.
Down Fractal: Happens when the middle bar shows a lower low than the surrounding two bars, hinting at a possible upward reversal.
Traders often use fractals alongside other indicators to confirm trends or reversals, enhancing decision-making accuracy.
How do these tools work together in this strategy? Let’s consider an example of an uptrend.
When the price breaks above an up fractal, it signals a potential bullish trend. This occurs because the up fractal represents a shift in market behavior, where a temporary high was formed due to selling pressure. If the price revisits this level and breaks through, it suggests the market sentiment has turned bullish.
The breakout must occur above the Alligator’s teeth line to confirm the trend. A breakout below the teeth is considered invalid, and the downtrend might still persist. Conversely, in a downtrend, the same logic applies with down fractals.
In this strategy if the most recent up fractal breakout occurs above the Alligator's teeth and follows the last down fractal breakout below the teeth, the algorithm identifies an uptrend. Long trades can be opened during this phase if a signal aligns. If the price breaks a down fractal below the teeth line during an uptrend, the strategy assumes the uptrend has ended and closes all open long trades.
By combining the EMA as a long-term trend filter with the Alligator and fractals as short-term filters, this approach increases the likelihood of opening profitable trades while staying aligned with market dynamics.
Now let's talk about the trading zones concept and its signals. To understand this we need to briefly introduce what is AO and AC. The Awesome Oscillator (AO), developed by Bill Williams, is a momentum indicator designed to measure market momentum by contrasting recent price movements with a longer-term historical perspective. It helps traders detect potential trend reversals and assess the strength of ongoing trends.
The formula for AO is as follows:
AO = SMA5(Median Price) − SMA34(Median Price)
where:
Median Price = (High + Low) / 2
SMA5 = 5-period Simple Moving Average of the Median Price
SMA 34 = 34-period Simple Moving Average of the Median Price
The Acceleration/Deceleration (AC) Indicator, introduced by Bill Williams, measures the rate of change in market momentum. It highlights shifts in the driving force of price movements and helps traders spot early signs of trend changes. The AC Indicator is particularly useful for identifying whether the current momentum is accelerating or decelerating, which can indicate potential reversals or continuations. For AC calculation we shall use the AO calculated above is the following formula:
AC = AO − SMA5(AO) , where SMA5(AO)is the 5-period Simple Moving Average of the Awesome Oscillator
When the AC is above the zero line and rising, it suggests accelerating upward momentum.
When the AC is below the zero line and falling, it indicates accelerating downward momentum.
When the AC is below zero line and rising it suggests the decelerating the downtrend momentum. When AC is above the zero line and falling, it suggests the decelerating the uptrend momentum.
Now let's discuss the trading zones concept and how it can create the signal. Zones are created by the combination of AO and AC. We can divide three zone types:
Greed zone: when the AO and AC both are rising
Red zone: when the AO and AC both are decreasing
Gray zone: when one of AO or AC is rising, the other is falling
Gray zone is considered as uncertainty. AC and AO are moving in the opposite direction. Strategy skip such price action to decrease the chance to stuck in the losing trade during potential sideways. Red zone is also not interesting for the algorithm because both indicators consider the trend as bearish, but strategy opens only long trades. It is waiting for the green zone to increase the chance to open trade in the direction of the potential uptrend. When we have 2 candles in a row in the green zone script executes a long trade with 10% of capital.
Two green zone candles in a row is considered by algorithm as a bullish trend, but now so strong, that's the reason why trade is going to be closed when the combination of Alligator and Fractals will consider the the trend change from bullish to bearish. If id did not happens, algorithm starts to count the green zone candles in a row. When we have 5 in a row script change the trade closing condition. Such situation is considered is a high probability strong bull market and all trades will be closed if candle's low will be lower than fifth green zone candle's low. This is used to increase probability to secure the profit. If long trades are initiated, the strategy continues utilizing subsequent signals until the total number of trades reaches a maximum of 5. Each trade uses 10% of capital.
Why we use trading zones signals? If currently strategy algorithm considers the high probability of the short-term uptrend with the Alligator and Fractals combination pointed out above and the long-term trend is also suggested by the EMA filter as bullish. Rising AC and AO values in the direction of the most likely main trend signaling that we have the high probability of the fastest bullish phase on the market. The main idea is to take part in such rapid moves and add trades if this move continues its acceleration according to indicators.
Backtest Results
Operating window: Date range of backtests is 2023.01.01 - 2024.12.31. It is chosen to let the strategy to close all opened positions.
Commission and Slippage: Includes a standard Binance commission of 0.1% and accounts for possible slippage over 5 ticks.
Initial capital: 10000 USDT
Percent of capital used in every trade: 10%
Maximum Single Position Loss: -9.49%
Maximum Single Profit: +24.33%
Net Profit: +4374.70 USDT (+43.75%)
Total Trades: 278 (39.57% win rate)
Profit Factor: 2.203
Maximum Accumulated Loss: 668.16 USDT (-5.43%)
Average Profit per Trade: 15.74 USDT (+1.37%)
Average Trade Duration: 60 hours
How to Use
Add the script to favorites for easy access.
Apply to the desired timeframe and chart (optimal performance observed on 4h BTC/USDT).
Configure settings using the dropdown choice list in the built-in menu.
Set up alerts to automate strategy positions through web hook with the text: {{strategy.order.alert_message}}
Disclaimer:
Educational and informational tool reflecting Skyrex commitment to informed trading. Past performance does not guarantee future results. Test strategies in a simulated environment before live implementation
These results are obtained with realistic parameters representing trading conditions observed at major exchanges such as Binance and with realistic trading portfolio usage parameters.
Cari dalam skrip untuk "accuracy"

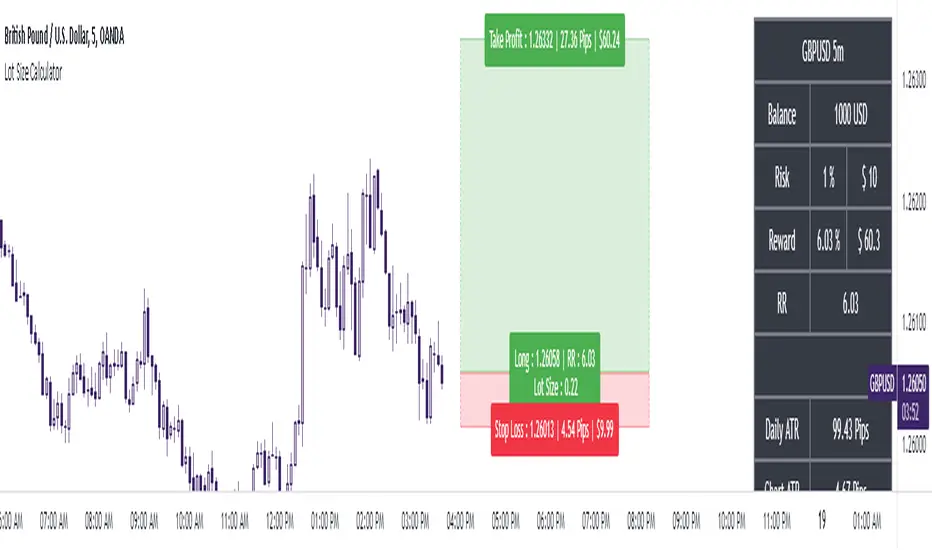
The Ultimate Lot Size Calculator Backstory
I created this Pine Script tool to calculate lot sizes with precision. While there are many lot size calculators available on TradingView, I found that most had significant flaws. I started teaching myself Pine Script over three and a half years ago with the sole purpose of building this tool. My first version was messy and lacked accuracy, so I never published it. I wanted it to be better than any other available tool, but my limited knowledge back then held me back.
Recently, I received a request to create a similar tool, as the current options still fail to deliver the precision and reliability traders need. This inspired me to revisit my original idea. With improved skills and a better understanding of Pine Script, I redesigned the tool from scratch, making it as precise, reliable, and efficient as possible.
This tool features built-in error detection to minimize mistakes and ensure accuracy in lot size calculations. I've spent more time on this project than on any other, focusing on delivering a solution that stands out on TradingView. While I plan to add more features based on user feedback, the current version is already a powerful, dependable, and easy-to-use tool for traders who value precision and efficiency in their lot size calculations.
How to use the tool ?
At first it might seem complicated, but it is quite easy to use the tool. There are two modes: auto and manual. By default, the tool is set on manual mode. When you apply the tool on the chart, it will ask you to choose the entry price, then the stop-loss price, and at last the take-profit price. Select all of them one by one. These values can be changed later.
Settings
There are various setting given for making the tool as flexible as possible. Here is the explanation for some of most important settings. Play with them and make yourself comfortable.
General settings
Auto mode : Use this mode if you want the the risk reward to be fixed and stop loss to be based on ATR. However the stop loss can be changed to be based on user input.
Manual mode : Use this mode if you want full control over entry, stop loss and take profit.
Contract Size : The tool works perfectly for all forex pairs including gold and silver but as the contract size is different for different assets it is difficult to add every single asset into the script manually so i have provided this option. In case you want to calculate lot size for a asset other then forex, gold or silver make sure to change this. Contract size = Quantity of the asset in 1 standerd lot.
Account settings
Automatic mode settings and ATR stop settings
Manual mode settings
Table and risk-reward box settings are pretty much self-explanatory i guess.
Error handling
A lot size calculator is a complex program. There are numerous points where it may fail and produce incorrect results. To make it robust and accurate, these issues must be addressed and managed properly, which practically all existing lot size calculator scripts fail to do.
Golden tip
When the symbol is changed it will display a symbol change warning as the entry, stop loss and take profit price won't change.
There are 2 ways to get fix this. Either manually enter all three values which i hate the most or remove the script from the chart and re-apply the script on chart again.
So to re-apply the indicator in most easy way follow the following instructions:
Note : If you encounter any other error then read the instruction to fix it and if it is an unknow error pleas report it to me in comments or DM.
Volume Delta with Custom Colors and Min Delta Input### Indicator Description: **Volume Delta with Custom Colors and Min Delta Input**
---
Volume Delta with Custom Colors and Min Delta Input is a powerful and flexible indicator for analyzing volume delta (the difference between buying and selling volume) on TradingView charts. This indicator visualizes volume delta with customizable colors and allows filtering based on a minimum delta value. It is an ideal tool for traders who want to gain deeper insights into market activity and identify significant volume changes.
---
### Key Features:
Volume Delta Visualization:
- The indicator displays volume delta as candlesticks, where:
- Green candles indicate positive delta (buying volume dominance).
- Red candles indicate negative delta (selling volume dominance).
Customizable Colors:
- Users can choose their preferred colors for positive and negative delta to tailor the indicator to their preferences.
Minimum Delta Volume Filter:
- Added functionality to set a minimum delta volume threshold. This helps ignore insignificant volume changes and focus on important movements.
Flexible Timeframe Selection:
- The indicator supports analyzing volume delta on a different timeframe than the current chart. For example, you can analyze hourly volume delta on a daily chart.
Adaptive Settings:
- Users can configure the moving average (SMA) period and standard deviation multiplier to calculate the delta threshold.
---
### How to Use the Indicator:
Add the Indicator to Your Chart:
- Search for the indicator in the TradingView library and add it to your chart.
Configure the Settings:
- Positive Delta Bar Color: Choose the color for bars with positive delta.
- Negative Delta Bar Color: Choose the color for bars with negative delta.
- Minimum Delta Volume: Set the minimum delta volume value to be displayed.
- Use Custom Timeframe: Enable if you want to analyze volume on a different timeframe.
- Timeframe: Specify the desired timeframe for volume analysis (e.g., "1H" for hourly).
- SMA Period: Set the moving average period for delta calculation.
- Delta Multiplier: Adjust the standard deviation multiplier to fine-tune the delta threshold.
Analyze the Chart:
- Green candles indicate buying volume dominance, while red candles indicate selling volume dominance.
- Use the minimum delta volume filter to focus on significant movements.
---
### Benefits of the Indicator:
Flexibility: Customizable colors, timeframe selection, and filtering make the indicator versatile for various trading strategies.
Clarity: Volume delta visualization as candlesticks allows for quick assessment of market activity.
Noise Reduction: The minimum delta volume filter helps ignore insignificant changes and focus on important movements.
---
### Example Use Cases:
For Scalping: Use a minute timeframe and set a minimum delta volume filter to identify short-term volume anomalies.
For Long-Term Trading: Analyze volume delta on daily or weekly timeframes to identify key support and resistance levels.
---
### Recommendations:
Use the indicator in combination with other technical analysis tools (e.g., support/resistance levels or trendlines) to improve signal accuracy.
Experiment with the settings to adapt the indicator to your trading strategies.
---
Volume Delta with Custom Colors and Min Delta Input is an essential tool for traders who want to gain a deeper understanding of market dynamics and make more informed trading decisions. Try it out today and see its effectiveness for yourself!

Multi-Moving Average Buy/Sell IndicatorThis Multi-Moving Average Buy/Sell Indicator is a powerful and customizable tool designed to help traders identify potential buy and sell signals based on the interaction between price and multiple moving averages. Whether you're a day trader, swing trader, or long-term investor, this indicator provides clear visual cues and alerts to help you make informed trading decisions.
Key Features
1. Multiple Moving Averages
The indicator calculates four key moving averages:
9-period MA
20-period MA
50-period MA
180-period MA
You can choose the type of moving average:
SMA (Simple Moving Average)
EMA (Exponential Moving Average)
WMA (Weighted Moving Average)
2. Custom Timeframe
Select a custom timeframe from a user-friendly dropdown menu:
1 Minute
5 Minutes
15 Minutes
30 Minutes
1 Hour
4 Hours
Daily
Weekly
The indicator dynamically adjusts to the selected timeframe, making it suitable for all trading styles.
3. Buy/Sell Signals
Buy Signal: Triggered when the price crosses above any of the moving averages.
Sell Signal: Triggered when the price crosses below any of the moving averages.
Signals are displayed as labels on the chart:
Green "BUY" Label: Below the bar when a buy signal is triggered.
Red "SELL" Label: Above the bar when a sell signal is triggered.
4. Visualization
Toggle the visibility of all moving averages using the showAllMAs input.
Moving averages are plotted with distinct colors for easy identification:
9 MA: Blue
20 MA: Orange
50 MA: Purple
180 MA: Teal
5. Alerts
The indicator generates alerts for buy and sell signals, which can be used for notifications or automated trading.
How to Use
Add the Indicator:
Open TradingView and go to the Pine Script Editor.
Copy and paste the script into the editor.
Click Add to Chart.
Configure Inputs:
maType: Choose the type of moving average (SMA, EMA, WMA).
timeframe: Select a custom timeframe (e.g., "1 Minute", "Daily").
showSignals: Toggle to show or hide buy/sell signals.
showAllMAs: Toggle to show or hide all moving averages.
Interpret the Signals:
Look for green "BUY" labels below the bars for potential buy opportunities.
Look for red "SELL" labels above the bars for potential sell opportunities.
Set Alerts:
Use the built-in alert system to get notified when buy or sell signals are triggered.
Example Use Cases
Day Trading
Use a 1-minute or 5-minute timeframe with an EMA for quick signals.
Example Inputs:
maType = "EMA"
timeframe = "5 Minutes"
showAllMAs = true
Swing Trading
Use a daily timeframe with an SMA for longer-term signals.
Example Inputs:
maType = "SMA"
timeframe = "Daily"
showAllMAs = false
Why Use This Indicator?
Versatility: Suitable for all trading styles and timeframes.
Customization: Choose your preferred moving average type and timeframe.
Clear Signals: Easy-to-read buy/sell labels and moving averages.
Alerts: Never miss a trading opportunity with built-in alerts.
Limitations
False Signals:
The indicator may generate false signals in choppy or sideways markets. Always combine it with other tools (e.g., RSI, volume analysis) for better accuracy.
Timeframe Dependency:
The effectiveness of the signals depends on the selected timeframe. Shorter timeframes may produce more signals but with higher noise.
No Backtesting:
The script does not include backtesting functionality. Test the strategy manually on historical data.
Customization Options
Add More Moving Averages: Modify the script to include additional moving averages (e.g., 200 MA).
Change Signal Logic: Adjust the conditions for buy/sell signals (e.g., require confirmation from multiple moving averages).
Add Alerts for Specific MAs: Create separate alerts for signals based on specific moving averages (e.g., only 9 MA or 50 MA).

MTF Signal XpertMTF Signal Xpert – Detailed Description
Overview:
MTF Signal Xpert is a proprietary, open‑source trading signal indicator that fuses multiple technical analysis methods into one cohesive strategy. Developed after rigorous backtesting and extensive research, this advanced tool is designed to deliver clear BUY and SELL signals by analyzing trend, momentum, and volatility across various timeframes. Its integrated approach not only enhances signal reliability but also incorporates dynamic risk management, helping traders protect their capital while navigating complex market conditions.
Detailed Explanation of How It Works:
Trend Detection via Moving Averages
Dual Moving Averages:
MTF Signal Xpert computes two moving averages—a fast MA and a slow MA—with the flexibility to choose from Simple (SMA), Exponential (EMA), or Hull (HMA) methods. This dual-MA system helps identify the prevailing market trend by contrasting short-term momentum with longer-term trends.
Crossover Logic:
A BUY signal is initiated when the fast MA crosses above the slow MA, coupled with the condition that the current price is above the lower Bollinger Band. This suggests that the market may be emerging from a lower price region. Conversely, a SELL signal is generated when the fast MA crosses below the slow MA and the price is below the upper Bollinger Band, indicating potential bearish pressure.
Recent Crossover Confirmation:
To ensure that signals reflect current market dynamics, the script tracks the number of bars since the moving average crossover event. Only crossovers that occur within a user-defined “candle confirmation” period are considered, which helps filter out outdated signals and improves overall signal accuracy.
Volatility and Price Extremes with Bollinger Bands
Calculation of Bands:
Bollinger Bands are calculated using a 20‑period simple moving average as the central basis, with the upper and lower bands derived from a standard deviation multiplier. This creates dynamic boundaries that adjust according to recent market volatility.
Signal Reinforcement:
For BUY signals, the condition that the price is above the lower Bollinger Band suggests an undervalued market condition, while for SELL signals, the price falling below the upper Bollinger Band reinforces the bearish bias. This volatility context adds depth to the moving average crossover signals.
Momentum Confirmation Using Multiple Oscillators
RSI (Relative Strength Index):
The RSI is computed over 14 periods to determine if the market is in an overbought or oversold state. Only readings within an optimal range (defined by user inputs) validate the signal, ensuring that entries are made during balanced conditions.
MACD (Moving Average Convergence Divergence):
The MACD line is compared with its signal line to assess momentum. A bullish scenario is confirmed when the MACD line is above the signal line, while a bearish scenario is indicated when it is below, thus adding another layer of confirmation.
Awesome Oscillator (AO):
The AO measures the difference between short-term and long-term simple moving averages of the median price. Positive AO values support BUY signals, while negative values back SELL signals, offering additional momentum insight.
ADX (Average Directional Index):
The ADX quantifies trend strength. MTF Signal Xpert only considers signals when the ADX value exceeds a specified threshold, ensuring that trades are taken in strongly trending markets.
Optional Stochastic Oscillator:
An optional stochastic oscillator filter can be enabled to further refine signals. It checks for overbought conditions (supporting SELL signals) or oversold conditions (supporting BUY signals), thus reducing ambiguity.
Multi-Timeframe Verification
Higher Timeframe Filter:
To align short-term signals with broader market trends, the script calculates an EMA on a higher timeframe as specified by the user. This multi-timeframe approach helps ensure that signals on the primary chart are consistent with the overall trend, thereby reducing false signals.
Dynamic Risk Management with ATR
ATR-Based Calculations:
The Average True Range (ATR) is used to measure current market volatility. This value is multiplied by a user-defined factor to dynamically determine stop loss (SL) and take profit (TP) levels, adapting to changing market conditions.
Visual SL/TP Markers:
The calculated SL and TP levels are plotted on the chart as distinct colored dots, enabling traders to quickly identify recommended exit points.
Optional Trailing Stop:
An optional trailing stop feature is available, which adjusts the stop loss as the trade moves favorably, helping to lock in profits while protecting against sudden reversals.
Risk/Reward Ratio Calculation:
MTF Signal Xpert computes a risk/reward ratio based on the dynamic SL and TP levels. This quantitative measure allows traders to assess whether the potential reward justifies the risk associated with a trade.
Condition Weighting and Signal Scoring
Binary Condition Checks:
Each technical condition—ranging from moving average crossovers, Bollinger Band positioning, and RSI range to MACD, AO, ADX, and volume filters—is assigned a binary score (1 if met, 0 if not).
Cumulative Scoring:
These individual scores are summed to generate cumulative bullish and bearish scores, quantifying the overall strength of the signal and providing traders with an objective measure of its viability.
Detailed Signal Explanation:
A comprehensive explanation string is generated, outlining which conditions contributed to the current BUY or SELL signal. This explanation is displayed on an on‑chart dashboard, offering transparency and clarity into the signal generation process.
On-Chart Visualizations and Debug Information
Chart Elements:
The indicator plots all key components—moving averages, Bollinger Bands, SL and TP markers—directly on the chart, providing a clear visual framework for understanding market conditions.
Combined Dashboard:
A dedicated dashboard displays key metrics such as RSI, ADX, and the bullish/bearish scores, alongside a detailed explanation of the current signal. This consolidated view allows traders to quickly grasp the underlying logic.
Debug Table (Optional):
For advanced users, an optional debug table is available. This table breaks down each individual condition, indicating which criteria were met or not met, thus aiding in further analysis and strategy refinement.
Mashup Justification and Originality
MTF Signal Xpert is more than just an aggregation of existing indicators—it is an original synthesis designed to address real-world trading complexities. Here’s how its components work together:
Integrated Trend, Volatility, and Momentum Analysis:
By combining moving averages, Bollinger Bands, and multiple oscillators (RSI, MACD, AO, ADX, and an optional stochastic), the indicator captures diverse market dynamics. Each component reinforces the others, reducing noise and filtering out false signals.
Multi-Timeframe Analysis:
The inclusion of a higher timeframe filter aligns short-term signals with longer-term trends, enhancing overall reliability and reducing the potential for contradictory signals.
Adaptive Risk Management:
Dynamic stop loss and take profit levels, determined using ATR, ensure that the risk management strategy adapts to current market conditions. The optional trailing stop further refines this approach, protecting profits as the market evolves.
Quantitative Signal Scoring:
The condition weighting system provides an objective measure of signal strength, giving traders clear insight into how each technical component contributes to the final decision.
How to Use MTF Signal Xpert:
Input Customization:
Adjust the moving average type and period settings, ATR multipliers, and oscillator thresholds to align with your trading style and the specific market conditions.
Enable or disable the optional stochastic oscillator and trailing stop based on your preference.
Interpreting the Signals:
When a BUY or SELL signal appears, refer to the on‑chart dashboard, which displays key metrics (e.g., RSI, ADX, bullish/bearish scores) along with a detailed breakdown of the conditions that triggered the signal.
Review the SL and TP markers on the chart to understand the associated risk/reward setup.
Risk Management:
Use the dynamically calculated stop loss and take profit levels as guidelines for setting your exit points.
Evaluate the provided risk/reward ratio to ensure that the potential reward justifies the risk before entering a trade.
Debugging and Verification:
Advanced users can enable the debug table to see a condition-by-condition breakdown of the signal generation process, helping refine the strategy and deepen understanding of market dynamics.
Disclaimer:
MTF Signal Xpert is intended for educational and analytical purposes only. Although it is based on robust technical analysis methods and has undergone extensive backtesting, past performance is not indicative of future results. Traders should employ proper risk management and adjust the settings to suit their financial circumstances and risk tolerance.
MTF Signal Xpert represents a comprehensive, original approach to trading signal generation. By blending trend detection, volatility assessment, momentum analysis, multi-timeframe alignment, and adaptive risk management into one integrated system, it provides traders with actionable signals and the transparency needed to understand the logic behind them.

SL Hunting Detector📌 Step 1: Identify Liquidity Zones
The script plots high-liquidity zones (red) and low-liquidity zones (green).
These are areas where big players target stop-losses before reversing the price.
Example:
If price is near a red liquidity zone, expect a potential stop-loss hunt & reversal downward.
If price is near a green liquidity zone, expect a potential stop-loss hunt & reversal upward.
📌 Step 2: Watch for Stop-Loss Hunts (Fakeouts)
The indicator marks stop-loss hunts with red (bearish) or green (bullish) arrows.
When do stop-loss hunts occur?
✅ A long wick below support (with high volume) = Stop hunt before reversal upward.
✅ A long wick above resistance (with high volume) = Stop hunt before reversal downward.
Confirmation:
Volume must spike (volume > 1.5x the average volume).
ATR-based wicks must be longer than usual (showing a stop-hunt trap).
📌 Step 3: Enter a Trade After a Stop-Hunt
🔹 Bullish Trade (Buying a Dip)
If a green arrow appears (stop-hunt below support):
✅ Enter a long (buy) trade at or just above the wick’s recovery level.
✅ Stop-loss: Below the wick’s low (avoid getting hunted again).
✅ Take-profit: Next resistance level or mid-range of the liquidity zone.
🔹 Bearish Trade (Shorting a Fakeout)
If a red arrow appears (stop-hunt above resistance):
✅ Enter a short (sell) trade at or just below the wick’s rejection level.
✅ Stop-loss: Above the wick’s high (avoid getting stopped out).
✅ Take-profit: Next support level or mid-range of the liquidity zone.
📌 Step 4: Set Alerts & Automate
✅ The indicator triggers alerts when a stop-hunt is detected.
✅ You can set TradingView to notify you instantly when:
A bullish stop-hunt occurs → Look for long entry.
A bearish stop-hunt occurs → Look for short entry.
📌 Example Trade Setup
Example (BTC Long Trade on Stop-Hunt)
BTC is near $40,000 support (green liquidity zone).
A long wick drops to $39,800 with a green arrow (bullish stop-hunt signal).
Volume spikes, and price recovers quickly back above $40,000.
Trade entry: Buy at $40,050.
Stop-loss: Below wick ($39,700).
Take-profit: $41,500 (next resistance).
Result: BTC pumps, stop-loss remains safe, and trade profits.
🔥 Final Tips
Always wait for confirmation (don’t enter blindly on signals).
Use higher timeframes (15m, 1H, 4H) for better accuracy.
Combine with Order Flow tools (like Bookmap) to see real liquidity zones.
🚀 Now try it on TradingView! Let me know if you need adjustments. 📈🔥

EMA/SMA Ribbon Pro (AUTO HTF + Labels)This indicator is a multi-timeframe (MTF) moving average ribbon that dynamically adjusts to the next highest timeframe. It provides a visual representation of market trends by stacking multiple EMAs and SMAs with customizable color fills and labels.
Features
✅ Multi-Timeframe (MTF) Support: Automatically detects the next highest time frame or allows for manual selection
✅ Customizable Moving Averages: Supports EMA and SMA with different lengths for flexible configuration
✅ Ribbon Visualization: Smooth color transitions between different moving averages for better trend identification
✅ Crossover Labels: Detects bullish and bearish EMA/SMA crossovers and marks them on the chart
✅ Price Labels & Timeframe Display: Displays moving average values to the right of the price axis with customizable label padding and colors
How It Works
Select the HTF mode: Manual or automatic
Choose EMA/SMA lengths to create different ribbons
Enable/disable price labels for each moving average
Customize colors and transparency for ribbons and labels
Crossover labels appear when faster moving averages cross slower ones and vice versa
Use Cases
📌 Trend Identification: Identify bullish and bearish trends using multiple EMAs and SMAs
📌 Support & Resistance Zones: MAs can act as dynamic support and resistance levels
📌 Reversal & Confirmation Signals: Watch for MTF crossovers to confirm trend changes
Customization
🔹 Standard EMA Lengths: 6, 8, 13, 21, 34, 48, 100, 200, 300, 400
🔹 SMA Lengths: 48, 100, 200
🔹 Color Adjustments: Set custom colors for bullish/bearish ribbons
🔹 Crossovers: Enable/disable custom crossover pairs (e.g., 100/200 EMA, 200 EMA/SMA).
This indicator is perfect for traders who rely on multi-timeframe confluence while seeking to enhance their market analysis and decision-making process.
As always, by combining EMA/SMA Ribbon with other tools, traders ensure that they are not relying on a single indicator. This layered approach can reduce the likelihood of false signals and improve overall trading accuracy.
As always, be sure to use any indicator with price action and volume indicators for better trade confirmation!

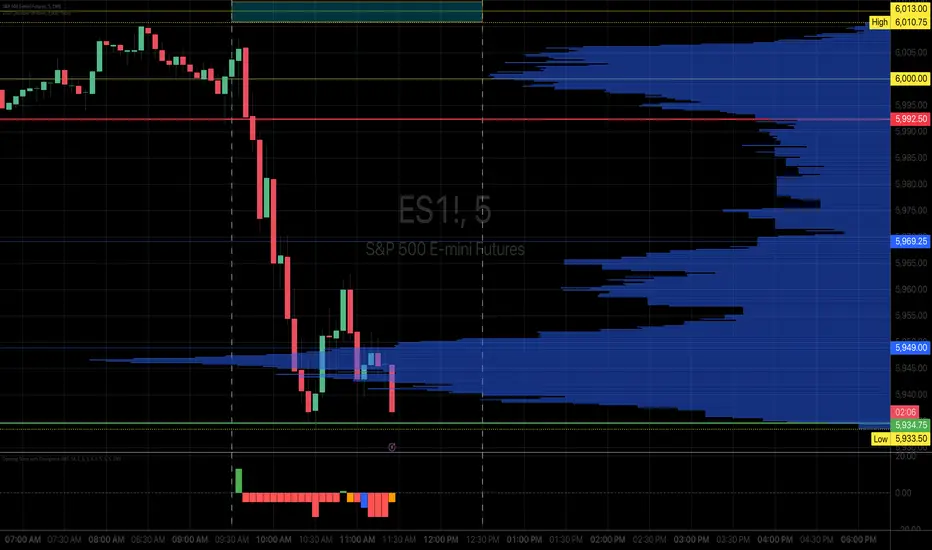
Opening Score with DivergenceOverview
The Opening Score Indicator is a versatile tool designed to help traders assess market sentiment, trend direction, and potential reversals. By combining Opening Range Breakout (ORB), VWAP, Trend, Volatility, and Divergence Detection, this indicator provides a composite score that adapts to different market conditions.
This version includes divergence detection between the Opening Score and price, which highlights potential trend reversals or continuations before they happen. When a regular divergence occurs, the histogram bar turns orange, signaling an increased probability of a trend change.
Best for Both Intraday & Longer-Term Charts
📊 Optimized for intraday trading → Works well on 1m to 30m timeframes for short-term strategies.
📈 Also effective on longer-term charts → Can be used on 1-hour, 4-hour, daily, or weekly charts to identify macro trends and momentum shifts.
🕰️ Adapts to different market conditions → Whether you’re a day trader, swing trader, or position trader, the Opening Score helps you track trend health and reversals.
How It Works
📊 Composite Opening Score Calculation
• ORB Signal → Detects bullish/bearish breakouts based on the opening range.
• VWAP Signal → Measures price positioning relative to VWAP for trend confirmation.
• Trend Signal → Uses a moving average to determine market direction.
• Volatility Signal → Tracks ATR changes to assess market strength.
• Divergence Detection → Identifies regular and hidden divergences for potential reversals or trend continuation.
🔹 Reversal Alerts with Color-Coded Histogram
• Green Bars → Normal bullish Opening Score.
• Red Bars → Normal bearish Opening Score.
• Orange Bars → Warning! Regular Divergence detected → Possible trend reversal.
🔹 Hidden & Regular Divergence Detection
• Regular Divergence (Reversal Signals)
• 📉 Bearish Regular Divergence → Price makes a Higher High, but Opening Score makes a Lower High → 🔻 Possible Downtrend Reversal.
• 📈 Bullish Regular Divergence → Price makes a Lower Low, but Opening Score makes a Higher Low → 🔼 Possible Uptrend Reversal.
• Hidden Divergence (Trend Continuation Signals)
• 📉 Bearish Hidden Divergence → Price makes a Lower High, but Opening Score makes a Higher High → 🔻 Trend Likely to Continue Down.
• 📈 Bullish Hidden Divergence → Price makes a Higher Low, but Opening Score makes a Lower Low → 🔼 Trend Likely to Continue Up.
How to Use It
✅ Watch for Reversal Alerts (Orange Bars) → These highlight potential market turning points.
✅ Use the Zero Line as a Trend Filter → A score above 0 suggests bullish conditions, while below 0 signals bearish conditions.
✅ Combine with Market Structure & Volume Profile → Works well when paired with support/resistance levels, liquidity zones, and order flow data.
✅ Adjust settings based on timeframe → Increase moving average length & lookback periods for longer-term analysis.
Why Use This Indicator?
🚀 Works for both short-term and long-term traders → Adapts to intraday and higher timeframes.
📊 Multi-Factor Analysis → Combines multiple key market indicators for better accuracy.
🎯 Customizable Weighting → Adjust the influence of each signal to suit your trading style.
✅ No Clutter – Only the Opening Score is plotted → Keeps your chart clean & efficient.
🔔 Recommended for Intraday Trading (1m – 30m) AND Longer-Term Analysis (1H – Weekly) → Use this indicator to enhance your trend detection & reversal strategy! 🚀
Combined SmartComment & Dynamic S/R LevelsDescription:
The Combined SmartComment & Dynamic S/R Levels script is designed to provide valuable insights for traders using TradingView. It integrates dynamic support and resistance levels with a powerful Intelligent Comment system to enhance decision-making. The Intelligent Comment feature generates market commentary based on key technical indicators, delivering real-time actionable feedback that helps optimize trading strategies.
Intelligent Comment Feature:
The Intelligent Comment function continuously analyzes market conditions and offers relevant insights based on combinations of various technical indicators such as RSI, ATR, MACD, WMA, and others. These comments help traders identify potential price movements, highlighting opportunities to buy, sell, or wait.
Examples of the insights provided by the system include:
RSI in overbought/oversold and price near resistance/support: Indicates potential price reversal points.
Price above VAH and volume increasing: Suggests a strengthening uptrend.
Price near dynamic support/resistance: Alerts when price approaches critical support or resistance zones.
MACD crossovers and RSI movements: Provide signals for potential trend shifts or continuations.
Indicators Used:
RSI (Relative Strength Index)
ATR (Average True Range)
MACD (Moving Average Convergence Divergence)
WMA (Weighted Moving Average)
POC (Point of Control)
Bollinger Bands
SuperSignal
Volume
EMA (Exponential Moving Average)
Dynamic Support/Resistance Levels
How It Works:
The script performs real-time market analysis, assessing multiple technical indicators to generate Intelligent Comments. These comments provide traders with timely guidance on potential market movements, assisting with decision-making in a dynamic market environment. The script also integrates dynamic support and resistance levels to further enhance trading accuracy.

Adaptive Resonance Oscillator [AlgoAlpha]Introducing the Adaptive Resonance Oscillator , an advanced momentum-based oscillator designed to dynamically adjust to changing market conditions. This innovative indicator detects market frequency through a Hilbert Transform approach, adapting in real-time to identify overbought and oversold conditions with improved accuracy. With built-in divergence detection, trend analysis, and customizable smoothing, this tool is perfect for traders looking to refine their entries and exits based on adaptive oscillation mechanics.
🚀 Key Features :
🔹 Adaptive Frequency Detection – Uses Hilbert Transform principles to dynamically determine market cycle length for precise oscillator calculation.
⚙️ Customizable Smoothing – Option to apply a Hull Moving Average (HMA) for enhanced signal clarity.
📈 Divergence Detection – Identifies bullish and bearish divergences with visual markers, helping traders spot early trend reversals.
🟢 Overbought & Oversold Signals – Highlights extreme momentum conditions with adjustable thresholds.
🔔 Real-Time Alerts – Get notified for crossovers, divergences, and strong trend shifts directly on your TradingView chart.
🎨 Fully Customizable Appearance – Modify colors, divergence sensitivity, and smoothing options to fit your trading style.
🛠 How to Use :
Add the Adaptive Resonance Oscillator to your TradingView chart by clicking the ★ to favorite it.
Monitor the Charts , switch between smoothed and I smoothed modes to identify trend and price swings, use divergences and reversal signals for potential entry/exits.
Set alerts for bullish/bearish crossovers and divergence signals to stay ahead of market moves.
⚙ How It Works :
The indicator begins by applying a Hilbert Transform frequency estimation to the price series, identifying the dominant market cycle length. This is used to calculate a period for the RSI that matches its resonant frequency with the dominant market frequency, dynamically adjusting the Oscillator. The oscillator then applies an optional Hull Moving Average (HMA) smoothing for signal refinement. Additionally, the indicator scans for bullish and bearish divergences by comparing oscillator movements against price action, plotting signals accordingly. When overbought/oversold conditions or divergence events occur, alerts are triggered to notify the trader in real time.

Arpeet MACDOverview
This strategy is based on the zero-lag version of the MACD (Moving Average Convergence Divergence) indicator, which captures short-term trends by quickly responding to price changes, enabling high-frequency trading. The strategy uses two moving averages with different periods (fast and slow lines) to construct the MACD indicator and introduces a zero-lag algorithm to eliminate the delay between the indicator and the price, improving the timeliness of signals. Additionally, the crossover of the signal line and the MACD line is used as buy and sell signals, and alerts are set up to help traders seize trading opportunities in a timely manner.
Strategy Principle
Calculate the EMA (Exponential Moving Average) or SMA (Simple Moving Average) of the fast line (default 12 periods) and slow line (default 26 periods).
Use the zero-lag algorithm to double-smooth the fast and slow lines, eliminating the delay between the indicator and the price.
The MACD line is formed by the difference between the zero-lag fast line and the zero-lag slow line.
The signal line is formed by the EMA (default 9 periods) or SMA of the MACD line.
The MACD histogram is formed by the difference between the MACD line and the signal line, with blue representing positive values and red representing negative values.
When the MACD line crosses the signal line from below and the crossover point is below the zero axis, a buy signal (blue dot) is generated.
When the MACD line crosses the signal line from above and the crossover point is above the zero axis, a sell signal (red dot) is generated.
The strategy automatically places orders based on the buy and sell signals and triggers corresponding alerts.
Advantage Analysis
The zero-lag algorithm effectively eliminates the delay between the indicator and the price, improving the timeliness and accuracy of signals.
The design of dual moving averages can better capture market trends and adapt to different market environments.
The MACD histogram intuitively reflects the comparison of bullish and bearish forces, assisting in trading decisions.
The automatic order placement and alert functions make it convenient for traders to seize trading opportunities in a timely manner, improving trading efficiency.
Risk Analysis
In volatile markets, frequent crossover signals may lead to overtrading and losses.
Improper parameter settings may cause signal distortion and affect strategy performance.
The strategy relies on historical data for calculations and has poor adaptability to sudden events and black swan events.
Optimization Direction
Introduce trend confirmation indicators, such as ADX, to filter out false signals in volatile markets.
Optimize parameters to find the best combination of fast and slow line periods and signal line periods, improving strategy stability.
Combine other technical indicators or fundamental factors to construct a multi-factor model, improving risk-adjusted returns of the strategy.
Introduce stop-loss and take-profit mechanisms to control single-trade risk.
Summary
The MACD Dual Crossover Zero Lag Trading Strategy achieves high-frequency trading by quickly responding to price changes and capturing short-term trends. The zero-lag algorithm and dual moving average design improve the timeliness and accuracy of signals. The strategy has certain advantages, such as intuitive signals and convenient operation, but also faces risks such as overtrading and parameter sensitivity. In the future, the strategy can be optimized by introducing trend confirmation indicators, parameter optimization, multi-factor models, etc., to improve the robustness and profitability of the strategy.

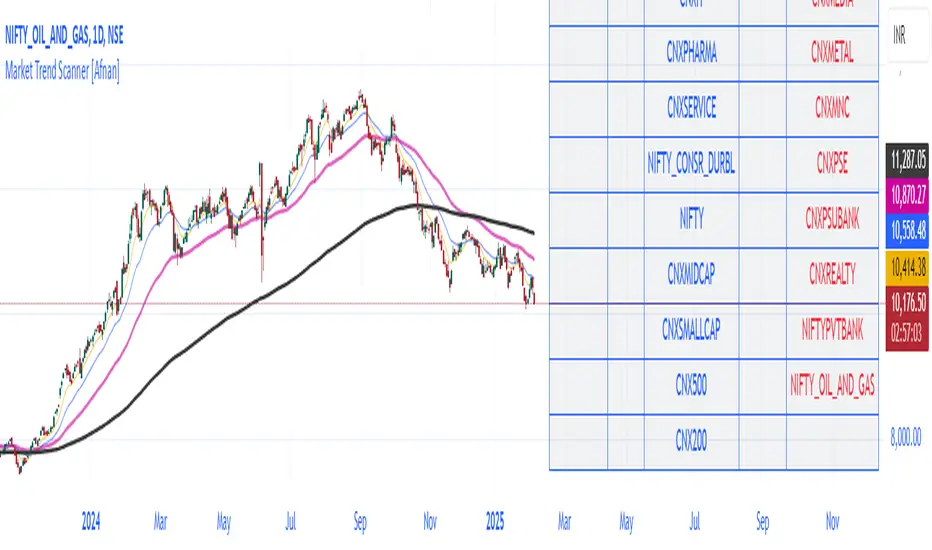
Market Trend Scanner [Afnan]This Market Strength Scanner indicator is designed to provide traders with a clear and concise overview of market trends using a single table. It helps you quickly determine which sectors and indices are strong, weak, or choppy, allowing you to make informed trading decisions with ease.
How This Indicator Helps You:
✅ Identify Strong Sectors & Indices
🔹By analyzing this table, you can instantly see which sectors and indices are performing well.
🔹Focus on stocks within strong sectors to find high-probability buying opportunities.
✅ Avoid Weak or Choppy Markets
🔹The indicator highlights bearish or consolidating sectors, helping you avoid poor trading conditions.
🔹Stay away from sectors that are weak or moving sideways to reduce unnecessary risks.
✅ Understand Market Sentiment in Seconds
🔹If most sectors are bullish, the market is in an uptrend—giving you confidence to take long positions.
🔹If the majority are bearish, the market is weak, signaling caution.
🔹A mix of bullish and bearish sectors indicates a choppy market, warning you to avoid trading or adjust your strategy.
✅ Powered by 4 Customizable EMAs
🔹The indicator uses 4 Exponential Moving Averages (EMAs) to determine trends for each sector and index.
🔹These EMAs are fully modifiable, allowing you to adjust them based on your preferred strategy.
✅ Covers 25 Major Indices (Fully Customizable)
🔹By default, the indicator tracks 25 key indices, giving you a broad market perspective.
🔹You can customize the list to focus on the indices that matter most to you.
Why Use This Indicator?
🔹 Saves Time – No need to analyze multiple charts manually. The table gives you everything at a glance.
🔹 Improves Trade Selection – Focus only on strong sectors for better trade accuracy.
🔹 Works in All Market Conditions – Whether the market is trending or consolidating, this tool keeps you informed.
🔹 Fully Customizable – Adjust the EMAs and indices according to your trading preferences.
With just this one powerful indicator, you get a complete market overview, helping you align your trades with the current trend effortlessly! 🚀
High-Probability IndicatorExplanation of the Code
Trend Filter (EMA):
A 50-period Exponential Moving Average (EMA) is used to determine the overall trend.
trendUp is true when the price is above the EMA.
trendDown is true when the price is below the EMA.
Momentum Filter (RSI):
A 14-period RSI is used to identify overbought and oversold conditions.
oversold is true when RSI ≤ 30.
overbought is true when RSI ≥ 70.
Volatility Filter (ATR):
A 14-period Average True Range (ATR) is used to measure volatility.
ATR is multiplied by a user-defined multiplier (default: 2.0) to set a volatility threshold.
Ensures trades are only taken during periods of sufficient volatility.
Entry Conditions:
Long Entry: Price is above the EMA (uptrend), RSI is oversold, and the candle range exceeds the ATR threshold.
Short Entry: Price is below the EMA (downtrend), RSI is overbought, and the candle range exceeds the ATR threshold.
Exit Conditions:
Take Profit: A fixed percentage above/below the entry price.
Stop Loss: A fixed percentage below/above the entry price.
Visualization:
The EMA is plotted on the chart.
Background colors highlight uptrends and downtrends.
Buy and sell signals are displayed as labels on the chart.
Alerts:
Alerts are triggered for buy and sell signals.
How to Use the Indicator
Trend Filter:
Only take trades in the direction of the trend (e.g., long in an uptrend, short in a downtrend).
Momentum Filter:
Look for oversold conditions in an uptrend for long entries.
Look for overbought conditions in a downtrend for short entries.
Volatility Filter:
Ensure the candle range exceeds the ATR threshold to avoid low-volatility trades.
Risk Management:
Use the built-in take profit and stop loss levels to manage risk.
Optimization Tips
Backtesting:
Test the indicator on multiple timeframes and assets to evaluate its performance.
Adjust the input parameters (e.g., EMA length, RSI length, ATR multiplier) to optimize for specific markets.
Combination with Other Strategies:
Add additional filters, such as volume analysis or support/resistance levels, to improve accuracy.
Risk Management:
Use proper position sizing and risk-reward ratios to maximize profitability.
Disclaimer
No indicator can guarantee an 85% win ratio due to the inherent unpredictability of financial markets. This script is provided for educational purposes only. Always conduct thorough backtesting and paper trading before using any strategy in live trading.
Let me know if you need further assistance or enhancements!

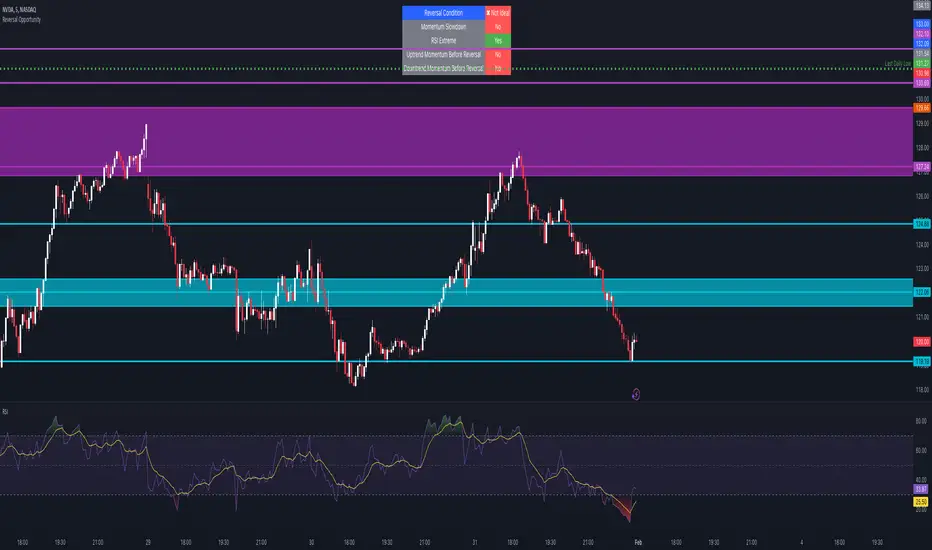
Reversal Opportunity📌 Indicator Description – Reversal Opportunity 🎯
🔍 General Overview
The Reversal Opportunity indicator is designed to identify ideal conditions for Reversal Trading, but it does not provide trade entry signals. Instead, it helps traders determine whether the market conditions are favorable for a potential reversal.
It is specifically designed for traders who execute Reversal trades (Long or Short) and want a clear indication of whether the market is currently suitable for such setups.
💡 What does this indicator do?
- Identifies strong momentum before a reversal (a sharp upward or downward move).
- Detects momentum slowdown (decreasing volume and smaller candles).
- Checks if the RSI is at an extreme level (above 70 or below 30), indicating potential overbought or oversold conditions.
- Displays a table at the top center of the screen with the following key data:
- Are the conditions for a reversal met?
- Is there a slowdown in momentum?
- Is RSI at an extreme level?
- Was there strong uptrend momentum before a possible Short Reversal?
- Was there strong downtrend momentum before a possible Long Reversal?
⚙️ How Does the Indicator Work?
The indicator displays a table in the center of the screen, updating every 5 candles to indicate whether the market conditions are ideal for a reversal trade.
📊 Main Status Row:
- ✔ Ideal Reversal Setup → Conditions for a reversal trade are met (not a trade recommendation).
- ✖ Not Ideal → Reversal conditions are not met; it may be better to wait.
📌 Key Criteria Displayed in the Table:
1. ⚠️ Momentum Slowdown
- Yes → Momentum is weakening (a good sign for reversal trades).
- No → The market is still moving strongly, and a reversal might not be ready yet.
2. 📈 RSI Extreme
- Yes → RSI is above 70 (overbought) or below 30 (oversold), indicating a potential reversal.
- No → RSI is still in a normal range, suggesting that waiting for further confirmation might be wise.
3. 📊 Uptrend Momentum Before Reversal
- Yes → There was a strong uptrend over multiple consecutive candles, potentially setting up for a Short Reversal.
- No → No strong upward momentum was detected, meaning conditions for a Short Reversal may not be ideal.
4. 📉 Downtrend Momentum Before Reversal
- Yes → There was a strong downtrend over multiple consecutive candles, potentially setting up for a Long Reversal.
- No → No strong downward momentum was detected, meaning conditions for a Long Reversal may not be ideal.
🛠️ How to Use the Indicator?
- If "✔ Ideal Reversal Setup" appears, there is a high probability of a market reversal – use your personal entry strategy for further confirmation.
- If Momentum Slowdown = Yes, RSI Extreme = Yes, and strong momentum occurred beforehand, this is an ideal setup for a reversal trade.
- If any conditions are missing ("No"), it may be better to wait for further confirmation instead of entering too early.
- The indicator does NOT provide trade entries! Use your existing trading system for confirmation before entering a trade.
👥 Who Is This Indicator For?
- Reversal traders (entering against the current trend after a strong move).
- Intraday traders looking for reversal trades at extreme market levels.
- Technical traders who rely on Price Action and Volume for trade setups.
⚠️ Disclaimer:
This indicator does not recommend trade entries but provides insight into market conditions. The trader is responsible for risk management and decision-making.
It is best used in combination with additional confirmations such as reversal candles, Order Flow, Bookmap, or Volume Profile to improve accuracy.
🚀 The indicator is ready to use – add it to TradingView and get instant feedback on whether the market is ideal for a Reversal trade!
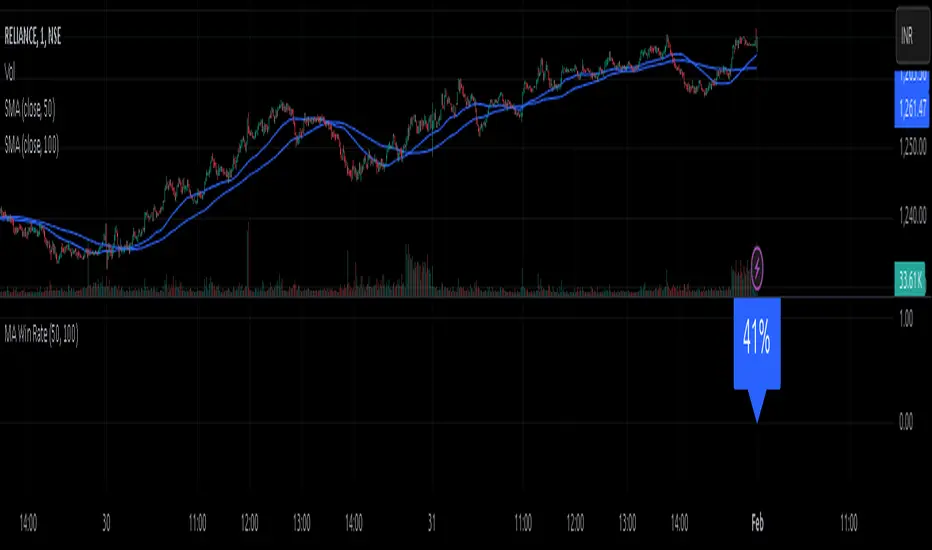
MA Win RateMoving Average Cross Win Rate
This simple yet useful script calculates the percentage of times a moving average crossover successfully predicts price movement.
Win Conditions:
1] A Golden Cross (fast MA crossing above slow MA) where the price moves up afterward.
2] A Death Cross (fast MA crossing below slow MA) where the price moves down afterward.
In this script, I have used a Simple Moving Average (SMA) for illustration.
You can modify the code to apply any type of moving average and test its accuracy.
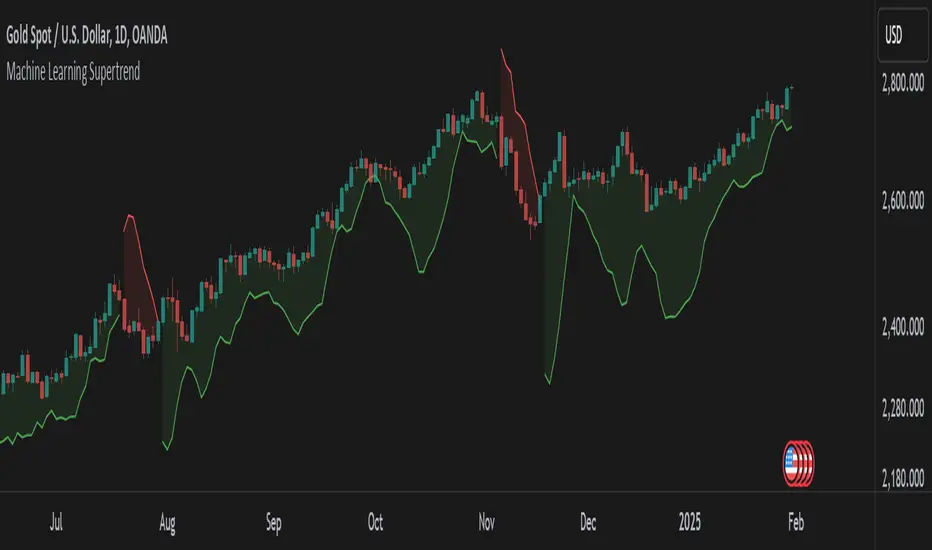
Machine Learning SupertrendThe Machine Learning Supertrend is an advanced trend-following indicator that enhances the traditional Supertrend with Gaussian Process Regression (GPR) and kernel-based learning. Unlike conventional methods that rely purely on historical ATR values, this indicator integrates machine learning techniques to dynamically estimate volatility and forecast future price movements, resulting in a more adaptive and robust trend detection system.
At the core of this indicator lies Gaussian Process Regression (GPR), which utilizes a Radial Basis Function (RBF) kernel to model price distributions and anticipate future trends. Instead of simply looking at past price action, it constructs a kernel matrix, enabling a probabilistic approach to price forecasting. This allows the indicator to not only detect current trends but also project potential trend reversals with greater accuracy.
By applying machine learning to ATR estimation, the ML Supertrend dynamically adjusts its thresholds based on predicted values rather than a fixed multiplier. This makes the trend signals more responsive to market conditions, reducing false signals and minimizing whipsaws often seen with traditional Supertrend indicators. The upper and lower bands are no longer static but evolve based on the underlying price structure, improving the reliability of trend shifts.
When the price crosses these adaptive levels, the indicator detects a trend change and plots it accordingly. Green signifies a bullish trend, while red indicates a bearish one. Alerts can also be triggered when the trend shifts, allowing traders to react quickly to potential reversals.
What makes this approach powerful is its ability to adapt to different market conditions. Traditional ATR-based methods use fixed parameters that might not always be optimal, whereas this ML-driven Supertrend continuously refines its estimations based on real-time data. The result is a more intelligent, less lagging, and highly adaptive trend-following tool.
This indicator is particularly useful for traders looking to enhance trend-following strategies with AI-driven insights. It reduces noise, improves signal reliability, and even offers a degree of trend forecasting, making it ideal for those who want a more advanced and dynamic alternative to standard Supertrend indicators.
This indicator is provided for educational and informational purposes only. It does not constitute financial advice, and past performance is not indicative of future results. Trading involves risk, and users should conduct their own research and use proper risk management before making investment decisions.
Johnny's Volatility-Driven Trend Identifier w/ Reversal SignalsJohnny's Volatility-Driven Trend Identifier w/ Reversal Signals is designed to identify high-probability trend shifts and reversals by incorporating volatility, momentum, and impulse-based filtering. It is specifically built for traders who want to capture strong trend movements while minimizing false signals caused by low volatility noise.
By leveraging Rate of Change (ROC), Relative Strength Index (RSI), and Average True Range (ATR)-based volatility detection, the indicator dynamically adapts to market conditions. It highlights breakout trends, reversals, and early signs of momentum shifts using strategically placed labels and color-coded trend visualization.
Inspiration taken from Top G indicator .
What This Indicator Does
The Volatility-Driven Trend Identifier works by:
Measuring Market Extremes & Momentum:
Uses ROC normalization with standard deviation to identify impulse moves in price action.
Implements RSI filtering to determine overbought/oversold conditions that validate trend strength.
Utilizes ATR-based volatility tracking to ensure signals only appear when meaningful market movements are occurring.
Identifying Key Trend Events:
Power Peak (🔥): Marks a confirmed strong downtrend, ideal for shorting opportunities.
Surge (🚀): Indicates a confirmed strong uptrend, signaling a potential long entry.
Soft Surge (↗): Highlights a mild bullish reentry or early uptrend formation.
Soft Peak (↘): Shows a mild bearish reentry or early downtrend formation.
Providing Adaptive Filtering for Reliable Signals:
Filters out weak trends with a volatility check, ensuring signals appear only in strong market conditions.
Implements multi-level confirmation by combining trend strength metrics, preventing false breakouts.
Uses gradient-based visualization to color-code market sentiment for quick interpretation.
What This Indicator Signals
Breakouts & Impulse Moves: 🚀🔥
The Surge (🚀) and Power Peak (🔥) labels indicate confirmed momentum breakouts, where the trend has been validated by a combination of ROC impulse, RSI confirmation, and ATR volatility filtering.
These signals suggest that the market is entering a strong trend, and traders can align their entries accordingly.
Early Trend Formation & Reentries: ↗ ↘
The Soft Surge (↗) and Soft Peak (↘) labels indicate areas where a trend might be forming, but is not yet fully confirmed.
These signals help traders anticipate potential entries before the trend gains full strength.
Volatility-Adaptive Trend Filtering: 📊
Since the indicator only activates in volatile conditions, it avoids the pitfalls of low-range choppy markets where false signals frequently occur.
ATR-driven adaptive windowing allows the indicator to dynamically adjust its sensitivity based on real-time volatility conditions.
How to Use This Indicator
1. Identifying High-Probability Entries
Bullish Entries (Long Trades)
Look for 🚀 Surge signals in an uptrend.
Confirm with RSI (should be above 50 for momentum).
Ensure volatility is increasing to validate the breakout.
Use ↗ Soft Surge signals for early entries before the trend fully confirms.
Bearish Entries (Short Trades)
Look for 🔥 Power Peak signals in a downtrend.
RSI should be below 50, indicating downward momentum.
Volatility should be rising, ensuring market momentum is strong.
Use ↘ Soft Peak signals for early entries before a full bearish confirmation.
2. Avoiding False Signals
Ignore signals when the market is ranging (low ATR).
Check RSI and ROC alignment to ensure trend confirmation.
Use additional confluences (e.g., price action, support/resistance levels, moving averages) for enhanced accuracy.
3. Trend Confirmation & Filtering
The stronger the trend, the higher the likelihood that Surge (🚀) and Power Peak (🔥) signals will continue in their direction.
Soft Surge (↗) and Soft Peak (↘) act as early warning signals before major breakouts occur.
What Makes This a Machine Learning-Inspired Moving Average?
While this indicator is not a direct implementation of machine learning (as Pine Script lacks AI/ML capabilities), it mimics machine learning principles by adapting dynamically to market conditions using the following techniques:
Adaptive Trend Selection:
It does not rely on fixed moving averages but instead adapts dynamically based on volatility expansion and momentum detection.
ATR-based filtering adjusts the indicator’s sensitivity to real-time conditions.
Multi-Factor Confirmation (Feature Engineering Equivalent in ML):
Combines ROC, RSI, and ATR in a structured way, similar to how ML models use multiple inputs to filter and classify data.
Implements conditional trend recognition, ensuring that only valid signals pass through the filter.
Noise Reduction with Data Smoothing:
The algorithm avoids false signals by incorporating trend intensity thresholds, much like how ML models remove outliers to refine predictions.
Adaptive filtering ensures that low-volatility environments do not produce misleading signals.
Why Use This Indicator?
✔ Reduces False Signals: Multi-factor validation ensures only high-confidence signals are triggered.
✔ Works in All Market Conditions: Volatility-adaptive nature allows the indicator to perform well in both trending and ranging markets.
✔ Great for Swing & Intraday Trading: It helps spot momentum shifts early and allows traders to catch major market moves before they fully develop.
✔ Visually Intuitive: Color-coded trends and clear signal markers make it easy to interpret.

PlanDeFi: Adaptive Trend Ribbons [ATR+RSI]#### **Overview**
The **Crypto Half-Trend Pro ** is a trend-following indicator designed to identify bullish and bearish market conditions using a combination of **moving averages, volatility adjustments, and dynamic ATR bands**. This enhanced version improves on the traditional Half-Trend system by incorporating **EMA smoothing, volatility-based adjustments, and additional fakeout/reversal detection mechanisms**.
#### **Key Features**
✅ **Trend Detection:**
- Uses a combination of fast and slow moving averages (EMA/SMA) to determine trend direction.
- Implements **Hull Moving Average (HMA)** smoothing for better trend visualization.
✅ **Dynamic ATR Bands:**
- Adjusts bands based on market volatility using **RSI-based ATR multipliers**.
- Helps identify potential **breakouts and trend reversals**.
✅ **Fakeout & Reversal Detection:**
- Detects potential **fake breakouts** by analyzing price action against extended ATR bands.
- Identifies **early reversal signals** using price crossovers and volume confirmation.
✅ **Customizable Alerts & Visuals:**
- Built-in **buy & sell signals** for trend confirmation.
- Color-coded bullish/bearish trend lines and **fakeout warnings**.
- **TradingView alerts** for trend shifts and reversals.
#### **How It Works**
🔹 The indicator calculates a **smoothed trend line** using a Hull Moving Average on dynamic price levels.
🔹 ATR bands expand/contract dynamically based on **market volatility** to improve signal accuracy.
🔹 Trend direction is confirmed when price crosses the trend line **with volume confirmation**.
🔹 **Fakeouts** are detected when price temporarily exceeds extended bands but fails to hold momentum.
🔹 **Reversal signals** are generated when price breaks back into the ATR zone with volume spikes.
#### **How to Use It**
- 📈 **Buy Signal:** When price breaks above the trend line, confirmed by volume and crossover signals.
- 📉 **Sell Signal:** When price breaks below the trend line with confirmed bearish conditions.
- 🚨 **Reversal Warning:** If price sharply re-enters the ATR zone with volume confirmation, expect a potential trend shift.
- 🛑 **Fakeout Alert:** If price temporarily breaks resistance but closes back inside, it may be a false move.
#### **Ideal For**
✔️ Crypto & Forex traders looking for **dynamic trend signals**
✔️ Swing traders wanting to **avoid fakeouts & catch reversals**
✔️ Traders seeking a **customizable, volatility-adjusted trend system**
🚀 **Try PlanDeFi: Adaptive Trend Ribbons today and improve your trend analysis!**

TrendMasterPro_FekonomiTrend Change and Start Signals with Weighted Conditions
The Trend Change and Start Signals with Weighted Conditions indicator leverages various technical analysis tools to generate reliable buy and sell signals. This indicator helps investors more accurately identify trend changes and start signals in the market.
Features:
Utilizes popular technical analysis tools such as MACD, RSI, EMA, and Ichimoku Cloud.
Enhances signal accuracy with additional indicators like ADX and Volume Increase.
Allows users to adjust the weights of each condition to set their importance.
The Confidence Level parameter lets you adjust the accuracy rate of the signals.
Visual Signals make it easy to track buy and sell points directly on the chart.
How It Works:
Condition Weights: Users assign weights to indicators like MACD, RSI, EMA, and Ichimoku Cloud. If you have no idea, use default settings.
Condition Fulfillment: Checks if the conditions for each indicator are met.
Confidence Level: The total weight of the fulfilled conditions must exceed the user-defined confidence level.
Signal Generation: When these conditions are met, a buy or sell signal is generated and visually displayed on the chart.
Customization:
Personalize Signals: By adjusting the weights of the indicators used, you can personalize the signals to match your trading strategy and preferences.
Use Cases:
Short-Term Investments: Identify quick trend changes for short-term trading decisions.
Long-Term Investments: Detect long-term trend starts and changes for strategic investment decisions.
Technical Analysis: Combine different technical analysis tools for more comprehensive and reliable analyses.
With this indicator, you can better understand market movements and make more informed investment decisions. Try it now and enhance your trading strategy!
by Fekonomi

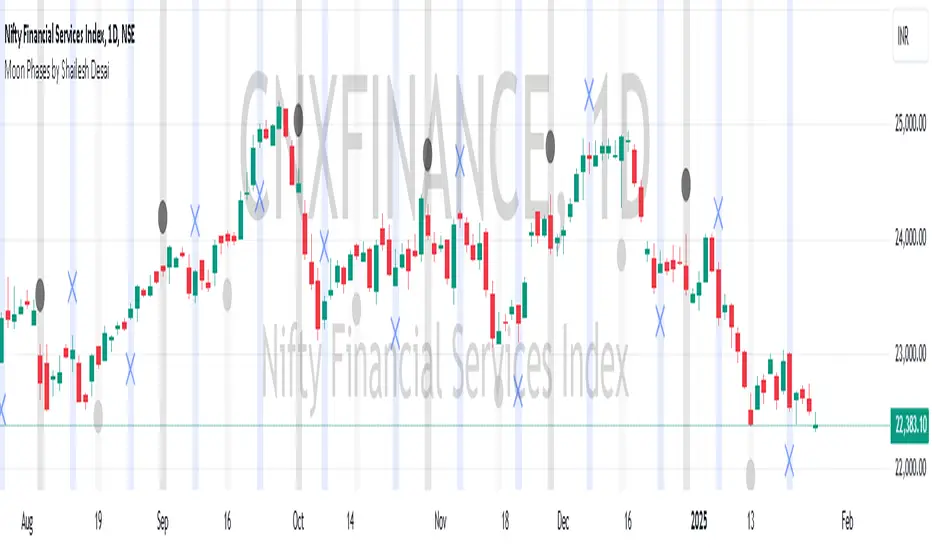
Moon Phases by Shailesh DesaiTrading Strategy Based on Lunar Phases
This custom trading indicator leverages the power of lunar cycles to provide unique market insights based on the four primary moon phases: New Moon, First Quarter, Full Moon, and Third Quarter. By aligning your trades with the natural rhythm of the moon, this strategy offers a different perspective to trading and can help enhance decision-making based on the cyclical nature of the market.
Key Features:
1. Moon Phase Identification:
o The indicator automatically identifies the current moon phase based on the user's selected timeframe and marks it on the chart.
o Each phase is visualized with a specific symbol and color to help traders easily recognize the current moon phase:
New Moon/Waxing Moon: Represented by a circle (colored as per user input).
First Quarter: Represented by a cross (colored as per user input).
Full Moon/Waning Moon: Represented by a circle (colored as per user input).
Third Quarter: Represented by a cross (colored as per user input).
2. Automatic Moon Phase Transition Detection:
o The indicator tracks and highlights when a phase change occurs. This feature ensures you are always aware of when the market moves from one phase to another.
o Moon phase changes are only visualized on the first bar of each new phase to avoid cluttering the chart.
3. Background Color Indicators:
o The background color dynamically changes according to the current moon phase, helping to reinforce the phase context for the trader. This feature makes it easy to see at a glance which phase the market is in.
4. Customizable Appearance:
o Customize the color of each moon phase to suit your preferences. Adjust the colors for the New Moon, First Quarter, Full Moon, and Third Quarter to align with your visual strategy.
5. Avoids Unsupported Timeframes:
o This indicator does not support monthly timeframes, ensuring that it operates smoothly only on timeframes that are compatible with the lunar cycle.
How to Use:
• The moon phases are thought to have an influence on human behavior and the market's psychology, making this indicator useful for traders who wish to integrate lunar cycles into their strategy.
• Traders can use the phase changes as an indicator of potential market momentum or reversal points. For example:
o New Moon may indicate the beginning of a new cycle, signaling a potential upward or downward move.
o Full Moon might suggest a peak or significant shift in market direction.
o First Quarter and Third Quarter phases may represent moments of consolidation or decision points.
Ideal for:
• Traders interested in cycle-based strategies or looking to experiment with new approaches.
• Those who believe in the influence of natural forces, including moon phases, on market movements.
• Technical analysts who want to add another layer of insights to their chart analysis.
Important Notes:
• The indicator uses precise astronomical calculations to identify the correct phase, ensuring accuracy.
• It’s important to understand that moon phase-based trading is not a standalone strategy but should ideally be combined with other technical analysis tools for maximum effectiveness.
AllDay Session TimesIndicator: Custom Session Times
This indicator is designed to assist traders by visualizing specific trading session times on the TradingView platform. It highlights two important trading sessions: the Day Session and the Evening Session, providing a visual aid that helps traders navigate the markets with greater accuracy.
Day Session Time Range:
Starts: 10:55 UTC+2
Ends: 13:30 UTC+2
Evening Session Time Range:
Starts: 16:55 UTC+2
Ends: 18:30 UTC+2
How It Works:
Colors and Backgrounds: This indicator uses background colors to differentiate the sessions. The green background appears during the Day Session, while the blue background indicates the Evening Session.
Lines: Session time ranges are also marked with clear lines on the chart, making it easier to identify the specific session periods.
Time Zone: The time zone is set to UTC+2 (Europe/Helsinki), but it can easily be adjusted to match your local time zone.
Why Use This Indicator?
This indicator is especially useful for traders who focus on specific market sessions. For example:
The Day Session might be when the market is more active, and trends are clearer.
The Evening Session could be a good time to observe market adjustments based on the events of the day and find potential trading opportunities.
By visualizing these specific time frames, the indicator helps reduce distractions and enables a more focused approach to trading.
Use Cases:
This indicator is ideal for:
Day traders and swing traders who want to focus on certain market sessions.
Technical analysts who prefer to visualize market behavior within specific time frames.
Strategy optimization and a more precise assessment of market conditions.
Features:
Visual session markers that help traders focus on key trading periods.
Easy customization of time zone and session time ranges.
Background colors and lines that improve chart readability and session tracking.
Made By AllDayEsa

Gufran - Volume DivergenceThis indicator detects bullish and bearish divergences by analyzing price action, volume trends, and RSI (Relative Strength Index) for added confirmation. It highlights key market reversals or trend continuations by identifying when price movement diverges from volume dynamics, providing traders with actionable insights for entry and exit points.
Key Features:
Divergence Detection:
Bullish Divergence: Price makes a lower low, but volume shows higher lows, signaling potential upward reversals.
Bearish Divergence: Price makes a higher high, but volume shows lower highs, signaling potential downward reversals.
RSI Confirmation:
Bullish Signals: Confirmed when RSI is in the oversold zone.
Bearish Signals: Confirmed when RSI is in the overbought zone (optional relaxation of RSI conditions available).
Normalized Volume Analysis:
Volume is scaled to the price range, ensuring clear and meaningful visualization alongside price action.
Customizable Parameters:
Lookback Period: Define how far back the script looks to identify divergences.
Volume Significance: Adjust the threshold for significant volume movements.
RSI Levels: Fine-tune overbought and oversold thresholds for optimal signal accuracy.
Gap Control: Avoid clutter by setting a minimum number of candles between successive divergence signals.
Clear Visual Representation:
Bullish Divergence: Marked with green labels and connecting lines.
Bearish Divergence: Marked with red labels and connecting lines.
Dotted lines show normalized volume divergence, while solid lines indicate price divergence.
Ideal For:
Traders who rely on volume dynamics to validate price movements.
Those looking for an added layer of confidence using RSI to filter false signals.
Swing and intraday traders aiming to identify market reversal zones or continuation patterns.
Customization Options:
Lookback Period: Adjustable range for detecting highs and lows.
Volume Threshold: Define the multiplier for significant volume changes.
RSI Settings: Tailor overbought/oversold levels to suit your trading style.
Relax RSI Condition: Toggle stricter or more flexible conditions for bearish divergences.
How to Use:
Add the indicator to your chart and configure the parameters to fit the asset and timeframe you are trading.
Look for:
Green “Bullish Div” labels near price lows for potential buying opportunities.
Red “Bearish Div” labels near price highs for potential selling opportunities.
Use this indicator in combination with other tools like support/resistance levels, trendlines, or moving averages for a comprehensive trading strategy.
Disclaimer:
This indicator is a tool for educational purposes and should not be used as a standalone trading signal. Always conduct proper risk management and consider additional technical/fundamental analysis before making trading decisions.
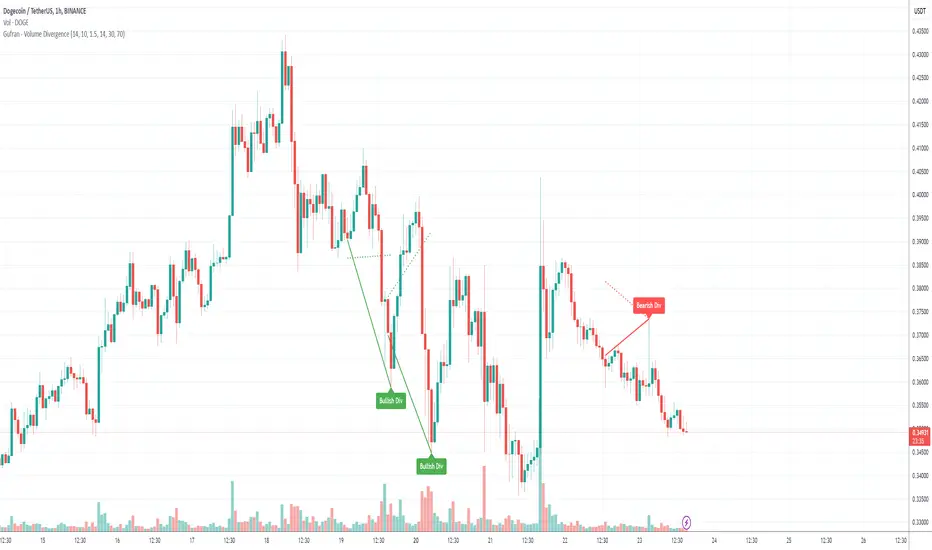
P T Supertrend CustomPT Supertrend Custom Indicator Description
The PT Supertrend Custom indicator is a dual Supertrend-based tool designed to help traders identify market trends and potential reversals with enhanced accuracy. This custom indicator plots two Supertrend lines with different ATR (Average True Range) lengths and multipliers, providing a broader perspective on price movements across varying market conditions.
Key Features:
1. Dual Supertrend Lines:
- The indicator calculates two separate Supertrend values using customizable ATR lengths (default: 7 and 21) and factors (default: 3.0 for both).
- This dual-layered approach helps identify both short-term and long-term trends for better decision-making.
2. Customizable Parameters:
- ATR Length (ATR Length & ATR Length2): Determines the lookback period for volatility calculation.
- Factor (Factor & Factor2): Defines the multiplier for the ATR, controlling the sensitivity of the Supertrend lines.
3. Visual Trend Representation:
- Green and red line plots represent uptrends and downtrends, respectively.
- The indicator overlays on the price chart, offering a clear visual representation of trend direction.
- Trend fill areas provide additional clarity, with green shading for uptrends and red shading for downtrends.
4. Dynamic Trend Shifts:
- The indicator adapts dynamically based on price action, switching from an uptrend to a downtrend and vice versa when conditions change.
- Two independent trend signals allow traders to compare short-term and long-term trend confirmations.
5. Overlay on Price Chart:
- The indicator is plotted directly on the price chart for easy visualization without cluttering the workspace.
How to Use:
- Trend Identification:
- A green Supertrend line below price indicates an uptrend.
- A red Supertrend line above price signals a downtrend.
- When both Supertrends align, it indicates a strong trend; divergence may signal potential reversals.
- Entry & Exit Signals:
- Consider long positions when both Supertrend lines turn green.
- Consider short positions when both Supertrend lines turn red.
- Use the shorter ATR period for quicker entries and exits, while the longer ATR period provides confirmation.
- Risk Management:
- The Supertrend lines can serve as dynamic support/resistance levels for placing stop-loss orders.
Best Used In:
- Trend-following strategies
- Swing trading and day trading
- Volatile markets where ATR-based signals are effective
This indicator provides a comprehensive view of market trends by combining short- and long-term trend filters, making it a valuable tool for traders seeking precision and clarity in their trading decisions.
Created by Prince Thomas
