Bullish Reversal Bar Strategy [Skyrexio]Overview
Bullish Reversal Bar Strategy leverages the combination of candlestick pattern Bullish Reversal Bar (description in Methodology and Justification of Methodology), Williams Alligator indicator and Williams Fractals to create the high probability setups. Candlestick pattern is used for the entering into trade, while the combination of Williams Alligator and Fractals is used for the trend approximation as close condition. Strategy uses only long trades.
Unique Features
No fixed stop-loss and take profit: Instead of fixed stop-loss level strategy utilizes technical condition obtained by Fractals and Alligator or the candlestick pattern invalidation to identify when current uptrend is likely to be over (more information in "Methodology" and "Justification of Methodology" paragraphs)
Configurable Trading Periods: Users can tailor the strategy to specific market windows, adapting to different market conditions.
Trend Trade Filter: strategy uses Alligator and Fractal combination as high probability trend filter.
Methodology
The strategy opens long trade when the following price met the conditions:
1.Current candle's high shall be below the Williams Alligator's lines (Jaw, Lips, Teeth)(all details in "Justification of Methodology" paragraph)
2.Price shall create the candlestick pattern "Bullish Reversal Bar". Optionally if MFI and AO filters are enabled current candle shall have the decreasing AO and at least one of three recent bars shall have the squat state on the MFI (all details in "Justification of Methodology" paragraph)
3.If price breaks through the high of the candle marked as the "Bullish Reversal Bar" the long trade is open at the price one tick above the candle's high
4.Initial stop loss is placed at the Bullish Reversal Bar's candle's low
5.If price hit the Bullish Reversal Bar's low before hitting the entry price potential trade is cancelled
6.If trade is active and initial stop loss has not been hit, trade is closed when the combination of Alligator and Williams Fractals shall consider current trend change from upward to downward.
Strategy settings
In the inputs window user can setup strategy setting:
Enable MFI (if true trades are filtered using Market Facilitation Index (MFI) condition all details in "Justification of Methodology" paragraph), by default = false)
Enable AO (if true trades are filtered using Awesome Oscillator (AO) condition all details in "Justification of Methodology" paragraph), by default = false)
Justification of Methodology
Let's explore the key concepts of this strategy and understand how they work together. The first and key concept is the Bullish Reversal Bar candlestick pattern. This is just the single bar pattern. The rules are simple:
Candle shall be closed in it's upper half
High of this candle shall be below all three Alligator's lines (Jaw, Lips, Teeth)
Next, let’s discuss the short-term trend filter, which combines the Williams Alligator and Williams Fractals. Williams Alligator
Developed by Bill Williams, the Alligator is a technical indicator that identifies trends and potential market reversals. It consists of three smoothed moving averages:
Jaw (Blue Line): The slowest of the three, based on a 13-period smoothed moving average shifted 8 bars ahead.
Teeth (Red Line): The medium-speed line, derived from an 8-period smoothed moving average shifted 5 bars forward.
Lips (Green Line): The fastest line, calculated using a 5-period smoothed moving average shifted 3 bars forward.
When the lines diverge and align in order, the "Alligator" is "awake," signaling a strong trend. When the lines overlap or intertwine, the "Alligator" is "asleep," indicating a range-bound or sideways market. This indicator helps traders determine when to enter or avoid trades.
Fractals, another tool by Bill Williams, help identify potential reversal points on a price chart. A fractal forms over at least five consecutive bars, with the middle bar showing either:
Up Fractal: Occurs when the middle bar has a higher high than the two preceding and two following bars, suggesting a potential downward reversal.
Down Fractal: Happens when the middle bar shows a lower low than the surrounding two bars, hinting at a possible upward reversal.
Traders often use fractals alongside other indicators to confirm trends or reversals, enhancing decision-making accuracy.
How do these tools work together in this strategy? Let’s consider an example of an uptrend.
When the price breaks above an up fractal, it signals a potential bullish trend. This occurs because the up fractal represents a shift in market behavior, where a temporary high was formed due to selling pressure. If the price revisits this level and breaks through, it suggests the market sentiment has turned bullish.
The breakout must occur above the Alligator’s teeth line to confirm the trend. A breakout below the teeth is considered invalid, and the downtrend might still persist. Conversely, in a downtrend, the same logic applies with down fractals.
How we can use all these indicators in this strategy? This strategy is a counter trend one. Candle's high shall be below all Alligator's lines. During this market stage the bullish reversal bar candlestick pattern shall be printed. This bar during the downtrend is a high probability setup for the potential reversal to the upside: bulls were able to close the price in the upper half of a candle. The breaking of its high is a high probability signal that trend change is confirmed and script opens long trade. If market continues going down and break down the bullish reversal bar's low potential trend change has been invalidated and strategy close long trade.
If market really reversed and started moving to the upside strategy waits for the trend change form the downtrend to the uptrend according to approximation of Alligator and Fractals combination. If this change happens strategy close the trade. This approach helps to stay in the long trade while the uptrend continuation is likely and close it if there is a high probability of the uptrend finish.
Optionally users can enable MFI and AO filters. First of all, let's briefly explain what are these two indicators. The Awesome Oscillator (AO), created by Bill Williams, is a momentum-based indicator that evaluates market momentum by comparing recent price activity to a broader historical context. It assists traders in identifying potential trend reversals and gauging trend strength.
AO = SMA5(Median Price) − SMA34(Median Price)
where:
Median Price = (High + Low) / 2
SMA5 = 5-period Simple Moving Average of the Median Price
SMA 34 = 34-period Simple Moving Average of the Median Price
This indicator is filtering signals in the following way: if current AO bar is decreasing this candle can be interpreted as a bullish reversal bar. This logic is applicable because initially this strategy is a trend reversal, it is searching for the high probability setup against the current trend. Decreasing AO is the additional high probability filter of a downtrend.
Let's briefly look what is MFI. The Market Facilitation Index (MFI) is a technical indicator that measures the price movement per unit of volume, helping traders gauge the efficiency of price movement in relation to trading volume. Here's how you can calculate it:
MFI = (High−Low)/Volume
MFI can be used in combination with volume, so we can divide 4 states. Bill Williams introduced these to help traders interpret the interaction between volume and price movement. Here’s a quick summary:
Green Window (Increased MFI & Increased Volume): Indicates strong momentum with both price and volume increasing. Often a sign of trend continuation, as both buying and selling interest are rising.
Fake Window (Increased MFI & Decreased Volume): Shows that price is moving but with lower volume, suggesting weak support for the trend. This can signal a potential end of the current trend.
Squat Window (Decreased MFI & Increased Volume): Shows high volume but little price movement, indicating a tug-of-war between buyers and sellers. This often precedes a breakout as the pressure builds.
Fade Window (Decreased MFI & Decreased Volume): Indicates a lack of interest from both buyers and sellers, leading to lower momentum. This typically happens in range-bound markets and may signal consolidation before a new move.
For our purposes we are interested in squat bars. This is the sign that volume cannot move the price easily. This type of bar increases the probability of trend reversal. In this indicator we added to enable the MFI filter of reversal bars. If potential reversal bar or two preceding bars have squat state this bar can be interpret as a reversal one.
Backtest Results
Operating window: Date range of backtests is 2023.01.01 - 2024.12.31. It is chosen to let the strategy to close all opened positions.
Commission and Slippage: Includes a standard Binance commission of 0.1% and accounts for possible slippage over 5 ticks.
Initial capital: 10000 USDT
Percent of capital used in every trade: 50%
Maximum Single Position Loss: -5.29%
Maximum Single Profit: +29.99%
Net Profit: +5472.66 USDT (+54.73%)
Total Trades: 103 (33.98% win rate)
Profit Factor: 1.634
Maximum Accumulated Loss: 1231.15 USDT (-8.32%)
Average Profit per Trade: 53.13 USDT (+0.94%)
Average Trade Duration: 76 hours
How to Use
Add the script to favorites for easy access.
Apply to the desired timeframe and chart (optimal performance observed on 4h ETH/USDT).
Configure settings using the dropdown choice list in the built-in menu.
Set up alerts to automate strategy positions through web hook with the text: {{strategy.order.alert_message}}
Disclaimer:
Educational and informational tool reflecting Skyrex commitment to informed trading. Past performance does not guarantee future results. Test strategies in a simulated environment before live implementation
These results are obtained with realistic parameters representing trading conditions observed at major exchanges such as Binance and with realistic trading portfolio usage parameters.
Cari dalam skrip untuk "accuracy"

Adaptive Trend Flow Strategy with Filters for SPXThe Adaptive Trend Flow Strategy with Filters for SPX is a complete trading algorithm designed to identify traits and offer actionable alerts for the SPX index. This Pine Script approach leverages superior technical signs and user-described parameters to evolve to marketplace conditions and optimize performance.
Key Features and Functionality
Dynamic Trend Detection: Utilizes a dual EMA-based totally adaptive method for fashion calculation.
The script smooths volatility the usage of an EMA filter and adjusts sensitivity through the sensitivity enter. This allows for real-time adaptability to market fluctuations.
Trend Filters for Precision:
SMA Filter: A Simple Moving Average (SMA) guarantees that trades are achieved best while the rate aligns with the shifting average trend, minimizing false indicators.
MACD Filter: The Moving Average Convergence Divergence (MACD) adds some other layer of confirmation with the aid of requiring alignment among the MACD line and its sign line.
Signal Generation:
Long Signals: Triggered when the fashion transitions from bearish to bullish, with all filters confirming the pass.
Short Signals: Triggered while the trend shifts from bullish to bearish, imparting opportunities for final positions.
User Customization:
Adjustable parameters for EMAs, smoothing duration, and sensitivity make certain the strategy can adapt to numerous buying and selling patterns.
Enable or disable filters (SMA or MACD) based totally on particular market conditions or consumer possibilities.
Leverage and Position Sizing: Incorporates a leverage aspect for dynamic position sizing.
Automatically calculates the exchange length based on account fairness and the leverage element, making sure hazard control is in area.
Visual Enhancements: Plots adaptive fashion ranges (foundation, top, decrease) for actual-time insights into marketplace conditions.
Color-coded bars and heritage to visually represent bullish or bearish developments.
Custom labels indicating crossover and crossunder occasions for clean sign visualization.
Alerts and Automation: Configurable alerts for each lengthy and quick indicators, well matched with automated buying and selling structures like plugpine.Com.
JSON-based alert messages consist of account credentials, motion type, and calculated position length for seamless integration.
Backtesting and Realistic Assumptions: Includes practical slippage, commissions, and preliminary capital settings for backtesting accuracy.
Leverages excessive-frequency trade sampling to make certain strong strategy assessment.
How It Works
Trend Calculation: The method derives a principal trend basis with the aid of combining fast and gradual EMAs. It then uses marketplace volatility to calculate adaptive upper and decrease obstacles, creating a dynamic channel.
Filter Integration: SMA and MACD filters work in tandem with the fashion calculation to ensure that handiest excessive-probability signals are accomplished.
Signal Execution: Signals are generated whilst the charge breaches those dynamic tiers and aligns with the fashion and filters, ensuring sturdy change access situations.
How to Use
Setup: Apply the approach to SPX or other well suited indices.
Adjust person inputs, together with ATR length, EMA smoothing, and sensitivity, to align together with your buying and selling possibilities.
Enable or disable the SMA and MACD filters to test unique setups.
Alerts: Configure signals for computerized notifications or direct buying and selling execution through third-celebration systems.
Use the supplied JSON payload to integrate with broking APIs or automation tools.
Optimization:
Experiment with leverage, filter out settings, and sensitivity to find most effective configurations to your hazard tolerance and marketplace situations.
Considerations and Best Practices
Risk Management: Always backtest the method with realistic parameters, together with conservative leverage and commissions.
Market Suitability: While designed for SPX, this method can adapt to other gadgets by means of adjusting key parameters.
Limitations: The method is trend-following and can underperform in enormously risky or ranging markets. Regularly evaluate and modify parameters primarily based on recent market conduct.
If you have any questions please let me know - I'm here to help!

OBV TSI IndicatorThe OBV TSI Indicator combines two powerful technical analysis tools: the On-Balance Volume (OBV) and the True Strength Index (TSI). This hybrid approach provides insights into both volume dynamics and momentum, helping traders identify potential trend reversals, breakouts, or continuations with greater accuracy.
The OBV TSI Indicator tracks cumulative volume shifts via OBV and integrates the TSI for momentum analysis. It offers customizable moving average options for further smoothing. Visual trendlines, pivot points, and signal markers enhance clarity.
The OBV tracks volume flow by summing volumes based on price changes. Positive volume is added when prices rise, and negative volume is subtracted when prices fall. The result is smoothed to detect meaningful trends in volume. A volume spread is derived from the difference between the smoothed OBV and cumulative volume. This is then adjusted by the price deviation to generate the shadow spread, which highlights critical volume-driven price levels.
The shadow spread is added to either the high or low price, depending on its sign, producing a refined OBV output. This serves as the main source for the subsequent TSI calculation. The TSI is a momentum oscillator calculated using double-smoothed price changes. It provides an accurate measure of trend strength and direction.
Various moving average options, such as EMA, DEMA, or TEMA, are applied to the smoothed OBV for additional trend filtering. Users can select their preferred type and length to suit their trading strategy. Trendlines are plotted to visualize the overall direction. When a significant change in trend is detected, up or down arrows indicate potential buy or sell signals. The script identifies key pivot points based on the highest and lowest levels within a defined period. These pivots help pinpoint reversal zones.
The indicator offers customization options, allowing users to adjust the OBV length for smoothing, choose from various moving average types, and fine-tune the short, long, and signal periods for TSI. Additionally, users can toggle visibility for trendlines, signals, and pivots to suit their preferences.
This indicator is ideal for practical use cases such as spotting potential trend reversals by observing TSI crossovers and pivot levels, anticipating breakouts from key price levels using the shadow spread, and validating trends by aligning TSI signals with OBV and moving averages.
The OBV TSI Indicator is a versatile tool designed to enhance decision-making in trading by combining volume and momentum analysis. Its flexibility and visual aids make it suitable for traders of all experience levels. By leveraging its insights, you can confidently navigate market trends and improve your trading outcomes.

Dual Spectrum RSI [CHE]Dual Spectrum RSI Indicator
Introduction
The Dual Spectrum RSI Indicator is an innovative and robust tool designed for traders aiming to enhance their market analysis and trading precision. This script leverages multi-timeframe analysis, advanced RSI configurations, and customizable visualization options to provide actionable insights for both trend-following and contrarian strategies.
Key Features
1. Dynamic Timeframe Selection
- Automatically adapts the resolution based on the current chart's timeframe.
- Options to switch between Auto Timeframe, Multiplier-based Timeframe, or Manual Resolution for complete control.
2. Advanced RSI Calculations
- Dual RSI setup for multi-layered analysis:
- Primary RSI for trend identification on the higher timeframe (HTF).
- Secondary RSI for entry signals with oversold/overbought crossovers on the current chart timeframe.
3. EMA Integration on Higher Timeframe (HTF)
- The Exponential Moving Average (EMA) acts as a robust trend filter, calculated on the Higher Timeframe (HTF).
- This ensures that trade signals align with the broader market trend, providing a strategic edge and reducing noise from lower timeframes.
4. Signal Clarity
- Visual labels for Buy and Sell signals directly on the chart.
- Dynamic stop-loss suggestions that adjust based on EMA crossovers and trend changes.
5. Customizable Visualization
- Gradient fills for overbought/oversold zones provide intuitive visual cues.
- User-friendly inputs for adjusting separator lines, color schemes, and label styles.
6. Comprehensive Data Display
- Real-time updates in an Info Box, showing active timeframe settings and resolution.
- Easy-to-understand trend conditions, making it accessible for both novice and professional traders.
Benefits for Traders
1. Precision in Decision-Making
The multi-timeframe capability ensures that traders always have the broader market context, minimizing false signals and enhancing trade accuracy.
2. Flexibility and Customization
Fully adjustable parameters allow traders to tailor the indicator to their unique trading style, whether scalping, day trading, or swing trading.
3. Enhanced Market Insights
By combining HTF trend filters, RSI dynamics, and EMA thresholds, this indicator provides a holistic view of market conditions.
4. User-Friendly Interface
The clean layout and intuitive options make it easy to integrate this tool into any TradingView setup.
5. Increased Confidence in Trades
With visual aids such as labels, gradients, and a trend-detection mechanism, traders can make decisions with greater confidence and less emotional bias.
Example Use Cases
1. Trend-Following Strategy
- Utilize the HTF EMA filter to confirm bullish or bearish trends.
- Enter trades when the secondary RSI crosses oversold/overbought levels in the direction of the trend.
2. Reversal Strategy
- Identify overextended trends using RSI crossovers.
- Look for counter-trend opportunities with precise stop-loss placements.
3. Scalping Setup
- Switch to intraday timeframes and use the multiplier-based resolution to capture short-term market movements.
How to Use
1. Add the script to your TradingView chart by pasting the provided Pine Script code into the Pine Editor.
2. Adjust the Timeframe Type, RSI parameters, and EMA length to align with your trading goals.
3. Monitor the generated signals and use them in conjunction with your broader trading strategy.
Disclaimer
The content provided, including all code and materials, is strictly for educational and informational purposes only. It is not intended as, and should not be interpreted as, financial advice, a recommendation to buy or sell any financial instrument, or an offer of any financial product or service. All strategies, tools, and examples discussed are provided for illustrative purposes to demonstrate coding techniques and the functionality of Pine Script within a trading context.
Any results from strategies or tools provided are hypothetical, and past performance is not indicative of future results. Trading and investing involve high risk, including the potential loss of principal, and may not be suitable for all individuals. Before making any trading decisions, please consult with a qualified financial professional to understand the risks involved.
By using this script, you acknowledge and agree that any trading decisions are made solely at your discretion and risk.
Conclusion
The Dual Spectrum RSI Indicator is not just another technical tool—it's a comprehensive trading companion that adapts to your needs, simplifies market analysis, and boosts your trading performance. Whether you're a beginner or a seasoned trader, this indicator provides the edge you need to succeed in today's dynamic markets.
Try It Today!
Experience the power of multi-timeframe analysis and take your trading to the next level. Add the Dual Spectrum RSI Indicator to your TradingView arsenal now!
Best regards
Chervolino

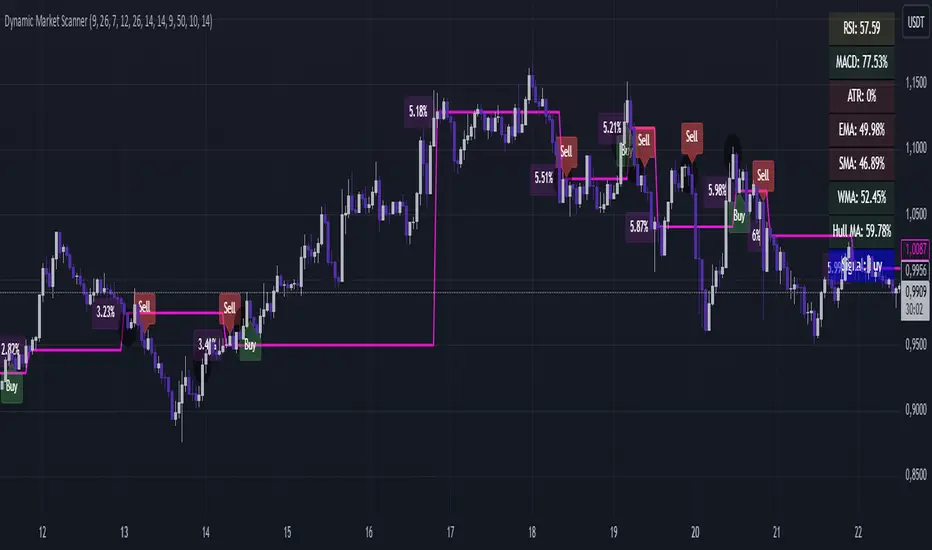
Dynamic Market ScannerDynamic Market Scanner is a powerful tool for analyzing financial markets, combining a variety of indicators to provide clear and understandable signals.
Key Features:
- Signal Generation:
The main signals "Buy", "Sell", and "Hold" are formed based on the analysis of indicators:
- MACD
- RSI
- SMA
- EMA
- WMA
- Hull MA
Additional Analytical Tools:
- ATR is used to assess volatility and helps to understand the risk of the current market situation.
- SMA Ichimoku does not generate signals but is used to assess their accuracy.
- If the price is above the SMA, "Buy" signals are more likely, as this confirms the strength of the upward movement.
- If the price is below the SMA, "Buy" signals require additional confirmations.
Dashboard:
Displays the current price position relative to the indicators, helping the trader understand how strong or weak the current signals are.
Advantages of Using:
1. Signal Filtering:
The price position relative to the SMA Ichimoku helps to assess the likelihood of successful trades.
2. Volatility Analysis:
ATR provides additional information about risks and market fluctuations.
3. Comprehensive Approach:
Signal generation is based on a combination of key indicators, offering a multifaceted view of the market.
Explanation of Percent Calculation in the Table:
- The table shows the values of indicators such as MACD, ATR, EMA, SMA, WMA, and Hull MA in percentages. Percentages are calculated based on the current value of the indicator relative to its maximum and minimum.
- Percentages are displayed for each indicator, allowing traders to assess market conditions based on their current values.
Dynamic Market Scanner will become a reliable assistant in your technical analysis toolkit, providing a comprehensive overview of market conditions and helping to make informed trading decisions.
Binary Options Pro Helper By Himanshu AgnihotryThe Binary Options Pro Helper is a custom indicator designed specifically for one-minute binary options trading. This tool combines technical analysis methods like moving averages, RSI, Bollinger Bands, and pattern recognition to provide precise Buy and Sell signals. It also includes a time-based filter to ensure trades are executed only during optimal market conditions.
Features:
Moving Averages (EMA):
Uses short-term (7-period) and long-term (21-period) EMA crossovers for trend detection.
RSI-Based Signals:
Identifies overbought/oversold conditions for entry points.
Bollinger Bands:
Highlights market volatility and potential reversal zones.
Chart Pattern Recognition:
Detects double tops (sell signals) and double bottoms (buy signals).
Time-Based Filter:
Trades only within specified hours (e.g., 9:30 AM to 11:30 AM) to avoid unnecessary noise.
Visual Signals:
Plots buy and sell markers directly on the chart for ease of use.
How to Use:
Setup:
Add this script to your TradingView chart and select a 1-minute timeframe.
Signal Interpretation:
Buy Signal: Triggered when EMA crossover occurs, RSI is oversold (<30), and a double bottom pattern is detected.
Sell Signal: Triggered when EMA crossover occurs, RSI is overbought (>70), and a double top pattern is detected.
Timing:
Ensure trades are executed only during the specified time window for better accuracy.
Best Practices:
Use this indicator alongside fundamental analysis or market sentiment.
Test it thoroughly with historical data (backtesting) and in a demo account before live trading.
Adjust parameters (e.g., EMA periods, RSI thresholds) based on your trading style.

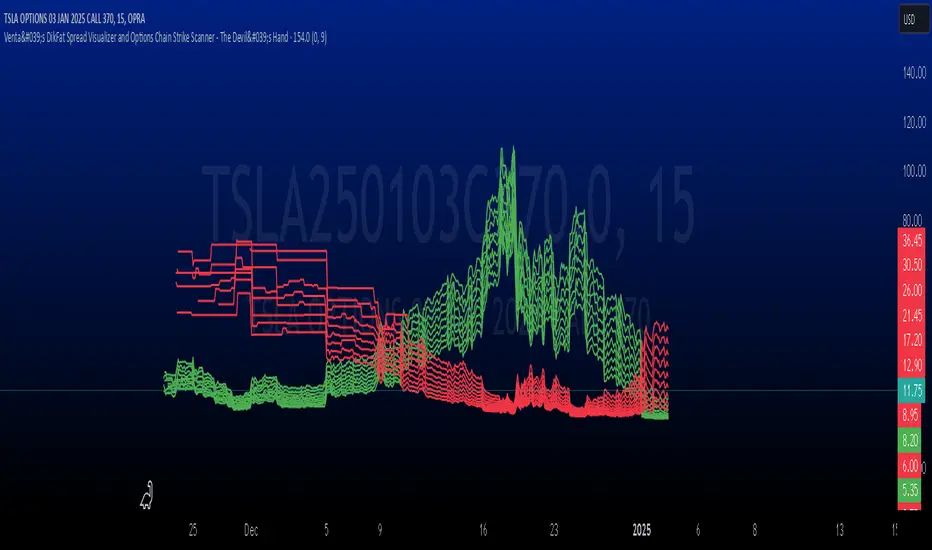
Venta's DikFat Spread Visualizer & Dynamic Options Chain
**Venta's DikFat Spread Visualizer and Options Chain Strike Scanner** is a powerful trading tool designed to give users an immediate view of the nearest options strikes relative to the current price of the underlying asset. This script dynamically displays a selected number of call and put options strikes from the **options chain**, visualizing them directly on the chart for better decision-making.
By default, the script shows options strikes for the current chart’s price, but users have the flexibility to extend the view to include strikes on the opposite side of the market. The available options allow you to show either 3, 6, or 9 strikes on either side of the current price level.
This tool is essential for options traders who want to track strike prices in relation to the underlying asset's price movements. It provides key visual clues such as strike price distributions, volatility, and potential areas of market basing—all in a customizable and user-friendly interface.
---
█ CONCEPTS
This script pulls real-time **options strikes** directly from the **options chain**, providing traders with the ability to see call and put strikes as dynamic price markers on their chart. The concept revolves around understanding the proximity and distribution of strikes based on the current price and market conditions.
Key Features
**Dynamic Options Strike Display**: The script automatically identifies and displays the options strikes closest to the current market price of the underlying asset.
**Customizable Strike Range**: Choose between 3, 6, or 9 strikes on either side of the current price, giving flexibility in visualizing different strike ranges.
**Current Chart Focused by Default**: When added to the chart, the script focuses on the strikes closest to the current price. However, users can opt to include strikes on the opposite side of the market for a broader view.
**Instant Market Context**: The displayed
strikes offer a snapshot of the options market and how the current price relates to potential option expiration levels, helping traders understand key zones.
**Visual Clues on Spreads & Volatility**: This script not only displays the strikes but also provides instant visual clues that reflect the volatility and spread of the options market.
---
█ HOW IT WORKS
The script operates by accessing the **options chain** for the underlying asset, identifying the nearest call and put strikes, and plotting them as visual markers on the chart. This real-time strike data is dynamic, adjusting automatically as the market price moves.
Strike Calculation
The script uses the current price of the underlying asset as a base point and calculates the nearby **options strikes** from the **options chain**.
Depending on the user's settings, the script will plot up to 9 strikes on either side of the price level.
This calculation is performed using live market data, making sure the plotted strikes always reflect the most current market conditions.
Visual Clues
**Spreads**: The space between the plotted call and put options strikes provides immediate insights into the current bid/ask spreads. If the spread between strike prices is wide, it suggests increased volatility or a higher level of uncertainty in the market. Conversely, narrow spreads often indicate market stability or a lack of price movement.
**Market Basing**: When options strikes form a concentrated group near a certain price level, it can indicate that the market is building up or basing at a key level. This might signal the potential for a breakout or a reversal.
**Volatility Insights**: Wider gaps between strikes, particularly on the call side versus the put side (or vice versa), can indicate an imbalance in options trading activity, often a reflection of higher volatility expectations. This visual clue can help traders assess when the market is pricing in significant movements.
Customization and User Settings
**Number of Strikes**: The number of options strikes shown is fully customizable, allowing users to display 3, 6, or 9 strikes on either side.
**Show Opposite Strikes**: By default, the script shows strikes on the current side of the market, but users can enable the option to show strikes on the opposite side to gain a more complete view of the market's options landscape.
**Strike Colors & Width**: Customize the visual appearance of the plotted strikes by adjusting the color and line width for better clarity and chart aesthetics.
---
█ POTENTIAL USE CASES
This indicator is especially valuable for **options traders**, **market analysts**, and anyone interested in gaining insights into the underlying options market. Here are some of the key use cases:
**Options Traders**: Quickly identify the nearest strike prices and understand the risk/reward potential for options positions. The ability to customize the number of strikes shown allows traders to focus on the most relevant price levels.
**Volatility Monitoring**: Use the visual clues from the spread between strike prices to assess the level of volatility in the options market. A wider spread suggests that options traders are expecting more significant price moves, while a narrow spread indicates less expected movement.
**Support and Resistance Identification**: The clustering of strike prices on one side of the market can indicate a potential support or resistance level. By monitoring these levels, traders can get a sense of where the market may reverse or consolidate.
**Market Sentiment Analysis**: A large concentration of call strikes above the current price level, or put strikes below, can be an indication of market sentiment, such as whether traders are generally bullish or bearish.
**Risk Management**: By tracking nearby options strikes, traders can adjust their strategies to minimize risk, especially when market price levels approach significant strike points.
---
█ FEATURES
**Real-Time Data**: The script pulls data from the **options chain**, ensuring that the plotted strikes are always up-to-date with the current market price.
**User-Friendly Interface**: Clear and customizable inputs allow users to easily adjust the number of strikes displayed and control visual settings such as colors and line widths.
**Visual Strike Indicators**: Instantly spot volatility, market basing, and spread imbalances through visual clues from the plotted strikes, enhancing your market analysis.
---
█ LIMITATIONS
**Accuracy Depends on Market Data**: This indicator relies on the available **options chain** data. While the data is updated in real-time, its accuracy may depend on the liquidity and availability of options contracts in the market.
**Not Suitable for Non-Options Traders**: If you don’t trade options, the relevance of this indicator may be limited as it is designed specifically to provide insight into the options market.
**Data Delays**: In fast-moving markets, there may be a slight delay in the updating of strike prices, depending on the data feed.
---
█ HOW TO USE
**Load the Script**: Add the **Venta's DikFat Spread Visualizer and Options Chain Strike Scanner** script to your TradingView chart.
**Adjust Settings**: Use the input options to select the number of strikes you want to display (3, 6, or 9). You can also choose whether to display only the current chart’s strikes or include strikes from the opposite side.
**Interpret the Strikes**: Look at the plotted strikes to gain insights into where the market is currently pricing options and where major strike prices are located. Pay attention to the spreads, concentrations, and volatility signals.
**Monitor the Market**: As the market moves, watch how the strikes shift and cluster, providing you with real-time information about market sentiment and potential volatility.
---
█ THANKS
We would like to extend our gratitude to the PineCoders community for their ongoing support and contributions to the TradingView Pine Script ecosystem. Special thanks to The Options Team.
Volatility Cycle IndicatorThe Volatility Cycle Indicator is a non-directional trading tool designed to measure market volatility and cycles based on the relationship between standard deviation and Average True Range (ATR). In the Chart GBPAUD 1H time frame you can clearly see when volatility is low, market is ranging and when volatility is high market is expanding.
This innovative approach normalizes the standard deviation of closing prices by ATR, providing a dynamic perspective on volatility. By analyzing the interaction between Bollinger Bands and Keltner Channels, it also detects "squeeze" conditions, highlighting periods of reduced volatility, often preceding explosive price movements.
The indicator further features visual aids, including colored zones, plotted volatility cycles, and highlighted horizontal levels to interpret market conditions effectively. Alerts for key events, such as volatility crossing significant thresholds or entering a squeeze, make it an ideal tool for proactive trading.
Key Features:
Volatility Measurement:
Tracks the Volatility Cycle, normalized using standard deviation and ATR.
Helps identify periods of high and low volatility in the market.
Volatility Zones:
Colored zones represent varying levels of market volatility:
Blue Zone: Low volatility (0.5–0.75).
Orange Zone: Transition phase (0.75–1.0).
Green Zone: Moderate volatility (1.0–1.5).
Fuchsia Zone: High volatility (1.5–2.0).
Red Zone: Extreme volatility (>2.0).
Squeeze Detection:
Identifies when Bollinger Bands contract within Keltner Channels, signaling a volatility squeeze.
Alerts are triggered for potential breakout opportunities.
Visual Enhancements:
Dynamic coloring of the Volatility Cycle for clarity on its momentum and direction.
Plots multiple horizontal levels for actionable insights into market conditions.
Alerts:
Sends alerts when the Volatility Cycle crosses significant levels (e.g., 0.75) or when a squeeze condition is detected.
Non-Directional Nature:
The indicator does not predict the market's direction but rather highlights periods of potential movement, making it suitable for both trend-following and mean-reversion strategies.
How to Trade with This Indicator:
Volatility Squeeze Breakout:
When the indicator identifies a squeeze (volatility compression), prepare for a breakout in either direction.
Use additional directional indicators or chart patterns to determine the likely breakout direction.
Crossing Volatility Levels:
Pay attention to when the Volatility Cycle crosses the 0.75 level:
Crossing above 0.75 indicates increasing volatility—ideal for trend-following strategies.
Crossing below 0.75 signals decreasing volatility—consider mean-reversion strategies.
Volatility Zones:
Enter positions as volatility transitions through key zones:
Low volatility (Blue Zone): Watch for breakout setups.
Extreme volatility (Red Zone): Be cautious of overextended moves or reversals.
Alerts for Proactive Trading:
Configure alerts for squeeze conditions and level crossings to stay updated without constant monitoring.
Best Practices:
Pair the Volatility Cycle Indicator with directional indicators such as moving averages, trendlines, or momentum oscillators to improve trade accuracy.
Use on multiple timeframes to align entries with broader market trends.
Combine with risk management techniques, such as ATR-based stop losses, to handle volatility spikes effectively.

Engulfing Candlestick StrategyEver wondered whether the Bullish or Bearish Engulfing pattern works or has statistical significance? This script is for you. It works across all markets and timeframes.
The Engulfing Candlestick Pattern is a widely used technical analysis pattern that traders use to predict potential price reversals. It consists of two candles: a small candle followed by a larger one that "engulfs" the previous candle. This pattern is considered bullish when it occurs in a downtrend (bullish engulfing) and bearish when it occurs in an uptrend (bearish engulfing).
Statistical Significance of the Engulfing Pattern:
While many traders rely on candlestick patterns for making decisions, research on the statistical significance of these patterns has produced mixed results. A study by Dimitrios K. Koutoupis and K. M. Koutoupis (2014), titled "Testing the Effectiveness of Candlestick Chart Patterns in Forex Markets," indicates that candlestick patterns, including the engulfing pattern, can provide some predictive power, but their success largely depends on the market conditions and timeframe used. The researchers concluded that while some candlestick patterns can be useful, traders must combine them with other indicators or market knowledge to improve their predictive accuracy.
Another study by Brock, Lakonishok, and LeBaron (1992), "Simple Technical Trading Rules and the Stochastic Properties of Stock Returns," explores the profitability of technical indicators, including candlestick patterns, and finds that simple trading rules, such as those based on moving averages or candlestick patterns, can occasionally outperform a random walk in certain market conditions.
However, Jorion (1997), in his work "The Risk of Speculation: The Case of Technical Analysis," warns that the reliability of candlestick patterns, including the engulfing patterns, can vary significantly across different markets and periods. Therefore, it's important to use these patterns as part of a broader trading strategy that includes other risk management techniques and technical indicators.
Application Across Markets:
This script applies to all markets (e.g., stocks, commodities, forex) and timeframes, making it a versatile tool for traders seeking to explore the statistical effectiveness of the bullish and bearish engulfing patterns in their own trading.
Conclusion:
This script allows you to backtest and visualize the effectiveness of the Bullish and Bearish Engulfing patterns across any market and timeframe. While the statistical significance of these patterns may vary, the script provides a clear framework for evaluating their performance in real-time trading conditions. Always remember to combine such patterns with other risk management strategies and indicators to enhance their predictive power.

Smart Wick Concept (SWC)Smart Wick Concept (SWC)
The Smart Wick Concept (SWC) is a unique trend-following strategy designed to capture precise entry points in trending markets. This indicator identifies trade opportunities based on higher timeframe trends and wick behavior on lower timeframes, making it an effective tool for intraday and swing traders.
Key Features:
Trend Identification:
SWC uses the H1 timeframe to define the primary market trend (bullish or bearish), ensuring alignment with the overall market direction.
Precise Entry Signals:
Entry opportunities are generated on the M15 timeframe when a candle's wick interacts with the prior candle's range. This approach minimizes false signals and enhances accuracy.
Stop Loss and Take Profit Levels:
The indicator automatically calculates suggested stop loss and take profit levels based on market dynamics, providing traders with a clear risk-reward framework.
Customizable Parameters:
SWC allows traders to adjust key settings, such as the higher timeframe and minimum trend range, to align with their trading preferences and market conditions.
How It Works:
Bullish Entry:
Higher timeframe trend must be bullish.
A M15 candle must dip below the previous candle’s low and close back above it, signaling a potential buy opportunity.
Bearish Entry:
Higher timeframe trend must be bearish.
A M15 candle must exceed the previous candle’s high and close back below it, signaling a potential sell opportunity.
Risk Management:
Stop loss is placed at the low (for buys) or high (for sells) of the current M15 candle.
Take profit targets are calculated at twice the risk, ensuring a favorable risk-reward ratio.
Benefits:
Aligns trades with market momentum.
Reduces noise by filtering out weak or sideways trends.
Provides a structured approach to trading XAUUSD and other volatile instruments.
Use Cases:
The Smart Wick Concept is ideal for traders looking for a disciplined and data-driven approach to trading. While it is optimized for XAUUSD, it can also be applied to other trending markets such as major currency pairs or indices with some parameter adjustments.
Disclaimer:
This indicator is a trading tool and should not be used as a standalone strategy. Always backtest the indicator thoroughly and use proper risk management to protect your capital. Past performance does not guarantee future results.

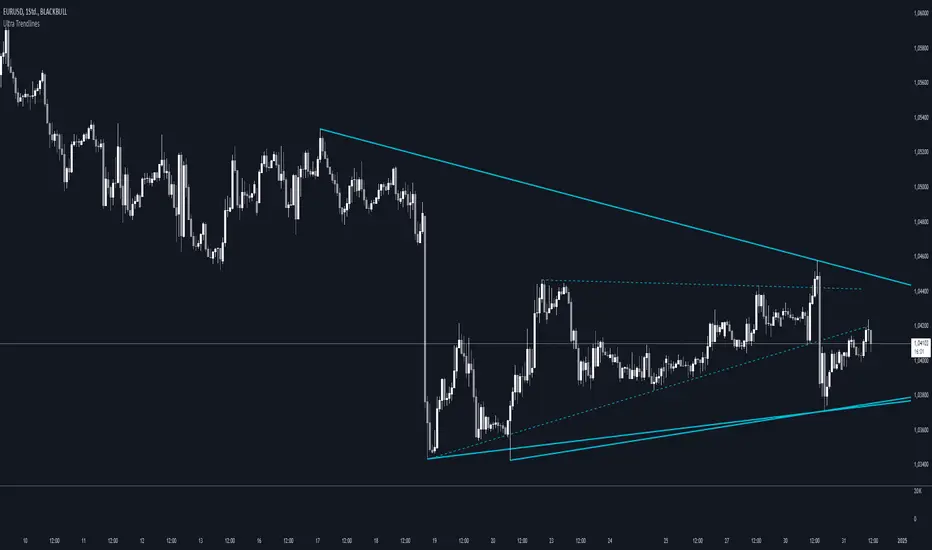
Ultra TrendlinesThis indicator automatically draws trendlines based on every pivot point, helping traders visualize key support and resistance levels. It dynamically adjusts as new pivots are detected and validates the trendlines against price movement.
Introduction
The Ultra Trendlines indicator is designed to help traders identify and track significant trendlines on their charts. By automatically detecting pivot points (both highs and lows), it draws trendlines that highlight key market movements. These trendlines are valuable for understanding the broader trend and for making informed trading decisions.
Detailed Description
The indicator analyzes price data to find pivot points highs and lows over a user-defined lookback period. Once a pivot is detected, it draws trendlines between the pivot points.
.........
Accuracy
To ensure accuracy, the indicator only keeps trendlines that are confirmed by price action. It checks if the price crosses the trendline and deletes invalid lines.
Additionally, it checks if the trendlines stay within predefined price thresholds, filtering out irrelevant lines that are too far from current price action.
The indicator also has an option to only show "rising lows" and "falling highs" trendlines, offering further precision in trend direction.
As new pivots are detected, older trendlines that fall outside the lookback period are removed, ensuring the chart remains clean.
.....
Style
The trendlines can extend forward (infinite and userdefined), backward, both or none. The lines are drawn with a customizable style (solid, dotted, or dashed), color, and width.
.........
Summary of Key Points
The indicator automatically detects pivot points (highs and lows) and draws trendlines based on them. It allows you to customize the style, color, and width of the trendlines. The indicator filters out invalid trendlines by checking if they are still relevant based on price action and price thresholds. Additionally, you can choose to only display rising lows and falling highs for more accurate trend analysis. It also removes outdated trendlines to keep the chart clean.
GapAura: Dynamic Gap [AstroHub]GapAura is a powerful indicator designed to analyze and visualize price gaps on your charts. It focuses on the key levels created by gaps between the open of the current day and the close of the previous day. The indicator connects these gap levels with trend-like lines, allowing traders to easily identify significant price movements and potential turning points in the market.
GapCloud automatically differentiates between upward and downward gaps, helping traders visualize important support and resistance levels that emerge following these gaps. The lines representing these gaps behave like trend lines, providing clear and actionable insights for market analysis. Unlike traditional gap indicators, GapCloud offers a dynamic approach to gap visualization, making it easier for traders to assess the impact of price gaps on future market movement.
How to Use:
Gap Up: When the open of the current day is higher than the close of the previous day, GapCloud draws a line connecting these two levels. This visualizes the gap upward and helps identify the trend direction, as well as potential support zones.
Gap Down: When the open of the current day is lower than the close of the previous day, the indicator draws a line that connects these levels, showing a downward gap. This can highlight potential resistance levels.
The lines for each gap are connected to form continuous trend-like levels, giving traders a clear picture of market structure. These lines can also be used to identify areas of strong support or resistance, and potential turning points where the price may reverse or continue in the same direction.
What Makes This Indicator Unique:
GapCloud stands out by transforming gaps into trend-like lines, offering more than just a simple visualization of the gap itself. By connecting the open and close levels of the current and previous day, it allows traders to see how these price differences can act as significant support or resistance levels. These lines help traders spot market trends and potential reversals more clearly, giving them an edge in making more informed trading decisions.
The ability to visualize gaps as trend lines gives traders a unique advantage in understanding market behavior. Gaps are not just seen as isolated events; they are integrated into the overall market structure and can provide critical insights into the potential price direction.
In addition to this, GapCloud offers a high degree of customization. Users can adjust the thickness, style, and color of the gap lines to fit their trading preferences and style. This makes the indicator adaptable to various types of trading strategies, from short-term to long-term analysis.
Key Features:
Identifies and visualizes gaps between the open of the current day and the close of the previous day.
Converts gap levels into trend-like lines, providing clarity and actionable insights for traders.
Helps identify potential support and resistance levels based on gap locations.
Fully customizable settings, including line thickness, style, and color, to suit individual trading preferences.
Provides a dynamic approach to gap analysis, helping traders forecast market direction and potential reversals with greater accuracy.
GapCloud is an essential tool for any trader looking to enhance their market analysis. By visualizing price gaps as connected trend lines, it simplifies the process of identifying key levels and market structure, giving traders an edge in understanding price movements and making more informed decisions.

Order Blocks - VK TradingOrder Blocks - VK Trading
This script in Pine Script identifies and highlights Order Blocks, key tools in institutional trading. Designed for traders of all levels, it provides clear and customizable visualization, helping you anticipate market movements with greater accuracy.
Key Features:
Order Block Visualization: Highlights relevant bullish and bearish zones directly on the chart.
Customizable Settings: Adjust sensitivity, colors, and other parameters to suit your analysis needs.
Dual Block Detection: Uses two independent settings to cover different market perspectives.
Visual Alerts: Automatic line drawing for key levels.
Automatic Clearing: Dynamic clearing of already invalidated blocks.
User Benefits:
Clear Visual Analysis: Identifies key supply and demand points used by institutions.
Improved Trading Decisions: Anticipate entry and exit zones more accurately.
Time Saver: Automates level plotting, allowing you to focus on strategy and execution.
Strategy Adaptability: Compatible with Smart Money, Wyckoff, and Price Action approaches.
Disclaimer:
This script is an educational and analytical tool. It does not guarantee specific results or eliminate trading risk. Trading in the financial markets involves significant risks; use this script at your own risk.

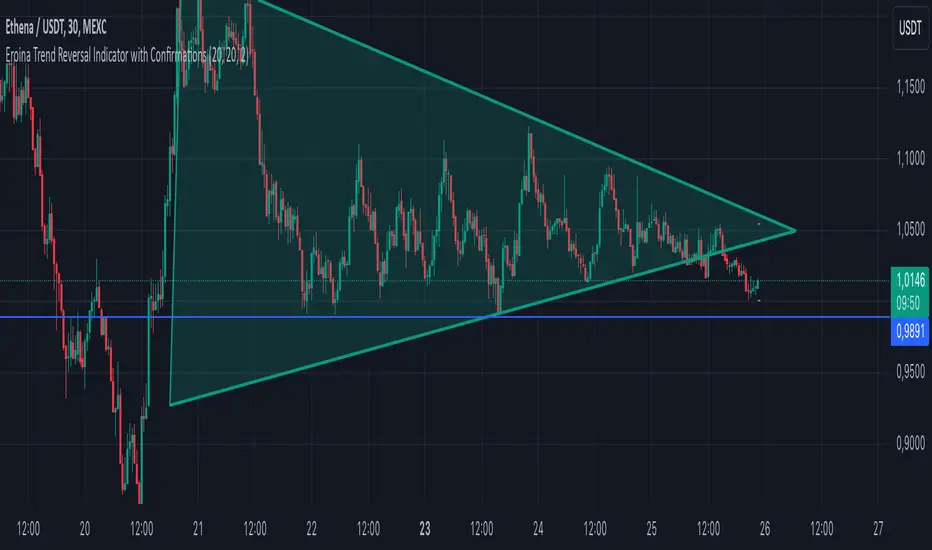
Eroina Trend Reversal Indicator with ConfirmationsEroina Trend Reversal Indicator with Confirmations
Overview (English):
The Trend Reversal Indicator with Confirmations is designed to identify potential trend reversals by analyzing dynamic resistance and support levels. This script uses a robust confirmation system to reduce false signals, making it ideal for traders who seek disciplined, data-driven decisions.
Key Features:
• Dynamic Levels: Calculates resistance and support levels based on user-defined lengths.
• Breakout Confirmation: Confirms trend reversals by validating price action over a specified number of candles.
• Visual Cues: Displays “LONG” and “SHORT” signals directly on the chart, alongside resistance/support levels.
• Customizable Parameters: Adaptable to different timeframes and market conditions.
How It Works:
1. Resistance & Support Levels:
• Resistance: Calculated as the highest high over the last N bars.
• Support: Calculated as the lowest low over the last N bars.
2. Breakout Detection:
• A resistance breakout occurs when the price closes above the resistance level.
• A support breakout occurs when the price closes below the support level.
3. Confirmation Logic:
• Signals are validated only if the price remains above/below the levels for a user-defined number of candles.
4. Entry Signals:
• “LONG” signals indicate a confirmed breakout above resistance.
• “SHORT” signals indicate a confirmed breakdown below support.
Settings:
• Resistance Length: Defines the number of candles used to calculate resistance levels.
• Support Length: Defines the number of candles used to calculate support levels.
• Confirmation Candles: Specifies how many candles are required to confirm breakouts.
Usage:
This indicator is ideal for identifying trend reversals and optimizing entry points. Combine it with volume analysis or other technical indicators to enhance accuracy. For example:
• Use in conjunction with RSI to avoid overbought/oversold conditions.
• Combine with moving averages to confirm the trend direction.
Overview (Additional Language):
(Your additional language description can go here after English, e.g., Russian, Spanish, etc.)
FT SessionsFT Sessions
Overview
The FT Sessions is a highly customizable and powerful indicator designed for intraday traders who focus on session-based analysis. This script visually highlights global market sessions—Asia, Frankfurt, London, and New York (AM & PM)—on the chart, making it easier to track session ranges and analyze intraday price movements.
Key Features
Customizable Session Times and Colors:
Define your own session times and assign unique colors for better visibility.
Session Range Visualization:
Displays high and low ranges for each session.
Optional transparent range areas with outlines for clarity.
Configurable session range labels for enhanced readability.
Flexible Timezone Settings:
Choose a UTC offset or sync with the exchange's timezone.
User-Friendly Customization:
Compact settings for easier adjustments.
Enable or disable specific sessions to focus on relevant market activity.
How This Script Differs from LuxAlgo
This script draws inspiration from LuxAlgo's session tracking concept but has been developed with significant modifications and unique features:
Built from Scratch in Pine Script v5:
Fully optimized for Pine Script’s latest version, improving performance and functionality.
Expanded Session Range Features:
Five unique sessions (Asia, Frankfurt, London, New York AM, New York PM) with customizable ranges, colors, and labels.
Real-time updating of session ranges for improved intraday analysis.
4H Timeframe Optimization:
Automatically notifies users if applied to an unsupported timeframe, ensuring session accuracy.
Highly Configurable Input Options:
Advanced timezone handling and compact session management settings.
Unique Coding Structure:
Designed to maximize efficiency and minimize resource usage on TradingView.
While LuxAlgo focuses on session concepts, this script brings a fresh, customizable approach specifically tailored for intraday traders seeking precision in tracking session activity.
How It Works
The indicator tracks price movements within each session.
Highlights the high and low range of each session directly on the chart.
Updates session ranges in real-time to reflect evolving market conditions.
Practical Applications
Intraday Trading: Plan trades based on major market session ranges.
Breakout Strategies: Use session high and low levels to identify potential breakouts.
Session-Specific Patterns: Spot consolidations and reversals within session activity.
Important Notes
Optimized for the 4H timeframe. If applied to another timeframe, a notification will appear.
Best used in combination with other tools (e.g., volume or trend indicators) for a complete trading strategy.
Credits
This script draws inspiration from LuxAlgo's open-source session-tracking methodology. However, it introduces substantial improvements and unique features that set it apart. Full credit is given to LuxAlgo for their original open-source concept.
Disclaimer
This script is for informational and educational purposes only. Always test on a demo account before applying to live markets.

ForecastPro by BinhMyco1. Overview:
This Pine Script implements a custom forecasting tool on TradingView, labeled "BinhMyco." It provides a method to predict future price movements based on historical data and a comparison with similar historical patterns. The script supports two types of forecasts: **Prediction** and **Replication**, where the forecasted price can be either based on price peaks/troughs or an average direction. The script also calculates a confidence probability, showing how closely the forecasted data aligns with historical trends.
2. Inputs:
- Source (`src`): The input data source for forecasting, which defaults to `open`.
- Length (`len`): The length of the training data used for analysis (fixed at 200).
- Reference Length (`leng`): A fixed reference length for comparing similar historical patterns (set to 70).
- Forecast Length (`length`): The length of the forecast period (fixed at 60).
- Multiplier (`mult`): A constant multiplier for the forecast confidence cone (set to 4.0).
- Forecast Type (`typ`): Type of forecast, either **Prediction** or **Replication**.
- Direction Type (`dirtyp`): Defines how the forecast is calculated — either based on price **peaks/troughs** or an **average direction**.
- Forecast Divergence Cone (`divcone`): A boolean option to enable the display of a confidence cone around the forecast.
3. Color Constants:
- Green (`#00ffbb`): Color used for upward price movements.
- Red (`#ff0000`): Color used for downward price movements.
- Reference Data Color (`refcol`): Blue color for the reference data.
- Similar Data Color (`simcol`): Orange color for the most similar data.
- Forecast Data Color (`forcol`): Yellow color for forecasted data.
4. Error Checking:
- The script checks if the reference length is greater than half the training data length, and if the forecast length exceeds the reference length, raising errors if either condition is true.
5. Arrays for Calculation:
- Correlation Array (`c`): Holds the correlation values between the data source (`src`) and historical data points.
- Index Array (`index`): Stores the indices of the historical data for comparison.
6. Forecasting Logic:
- Correlation Calculation: The script calculates the correlation between the historical data (`src`) and the reference data over the given reference length. It then identifies the point in history most similar to the current data.
- Forecast Price Calculation: Based on the type of forecast (Prediction or Replication), the script calculates future prices either by predicting based on similar bars or by replicating past data. The forecasted prices are stored in the `forecastPrices` array.
- Forecast Line Drawing: The script draws lines to represent the forecasted price movements. These lines are color-coded based on whether the forecasted price is higher or lower than the current price.
7. Divergence Cone (Optional):
- If the **divcone** option is enabled, the script calculates and draws a confidence cone around the forecasted prices. The upper and lower bounds of the cone are calculated using a standard deviation factor, providing a visual representation of forecast uncertainty.
8. Probability Table:
- A table is displayed on the chart, showing the probability of the forecast being accurate. This probability is calculated using the correlation between the current data and the most similar historical pattern. If the probability is positive, the table background turns green; if negative, it turns red. The probability is presented as a percentage.
9. Key Functions:
- `highest_range` and `lowest_range`: Functions to find the highest and lowest price within a range of bars.
- `ftype`: Determines the forecast type (Prediction or Replication) and adjusts the forecasting logic accordingly.
- `ftypediff`: Computes the difference between the forecasted and actual prices based on the selected forecast type.
- `ftypelim`, `ftypeleft`, `ftyperight`: Additional functions to adjust the calculation of the forecast based on the forecast type.
10. Conclusion:
The "ForecastPro" script is a unique tool for forecasting future price movements on TradingView. It compares historical price data with similar historical trends to generate predictions. The script also offers a customizable confidence cone and displays the probability of the forecast's accuracy. This tool provides traders with valuable insights into future price action, potentially enhancing decision-making in trading strategies.
---
This script provides advanced functionality for traders who wish to explore price forecasting, and can be customized to fit various trading styles.

[blackcat] L2 Quantitative Trading Reference█ OVERVIEW
The script " L2 Quantitative Trading Reference" calculates and plots various directional indicators based on price movements over a specified period. It primarily focuses on identifying trends, trend strength, and specific candlestick patterns such as strong bearish candles.
█ LOGICAL FRAMEWORK
The script consists of several main components:
Input Parameters:
None explicitly set; however, implicit inputs include high, low, and close prices.
Custom Functions:
count_periods: Counts occurrences of a condition within a given lookback period.
every_condition: Checks if a condition holds true for an entire lookback period.
calculate_and_plot_directional_indicators: Computes directional movement indices and determines market conditions like direction, strength, and specific candle types.
Calculations:
• The script calculates the True Range, differences between highs/lows, and computes directional movement indices.
• It then uses these indices to determine the current market direction, strength, and identifies strong bearish candles.
Plotting:
• Plots histograms representing different conditions including negative directional movement in red, positive directional movement in green, continuous strength in yellow, and strong bearish candles in aqua.
Data flows from the calculation of basic price metrics through more complex computations involving sums and comparisons before being plotted according to their respective conditions.
█ CUSTOM FUNCTIONS
count_periods:
Counts how many times a certain condition occurs within a specified number of periods.
every_condition:
Determines whether a particular condition has been met continuously throughout a specified number of periods.
calculate_and_plot_directional_indicators:
This function encompasses multiple tasks including calculating the True Range, Positive/Negative Directional Movements and Indices, determining the market direction, assessing strength via bar continuity since the last change, and identifying strong bearish candles. It returns four arrays containing directional movement, positivity status, continuous strength, and strong bearish candle occurrence respectively.
█ KEY POINTS AND TECHNIQUES
• Utilizes custom functions for modular and reusable code.
• Employs math.sum and ta.barssince for efficient computation of cumulative values and counting bars since a condition was met.
• Uses ternary operators (condition ? value_if_true : value_if_false) extensively for concise conditional assignments.
• Leverages Pine Script’s built-in mathematical functions (math.max, math.min, etc.) for robust financial metric calculations.
• Implements histogram plotting styles to visually represent distinct market states effectively.
█ EXTENDED KNOWLEDGE AND APPLICATIONS
Potential enhancements can involve adding alerts when specific conditions are met, incorporating additional technical indicators, or refining existing logic for better accuracy. This script's approach could be adapted for creating strategies that react to changes in market dynamics identified by these directional indicators. Related topics worth exploring in Pine Script include backtesting frameworks, multi-timeframe analysis, risk management techniques, and integration with external data sources.

BOLLINGER BY HARSH### Description for the Indicator:
**Advanced Bollinger Bands + Inside Bar Signals**
This indicator is a versatile trading tool designed for precision and reliability, combining the power of Bollinger Bands with Inside Bar pattern detection and trend filtering. It offers traders a unique way to identify high-probability trading opportunities by integrating multiple market analysis techniques.
#### Key Features:
1. **Bollinger Bands:**
- Measures market volatility and identifies potential reversal zones.
- Upper and lower bands act as dynamic support and resistance levels.
2. **Inside Bar Pattern Detection:**
- Highlights areas of market consolidation and potential breakout setups.
- Displays inside bars directly on the chart for easy visualization.
3. **Trend Detection:**
- Uses an EMA (Exponential Moving Average) to determine market direction.
- Only signals trades aligned with the prevailing trend for better accuracy.
4. **Session Filter:**
- Allows you to restrict signals to specific trading sessions.
- Helps avoid false signals during low-liquidity periods.
5. **Advanced Buy & Sell Signals:**
- Buy signals: Inside bar near the lower Bollinger Band in an uptrend.
- Sell signals: Inside bar near the upper Bollinger Band in a downtrend.
- Reduces noise and focuses on high-quality setups.
6. **Risk Management Tools:**
- Automatically calculates take-profit and stop-loss levels based on ATR (Average True Range).
- Plots these levels on the chart to help traders manage risk effectively.
7. **Alerts for Signals:**
- Get notified instantly for buy and sell opportunities via TradingView alerts.

Fractal levels Gold [AstroHub]This indicator detects key fractal points on a price chart and visually marks them with shapes and levels. It helps traders identify potential reversal zones and dynamic support/resistance levels, enhancing market analysis.
Key Features:
Fractal Detection:
The indicator identifies top and bottom fractals using a 5-bar pattern.
A top fractal forms when the middle bar has a higher high compared to the two bars on either side.
A bottom fractal forms when the middle bar has a lower low compared to the two bars on either side.
Fractal Filtering:
The indicator can filter out "pristine" fractals (uninterrupted fractal patterns) based on custom conditions, making it more selective and reducing false signals.
Fractal Plotting:
are plotted as downward triangles.
are plotted as upward triangles.
Users can choose to display or hide fractal points and their corresponding labels.
Fractal Levels:
The indicator automatically plots fractals' levels on the chart, marking potential resistance and support zones.
Fractal levels change dynamically as new fractals are identified.
Customizable Display Options:
Show or hide fractals and levels with adjustable settings.
Choose whether to apply filtering for pristine fractals.
Display the pivot labels to easily track fractal positions.
How It Works:
The indicator uses a simple approach to recognize top and bottom fractals . When a valid fractal is detected, it highlights it on the chart and plots the corresponding price level.
By default, top fractals are shown above the bars (red color), and bottom fractals are shown below the bars (green color).
Fractal levels represent potential reversal points and can act as dynamic support and resistance zones.
Best Use:
The indicator is particularly useful in identifying reversal points and trend changes, helping traders to spot key price levels.
It can be used across various timeframes and markets, particularly for trend-following or reversal strategies.
Customizable Settings:
Show Pivots: Toggle the display of pivot points.
Show Pivot Labels: Display labels for pivot levels.
Show Fractals: Toggle fractal points on the chart.
Show Fractal Levels: Show or hide the levels corresponding to the detected fractals.
Filter for Pristine Fractals: Enable this option to filter out non-pristine fractals for higher accuracy.
Conclusion:
This indicator provides clear, actionable fractal signals, helping traders easily identify critical levels for entry and exit. With customizable settings and visual cues, it's suitable for both novice and expe

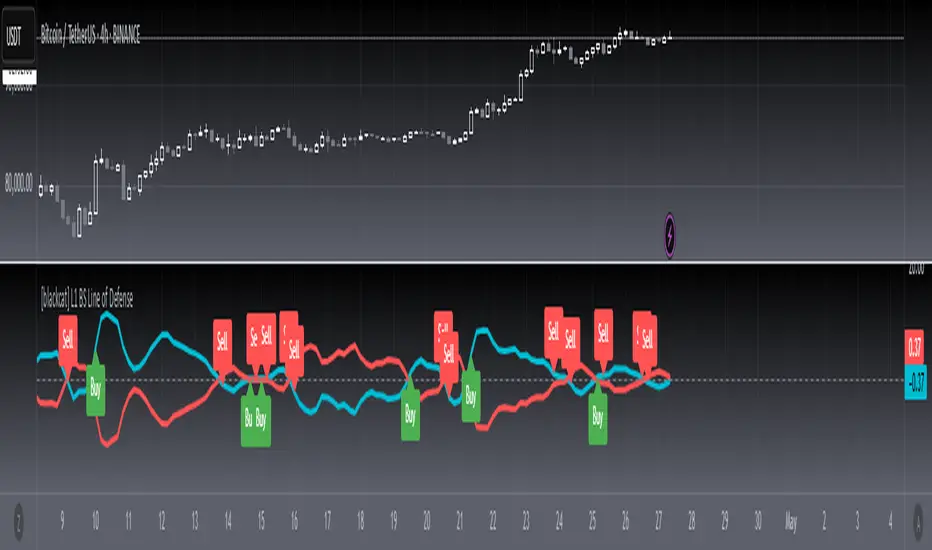
[blackcat] L1 BS Line of Defense █ OVERVIEW
The Pine Script provided is an advanced technical indicator designed to generate reliable buy and sell signals by integrating momentum, moving averages, and price level analyses. It employs a custom weighted moving average (WMA) and exponential moving averages (EMAs) to compute key signals known as the "Buy/Sell Signal" and the "Short Line." These signals aim to pinpoint optimal entry and exit points for trades by evaluating their relationship with current market dynamics.
█ FEATURES
Key Components:
• Custom Weighted Moving Average ( WMA ): Provides enhanced flexibility compared to traditional moving averages.
• Exponential Moving Averages ( EMA ): Smooths the defense line and its short-term counterpart to filter out market noise.
• Momentum Indicators: Includes both short-term and long-term momentum adjusted via custom WMA and EMAs.
• Conditional Signal Generation: Signals are triggered based on precise crossovers and price conditions.
Logical Framework:
1 — Input Parameters:
No explicit user-defined inputs; defaults are used for internal calculations.
2 — Custom Functions:
• custom_wma : Calculates a custom WMA.
• calculate_buy_sell_signals : Generates buy and sell signals.
3 — Calculations:
• Momentum and Range Analysis over 9, 34, and 60-bar periods.
• Application of custom WMA and EMAs to smooth and refine data.
• Derivation of the "defense line" and "short_ema_defense."
4 — Plotting:
• Main signal lines ("Buy/Sell Signal" and "Short Line") are visualized.
• A horizontal zero line serves as a reference point.
█ HOW TO USE
To utilize this script effectively:
1 — Add the script to your TradingView chart.
2 — Observe the "Buy/Sell Signal" and "Short Line" relative to the zero line and each other.
3 — Look for crossovers and divergence patterns to identify potential trade opportunities.
4 — Combine the signals with additional technical indicators or fundamental analysis for better accuracy.
█ LIMITATIONS
While the script provides valuable insights, users should consider the following limitations:
• Default settings may not suit all markets or instruments; customization might be necessary.
• False signals can occur during volatile or ranging markets.
• Backtesting and optimization are recommended before live trading.
█ NOTES
For further enhancement and personalization:
• Introduce adjustable input parameters for WMA and EMA lengths and weights.
• Extend the script into a full-fledged trading strategy with entry and exit rules.
• Apply the script across multiple timeframes for comprehensive analysis.
• Incorporate risk management practices such as stop-loss and take-profit levels.
• Explore related Pine Script functions like security() for multi-timeframe analysis and [pine>alertcondition() for automated alerts.
Understanding core concepts like momentum, moving averages, and crossovers will aid in developing similar indicators or refining existing ones.
COIN/BTC Volume-Weighted DivergenceThe COIN/BTC Volume-Weighted Divergence indicator identifies buy and sell signals by analyzing deviations between Coinbase and Bitcoin prices relative to their respective VWAPs (Volume-Weighted Average Price). This method isolates points of potential trend reversals, overextensions, or relative mispricing based on volume-adjusted price benchmarks.
The indicator leverages Coinbase’s high beta relative to Bitcoin in bull markets. A buy signal occurs when Coinbase is below VWAP (indicating undervaluation) while Bitcoin is above VWAP (signaling strong broader momentum). A sell signal is generated when Coinbase trades above VWAP (indicating overvaluation) while Bitcoin moves below VWAP (indicating weakening momentum).
This divergence logic enables traders to identify misalignment between Bitcoin-driven market trends and Coinbase’s price behavior. The indicator effectively identifies undervalued entry points and signals exits before speculative extensions are correct. It provides a systematic approach to trading during trending conditions, aligning decisions with volume-weighted price dynamics and inter-asset relationships.
How It Works
1. VWAP:
“fair value” benchmark combining price and volume.
• Above VWAP: Bullish momentum.
• Below VWAP: Bearish momentum.
2. Divergence:
• Coinbase Divergence: close - coin_vwap (distance from COIN’s VWAP).
• Bitcoin Divergence: btc_price - btc_vwap (distance from BTC’s VWAP).
3. Signals:
• Buy: Coinbase is below VWAP (potentially oversold), and Bitcoin is above VWAP (broader bullish trend).
• Sell: Coinbase is above VWAP (potentially overbought), and Bitcoin is below VWAP (broader bearish trend).
4. Visualization:
• Green triangle: Buy signal.
• Red triangle: Sell signal.
Strengths
• Combines price and volume for reliable insights.
• Highlights potential trend reversals or overextensions.
• Exploits correlations between Coinbase and Bitcoin.
Limitations
• Struggles in sideways markets.
• Sensitive to volume spikes, which may distort VWAP.
• Ineffective in strong trends where divergence persists.
Improvements
1. Z-Scores: Use statistical thresholds (e.g., ±2 std dev) for stronger signals.
2. Volume Filter: Generate signals only during high-volume periods.
3. Momentum Confirmation: Combine with RSI or MACD for better reliability.
4. Multi-Timeframe VWAP: Use intraday, daily, and weekly VWAPs for deeper analysis.
Complementary Tools
• Momentum Indicators: RSI, MACD for trend validation.
• Volume-Based Metrics: OBV, cumulative delta volume.
• Support/Resistance Levels: Enhance reversal accuracy.

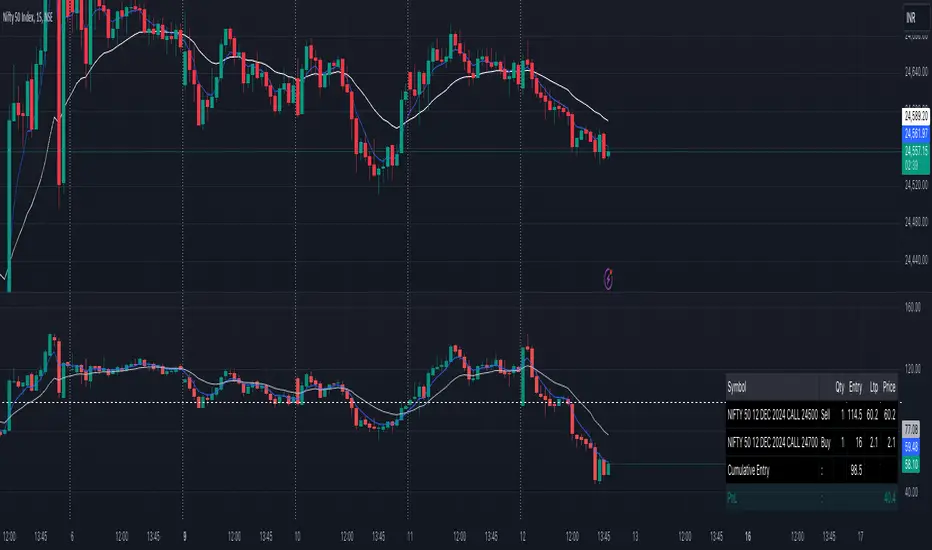
Options Cumulative Chart AnalysysThis Pine Script is a comprehensive tool designed for traders analyzing options data on TradingView. It aggregates multiple symbols to calculate and visualize cumulative performance, providing essential insights for decision-making.
Key Features:
Symbol and Strike Price Configuration:
Supports up to four configurable symbols (e.g., NIFTY options).
Allows defining buy/sell actions, quantities, and entry premiums for each symbol.
Customizable Chart Display:
Plot candlesticks and line charts for cumulative data.
Configurable Exponential Moving Averages (EMAs) for technical analysis.
Entry and price lines with customizable colors.
Timeframe Management:
Supports higher timeframe (HTF) candles.
Ensures compatibility with the current chart timeframe to maintain accuracy.
Dynamic Coloring and Visualization:
Red, green, and gray color schemes for body and wicks of candlesticks based on price movements.
Customizable positive and negative color schemes.
Table for Data Representation:
Displays an info table showing symbols, quantities, entry prices, and latest traded prices (LTP).
Adjustable table position, overlay, and styling.
Premium and Profit/Loss Calculations:
Calculates cumulative open, high, low, and close prices considering premiums and quantities.
Tracks the profit and loss dynamically based on cumulative premiums and market prices.
Alerts and Notifications:
Alerts triggered on specific conditions, such as when the profit/loss turns negative.
Modular Functions:
Functions for calculating high/low/open/close values, combining premiums, and drawing candlesticks.
Utilities for symbol management and security requests.
Custom Settings:
Includes a wide range of input options for customization:
Timeframes, EMA lengths, colors, table configurations, and more.
Error Handling:
Validates timeframe inputs to ensure compatibility and prevent runtime errors.
This script is designed for advanced traders looking for a customizable tool to analyze cumulative options data efficiently. By leveraging its modular design and visual elements, users can make informed trading decisions with a holistic view of market movements.
High/Mid/Low of the Previous Month, Week and Day + MAIntroducing the Ultimate Price Action Indicator
Take your trading to the next level with this feature-packed indicators. Designed to provide key price insights, this tool offers:
- Monthly, Weekly, and Daily Levels : Displays the High, Midpoint, and Low of the previous month, week, and day.
- Logarithmic Price Lines : Option to plot price levels logarithmically for enhanced accuracy.
- Customizable Labels : Display labels on price lines for better clarity. (This feature is optional.)
- Dual Moving Averages : Add two customizable Moving Averages (Simple, Exponential, or Weighted) directly on the price chart. (This feature is optional.)
This code combines features from the Moving Average Exponential and Daily Weekly Monthly Highs & Lows (sbtnc) indicators, with custom modifications to implement unique personal ideas.
Perfect for traders who want to combine precision with simplicity. Whether you're analyzing historical levels or integrating moving averages into your strategy, this indicator provides everything you need for informed decision-making.
To prevent change chart scale, right click on Price Scale and enable "Scale price chart only"