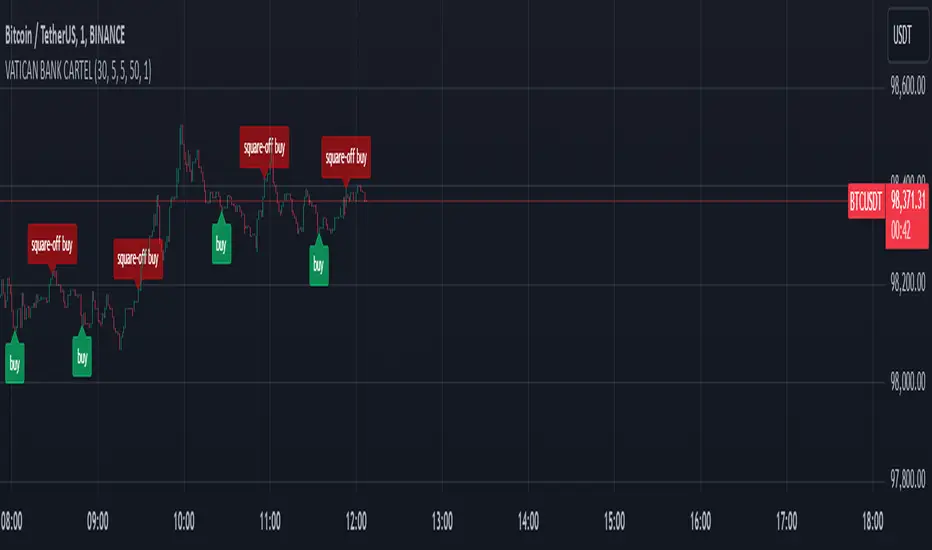
VATICAN BANK CARTELVATICAN BANK CARTEL - Precision Signal Detection for Buyers.
The VATICAN BANK CARTEL indicator is a highly sophisticated tool designed specifically for buyers, helping them identify key market trends and generate actionable buy signals. Utilizing advanced algorithms, this indicator employs a multi-variable detection mechanism that dynamically adapts to price movements, offering real-time insights to assist in executing profitable buy trades. This indicator is optimized solely for identifying buying opportunities, ensuring that traders are equipped to make well-timed entries and exits, without signals for shorting or selling.
The recommended settings for VATICAN BANK CARTEL indicator is as follows:-
Depth Engine = 20,30,40,50,100.
Deviation Engine = 3,5,7,15,20.
Backstep Engine = 15,17,20,25.
NOTE:- But you can also use this indicator as per your setting, whichever setting gives you best results use that setting.
Key Features:
1.Adaptive Depth, Deviation, and Backstep Inputs:
The core of this indicator is its customizable Depth Engine, Deviation Engine, and Backstep Engine parameters. These inputs allow traders to adjust the sensitivity of the trend detection algorithm based on specific market conditions:
Depth: Defines how deep the indicator scans historical price data for potential trend reversals.
Deviation: Determines the minimum required price fluctuation to confirm a market movement.
Backstep: Sets the retracement level to filter false signals and maintain the accuracy of trend detection.
2. Visual Signal Representation:
The VATICAN BANK CARTEL plots highly visible labels on the chart to mark trend reversals. These labels are customizable in terms of size and transparency, ensuring clarity in various chart environments. Traders can quickly spot buying opportunities with green labels and potential square-off points with red labels, focusing exclusively on buy-side signals.
3.Real-Time Alerts:
The indicator is equipped with real-time alert conditions to notify traders of significant buy or square-off buy signals. These alerts, which are triggered based on the indicator’s internal signal logic, ensure that traders never miss a critical market movement on the buy side.
4.Custom Label Size and Transparency:
To enhance visual flexibility, the indicator allows the user to adjust label size (from small to large) and transparency levels. This feature provides a clean, adaptable view suited for different charting styles and timeframes.
How It Works:
The VATICAN BANK CARTEL analyzes the price action using a sophisticated algorithm that considers historical low and high points, dynamically detecting directional changes. When a change in market direction is detected, the indicator plots a label at the key reversal points, helping traders confirm potential entry points:
- Buy Signal (Green): Indicates potential buying opportunities based on a trend reversal.
- Square-Off Buy Signal (Red): Marks the exit point for open buy positions, allowing traders to take profits or protect capital from potential market reversals.
Note: This indicator is exclusively designed to provide signals for buyers. It does not generate sell or short signals, making it ideal for traders focused solely on identifying optimal buying opportunities in the market.
Customizable Parameters:
- Depth Engine: Fine-tunes the historical data analysis for signal generation.
- Deviation Engine: Adjusts the minimum price change required for detecting trends.
- Backstep Engine: Controls the indicator's sensitivity to retracements, minimizing false signals.
- Labels Transparency: Adjusts the opacity of the labels, ensuring they integrate seamlessly into any chart layout.
- Buy and Sell Colors: Customizable color options for buy and square-off buy labels to match your preferred color scheme.
- Label Size: Select between five different label sizes for optimal chart visibility.
Ideal For:
This indicator is ideal for both beginner and experienced traders looking to enhance their buying strategy with a highly reliable, visual, and alert-driven tool. The VATICAN BANK CARTEL adapts to various timeframes, making it suitable for day traders, swing traders, and long-term investors alike—focused exclusively on buying opportunities.
Benefits and Applications:
1.Intraday Trading: The VATICAN BANK CARTEL indicator is particularly well-suited for intraday trading, as it provides accurate and timely "buy" and "square-off buy" signals based on the current market dynamics.
2.Trend-following Strategies: Traders who employ trend-following strategies can leverage the indicator's ability to identify the overall market direction, allowing them to align their trades with the dominant trend.
3.Swing Trading: The dynamic price tracking and signal generation capabilities of the indicator can be beneficial for swing traders, who aim to capture medium-term price movements.
Security Measures:
1. The code includes a security notice at the beginning, indicating that it is subject to the Mozilla Public License 2.0, which is a reputable open-source license.
2. The code does not appear to contain any obvious security vulnerabilities or malicious content that could compromise user data or accounts.
NOTE:- This indicator is provided under the Mozilla Public License 2.0 and is subject to its terms and conditions.
Disclaimer: The usage of VATICAN BANK CARTEL indicator might or might not contribute to your trading capital(money) profits and losses and the author is not responsible for the same.
IMPORTANT NOTICE:
While the indicator aims to provide reliable "buy" and "square-off buy" signals, it is crucial to understand that the market can be influenced by unpredictable events, such as natural disasters, political unrest, changes in monetary policies, or economic crises. These unforeseen situations may occasionally lead to false signals generated by the VATICAN BANK CARTEL indicator.
Users should exercise caution and diligence when relying on the indicator's signals, as the market's behavior can be unpredictable, and external factors may impact the accuracy of the signals. It is recommended to thoroughly backtest the indicator's performance in various market conditions and to use it as one of the many tools in a comprehensive trading strategy, rather than solely relying on its output.
Ultimately, the success of the VATICAN BANK CARTEL indicator will depend on the user's ability to adapt it to their specific trading style, market conditions, and risk management approach. Continuous monitoring, analysis, and adjustment of the indicator's settings may be necessary to maintain its effectiveness in the ever-evolving financial markets.
DEVELOPER:- yashgode9
PineScript:- version:- 5
This indicator aims to enhance trading decision-making by combining DEPTH, DEVIATION, BACKSTEP with custom signal generation, offering a comprehensive tool for traders seeking clear "buy" and "square-off buy" signals on the TradingView platform.
Cari dalam skrip untuk "accuracy"
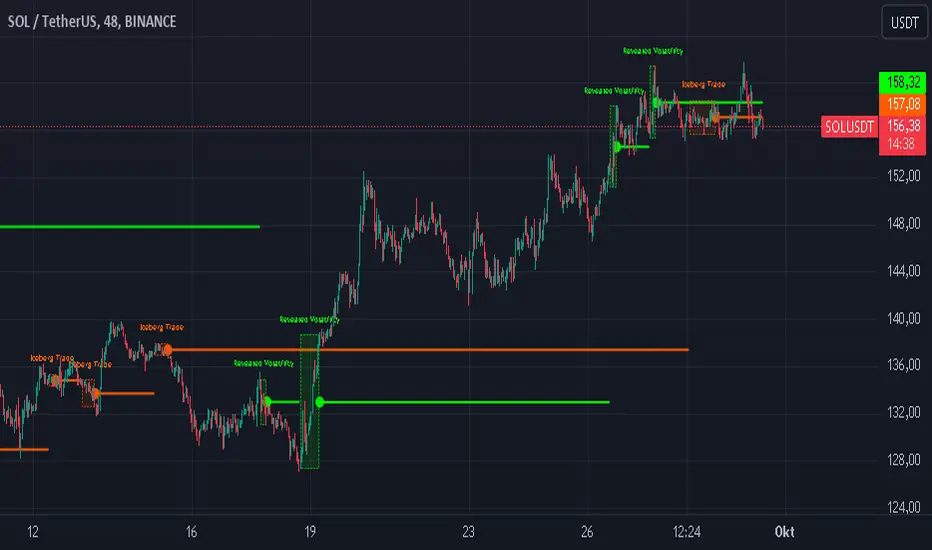
Iceberg Trade Revealer [CHE]Unveiling Iceberg Trades: A Deep Dive into Low Volatility Market Phases
Introduction
In the dynamic world of trading, hidden forces often influence market movements in ways that aren't immediately apparent. One such force is the phenomenon of iceberg trades—large orders that are concealed to prevent significant market impact. This presentation explores the concept of iceberg trades, explains why they are typically hidden during periods of low volatility, and introduces an indicator designed to reveal these elusive trades.
Agenda
1. Understanding Iceberg Trades
- Definition and Purpose
- Impact on Market Dynamics
2. The Low Volatility Concealment
- Why Low Volatility Phases?
- Strategies Behind Hiding Large Orders
3. Introducing the Iceberg Trade Revealer Indicator
- How the Indicator Works
- Key Components and Calculations
4. Demonstration and Use Cases
- Interpreting the Indicator Signals
- Practical Trading Applications
5. Conclusion
- Summarizing the Insights
- Q&A Session
1. Understanding Iceberg Trades
Definition and Purpose
- Iceberg Trades are large single orders divided into smaller lots to disguise the total order quantity.
- Traders use iceberg orders to minimize market impact and avoid unfavorable price movements.
Impact on Market Dynamics
- Concealed Volume: Iceberg orders hide true supply and demand levels.
- Price Stability: They prevent sudden spikes or drops by releasing orders gradually.
- Market Sentiment: Their presence can influence perceptions of market strength or weakness.
2. The Low Volatility Concealment
Why Low Volatility Phases?
- Less Market Attention: Low volatility periods attract fewer traders, making it easier to conceal large orders.
- Reduced Slippage: Prices are more stable, reducing the risk of executing orders at unfavorable prices.
- Strategic Advantage: Large players can accumulate or distribute positions without tipping off the market.
Strategies Behind Hiding Large Orders
- Order Splitting: Breaking down large orders into smaller pieces.
- Time Slicing: Executing orders over an extended period.
- Algorithmic Trading: Using sophisticated algorithms to optimize order execution.
3. Introducing the Iceberg Trade Revealer Indicator
How the Indicator Works
- Core Thesis: Iceberg trades can be detected by analyzing periods of unusually low volatility.
- Volatility Analysis: Uses the Average True Range (ATR) and Bollinger Bands to identify low volatility phases.
- Signal Generation: Marks periods where iceberg trades are likely occurring.
Key Components and Calculations
1. Average True Range (ATR)
- Measures market volatility over a specified period.
- Lower ATR values indicate less price movement.
2. Bollinger Bands
- Creates a volatility envelope around the ATR.
- Bands tighten during low volatility and widen during high volatility.
3. Timeframe Adjustments
- Utilizes multiple timeframes to enhance signal accuracy.
- Options for auto, multiplier, or manual timeframe selection.
4. Signal Conditions
- Iceberg Trade Detection: ATR falls below the lower Bollinger Band.
- Revealed Volatility: ATR rises above the upper Bollinger Band, indicating potential market moves after iceberg trades.
4. Demonstration and Use Cases
Interpreting the Indicator Signals
- Iceberg Trade Zones: Highlighted areas where large hidden orders are likely.
- Revealed Volatility Zones: Areas indicating the market's response to the execution of iceberg trades.
Practical Trading Applications
- Entry and Exit Points: Use signals to time trades alongside institutional activity.
- Risk Management: Adjust strategies during detected low volatility phases.
- Market Analysis: Gain insights into underlying market mechanics.
5. Conclusion
Summarizing the Insights
- Iceberg Trades play a significant role in market movements, especially when concealed during low volatility phases.
- The Iceberg Trade Revealer Indicator provides a tool to uncover these hidden activities, offering traders a strategic edge.
- Understanding and utilizing this indicator can enhance trading decisions by aligning them with the actions of major market players.
Best regards Chervolino ( Volker )
Q&A Session
- Questions and Discussions: Open the floor for any queries or further explanations.
Thank You!
By delving into the hidden aspects of market activity, traders can better navigate the complexities of financial markets. The Iceberg Trade Revealer Indicator serves as a bridge between observable market data and the concealed strategies of large institutions.
References
- Average True Range (ATR): A technical analysis indicator that measures market volatility.
- Bollinger Bands: A volatility indicator that creates a band of three lines which are plotted in relation to a security's price.
- Iceberg Orders: Large orders divided into smaller lots to hide the actual order quantity.
Note: Always consider multiple factors when making trading decisions. Indicators provide tools, but they do not guarantee results.
Educational Content Disclaimer:
Disclaimer:
The content provided, including all code and materials, is strictly for educational and informational purposes only. It is not intended as, and should not be interpreted as, financial advice, a recommendation to buy or sell any financial instrument, or an offer of any financial product or service. All strategies, tools, and examples discussed are provided for illustrative purposes to demonstrate coding techniques and the functionality of Pine Script within a trading context.
Any results from strategies or tools provided are hypothetical, and past performance is not indicative of future results. Trading and investing involve high risk, including the potential loss of principal, and may not be suitable for all individuals. Before making any trading decisions, please consult with a qualified financial professional to understand the risks involved.
By using this script, you acknowledge and agree that any trading decisions are made solely at your discretion and risk.
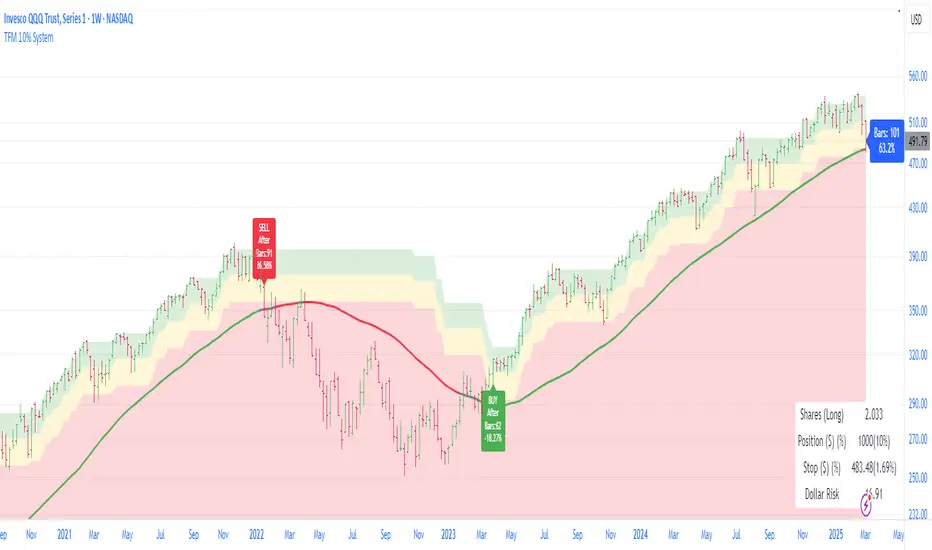
Trend Following Moron TFM 10% System
Trend Following Moron TFM 10% System
The TFM 10% Market Timing System
The Trend Following Moron TFM 10% System is a powerful trading tool designed using Pine Script™, following the principles outlined by Dave S. Landry. This script helps traders identify optimal entry and exit points based on moving averages and market trends.
What the Script Does:
Visual representation of trend strength.
As long as it is trending in green band, trend is very strong and price is contained within 5% of the high.
As price drops to yellow band, strength is weakening and caution is advised. Price is between 5% to 10% away from52 week high.
As price drops in red band, it is to be avoided as trend is rolling over. Price is more than 10% way from 52 week high.
Moving Averages Calculation:
Users can choose between Simple Moving Average (SMA) and Exponential Moving Average (EMA) for daily, weekly, and monthly periods. The script calculates the moving averages to provide trend direction.
Trend Color Coding:
Moving averages are displayed in different colors based on market conditions: green indicates an uptrend, red for a downtrend, and gray for neutral conditions.
Highs Calculation:
The script calculates the 52-week and 12-month closing highs, which are crucial for identifying potential breakout points.
Level Definition:
Traders can set levels based on either Average True Range (ATR) or percentage changes from these highs, allowing for flexible risk management strategies.
Buy and Sell Conditions:
The script defines specific buy conditions: when the price is within 10% of the highest close and trading above the moving averages, and sell conditions: when the price falls below these thresholds.
Visual Indicators:
Buy and sell signals are visually represented on the chart with arrows, making it easy for traders to see potential trading opportunities at a glance.
Performance Labels:
The script includes performance labels that track the number of bars above or below the moving averages and the percentage change from the moving average, providing users with key metrics to evaluate their trades.
Interactive Table:
A table summarizing the buy and sell rules is displayed on the chart, ensuring that traders have quick access to the system’s trading logic.
Benefits of Using the TFM 10% System:
Streamlined Decision Making:
The script simplifies the trading process by clearly outlining buy and sell signals, making it accessible even for novice traders.
Customizable Parameters:
Users can tailor the script to their preferences by adjusting moving average types and lengths, ATR levels, and percentage thresholds. Bands are interchange able for ATR and Percent below 52 week high for volatility looks. But buy and sell are fixed in 10% threshold.
Risk Management:
By utilizing ATR and percentage levels, traders can effectively manage their risk, making the trading process more systematic.
Comprehensive Market Analysis:
The combination of multiple time frames (daily, weekly, monthly) allows for a well-rounded analysis of market trends, enhancing trading accuracy.
RSI Overlay Table with Pivot-Based Divergence and SortingThis script offers an advanced RSI-based overlay table designed to identify and highlight divergences across multiple timeframes (Daily, Weekly, Monthly) for up to 13 tickers. It employs a pivot-based detection mechanism that spots positive and negative divergences, helping traders identify potential trend reversals or continuations.
Key Features
1. Pivot-Based Divergence Detection:
The script uses pivot points to identify both positive and negative divergences using the RSI indicator and price movements.
User-adjustable pivot settings enhance detection sensitivity, providing traders with an opportunity to fine-tune divergence signals for different market conditions.
2. Multi-Timeframe Analysis:
Displays RSI values along with divergence signals for daily, weekly, and monthly timeframes.
Enables traders to monitor short-term, swing, and long-term trends on a single table, providing a comprehensive view.
3. Customizable Alerts and Visual Cues:
The script generates alerts whenever a divergence is detected, ensuring timely notifications.
Overbought and oversold levels are color-coded based on user-defined thresholds, with the "P-" and "N-" prefixes indicating positive and negative divergences, respectively.
4. User-Friendly Interface:
An intuitive table design allows for easy comparison of RSI levels and divergence signals across multiple tickers.
Offers customizable table positioning options (bottom left, center, right, or middle right) for convenient chart integration.
How to Use
Input Your Tickers: Add up to 13 tickers that you wish to monitor.
Adjust Pivot Settings: Fine-tune the 'Pivot Left Bars' and 'Pivot Right Bars' to optimize the pivot detection process.
Set Overbought/Oversold Levels: Define the RSI thresholds according to your trading strategy.
Enable Alerts: Receive notifications for divergence signals detected on any timeframe.
Concepts Underlying the Calculations
The script leverages the RSI (Relative Strength Index), a popular momentum indicator, to measure the velocity and magnitude of price changes. By comparing RSI values with pivot points, the script identifies divergences that suggest potential reversals. This method ensures more reliable signals than simple bar comparisons, as it accounts for broader market movements over time.
Why This Script Is Unique
This RSI overlay script stands out due to its multi-ticker, multi-timeframe divergence analysis and the use of pivot-based detection for higher accuracy. The integration of an alert system, combined with color-coded visual cues, makes it an actionable and comprehensive tool for traders.
Turkish Translation
RSI Overlay Tablosu - Pivot Tabanlı Uyumsuzluk ve Sıralama ile
Bu script, birden fazla zaman diliminde (Günlük, Haftalık, Aylık) 13 adede kadar seçilen hisse senetleri veya varlıklar için RSI tabanlı ayrışmaları belirleyen ve vurgulayan gelişmiş bir overlay tablosu sunar. Pivot tabanlı tespit mekanizması, trend dönüşlerini veya devamlarını belirlemeye yardımcı olacak şekilde pozitif ve negatif ayrışmaları tespit eder.
Özellikler
1. Pivot Tabanlı Uyumsuzluk Tespiti:
Pivot noktalarını kullanarak RSI göstergesi ve fiyat hareketleri arasındaki pozitif ve negatif uyumsuzlukları tespit eder.
Kullanıcı ayarlı pivot ayarları, uyumsuzluk sinyallerinin hassasiyetini artırır ve farklı piyasa koşullarına uygun hale getirir.
2. Çoklu Zaman Dilimi Analizi:
Günlük, haftalık ve aylık zaman dilimlerinde RSI değerlerini ve ayrışma sinyallerini gösterir.
Kısa vadeli, orta vadeli ve uzun vadeli trendleri tek bir tabloda izlemenize olanak tanır.
3. Kullanıcı Dostu Arayüz ve Uyarılar:
Pozitif ve negatif ayrışmaları tespit ettiğinde uyarılar oluşturur.
Kullanıcı tanımlı eşiklere göre aşırı alım ve aşırı satım seviyelerini renk kodlarıyla gösterir.
Nasıl Kullanılır
İzlemek istediğiniz varlıkları ekleyin (en fazla 13 adet).
Pivot ayarlarını yapılandırarak tespit işlemini optimize edin.
RSI eşik seviyelerini belirleyin ve uyarıları etkinleştirin.

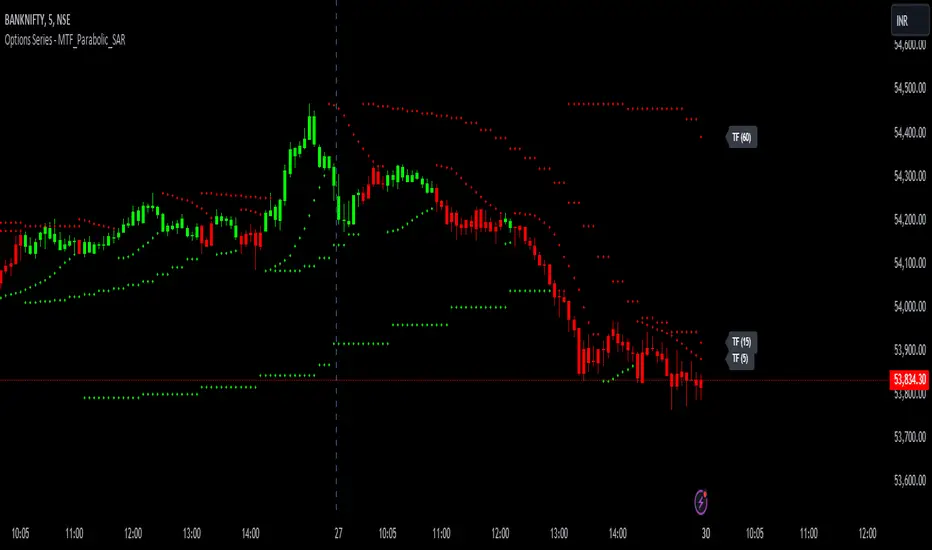
Options Series - MTF_Parabolic_SAR
⭐ Purpose of the Script
This script, titled "Options Series - MTF_Parabolic_SAR," is designed for analyzing price trends using the Parabolic SAR (Stop and Reverse) indicator across multiple timeframes (MTF). It dynamically highlights bullish and bearish conditions, helping traders identify trends with improved accuracy. The script uses the Parabolic SAR across three customizable timeframes (default: 5, 15, and 60 minutes) to gauge the market sentiment.
⭐ Key Features and Insights:
Multi-Timeframe Parabolic SAR: The script calculates the Parabolic SAR for three different timeframes ( input_tf_1 , input_tf_2 , and input_tf_3 ). Traders can configure these timeframes to match their trading style (e.g., intraday, swing).
The SAR plots adapt to the selected timeframe, helping traders see different perspectives of price movement, such as short-term and long-term trends.
Bullish and Bearish Conditions: The script determines bullish and bearish conditions by comparing the close price against the Parabolic SAR in each timeframe.
If at least one timeframe indicates a bullish condition (close price above SAR), the bars are colored green . Conversely, if one timeframe signals bearish conditions (close below SAR), the bars turn red .
This provides an at-a-glance view of the price trend across multiple timeframes, offering insights into the market's strength and direction.
Visual Enhancements: Bar Coloring: Bars are visually enhanced with a color scheme: green for bullish , red for bearish , and gray for neutral conditions. This makes it easy to spot market trends and reversals directly on the chart. Candle Plotting: The current candle is plotted with the corresponding color and labeled with the SAR values for each timeframe. This aids traders in tracking real-time price action.
Labeling of SAR Values: The script displays SAR values for each timeframe as floating labels next to the chart. These labels contain the timeframe and the exact SAR value, making it easier to reference without cluttering the chart.
⭐ Trading Advantages: Customizable and Adaptive: The customizable timeframes and SAR settings allow traders to adapt the script to various market conditions and their specific trading strategies. This flexibility provides a powerful tool for identifying entry and exit points. Multi-Timeframe Insights: By considering multiple timeframes, the script offers a comprehensive market view, making it easier to confirm strong trends and avoid false signals.
⭐ How It Helps Traders: Trend Identification: By visualizing Parabolic SAR across multiple timeframes, traders can quickly assess trend strength and direction. Reversal Detection: The script's color changes (green to red or vice versa) signal potential trend reversals, offering critical information for managing trades and reducing risk.
🚀 Conclusion:
This script provides traders with a multi-timeframe analysis tool for identifying trends and potential reversals using the Parabolic SAR. By offering customizable timeframes, clear visual cues, and SAR value labeling, it simplifies decision-making and enhances market insights.
Mean Reversion Cloud (Ornstein-Uhlenbeck) // AlgoFyreThe Mean Reversion Cloud (Ornstein-Uhlenbeck) indicator detects mean-reversion opportunities by applying the Ornstein-Uhlenbeck process. It calculates a dynamic mean using an Exponential Weighted Moving Average, surrounded by volatility bands, signaling potential buy/sell points when prices deviate.
TABLE OF CONTENTS
🔶 ORIGINALITY
🔸Adaptive Mean Calculation
🔸Volatility-Based Cloud
🔸Speed of Reversion (θ)
🔶 FUNCTIONALITY
🔸Dynamic Mean and Volatility Bands
🞘 How it works
🞘 How to calculate
🞘 Code extract
🔸Visualization via Table and Plotshapes
🞘 Table Overview
🞘 Plotshapes Explanation
🞘 Code extract
🔶 INSTRUCTIONS
🔸Step-by-Step Guidelines
🞘 Setting Up the Indicator
🞘 Understanding What to Look For on the Chart
🞘 Possible Entry Signals
🞘 Possible Take Profit Strategies
🞘 Possible Stop-Loss Levels
🞘 Additional Tips
🔸Customize settings
🔶 CONCLUSION
▅▅▅▅▅▅▅▅▅▅▅▅▅▅▅▅▅▅▅▅▅▅▅▅▅▅▅▅▅▅▅▅▅▅▅▅▅▅▅▅▅▅▅▅▅▅
🔶 ORIGINALITY The Mean Reversion Cloud (Ornstein-Uhlenbeck) is a unique indicator that applies the Ornstein-Uhlenbeck stochastic process to identify mean-reverting behavior in asset prices. Unlike traditional moving average-based indicators, this model uses an Exponentially Weighted Moving Average (EWMA) to calculate the long-term mean, dynamically adjusting to recent price movements while still considering all historical data. It also incorporates volatility bands, providing a "cloud" that visually highlights overbought or oversold conditions. By calculating the speed of mean reversion (θ) through the autocorrelation of log returns, this indicator offers traders a more nuanced and mathematically robust tool for identifying mean-reversion opportunities. These innovations make it especially useful for markets that exhibit range-bound characteristics, offering timely buy and sell signals based on statistical deviations from the mean.
🔸Adaptive Mean Calculation Traditional MA indicators use fixed lengths, which can lead to lagging signals or over-sensitivity in volatile markets. The Mean Reversion Cloud uses an Exponentially Weighted Moving Average (EWMA), which adapts to price movements by dynamically adjusting its calculation, offering a more responsive mean.
🔸Volatility-Based Cloud Unlike simple moving averages that only plot a single line, the Mean Reversion Cloud surrounds the dynamic mean with volatility bands. These bands, based on standard deviations, provide traders with a visual cue of when prices are statistically likely to revert, highlighting potential reversal zones.
🔸Speed of Reversion (θ) The indicator goes beyond price averages by calculating the speed at which the price reverts to the mean (θ), using the autocorrelation of log returns. This gives traders an additional tool for estimating the likelihood and timing of mean reversion, making the signals more reliable in practice.
🔶 FUNCTIONALITY The Mean Reversion Cloud (Ornstein-Uhlenbeck) indicator is designed to detect potential mean-reversion opportunities in asset prices by applying the Ornstein-Uhlenbeck stochastic process. It calculates a dynamic mean through the Exponentially Weighted Moving Average (EWMA) and plots volatility bands based on the standard deviation of the asset's price over a specified period. These bands create a "cloud" that represents expected price fluctuations, helping traders to identify overbought or oversold conditions. By calculating the speed of reversion (θ) from the autocorrelation of log returns, the indicator offers a more refined way of assessing how quickly prices may revert to the mean. Additionally, the inclusion of volatility provides a comprehensive view of market conditions, allowing for more accurate buy and sell signals.
Let's dive into the details:
🔸Dynamic Mean and Volatility Bands The dynamic mean (μ) is calculated using the EWMA, giving more weight to recent prices but considering all historical data. This process closely resembles the Ornstein-Uhlenbeck (OU) process, which models the tendency of a stochastic variable (such as price) to revert to its mean over time. Volatility bands are plotted around the mean using standard deviation, forming the "cloud" that signals overbought or oversold conditions. The cloud adapts dynamically to price fluctuations and market volatility, making it a versatile tool for mean-reversion strategies. 🞘 How it works Step one: Calculate the dynamic mean (μ) The Ornstein-Uhlenbeck process describes how a variable, such as an asset's price, tends to revert to a long-term mean while subject to random fluctuations. In this indicator, the EWMA is used to compute the dynamic mean (μ), mimicking the mean-reverting behavior of the OU process. Use the EWMA formula to compute a weighted mean that adjusts to recent price movements. Assign exponentially decreasing weights to older data while giving more emphasis to current prices. Step two: Plot volatility bands Calculate the standard deviation of the price over a user-defined period to determine market volatility. Position the upper and lower bands around the mean by adding and subtracting a multiple of the standard deviation. 🞘 How to calculate Exponential Weighted Moving Average (EWMA)
The EWMA dynamically adjusts to recent price movements:
mu_t = lambda * mu_{t-1} + (1 - lambda) * P_t
Where mu_t is the mean at time t, lambda is the decay factor, and P_t is the price at time t. The higher the decay factor, the more weight is given to recent data.
Autocorrelation (ρ) and Standard Deviation (σ)
To measure mean reversion speed and volatility: rho = correlation(log(close), log(close ), length) Where rho is the autocorrelation of log returns over a specified period.
To calculate volatility:
sigma = stdev(close, length)
Where sigma is the standard deviation of the asset's closing price over a specified length.
Upper and Lower Bands
The upper and lower bands are calculated as follows:
upper_band = mu + (threshold * sigma)
lower_band = mu - (threshold * sigma)
Where threshold is a multiplier for the standard deviation, usually set to 2. These bands represent the range within which the price is expected to fluctuate, based on current volatility and the mean.
🞘 Code extract // Calculate Returns
returns = math.log(close / close )
// Calculate Long-Term Mean (μ) using EWMA over the entire dataset
var float ewma_mu = na // Initialize ewma_mu as 'na'
ewma_mu := na(ewma_mu ) ? close : decay_factor * ewma_mu + (1 - decay_factor) * close
mu = ewma_mu
// Calculate Autocorrelation at Lag 1
rho1 = ta.correlation(returns, returns , corr_length)
// Ensure rho1 is within valid range to avoid errors
rho1 := na(rho1) or rho1 <= 0 ? 0.0001 : rho1
// Calculate Speed of Mean Reversion (θ)
theta = -math.log(rho1)
// Calculate Volatility (σ)
sigma = ta.stdev(close, corr_length)
// Calculate Upper and Lower Bands
upper_band = mu + threshold * sigma
lower_band = mu - threshold * sigma
🔸Visualization via Table and Plotshapes
The table shows key statistics such as the current value of the dynamic mean (μ), the number of times the price has crossed the upper or lower bands, and the consecutive number of bars that the price has remained in an overbought or oversold state.
Plotshapes (diamonds) are used to signal buy and sell opportunities. A green diamond below the price suggests a buy signal when the price crosses below the lower band, and a red diamond above the price indicates a sell signal when the price crosses above the upper band.
The table and plotshapes provide a comprehensive visualization, combining both statistical and actionable information to aid decision-making.
🞘 Code extract // Reset consecutive_bars when price crosses the mean
var consecutive_bars = 0
if (close < mu and close >= mu) or (close > mu and close <= mu)
consecutive_bars := 0
else if math.abs(deviation) > 0
consecutive_bars := math.min(consecutive_bars + 1, dev_length)
transparency = math.max(0, math.min(100, 100 - (consecutive_bars * 100 / dev_length)))
🔶 INSTRUCTIONS
The Mean Reversion Cloud (Ornstein-Uhlenbeck) indicator can be set up by adding it to your TradingView chart and configuring parameters such as the decay factor, autocorrelation length, and volatility threshold to suit current market conditions. Look for price crossovers and deviations from the calculated mean for potential entry signals. Use the upper and lower bands as dynamic support/resistance levels for setting take profit and stop-loss orders. Combining this indicator with additional trend-following or momentum-based indicators can improve signal accuracy. Adjust settings for better mean-reversion detection and risk management.
🔸Step-by-Step Guidelines
🞘 Setting Up the Indicator
Adding the Indicator to the Chart:
Go to your TradingView chart.
Click on the "Indicators" button at the top.
Search for "Mean Reversion Cloud (Ornstein-Uhlenbeck)" in the indicators list.
Click on the indicator to add it to your chart.
Configuring the Indicator:
Open the indicator settings by clicking on the gear icon next to its name on the chart.
Decay Factor: Adjust the decay factor (λ) to control the responsiveness of the mean calculation. A higher value prioritizes recent data.
Autocorrelation Length: Set the autocorrelation length (θ) for calculating the speed of mean reversion. Longer lengths consider more historical data.
Threshold: Define the number of standard deviations for the upper and lower bands to determine how far price must deviate to trigger a signal.
Chart Setup:
Select the appropriate timeframe (e.g., 1-hour, daily) based on your trading strategy.
Consider using other indicators such as RSI or MACD to confirm buy and sell signals.
🞘 Understanding What to Look For on the Chart
Indicator Behavior:
Observe how the price interacts with the dynamic mean and volatility bands. The price staying within the bands suggests mean-reverting behavior, while crossing the bands signals potential entry points.
The indicator calculates overbought/oversold conditions based on deviation from the mean, highlighted by color-coded cloud areas on the chart.
Crossovers and Deviation:
Look for crossovers between the price and the mean (μ) or the bands. A bullish crossover occurs when the price crosses below the lower band, signaling a potential buying opportunity.
A bearish crossover occurs when the price crosses above the upper band, suggesting a potential sell signal.
Deviations from the mean indicate market extremes. A large deviation indicates that the price is far from the mean, suggesting a potential reversal.
Slope and Direction:
Pay attention to the slope of the mean (μ). A rising slope suggests bullish market conditions, while a declining slope signals a bearish market.
The steepness of the slope can indicate the strength of the mean-reversion trend.
🞘 Possible Entry Signals
Bullish Entry:
Crossover Entry: Enter a long position when the price crosses below the lower band with a positive deviation from the mean.
Confirmation Entry: Use additional indicators like RSI (above 50) or increasing volume to confirm the bullish signal.
Bearish Entry:
Crossover Entry: Enter a short position when the price crosses above the upper band with a negative deviation from the mean.
Confirmation Entry: Look for RSI (below 50) or decreasing volume to confirm the bearish signal.
Deviation Confirmation:
Enter trades when the deviation from the mean is significant, indicating that the price has strayed far from its expected value and is likely to revert.
🞘 Possible Take Profit Strategies
Static Take Profit Levels:
Set predefined take profit levels based on historical volatility, using the upper and lower bands as guides.
Place take profit orders near recent support/resistance levels, ensuring you're capitalizing on the mean-reversion behavior.
Trailing Stop Loss:
Use a trailing stop based on a percentage of the price deviation from the mean to lock in profits as the trend progresses.
Adjust the trailing stop dynamically along the calculated bands to protect profits as the price returns to the mean.
Deviation-Based Exits:
Exit when the deviation from the mean starts to decrease, signaling that the price is returning to its equilibrium.
🞘 Possible Stop-Loss Levels
Initial Stop Loss:
Place an initial stop loss outside the lower band (for long positions) or above the upper band (for short positions) to protect against excessive deviations.
Use a volatility-based buffer to avoid getting stopped out during normal price fluctuations.
Dynamic Stop Loss:
Move the stop loss closer to the mean as the price converges back towards equilibrium, reducing risk.
Adjust the stop loss dynamically along the bands to account for sudden market movements.
🞘 Additional Tips
Combine with Other Indicators:
Enhance your strategy by combining the Mean Reversion Cloud with momentum indicators like MACD, RSI, or Bollinger Bands to confirm market conditions.
Backtesting and Practice:
Backtest the indicator on historical data to understand how it performs in various market environments.
Practice using the indicator on a demo account before implementing it in live trading.
Market Awareness:
Keep an eye on market news and events that might cause extreme price movements. The indicator reacts to price data and might not account for news-driven events that can cause large deviations.
🔸Customize settings 🞘 Decay Factor (λ): Defines the weight assigned to recent price data in the calculation of the mean. A value closer to 1 places more emphasis on recent prices, while lower values create a smoother, more lagging mean.
🞘 Autocorrelation Length (θ): Sets the period for calculating the speed of mean reversion and volatility. Longer lengths capture more historical data, providing smoother calculations, while shorter lengths make the indicator more responsive.
🞘 Threshold (σ): Specifies the number of standard deviations used to create the upper and lower bands. Higher thresholds widen the bands, producing fewer signals, while lower thresholds tighten the bands for more frequent signals.
🞘 Max Gradient Length (γ): Determines the maximum number of consecutive bars for calculating the deviation gradient. This setting impacts the transparency of the plotted bands based on the length of deviation from the mean.
🔶 CONCLUSION
The Mean Reversion Cloud (Ornstein-Uhlenbeck) indicator offers a sophisticated approach to identifying mean-reversion opportunities by applying the Ornstein-Uhlenbeck stochastic process. This dynamic indicator calculates a responsive mean using an Exponentially Weighted Moving Average (EWMA) and plots volatility-based bands to highlight overbought and oversold conditions. By incorporating advanced statistical measures like autocorrelation and standard deviation, traders can better assess market extremes and potential reversals. The indicator’s ability to adapt to price behavior makes it a versatile tool for traders focused on both short-term price deviations and longer-term mean-reversion strategies. With its unique blend of statistical rigor and visual clarity, the Mean Reversion Cloud provides an invaluable tool for understanding and capitalizing on market inefficiencies.

Relative volume zone + Smart Order Flow Dynamic S/ROverview:
The Relative Volume Zone + Smart Order Flow with Dynamic S/R indicator is designed to help traders identify key trading opportunities by combining multiple technical components. This script integrates relative volume analysis, order flow detection, VWAP, RSI filtering, and dynamic support and resistance levels to offer a comprehensive view of the market conditions. It is particularly effective on shorter timeframes (M5, M15), making it suitable for scalping and day trading strategies.
Key Components:
1. Relative Volume Zones:
• The script calculates the relative volume by comparing the current volume with the average volume over a defined lookback period (volLookback). When the relative volume exceeds a specified multiplier (volMultiplier), it indicates a high volume zone, signaling potential accumulation or distribution areas.
• Purpose: Identifies high-volume trading zones that may act as significant support or resistance, indicating possible entry or exit points.
2. Smart Order Flow Analysis:
• The indicator uses Volume Delta (the difference between buying and selling volume) and a Cumulative Delta to detect order imbalances in the market.
• Order Imbalance is identified using a moving average of the Volume Delta (orderImbalance), which helps highlight hidden buying or selling pressure.
• Purpose: Reveals market sentiment by showing whether buyers or sellers dominate the market, aiding in the identification of trend reversals or continuations.
3. VWAP (Volume Weighted Average Price):
• VWAP is calculated over a default daily length (vwapLength) to show the average price a security has traded at throughout the day, based on both volume and price.
• Purpose: Provides insight into the fair value of the asset, indicating whether the market is in an accumulation or distribution phase.
4. RSI (Relative Strength Index) Filter:
• RSI is used to filter buy and sell signals, preventing trades in overbought or oversold conditions. It is calculated using a specified period (rsiPeriod).
• Purpose: Reduces false signals and improves trade accuracy by only allowing trades when RSI conditions align with volume and order flow signals.
5. Dynamic Support and Resistance Levels:
• The script dynamically plots support and resistance levels based on recent swing highs and lows (swingLookback).
• Purpose: Identifies potential reversal zones where price action may change direction, allowing for more precise entry and exit points.
How It Works:
• Buy Signal:
A buy signal is generated when:
• The price enters a high-volume zone.
• The price crosses above a 5-period moving average.
• The cumulative delta shows more buying pressure (cumulativeDelta > SMA of cumulativeDelta).
• The RSI is below 70 (not in overbought conditions).
• Sell Signal:
A sell signal is generated when:
• The price enters a high-volume zone.
• The price crosses below a 5-period moving average.
• The cumulative delta shows more selling pressure (cumulativeDelta < SMA of cumulativeDelta).
• The RSI is above 30 (not in oversold conditions).
• Dynamic Support and Resistance Lines:
Drawn based on recent swing highs and lows, these lines provide context for potential price reversals or breakouts.
• VWAP and Order Imbalance Lines:
Plotted to show the average traded price and highlight order flow shifts, helping to validate buy/sell signals.
How to Use:
1. Apply the Indicator:
Add the script to your chart and adjust the settings to match your trading style and preferred timeframe (optimized for M5/M15).
2. Interpret the Signals:
Use the buy and sell signals in conjunction with dynamic support/resistance, VWAP, and order imbalance lines to identify high-probability trade setups.
3. Monitor Alerts:
Set alerts for significant order flow events to receive notifications when there is a positive or negative order imbalance, indicating potential market shifts.
What Makes It Unique:
This script is unique because it combines multiple market analysis tools — relative volume zones, smart order flow, VWAP, RSI filtering, and dynamic support/resistance — to provide a well-rounded, multi-dimensional view of the market. This integration allows traders to make more informed decisions by validating signals across various indicators, enhancing overall trading accuracy and effectiveness.

Dynamic Volume RSI (DVRSI) [QuantAlgo]Introducing the Dynamic Volume RSI (DVRSI) by QuantAlgo 📈✨
Elevate your trading and investing strategies with the Dynamic Volume RSI (DVRSI) , a powerful tool designed to provide clear insights into market momentum and trend shifts. This indicator is ideal for traders and investors who want to stay ahead of the curve by using volume-responsive calculations and adaptive smoothing techniques to enhance signal clarity and reliability.
🌟 Key Features:
🛠 Customizable RSI Settings: Tailor the indicator to your strategy by adjusting the RSI length and price source. Whether you’re focused on short-term trades or long-term investments, DVRSI adapts to your needs.
🌊 Adaptive Smoothing: Enable adaptive smoothing to filter out market noise and ensure cleaner signals in volatile or choppy market conditions.
🎨 Dynamic Color-Coding: Easily identify bullish and bearish trends with color-coded candles and RSI plots, offering clear visual cues to track market direction.
⚖️ Volume-Responsive Adjustments: The DVRSI reacts to volume changes, giving greater significance to high-volume price moves and improving the accuracy of trend detection.
🔔 Custom Alerts: Stay informed with alerts for key RSI crossovers and trend changes, allowing you to act quickly on emerging opportunities.
📈 How to Use:
✅ Add the Indicator: Set up the DVRSI by adding it to your chart and customizing the RSI length, price source, and smoothing options to fit your specific strategy.
👀 Monitor Visual Cues: Watch for trend shifts through the color-coded plot and candles, signaling changes in momentum as the RSI crosses key levels.
🔔 Set Alerts: Configure alerts for critical RSI crossovers, such as the 50 line, ensuring you stay on top of potential market reversals and opportunities.
🔍 How It Works:
The Dynamic Volume RSI (DVRSI) is a unique indicator designed to provide more accurate and responsive signals by incorporating both price movement and volume sensitivity into the RSI framework. It begins by calculating the traditional RSI values based on a user-defined length and price source, but unlike standard RSI tools, the DVRSI applies volume-weighted adjustments to reflect the strength of market participation.
The indicator dynamically adjusts its sensitivity by factoring in volume to the RSI calculation, which means that price moves backed by higher volumes carry more weight, making the signal more reliable. This method helps identify stronger trends and reduces the risk of false signals in low-volume environments. To further enhance accuracy, the DVRSI offers an adaptive smoothing option that allows users to reduce noise during periods of market volatility. This adaptive smoothing function responds to market conditions, providing a cleaner signal by reducing erratic movements or price spikes that could lead to misleading signals.
Additionally, the DVRSI uses dynamic color-coding to visually represent the strength of bullish or bearish trends. The candles and RSI plots change color based on the RSI values crossing critical thresholds, such as the 50 level, offering an intuitive way to recognize trend shifts. Traders can also configure alerts for specific RSI crossovers (e.g., above 50 or below 40), ensuring that they stay informed of potential trend reversals and significant market shifts in real-time.
The combination of volume sensitivity, adaptive smoothing, and dynamic trend visualization makes the DVRSI a robust and versatile tool for traders and investors looking to fine-tune their market analysis. By incorporating both price and volume data, this indicator delivers more precise signals, helping users make informed decisions with greater confidence.
Disclaimer:
The Dynamic Volume RSI is designed to enhance your market analysis but should not be used as a sole decision-making tool. Always consider multiple factors before making any trading or investment decisions. Past performance is not indicative of future results.

Sinc Bollinger BandsKaiser Windowed Sinc Bollinger Bands Indicator
The Kaiser Windowed Sinc Bollinger Bands indicator combines the advanced filtering capabilities of the Kaiser Windowed Sinc Moving Average with the volatility measurement of Bollinger Bands. This indicator represents a sophisticated approach to trend identification and volatility analysis in financial markets.
Core Components
At the heart of this indicator is the Kaiser Windowed Sinc Moving Average, which utilizes the sinc function as an ideal low-pass filter, windowed by the Kaiser function. This combination allows for precise control over the frequency response of the moving average, effectively separating trend from noise in price data.
The sinc function, representing an ideal low-pass filter, provides the foundation for the moving average calculation. By using the sinc function, analysts can independently control two critical parameters: the cutoff frequency and the number of samples used. The cutoff frequency determines which price movements are considered significant (low frequency) and which are treated as noise (high frequency). The number of samples influences the filter's accuracy and steepness, allowing for a more precise approximation of the ideal low-pass filter without altering its fundamental frequency response characteristics.
The Kaiser window is applied to the sinc function to create a practical, finite-length filter while minimizing unwanted oscillations in the frequency domain. The alpha parameter of the Kaiser window allows users to fine-tune the trade-off between the main-lobe width and side-lobe levels in the frequency response.
Bollinger Bands Implementation
Building upon the Kaiser Windowed Sinc Moving Average, this indicator adds Bollinger Bands to provide a measure of price volatility. The bands are calculated by adding and subtracting a multiple of the standard deviation from the moving average.
Advanced Centered Standard Deviation Calculation
A unique feature of this indicator is its specialized standard deviation calculation for the centered mode. This method employs the Kaiser window to create a smooth deviation that serves as an highly effective envelope, even though it's always based on past data.
The centered standard deviation calculation works as follows:
It determines the effective sample size of the Kaiser window.
The window size is then adjusted to reflect the target sample size.
The source data is offset in the calculation to allow for proper centering.
This approach results in a highly accurate and smooth volatility estimation. The centered standard deviation provides a more refined and responsive measure of price volatility compared to traditional methods, particularly useful for historical analysis and backtesting.
Operational Modes
The indicator offers two operational modes:
Non-Centered (Real-time) Mode: Uses half of the windowed sinc function and a traditional standard deviation calculation. This mode is suitable for real-time analysis and current market conditions.
Centered Mode: Utilizes the full windowed sinc function and the specialized Kaiser window-based standard deviation calculation. While this mode introduces a delay, it offers the most accurate trend and volatility identification for historical analysis.
Customizable Parameters
The Kaiser Windowed Sinc Bollinger Bands indicator provides several key parameters for customization:
Cutoff: Controls the filter's cutoff frequency, determining the divide between trends and noise.
Number of Samples: Sets the number of samples used in the FIR filter calculation, affecting the filter's accuracy and computational complexity.
Alpha: Influences the shape of the Kaiser window, allowing for fine-tuning of the filter's frequency response characteristics.
Standard Deviation Length: Determines the period over which volatility is calculated.
Multiplier: Sets the number of standard deviations used for the Bollinger Bands.
Centered Alpha: Specific to the centered mode, this parameter affects the Kaiser window used in the specialized standard deviation calculation.
Visualization Features
To enhance the analytical value of the indicator, several visualization options are included:
Gradient Coloring: Offers a range of color schemes to represent trend direction and strength for the moving average line.
Glow Effect: An optional visual enhancement for improved line visibility.
Background Fill: Highlights the area between the Bollinger Bands, aiding in volatility visualization.
Applications in Technical Analysis
The Kaiser Windowed Sinc Bollinger Bands indicator is particularly useful for:
Precise trend identification with reduced noise influence
Advanced volatility analysis, especially in the centered mode
Identifying potential overbought and oversold conditions
Recognizing periods of price consolidation and potential breakouts
Compared to traditional Bollinger Bands, this indicator offers superior frequency response characteristics in its moving average and a more refined volatility measurement, especially in centered mode. These features allow for a more nuanced analysis of price trends and volatility patterns across various market conditions and timeframes.
Conclusion
The Kaiser Windowed Sinc Bollinger Bands indicator represents a significant advancement in technical analysis tools. By combining the ideal low-pass filter characteristics of the sinc function, the practical benefits of Kaiser windowing, and an innovative approach to volatility measurement, this indicator provides traders and analysts with a sophisticated instrument for examining price trends and market volatility.
Its implementation in Pine Script contributes to the TradingView community by making advanced signal processing and statistical techniques accessible for experimentation and further development in technical analysis. This indicator serves not only as a practical tool for market analysis but also as an educational resource for those interested in the intersection of signal processing, statistics, and financial markets.
Related:
Uptrick: Momentum-Volatility Composite Signal### Title: Uptrick: Momentum-Volatility Composite Signal
### Overview
The "Uptrick: Momentum-Volatility Composite Signal" is an innovative trading tool designed to offer traders a sophisticated synthesis of momentum, volatility, volume flow, and trend detection into a single comprehensive indicator. This tool stands out by providing an integrated view of market dynamics, which is critical for identifying potential trading opportunities with greater precision and confidence. Its unique approach differentiates it from traditional indicators available on the TradingView platform, making it a valuable asset for traders aiming to enhance their market analysis.
### Unique Features
This indicator integrates multiple crucial elements of market behavior:
- Momentum Analysis : Utilizes Rate of Change (ROC) metrics to assess the speed and strength of market movements.
- Volatility Tracking : Incorporates Average True Range (ATR) metrics to measure market volatility, aiding in risk assessment.
- Volume Flow Analysis : Analyzes shifts in volume to detect buying or selling pressure, adding depth to market understanding.
- Trend Detection : Uses the difference between short-term and long-term Exponential Moving Averages (EMA) to detect market trends, providing insights into potential reversals or confirmations.
Customization and Inputs
The Uptrick indicator offers a variety of user-defined settings tailored to fit different trading styles and strategies, enhancing its adaptability across various market conditions:
Rate of Change Length (rocLength) : This setting defines the period over which momentum is calculated. Shorter periods may be preferred by day traders who need to respond quickly to market changes, while longer periods could be better suited for position traders looking at more extended trends.
ATR Length (atrLength) : Adjusts the timeframe for assessing volatility. A shorter ATR length can help day traders manage the quick shifts in market volatility, whereas longer lengths might be more applicable for swing or position traders who deal with longer-term market movements.
Volume Flow Length (volumeFlowLength): Determines the analysis period for volume flow to identify buying or selling pressure. Day traders might opt for shorter periods to catch rapid volume changes, while longer periods could serve swing traders to understand the accumulation or distribution phases better.
Short EMA Length (shortEmaLength): Specifies the period for the short-term EMA, crucial for trend detection. Shorter lengths can aid day traders in spotting immediate trend shifts, whereas longer lengths might help swing traders in identifying more sustainable trend changes.
Long EMA Length (longEmaLength): Sets the period for the long-term EMA, which is useful for observing longer-term market trends. This setting is particularly valuable for position traders who need to align with the broader market direction.
Composite Signal Moving Average Length (maLength): This parameter sets the smoothing period for the composite signal's moving average, helping to reduce noise in the signal output. A shorter moving average length can be beneficial for day traders reacting to market conditions swiftly, while a longer length might help swing and position traders in smoothing out less significant fluctuations to focus on significant trends.
These customization options ensure that traders can fine-tune the Uptrick indicator to their specific trading needs, whether they are scanning for quick opportunities or analyzing more prolonged market trends.
### Functionality Details
The indicator operates through a sophisticated algorithm that integrates multiple market dimensions:
1. Momentum and Volatility Calculation : Combines ROC and ATR to gauge the market’s momentum and stability.
2. Volume and Trend Analysis : Integrates volume data with EMAs to provide a comprehensive view of current market trends and potential shifts.
3. Signal Composite : Each component is normalized and combined into a composite signal, offering traders a nuanced perspective on when to enter or exit trades.
The indicator performs its calculations as follows:
Momentum and Volatility Calculation:
roc = ta.roc(close, rocLength)
atr = ta.atr(atrLength)
Volume and Trend Analysis:
volumeFlow = ta.cum(volume) - ta.ema(ta.cum(volume), volumeFlowLength)
emaShort = ta.ema(close, shortEmaLength)
emaLong = ta.ema(close, longEmaLength)
emaDifference = emaShort - emaLong
Composite Signal Calculation:
Normalizes each component (ROC, ATR, volume flow, EMA difference) and combines them into a composite signal:
rocNorm = (roc - ta.sma(roc, rocLength)) / ta.stdev(roc, rocLength)
atrNorm = (atr - ta.sma(atr, atrLength)) / ta.stdev(atr, atrLength)
volumeFlowNorm = (volumeFlow - ta.sma(volumeFlow, volumeFlowLength)) / ta.stdev(volumeFlow, volumeFlowLength)
emaDiffNorm = (emaDifference - ta.sma(emaDifference, longEmaLength)) / ta.stdev(emaDifference, longEmaLength)
compositeSignal = (rocNorm + atrNorm + volumeFlowNorm + emaDiffNorm) / 4
### Originality
The originality of the Uptrick indicator lies in its ability to merge diverse market metrics into a unified signal. This multi-faceted approach goes beyond traditional indicators by offering a deeper, more holistic analysis of market conditions, providing traders with insights that are not only based on price movements but also on underlying market dynamics.
### Practical Application
The Uptrick indicator excels in environments where understanding the interplay between volume, momentum, and volatility is crucial. It is especially useful for:
- Day Traders : Can leverage real-time data to make quick decisions based on sudden market changes.
- Swing Traders : Benefit from understanding medium-term trends to optimize entry and exit points.
- Position Traders : Utilize long-term market trend data to align with overall market movements.
### Best Practices
To maximize the effectiveness of the Uptrick indicator, consider the following:
- Combine with Other Indicators : Use alongside other technical tools like RSI or MACD for additional validation.
- Adapt Settings to Market Conditions : Adjust the indicator settings based on the asset and market volatility to improve signal accuracy.
- Risk Management : Implement robust risk management strategies, including setting stop-loss orders based on the volatility measured by the ATR.
### Practical Examples and Demonstrations
- Example for Day Trading : In a volatile market, a trader notices a sharp increase in the momentum score coinciding with a surge in volume but stable volatility, signaling a potential bullish breakout.
- Example for Swing Trading : On a 4-hour chart, the indicator shows a gradual alignment of decreasing volatility and increasing buying volume, suggesting a strengthening upward trend suitable for a long position.
### Alerts and Their Uses
- Alert Configurations : Set alerts for when the composite score crosses predefined thresholds to capture potential buy or sell events.
- Strategic Application : Use alerts to stay informed of significant market moves without the need to continuously monitor the markets, enabling timely and informed trading decisions.
Technical Notes
Efficiency and Compatibility: The indicator is designed for efficiency, running smoothly across different trading platforms including TradingView, and can be easily integrated with existing trading setups. It leverages advanced mathematical models for normalizing and smoothing data, ensuring consistent and reliable signal quality across different market conditions.
Limitations : The effectiveness of the Uptrick indicator can vary significantly across different market conditions and asset classes. It is designed to perform best in liquid markets where data on volume, volatility, and price trends are readily available and reliable. Traders should be aware that in low-liquidity or highly volatile markets, the signals might be less reliable and require additional confirmation.
Usage Recommendations : While the Uptrick indicator is a powerful tool, it is recommended to use it in conjunction with other analysis methods to confirm signals. Traders should also continuously monitor the performance and adjust settings as needed to align with their specific trading strategies and market conditions.
### Conclusion
The "Uptrick: Momentum-Volatility Composite Signal" is a revolutionary tool that offers traders an advanced methodology for analyzing market dynamics. By combining momentum, volatility, volume, and trend detection into a single, cohesive indicator, it provides a powerful, actionable insight into market movements, making it an indispensable tool for traders aiming to optimize their trading strategies.

Ewma | viResearchEwma | viResearch
Conceptual Foundation and Innovation
The "Ewma" indicator from viResearch combines the benefits of the Exponentially Weighted Moving Average (EWMA) with the Weighted Moving Average (WMA) to offer traders a more responsive and precise method for trend-following. The EWMA applies greater weight to recent price data, allowing the indicator to adapt quickly to market changes while filtering out short-term fluctuations. By incorporating both EWMA and WMA, this script provides a smoother and more accurate representation of market trends, making it ideal for identifying potential trend shifts and improving trade timing.
This dual-layer smoothing process enables traders to follow market trends with greater accuracy and sensitivity, allowing them to respond quickly to price movements while minimizing the impact of market noise.
Technical Composition and Calculation
The "Ewma" script uses a combination of WMA and EWMA to smooth out price data. First, a WMA is applied to the selected source price over a user-defined length. This WMA is then used as the input for calculating the EWMA, further smoothing the trend and reducing lag. The EWMA is calculated over the same user-defined length, ensuring consistency between the two smoothing processes. This layered approach helps generate more reliable signals for trend changes, as it reduces the influence of short-term price volatility while maintaining responsiveness to significant price movements.
The script monitors whether the current EWMA value is higher or lower than the previous value, generating a trend signal based on this comparison. If the EWMA is higher than the previous bar, it signals a potential upward trend, while a lower EWMA indicates a possible downward trend.
Features and User Inputs
The "Ewma" script offers several customizable inputs, allowing traders to fine-tune the indicator to suit their trading strategies. The Length input controls the period over which both the WMA and EWMA are calculated, affecting how responsive or smooth the indicator is. Additionally, the script includes built-in alert conditions, notifying traders when a trend shift occurs, either to the upside or downside.
Practical Applications
The "Ewma" indicator is designed for traders who want to capture market trends more accurately while reducing the noise from short-term price fluctuations. The dual smoothing of the EWMA helps traders identify potential trend reversals with greater clarity, allowing for earlier and more informed trade entries and exits. By smoothing price data while maintaining responsiveness, the "Ewma" indicator enhances traditional trend-following methods, making it easier to stay aligned with longer-term market trends. The adjustable length setting allows traders to adapt the indicator to various market conditions, whether they prefer faster signals for short-term trading or slower, smoother signals for long-term trend analysis.
Advantages and Strategic Value
The "Ewma" script offers a significant advantage by combining the WMA with the EWMA, delivering a smoother and more responsive trend indicator. This combination helps traders reduce the impact of short-term volatility while maintaining the ability to react quickly to significant price changes. By offering an adaptable and reliable method for trend-following, the "Ewma" indicator helps traders optimize their market positioning and improve the accuracy of their trading strategies.
Alerts and Visual Cues
The script includes alert conditions that notify traders when a significant trend change occurs. The "Ewma Long" alert is triggered when the EWMA crosses above its previous value, indicating a potential upward trend. The "Ewma Short" alert signals a possible downward trend when the EWMA crosses below its previous value. Visual cues, such as changes in the EWMA line color, provide traders with clear and actionable information in real time.
Summary and Usage Tips
The "Ewma | viResearch" indicator provides traders with a powerful tool for trend analysis by combining the benefits of WMA and EWMA smoothing. By incorporating this script into your trading strategy, you can improve your ability to detect trend shifts, confirm trend direction, and reduce noise from short-term price fluctuations. Whether you’re focused on short-term market moves or long-term trends, the "Ewma" indicator offers a reliable and customizable solution for traders at all levels.
Note: Backtests are based on past results and are not indicative of future performance.

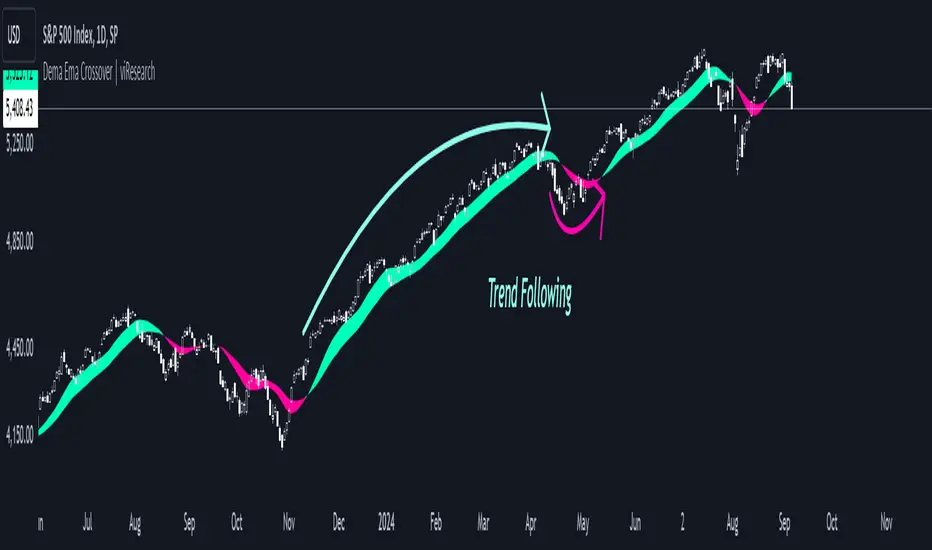
Dema Ema Crossover | viResearchDema Ema Crossover | viResearch
Conceptual Foundation and Innovation
The "Dema Ema Crossover" indicator combines the strengths of the Double Exponential Moving Average (DEMA) with an Exponential Moving Average (EMA) crossover strategy. The DEMA is well-known for its ability to reduce lag compared to standard moving averages, offering smoother trend-following signals. In this script, the DEMA is used as the foundation, with two EMAs applied on top of it to further refine the trend detection and crossover points. This combination provides traders with a robust tool for identifying trend shifts and potential entry or exit points.
By leveraging the faster responsiveness of the DEMA and using EMA crossovers, the "Dema Ema Crossover" indicator helps traders detect and act on trend reversals more efficiently, making it a powerful solution for capturing both short- and long-term market movements.
Technical Composition and Calculation
The "Dema Ema Crossover" script consists of three main components: the Double Exponential Moving Average (DEMA), the fast EMA, and the slow EMA. The DEMA is calculated based on the selected length and source price, providing a smooth representation of market trends. Two EMAs are then applied to the DEMA, with one being faster (shorter period) and the other slower (longer period). The crossover between these two EMAs generates the signals for trend changes.
For the DEMA, the calculation uses the ta.dema function, which reduces lag while maintaining smoothness in the moving average. The fast and slow EMAs are calculated using the ta.ema function, with the fast EMA responding more quickly to price changes, while the slow EMA captures broader trends. The crossover between these two EMAs is used to generate buy and sell signals based on the direction of the crossover.
Features and User Inputs
The "Dema Ema Crossover" script offers several customizable inputs that allow traders to tailor the indicator to their trading strategies. The DEMA Length controls how smooth the DEMA is, with a longer length creating a slower-moving average and a shorter length providing a more responsive one. The Fast EMA Length and Slow EMA Length are also customizable, allowing traders to adjust the sensitivity of the crossover signals based on their market outlook and preferred trading timeframe.
Practical Applications
The "Dema Ema Crossover" indicator is designed for traders looking for a reliable crossover strategy that combines the responsiveness of the DEMA with the precision of EMA crossovers. This tool is particularly effective for:
Identifying Trend Reversals: The crossover between the fast and slow EMAs applied to the DEMA provides early signals of potential trend reversals, allowing traders to position themselves in the market more effectively. Confirming Trend Direction: The combined effect of the DEMA and EMA crossovers helps confirm the strength of a trend, improving decision-making around trade entries and exits. Adapting to Different Market Conditions: The customizable parameters allow traders to adjust the sensitivity of the crossover signals, making the indicator suitable for both fast-moving markets and slower, trending environments.
Advantages and Strategic Value
The "Dema Ema Crossover" script offers a significant advantage by combining the smoothness of the DEMA with the accuracy of EMA crossovers. The DEMA’s ability to reduce lag while maintaining responsiveness makes it ideal for trend-following strategies, while the crossover between the fast and slow EMAs provides precise entry and exit points. This combination reduces false signals and helps traders adapt to changing market conditions, resulting in a more reliable and efficient trend-following system.
Alerts and Visual Cues
The script includes alert conditions to notify traders of key crossover events. The "Dema Ema Crossover Long" alert is triggered when the fast EMA crosses above the slow EMA, signaling a potential upward trend. Conversely, the "Dema Ema Crossover Short" alert signals a possible downward trend when the fast EMA crosses below the slow EMA. Visual cues such as colored fills between the two EMAs highlight these crossover points on the chart, helping traders quickly identify trend shifts.
Summary and Usage Tips
The "Dema Ema Crossover | viResearch" indicator provides traders with a powerful combination of the DEMA and EMA crossovers, offering a smooth yet responsive tool for detecting trend reversals and confirming trend direction. By incorporating this script into your trading strategy, you can improve your ability to capture trend changes with greater accuracy, reducing the impact of market noise. Whether you are focused on short-term market moves or long-term trends, the "Dema Ema Crossover" indicator offers a flexible and reliable solution for traders at all levels.
Note: Backtests are based on past results and are not indicative of future performance.
Kalman PSaR [BackQuant]Kalman PSaR
Overview and Innovation
The Kalman PSaR combines the well-known Parabolic SAR (PSaR) with the advanced smoothing capabilities of the Kalman Filter . This innovative tool aims to enhance the traditional PSaR by integrating Kalman filtering, which reduces noise and improves trend detection. The Kalman PSaR adapts dynamically to price movements, making it a highly effective indicator for spotting trend shifts while minimizing the impact of false signals caused by market volatility.
Please Find the Basic Kalman Here:
Kalman Filter Dynamics
The Kalman Filter is a powerful algorithm for estimating the true value of a system amidst noisy data. In the Kalman PSaR, this filter is applied to the high, low, and closing prices, resulting in a smoother and more accurate representation of price action. The filter’s parameters—process noise and measurement noise—are customizable, allowing traders to fine-tune the sensitivity of the indicator to market conditions. By reducing the impact of noise, the Kalman-filtered PSaR offers clearer signals for identifying trend reversals and continuations.
Enhanced PSaR Calculation
The traditional Parabolic SAR is a popular trend-following indicator that highlights potential entry and exit points based on price acceleration. In the Kalman PSaR, this calculation is enhanced by the Kalman-filtered prices, providing a smoother and more reliable signal. The indicator continuously updates based on the acceleration factor and max step values, while the Kalman filter ensures that sudden price spikes or market noise do not trigger false signals.
Min Step and Max Step: These settings control the sensitivity of the PSaR. The Min Step sets the initial acceleration factor, while the Max Step limits how fast the PSaR adapts to price changes, helping traders fine-tune the indicator’s responsiveness.
Optional Smoothing Techniques To further enhance the signal clarity, the Kalman PSaR includes an optional smoothing feature. Traders can choose from various smoothing methods, such as SMA, Hull, EMA, WMA, TEMA, and more, to reduce short-term fluctuations and emphasize the underlying trend. The smoothing period is customizable, allowing traders to adjust the indicator’s behavior according to their preferred trading style and timeframe.
Color-Coded Candle Painting The Kalman PSaR features color-coded candles that change according to the trend direction. When the price is above the PSaR, candles are painted green to indicate a long trend, and when the price is below the PSaR, candles are painted red to signal a short trend. This visual representation makes it easy to interpret market sentiment at a glance, improving decision-making speed during fast-moving markets.
Key Features and Customization
Kalman Filter Customization: The process noise and measurement noise parameters allow traders to adjust how aggressively the filter adapts to price changes, making it suitable for both volatile and stable markets.
Smoothing Options: A variety of moving average types, such as SMA, Hull, EMA, and more, can be applied to smooth the PSaR values, ensuring that the signal remains clear even in choppy markets.
Dynamic Trend Detection: The Kalman PSaR dynamically updates based on price movements, helping traders spot trend reversals early while filtering out false signals caused by short-term volatility.
Bar Coloring and PSaR Plotting: Traders can choose to color candles based on trend direction or plot the PSaR directly on the chart for additional visual clarity.
Practical Applications
Trend-Following Strategies: The Kalman PSaR excels in trend-following strategies by providing timely signals of trend changes. The dynamic nature of the indicator allows traders to capture significant price movements while avoiding market noise.
Reversal Identification: The indicator’s ability to filter out noise and provide smoother signals makes it ideal for identifying reversals in volatile markets.
Risk Management: By plotting clear stop levels based on the PSaR, traders can use this indicator to effectively manage risk, placing stop-loss orders at key points based on the trend direction.
Conclusion
The Kalman PSaR is a fusion of the classic Parabolic SAR and the Kalman filter, offering enhanced trend detection with reduced noise. Its customizable filtering and smoothing options, combined with dynamic trend-following capabilities, make it a versatile tool for traders seeking to improve their timing and signal accuracy. The adaptive nature of the Kalman filter, combined with the robust PSaR logic, helps traders stay on the right side of the market and manage risk more effectively.

Dema Supertrend | viResearchDema Supertrend | viResearch
Conceptual Foundation and Innovation
The "Dema Supertrend" indicator by viResearch combines the benefits of the Double Exponential Moving Average (DEMA) with the popular Supertrend method to provide an advanced tool for trend detection and volatility management. By integrating DEMA into the Supertrend calculation, the indicator reduces lag while enhancing responsiveness to market changes. This results in more accurate trend identification and a refined method for capturing directional movements.
Technical Composition and Calculation
The "Dema Supertrend" builds on the core principles of the Supertrend indicator by incorporating DEMA for smoother and more responsive trend detection. The key innovation lies in replacing the raw price data with the DEMA-smoothed values, allowing traders to identify trends with reduced noise and enhanced precision.
DEMA and ATR-Based Supertrend Calculation:
DEMA Calculation (demalen): The Double Exponential Moving Average is applied to the price data (hlc3 by default) over a user-defined length, providing a smoothed representation of the market trend. DEMA minimizes lag compared to simple or exponential moving averages, allowing for more timely trend identification.
Supertrend Bands (u, l): The Supertrend upper and lower bands are calculated by adding or subtracting a multiple of the Average True Range (ATR) from the DEMA value. These bands dynamically adjust to market volatility, acting as support and resistance levels to guide trading decisions.
Trend Logic (L, S): The script determines whether the price is above or below the bands to signal an uptrend (L) or downtrend (S). Crosses above or below these bands trigger visual alerts and trend changes, with alerts built in for potential long or short positions.
Trend Continuation and Reversal:
The indicator ensures that once a trend is identified, it persists until clear reversal criteria are met. This is achieved through a comparison of the current and previous values of the Supertrend bands, reducing the occurrence of false signals in volatile markets.
Features and User Inputs
The "Dema Supertrend" script offers a range of customizable options, allowing traders to tailor the indicator to different market conditions and trading strategies:
Supertrend Length: The length of the Supertrend period can be adjusted, allowing traders to control the sensitivity of the trend detection.
Multiplier: The ATR multiplier adjusts the distance between the DEMA and the Supertrend bands. A higher multiplier reduces the frequency of trend changes, while a lower multiplier increases sensitivity to price movements.
DEMA Length: The length of the DEMA calculation can be customized to smooth price data over different timeframes, helping traders capture long-term trends or short-term movements more effectively.
Practical Applications
The "Dema Supertrend" is an ideal tool for traders who seek to follow trends while minimizing the impact of market noise. Its combination of DEMA and Supertrend provides a clear, dynamic view of the market's direction, making it especially effective in volatile environments.
Key Uses:
- Trend Following: The Dema Supertrend helps traders align their positions with the prevailing market trend by providing clear signals for uptrends and downtrends based on DEMA-smoothened price action.
- Volatility Management: The integration of ATR ensures that the Supertrend bands adapt to changes in market volatility, allowing traders to avoid entering trades during choppy, unpredictable price movements.
- Signal Confirmation: The script includes visual and alert-based signals for trend continuation and reversal, enabling traders to confirm entries and exits with greater accuracy.
Advantages and Strategic Value
The "Dema Supertrend" offers several strategic advantages:
- Reduced Lag: By integrating DEMA into the Supertrend calculation, the indicator responds more quickly to price changes, reducing the lag inherent in traditional moving averages.
- Noise Reduction: The use of DEMA filters out short-term fluctuations, providing a clearer signal for traders looking to capture significant market trends.
- Dynamic Adjustments: The combination of ATR and DEMA allows the indicator to adapt to both trending and ranging markets, making it suitable for a variety of trading strategies.
Summary and Usage Tips
The "Dema Supertrend" is a powerful tool for trend-following traders, offering a precise and adaptive method for identifying and confirming market direction. Traders can experiment with different settings for the Supertrend and DEMA lengths, as well as the ATR multiplier, to optimize the indicator for various trading environments. For best results, use the "Dema Supertrend" in conjunction with other technical analysis tools to confirm trends and manage risk. Whether you're seeking to capture long-term market moves or react to short-term volatility, the "Dema Supertrend" provides a reliable and flexible solution for your trading strategy.

Grid Bot Parabolic [xxattaxx]🟩 The Grid Bot Parabolic, a continuation of the Grid Bot Simulator Series , enhances traditional gridbot theory by employing a dynamic parabolic curve to visualize potential support and resistance levels. This adaptability is particularly useful in volatile or trending markets, enabling traders to explore grid-based strategies and gain deeper market insights. The grids are divided into customizable trade zones that trigger signals as prices move into new zones, empowering traders to gain deeper insights into market dynamics and potential turning points.
While traditional grid bots excel in ranging markets, the Grid Bot Parabolic’s introduction of acceleration and curvature adds new dimensions, enabling its use in trending markets as well. It can function as a traditional grid bot with horizontal lines, a tilted grid bot with linear slopes, or a fully parabolic grid with curves. This dynamic nature allows the indicator to adapt to various market conditions, providing traders with a versatile tool for visualizing dynamic support and resistance levels.
🔑 KEY FEATURES 🔑
Adaptable Grid Structures (Horizontal, Linear, Curved)
Buy and Sell Signals with Multiple Trigger/Confirmation Conditions
Secondary Buy and Secondary Sell Signals
Projected Grid Lines
Customizable Grid Spacing and Zones
Acceleration and Curvature Control
Sensitivity Adjustments
📐 GRID STRUCTURES 📐
Beyond its core parabolic functionality, the Parabolic Grid Bot offers a range of grid configurations to suit different market conditions and trading preferences. By adjusting the "Acceleration" and "Curvature" parameters, you can transform the grid's structure:
Parabolic Grids
Setting both acceleration and curvature to non-zero values results in a parabolic grid.This configuration can be particularly useful for visualizing potential turning points and trend reversals. Example: Accel = 10, Curve = -10)
Linear Grids
With a non-zero acceleration and zero curvature, the grid tilts to represent a linear trend, aiding in identifying potential support and resistance levels during trending phases. Example: Accel =1.75, Curve = 0
Horizontal Grids
When both acceleration and curvature are set to zero, the indicator reverts to a traditional grid bot with horizontal lines, suitable for ranging markets. Example: Accel=0, Curve=0
⚙️ INITIAL SETUP ⚙️
1.Adding the Indicator to Your Chart
Locate a Starting Point: To begin, visually identify a price point on your chart where you want the grid to start.This point will anchor your grid.
2. Setting Up the Grid
Add the Grid Bot Parabolic Indicator to your chart. A “Start Time/Price” dialog will appear
CLICK on the chart at your chosen start point. This will anchor the start point and open a "Confirm Inputs" dialog box.
3. Configure Settings. In the dialog box, you can set the following:
Acceleration: Adjust how quickly the grid reacts to price changes.
Curve: Define the shape of the parabola.
Intervals: Determine the distance between grid levels.
If you choose to keep the default settings, with acceleration set to 0 and curve set to 0, the grid will display as traditional horizontal lines. The grid will align with your selected price point, and you can adjust the settings at any time through the indicator’s settings panel.
⚙️ CONFIGURATION AND SETTINGS ⚙️
Grid Settings
Accel (Acceleration): Controls how quickly the price reacts to changes over time.
Curve (Curvature): Defines the overall shape of the parabola.
Intervals (Grid Spacing): Determines the vertical spacing between the grid lines.
Sensitivity: Fine tunes the magnitude of Acceleration and Curve.
Buy Zones & Sell Zones: Define the number of grid levels used for potential buy and sell signals.
* Each zone is represented on the chart with different colors:
* Green: Buy Zones
* Red: Sell Zones
* Yellow: Overlap (Buy and Sell Zones intersect)
* Gray: Neutral areas
Trigger: Chooses which part of the candlestick is used to trigger a signal.
* `Wick`: Uses the high or low of the candlestick
* `Close`: Uses the closing price of the candlestick
* `Midpoint`: Uses the middle point between the high and low of the candlestick
* `SWMA`: Uses the Symmetrical Weighted Moving Average
Confirm: Specifies how a signal is confirmed.
* `Reverse`: The signal is confirmed if the price moves in the opposite direction of the initial trigger
* `Touch`: The signal is confirmed when the price touches the specified level or zone
Sentiment: Determines the market sentiment, which can influence signal generation.
* `Slope`: Sentiment is based on the direction of the curve, reflecting the current trend
* `Long`: Sentiment is bullish, favoring buy signals
* `Short`: Sentiment is bearish, favoring sell signals
* `Neutral`: Sentiment is neutral. No secondary signals will be generated
Show Signals: Toggles the display of buy and sell signals on the chart
Chart Settings
Grid Colors: These colors define the visual appearance of the grid lines
Projected: These colors define the visual appearance of the projected lines
Parabola/SWMA: Adjust colors as needed. These are disabled by default.
Time/Price
Start Time & Start Price: These set the starting point for the parabolic curve.
* These fields are automatically populated when you add the indicator to the chart and click on an initial location
* These can be adjusted manually in the settings panel, but he easiest way to change these is by directly interacting with the start point on the chart
Please note: Time and Price must be adjusted for each chart when switching assets. For example, a Start Price on BTCUSD of $60,000 will not work on an ETHUSD chart.
🤖 ALGORITHM AND CALCULATION 🤖
The Parabolic Function
At the core of the Parabolic Grid Bot lies the parabolic function, which calculates a dynamic curve that adapts to price action over time. This curve serves as the foundation for visualizing potential support and resistance levels.
The shape and behavior of the parabola are influenced by three key user-defined parameters:
Acceleration: This parameter controls the rate of change of the curve's slope, influencing its tilt or steepness. A higher acceleration value results in a more pronounced tilt, while a lower value leads to a gentler slope. This applies to both curved and linear grid configurations.
Curvature: This parameter introduces and controls the curvature or bend of the grid. A higher curvature value results in a more pronounced parabolic shape, while a lower value leads to a flatter curve or even a straight line (when set to zero).
Sensitivity: This setting fine-tunes the overall responsiveness of the grid, influencing how strongly the Acceleration and Curvature parameters affect its shape. Increasing sensitivity amplifies the impact of these parameters, making the grid more adaptable to price changes but potentially leading to more frequent adjustments. Decreasing sensitivity reduces their impact, resulting in a more stable grid structure with fewer adjustments. It may be necessary to adjust Sensitivity when switching between different assets or timeframes to ensure optimal scaling and responsiveness.
The parabolic function combines these parameters to generate a curve that visually represents the potential path of price movement. By understanding how these inputs influence the parabola's shape and behavior, traders can gain valuable insights into potential support and resistance areas, aiding in their decision-making process.
Sentiment
The Parabolic Grid Bot incorporates sentiment to enhance signal generation. The "Sentiment" input allows you to either:
Manually specify the market sentiment: Choose between 'Long' (bullish), 'Short' (bearish), or 'Neutral'.
Let the script determine sentiment based on the slope of the parabolic curve: If 'Slope' is selected, the sentiment will be considered 'Long' when the curve is sloping upwards, 'Short' when it's sloping downwards, and 'Neutral' when it's flat.
Buy and Sell Signals
The Parabolic Grid Bot generates buy and sell signals based on the interaction between the price and the grid levels.
Trigger: The "Trigger" input determines which part of the candlestick is used to trigger a signal (wick, close, midpoint, or SWMA).
Confirmation: The "Confirm" input specifies how a signal is confirmed ('Reverse' or 'Touch').
Zones: The number of "Buy Zones" and "Sell Zones" determines the areas on the grid where buy and sell signals can be generated.
When the trigger condition is met within a buy zone and the confirmation criteria are satisfied, a buy signal is generated. Similarly, a sell signal is generated when the trigger and confirmation occur within a sell zone.
Secondary Signals
Secondary signals are generated when a regular buy or sell signal contradicts the prevailing sentiment. For example:
A buy signal in a bearish market (Sentiment = 'Short') would be considered a "secondary buy" signal.
A sell signal in a bullish market (Sentiment = 'Long') would be considered a "secondary sell" signal.
These secondary signals are visually represented on the chart using hollow triangles, differentiating them from regular signals (filled triangles).
While they can be interpreted as potential contrarian trade opportunities, secondary signals can also serve other purposes within a grid trading strategy:
Exit Signals: A secondary signal can suggest a potential shift in market sentiment or a weakening trend. This could be a cue to consider exiting an existing position, even if it's currently profitable, to lock in gains before a potential reversal
Risk Management: In a strong trend, secondary signals might offer opportunities for cautious counter-trend trades with controlled risk. These trades could utilize smaller position sizes or tighter stop-losses to manage potential downside if the main trend continues
Dollar-Cost Averaging (DCA): During a prolonged trend, the parabolic curve might generate multiple secondary signals in the opposite direction. These signals could be used to implement a DCA strategy, gradually accumulating a position at potentially favorable prices as the market retraces or consolidates within the larger trend
Secondary signals should be interpreted with caution and considered in conjunction with other technical indicators and market context. They provide additional insights into potential market reversals or consolidation phases within a broader trend, aiding in adapting your grid trading strategy to the evolving market dynamics.
Examples
Trigger=Wick, Confirm=Touch. Signals are generated when the wick touches the next gridline.
Trigger=Close, Confirm=Touch. Signals require the close to touch the next gridline.
Trigger=SWMA, Confirm=Reverse. Signals are triggered when the Symmetrically Weighted Moving Average reverse crosses the next gridline.
🧠THEORY AND RATIONALE 🧠
The innovative approach of the Parabolic Grid Bot can be better understood by first examining the limitations of traditional grid trading strategies and exploring how this indicator addresses them by incorporating principles of market cycles and dynamic price behavior
Traditional Grid Bots: One-Dimensional and Static
Traditional grid bots operate on a simple premise: they divide the price chart into a series of equally spaced horizontal lines, creating a grid of trading zones. These bots excel in ranging markets where prices oscillate within a defined range. Buy and sell orders are placed at these grid levels, aiming to profit from mean reversion as prices bounce between the support and resistance zones.
However, traditional grid bots face challenges in trending markets. As the market moves in one direction, the bot continues to place orders in that direction, leading to a stacking of positions. If the market eventually reverses, these stacked trades can be profitable, amplifying gains. But the risk lies in the potential for the market to continue trending, leaving the trader with a series of losing trades on the wrong side of the market
The Parabolic Grid Bot: Adding Dimensions
The Parabolic Grid Bot addresses the limitations of traditional grid bots by introducing two additional dimensions:
Acceleration (Second Dimension): This parameter introduces a second dimension to the grid, allowing it to tilt upwards or downwards to align with the prevailing market trend. A positive acceleration creates an upward-sloping grid, suitable for uptrends, while a negative acceleration results in a downward-sloping grid, ideal for downtrends. The magnitude of acceleration controls the steepness of the tilt, enabling you to fine-tune the grid's responsiveness to the trend's strength
Curvature (Third Dimension): This parameter adds a third dimension to the grid by introducing a parabolic curve. The curve's shape, ranging from gentle bends to sharp turns, is controlled by the curvature value. This flexibility allows the grid to closely mirror the market's evolving structure, potentially identifying turning points and trend reversals.
Mean Reversion in Trending Markets
Even in trending markets, the Parabolic Grid Bot can help identify opportunities for mean reversion strategies. While the grid may be tilted to reflect the trend, the buy and sell zones can capture short-term price oscillations or consolidations within the broader trend. This allows traders to potentially pinpoint entry and exit points based on temporary pullbacks or reversals.
Visualize and Adapt
The Parabolic Grid Bot acts as a visual aid, enhancing your understanding of market dynamics. It allows you to "see the curve" by adapting the grid to the market's patterns. If the market shows a parabolic shape, like an upward curve followed by a peak and a downward turn (similar to a head and shoulders pattern), adjust the Accel and Curve to match. This highlights potential areas of interest for further analysis.
Beyond Straight Lines: Visualizing Market Cycle
Traditional technical analysis often employs straight lines, such as trend lines and support/resistance levels, to interpret market movements. However, many analysts, including Brian Millard, contend that these lines can be misleading. They propose that what might appear as a straight line could represent just a small part of a larger curve or cycle that's not fully visible on the chart.
Markets are inherently cyclical, marked by phases of expansion, contraction, and reversal. The Parabolic Grid Bot acknowledges this cyclical behavior by offering a dynamic, curved grid that adapts to these shifts. This approach helps traders move beyond the limitations of straight lines and visualize potential support and resistance levels in a way that better reflects the market's true nature
By capturing these cyclical patterns, whether subtle or pronounced, the Parabolic Grid Bot offers a nuanced understanding of market dynamics, potentially leading to more accurate interpretations of price action and informed trading decisions.
⚠️ DISCLAIMER⚠️
This indicator utilizes a parabolic curve fitting approach to visualize potential support and resistance levels. The mathematical formulas employed have been designed with adaptability and scalability in mind, aiming to accommodate various assets and price ranges. While the resulting curves may visually resemble parabolas, it's important to note that they might not strictly adhere to the precise mathematical definition of a parabola.
The indicator's calculations have been tested and generally produce reliable results. However, no guarantees are made regarding their absolute mathematical accuracy. Traders are encouraged to use this tool as part of their broader analysis and decision-making process, combining it with other technical indicators and market context.
Please remember that trading involves inherent risks, and past performance is not indicative of future results. It is always advisable to conduct your own research and exercise prudent risk management before making any trading decisions.
🧠 BEYOND THE CODE 🧠
The Parabolic Grid Bot, like the other grid bots in this series, is designed with education and community collaboration in mind. Its open-source nature encourages exploration, experimentation, and the development of new grid trading strategies. We hope this indicator serves as a framework and a starting point for future innovations in the field of grid trading.
Your comments, suggestions, and discussions are invaluable in shaping the future of this project. We welcome your feedback and look forward to seeing how you utilize and enhance the Parabolic Grid Bot.

Standardized PSAR Oscillator [AlgoAlpha]Enhance your trading experience with the "Standardized PSAR Oscillator" 🪝, a powerful tool that combines the Parabolic Stop and Reverse (PSAR) with standardization techniques to offer more nuanced insights into market trends and potential reversals.
🔑 Key Features:
- 🛠 Customizable PSAR Settings: Adjust the starting point, increment, and maximum values for the PSAR to tailor the indicator to your strategy.
- 📏 Standardization: Smooth out volatility by standardizing the PSAR values using a customizable EMA, making reversals easier to identify.
- 🎨 Dynamic Color-Coding: The oscillator changes colors based on market conditions, helping you quickly spot bullish and bearish trends.
- 🔄 Divergence Detection: Automatic detection of bullish and bearish divergences with customizable sensitivity and confirmation settings.
- 🔔 Alerts: Set up alerts for key events like zero-line crossovers and trend weakening, ensuring you never miss a critical market move.
🚀 How to Use:
✨ Add the Indicator: Add the indicator to favorites by pressing the star icon, adjust the settings to suite your needs.
👀 Monitor Signals: Watch for the automatic plotting of divergences and reversal signals to identify potential market entries and exits.
🔔 Set Alerts: Configure alerts to get notified of key changes without constantly monitoring the charts.
🔍 How It Works:
The Standardized PSAR Oscillator is an advanced trading tool that refines the traditional PSAR (Parabolic Stop and Reverse) indicator by incorporating several key enhancements to improve trend analysis and signal accuracy. The script begins by calculating the PSAR, a widely used indicator known for its effectiveness in identifying trend reversals. To make the PSAR more adaptive and responsive to market conditions, it is standardized using an Exponential Moving Average (EMA) of the high-low range over a user-defined period. This standardization helps to normalize the PSAR values, making them more comparable across different market conditions.
To further enhance signal clarity, the standardized PSAR is then smoothed using a Weighted Moving Average (WMA). This combination of EMA and WMA creates an oscillator that not only captures trend direction but also smooths out market noise, providing a cleaner signal. The oscillator's values are color-coded to visually indicate its position relative to the zero line, with additional emphasis on whether the WMA is rising or falling—this helps traders quickly interpret the trend’s strength and direction.
The oscillator also includes built-in divergence detection by comparing pivot points in price action with those in the oscillator. This feature helps identify potential discrepancies between the price and the oscillator, signaling possible trend reversals. Alerts can be configured for when the oscillator crosses the zero line or when a trend shows signs of weakening, ensuring that traders receive timely notifications to act on emerging opportunities. These combined elements make the Standardized PSAR Oscillator a robust tool for enhancing your trading strategy with more reliable and actionable signals

Pulse Oscillator [UAlgo]The "Pulse Oscillator " is a trading tool designed to capture market momentum and trend changes by combining the strengths of multiple well-known technical indicators. By integrating the RSI (Relative Strength Index), CCI (Commodity Channel Index), and Stochastic Oscillator, this indicator provides traders with a comprehensive view of market conditions, offering both trend filtering and precise buy/sell signals. The oscillator is customizable, allowing users to fine-tune its parameters to match different trading strategies and timeframes. With its built-in smoothing techniques and level adjustments, the Pulse Oscillator aims to be a reliable tool for both trend-following and counter-trend trading strategies.
🔶 Key Features
Multi-Indicator Integration: Combines RSI, CCI, and Stochastic Oscillator to create a weighted momentum oscillator.
Why Use Multi-Indicator Integration?
Script uses Multi-Indicator Integration to combine the strengths of different technical indicators—such as RSI, CCI, and Stochastic Oscillator—into a single tool. This approach helps to reduce the weaknesses of individual indicators, providing a more comprehensive and reliable analysis of market conditions. By integrating multiple indicators, we can generate more accurate signals, filter out noise, and enhance our trading decisions.
Customizable Parameters: Allows users to adjust weights, periods, and smoothing techniques, providing flexibility to adapt the indicator to various market conditions.
Trend Filtering Option: An optional trend filter is available to enhance the accuracy of buy and sell signals, reducing the risk of false signals in choppy markets.
Dynamic Levels: The indicator dynamically calculates multiple levels of support and resistance, adjusting to market conditions with customizable decay factors and offsets.
Visual Clarity: The indicator visually represents different levels and trends with color-coded plots and fills, making it easier for traders to interpret market conditions at a glance.
Alerts: Configurable alerts for buy and sell signals, as well as trend changes, enabling traders to stay informed of key market movements without constant monitoring.
🔶 Interpreting the Indicator
Buy Signal: A buy signal is generated when the Slow Line crosses under the Fast Line during an uptrend or when the trend filter is disabled. This indicates a potential bullish reversal or continuation of an upward trend.
Sell Signal: A sell signal occurs when the Slow Line crosses above the Fast Line during a downtrend or when the trend filter is disabled, signaling a potential bearish reversal or continuation of a downward trend.
Trend Change: The indicator detects trend changes when the Fast Line shifts from increasing to decreasing or vice versa, providing early warning of possible market reversals.
Dynamic Levels: The indicator calculates upper and lower levels based on the Fast Line's values. These levels can be used to identify overbought or oversold conditions and potential areas of support or resistance.
🔶 Disclaimer
Use with Caution: This indicator is provided for educational and informational purposes only and should not be considered as financial advice. Users should exercise caution and perform their own analysis before making trading decisions based on the indicator's signals.
Not Financial Advice: The information provided by this indicator does not constitute financial advice, and the creator (UAlgo) shall not be held responsible for any trading losses incurred as a result of using this indicator.
Backtesting Recommended: Traders are encouraged to backtest the indicator thoroughly on historical data before using it in live trading to assess its performance and suitability for their trading strategies.
Risk Management: Trading involves inherent risks, and users should implement proper risk management strategies, including but not limited to stop-loss orders and position sizing, to mitigate potential losses.
No Guarantees: The accuracy and reliability of the indicator's signals cannot be guaranteed, as they are based on historical price data and past performance may not be indicative of future results.

Sniper Signal- Description
The Sniper Signal is a sophisticated technical indicator designed for traders seeking to maximize accuracy in identifying key turning points within a market. This indicator is built on a dual approach, combining the power of the Wave Trend Momentum Oscillator (WTMO) with the robustness of a long-term Simple Moving Average (SMA), making it an ideal tool for trading in dynamic and trending market environments.
The WTMO is known for its ability to capture momentum and underlying price direction, providing early signals of trend changes. By smoothing price movements using an exponential moving average (EMA), the WTMO accurately identifies when price is overextending in one direction, which may precede a reversal.
The 100-period SMA acts as a critical trend filter, ensuring that trades are only made in the direction of the prevailing market flow. This approach ensures that signals generated by the WTMO align with the long-term trend, filtering out false signals that can appear in sideways or low volatility markets.
The Sniper Signal is not just an indicator that marks entries and exits; it is a complete strategy in itself, designed for traders who understand the importance of trading in the direction of the prevailing trend. Buy signals are generated only when momentum is at its lowest point (WT1 < -5) and the price is supported by a confirmed uptrend (price above the SMA). Conversely, sell signals are only triggered when momentum is at extremely high levels (WT1 > 5) and the market shows clear signs of weakness (price below the SMA).
This combination of momentum and trend analysis creates a balanced approach that allows traders to capture significant moves in the market, while minimizing exposure to unnecessary risk. The Sniper Signal is particularly effective in markets with well-defined trends, where the key to success lies in entering the market at optimal points and exiting before a significant reversal occurs.
In summary, the Sniper Signal is an advanced tool designed for serious traders looking to take advantage of the combination of momentum and trend to execute high probability trades in moving markets.
- How to use the script?
The Sniper Signal indicator code is written in Pine Script, the native programming language of TradingView. To use this indicator, users must copy the code and paste it into the Pine Script editor within the TradingView platform. Once they have done this, they can save and add the script to their chart to begin displaying buy and sell signals directly on their price charts.
When using the Sniper Signal, traders should pay attention to the signals represented by the triangles on the chart: an upward-facing blue triangle indicates a possible buying opportunity, while a downward-facing red triangle suggests a possible selling opportunity. It is crucial that users also watch the 100-period Simple Moving Average (SMA), shown as a gray line on the chart, to ensure that trades align with the overall market trend. This helps filter out less reliable signals and improves the accuracy of trading decisions.
- Open-source reuse
The indicator code is based on common and widely used concepts in technical analysis, such as the Wave Trend Momentum Oscillator (WTMO) and the Simple Moving Average (SMA). These components are not proprietary and are part of the general knowledge in the trading community, which means that many developers can create their own versions based on these same principles.

Liquidity weighted SupertrendOverview
The Liquidity Weighted Supertrend Indicator (LWST) is an advanced iteration of the traditional Supertrend indicator, meticulously crafted to improve trend detection by incorporating liquidity into its calculations. By weighting price movements according to trading volume, the LWST becomes more responsive to significant market activities, offering traders a more accurate depiction of market trends.
Indicator Description
The Liquidity Weighted Supertrend Indicator is a versatile and adaptive tool designed to assist traders in recognizing trends and potential reversal points within the market. This indicator features two operational modes: Aggressive and Smoothed, allowing traders to tailor trend detection to their specific trading style and market conditions.
Key Features
Two Supertrend Modes:
Aggressive Mode: This mode offers more responsive signals, ideal for short-term trading. It utilizes an Exponential Moving Average (EMA) to smooth the price data, resulting in quicker reactions to market changes.
Smoothed Mode: This mode provides more stable signals, suitable for longer-term trading, by employing a Simple Moving Average (SMA). Note that when "Smoothed" mode is selected, the "Fast MA length" input is not utilized, focusing instead on producing smoother trend lines.
LWMA Calculation:
The Liquidity Weighted Moving Average (LWMA) is a distinctive feature of the LWST, blending volume and price action to filter out market noise and pinpoint significant price movements. This calculation begins with the liquidity factor, determined by multiplying volume with the price change, which is then smoothed using an EMA for accuracy.
Customizable Parameters:
Factor: Adjusts the Supertrend line's sensitivity to price movements.
Supertrend Length: Defines the lookback period for the Average True Range (ATR) calculation, which affects the width of the Supertrend channel.
Fast and Slow MA Lengths: Allows customization of the fast and slow moving averages used in the LWMA calculation, offering further control over the indicator's responsiveness.
How the Indicator Works
LWMA Smoothing:
The LWST calculates liquidity by multiplying volume with the absolute difference between the close and open prices. This liquidity value is smoothed using an EMA and compared to its standard deviation, identifying significant price movements. Depending on the selected mode, the price data (hl2) is smoothed either with an EMA (in Aggressive Mode) or an SMA (in Smoothed Mode). It’s important to note that when Smoothed mode is active, the "Fast MA length" input does not affect the output.
Visual Signals:
The Supertrend line is visually represented on the chart, with different colors indicating bullish (lime) and bearish (red) trends.
Buy and sell signals are clearly marked with arrows: green triangles indicate potential buying opportunities (when the price crosses above the Supertrend line), and red triangles suggest selling opportunities (when the price crosses below the Supertrend line).
Additional arrows may appear, signaling potential trend reversals, providing further confirmation for traders.
How to Use the Indicator
Configuring the Indicator:
Supertrend Type: Choose between Aggressive and Smoothed modes depending on your trading strategy and the current market conditions. Aggressive mode is better suited for shorter timeframes, while Smoothed mode provides more consistent signals for longer-term analysis.
Factor and Length Settings: Customize the Factor, Supertrend Length, and Moving Average lengths to fine-tune the sensitivity and responsiveness of the Supertrend line, adapting the indicator to various market environments.
Interpreting the Signals:
Trend Identification: The Supertrend line offers a clear visualization of the current market trend. A green line indicates a bullish trend, suggesting upward price movement, while a red line indicates a bearish trend, signaling potential downward price movement.
Entry and Exit Points: The arrows plotted by the LWST provide straightforward entry and exit signals. Green arrows signal potential buy opportunities, indicating that the price may continue to rise, while red arrows signal potential sell opportunities, suggesting that the price may decline. These visual cues help traders make informed decisions based on the current market trend.
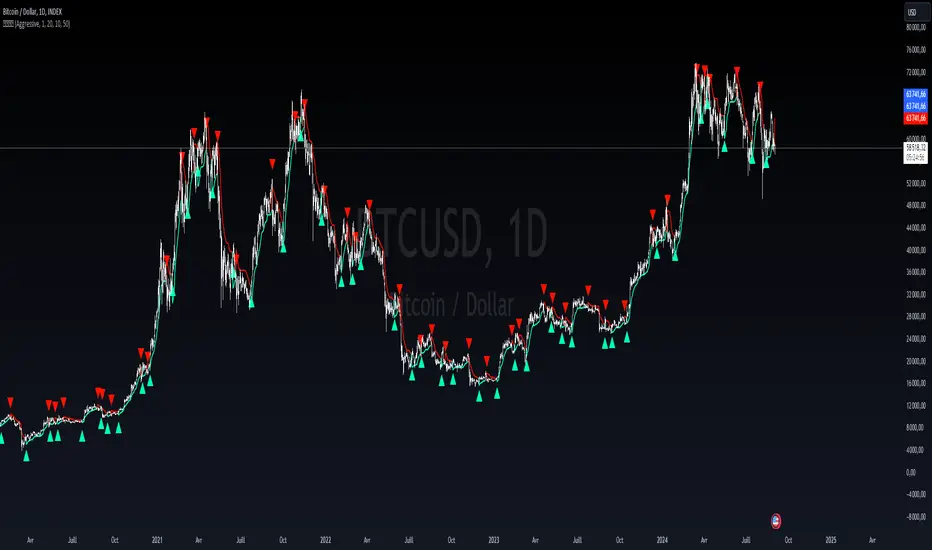
Multi Adaptive Moving Average (MAMA)The Multi Adaptive Moving Average (MAMA) indicator is an advanced tool for technical analysis, designed to provide traders with a detailed understanding of market trends and potential future price movements. This indicator utilizes multiple Simple Moving Averages (SMAs) and forecasting techniques to enhance decision-making processes.
Simple Moving Averages (SMAs):
Short MA (20-period): This moving average is highly responsive to price changes, making it ideal for capturing short-term trends. It helps traders identify quick market shifts and potential entry or exit points.
Mid MA (50-period): This average strikes a balance between short- and long-term trends, offering insights into the market's intermediate direction. It aids in confirming the sustainability of short-term trends.
Long MA (100-period): By smoothing out price data over a longer period, this moving average is useful for identifying long-term trends and filtering out short-term volatility.
Very Long MA (200-period): Often considered a critical indicator for determining the overall market trend, this average helps confirm the direction and strength of long-term movements.
Forecasting:
Flat Forecast: This approach assumes that prices will remain constant in the near future, which is particularly useful in markets trading sideways without a clear trend direction.
Linear Regression Forecast: This method uses historical data to project future price movements, offering a dynamic forecast based on existing trends. It helps traders anticipate potential price changes and plan their strategies accordingly.
Advantages:
Comprehensive Trend Analysis: By incorporating four different SMAs, the indicator provides a layered view of market trends across various timeframes. This enables traders to identify potential trend reversals and continuations with greater accuracy.
Predictive Insights: The forecasting feature offers traders a forward-looking perspective, enabling them to anticipate market movements and adjust their trading strategies proactively. This can be especially advantageous in volatile markets.
Customization: The MAMA indicator is highly customizable, allowing traders to adjust parameters such as the source of price data and the inclusion of the current unclosed candle. This flexibility ensures that the indicator can be tailored to fit different trading styles and market conditions.
Visual Clarity: The use of distinct colors for each SMA and their forecasts enhances visual interpretation, making it easier for traders to quickly assess market conditions and make informed decisions. The inclusion of a legend further aids in distinguishing between the different moving averages and their respective forecasts.
How to Use:
Trend Confirmation: Use the alignment of the SMAs to confirm market trends. For example, when the Short MA crosses above the Mid and Long MAs, it may indicate a bullish trend, while the opposite could suggest a bearish trend.
Entry and Exit Points: Look for crossovers between the SMAs as potential signals for entering or exiting trades. The forecasts can help in timing these decisions by providing an expectation of future price movements.
Risk Management: Utilize the Very Long MA to set stop-loss and take-profit levels, as it reflects the long-term trend and can help in avoiding trades against the prevailing market direction.
The MAMA indicator is intended to support technical analysis and should not be used as the sole basis for making trading decisions. Financial markets are inherently uncertain, and past performance does not guarantee future results. Traders should use this tool in conjunction with other analytical methods and consider their risk tolerance and investment objectives. It is advisable to conduct thorough research and consult with a financial advisor before making significant trading decisions. Always be aware of the risks involved in trading and invest only what you can afford to lose.
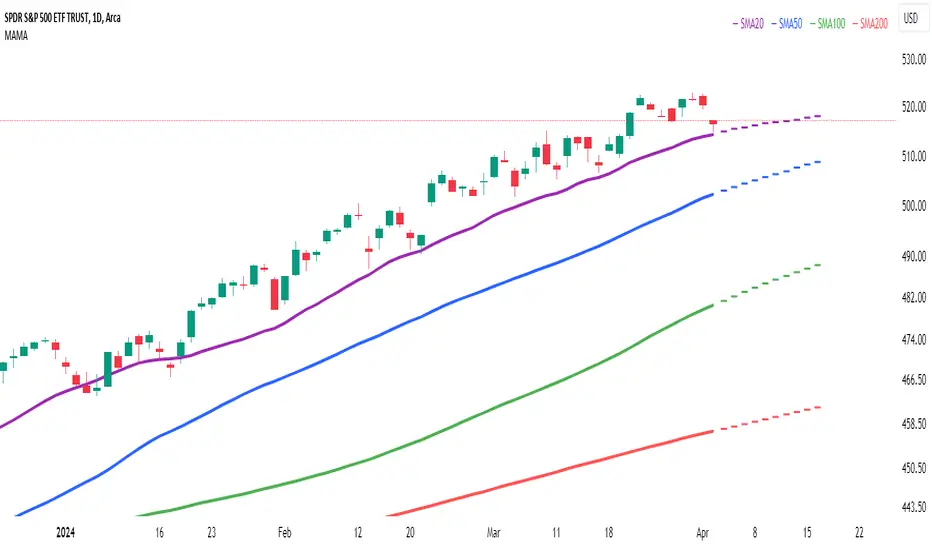
Helacator Ai ThetaHelacator Ai Theta is a state-of-the-art advanced script. It helps the trader find the possibility of a trend reversal in the market. By finding that point at which the three black crows pattern combines with the three white soldiers pattern, it is the most cherished pattern in technical analysis for its signal of strong bullish or bearish momentum. Therefore, it is a very strong predictive tool in the ability of shifting markets.
Key Highlights: Three White Soldiers and Three Black Crows Patterns
The script identifies these candlestick formations that consist of three consecutive candles, either bullish (Three White Soldiers) or bearish (Three Black Crows). These patterns help the trader identify possible trend reversal points as they provide an early signal of a change in the market direction. It is with great care that the script is written to evaluate the position and relationship between the candlesticks for maintaining the accuracy of pattern recognition. Moving Averages for Trend Filtering:
Two important ones used are moving averages for filtering any signals not in accordance with the general trend. The length of these MAs is variable, allowing the traders to be in a position to adapt the script for use under different market conditions. The moving averages ensure that signals are only taken in the direction that supports the general market flow, so it leads to more reliability within the signals. The MAs are not plotted on the chart for the sake of clarity, but they still perform a crucial function in signal filtering and can be displayed optionally for a more detailed investigation. Cooldown filter to reduce over-trading
This is part of what is implemented in the script to prevent generation of consecutive signals too quickly. All this helps to reduce market noise and not overtrade—only when market conditions are at their best. The cooldown period can be set to be adjusted according to the trader's preference, making the script more versatile in its use. Practical Considerations: Educational Purpose: This script is for educational purposes only and should be part of a comprehensive trading approach. Proper risk management techniques should be observed while at the same time taking into consideration prevailing market conditions before making any trading decision.
No Guaranteed Results: The script is aimed at bringing signal accuracy into improvement to align with the broader market trend and reducing noise, but past performance cannot guarantee future success. Traders should use this script within their broad trading approach. Clean and Simple Chart Display: The primary goal of this script is to have a clear and simple display on the chart. The signals are prominently marked with "BUY" and "SELL," and the color of the bars has changed according to the last signal, thus traders can easily read the output. Community and Open Source Open Source Contribution: This script is open for contribution by the TradingView community. Any suggestions regarding improvements are highly welcomed. Candlestick patterns, moving averages, and the combination of the cooldown filter are presented in such a way as to give traders something special, and any modifications or extra touch by the community is appreciated. Attribution and Transparency: The script is based on standard technical analysis principles and for all parts inspired by or derivated from other available open-source scripts, credit is given where it is due. In this way, transparency ensures that the script adheres to TradingView's standards and promotes a collaborative community environment.

Uptrick: Volume-Weighted EMA Signal### **Uptrick: Volume-Weighted EMA Signal (UVES) Indicator - Comprehensive Description**
#### **Overview**
The **Uptrick: Volume-Weighted EMA Signal (UVES)** is an advanced, multifaceted trading indicator meticulously designed to provide traders with a holistic view of market trends by integrating Exponential Moving Averages (EMA) with volume analysis. This indicator not only identifies the direction of market trends through dynamic EMAs but also evaluates the underlying strength of these trends using real-time volume data. UVES is a versatile tool suitable for various trading styles and markets, offering a high degree of customization to meet the specific needs of individual traders.
#### **Purpose**
The UVES indicator aims to enhance traditional trend-following strategies by incorporating a critical yet often overlooked component: volume. Volume is a powerful indicator of market strength, providing insights into the conviction behind price movements. By merging EMA-based trend signals with detailed volume analysis, UVES offers a more nuanced and reliable approach to identifying trading opportunities. This dual-layer analysis allows traders to differentiate between strong trends supported by significant volume and weaker trends that may be prone to reversals.
#### **Key Features and Functions**
1. **Dynamic Exponential Moving Average (EMA):**
- The core of the UVES indicator is its dynamic EMA, calculated over a customizable period. The EMA is a widely used technical indicator that smooths price data to identify the underlying trend. In UVES, the EMA is dynamically colored—green when the current EMA value is above the previous value, indicating an uptrend, and red when below, signaling a downtrend. This visual cue helps traders quickly assess the trend direction without manually calculating or interpreting raw data.
2. **Comprehensive Moving Average Customization:**
- While the EMA is the default moving average in UVES, traders can select from various other moving average types, including Simple Moving Average (SMA), Smoothed Moving Average (SMMA), Weighted Moving Average (WMA), and Volume-Weighted Moving Average (VWMA). Each type offers unique characteristics:
- **SMA:** Provides a simple average of prices over a specified period, suitable for identifying long-term trends.
- **EMA:** Gives more weight to recent prices, making it more responsive to recent market movements.
- **SMMA (RMA):** A slower-moving average that reduces noise, ideal for capturing smoother trends.
- **WMA:** Weighs prices based on their order in the dataset, making recent prices more influential.
- **VWMA:** Integrates volume data, emphasizing price movements that occur with higher volume, making it particularly useful in volume-sensitive markets.
3. **Signal Line for Trend Confirmation:**
- UVES includes an optional signal line, which applies a secondary moving average to the primary EMA. This signal line can be used to smooth out the EMA and confirm trend changes. The signal line’s color changes based on its slope—green for an upward slope and red for a downward slope—providing a clear visual confirmation of trend direction. Traders can adjust the length and type of this signal line, allowing them to tailor the indicator’s responsiveness to their trading strategy.
4. **Buy and Sell Signal Generation:**
- UVES generates explicit buy and sell signals based on the interaction between the EMA and the signal line. A **buy signal** is triggered when the EMA transitions from a red (downtrend) to a green (uptrend), indicating a potential entry point. Conversely, a **sell signal** is triggered when the EMA shifts from green to red, suggesting an exit or shorting opportunity. These signals are displayed directly on the chart as upward or downward arrows, making them easily identifiable even during fast market conditions.
5. **Volume Analysis with Real-Time Buy/Sell Volume Table:**
- One of the standout features of UVES is its integration of volume analysis, which calculates and displays the volume attributed to buying and selling activities. This analysis includes:
- **Buy Volume:** The portion of the total volume associated with price increases (close higher than open).
- **Sell Volume:** The portion of the total volume associated with price decreases (close lower than open).
- **Buy/Sell Ratio:** A ratio of buy volume to sell volume, providing a quick snapshot of market sentiment.
- These metrics are presented in a real-time table positioned in the top-right corner of the chart, with customizable colors and formatting. The table updates with each new bar, offering continuous feedback on the strength and direction of the market trend based on volume data.
6. **Customizable Settings and User Control:**
- **EMA Length and Source:** Traders can specify the lookback period for the EMA, adjusting its sensitivity to price changes. The source for EMA calculations can also be customized, with options such as close, open, high, low, or other custom price series.
- **Signal Line Customization:** The signal line’s length, type, and width can be adjusted to suit different trading strategies, allowing traders to optimize the balance between trend detection and noise reduction.
- **Offset Adjustment:** The offset feature allows users to shift the EMA and signal line forward or backward on the chart. This can help align the indicator with specific price action or adjust for latency in decision-making processes.
- **Volume Table Positioning and Formatting:** The position, size, and color scheme of the volume table are fully customizable, enabling traders to integrate the table seamlessly into their chart setup without cluttering the visual workspace.
7. **Versatility Across Markets and Trading Styles:**
- UVES is designed to be effective across a wide range of financial markets, including Forex, stocks, cryptocurrencies, commodities, and indices. Its adaptability to different markets is supported by its comprehensive customization options and the inclusion of volume analysis, which is particularly valuable in markets where volume plays a crucial role in price movement.
#### **How Different Traders Can Benefit from UVES**
1. **Trend Followers:**
- Trend-following traders will find UVES particularly beneficial for identifying and riding trends. The dynamic EMA and signal line provide clear visual cues for trend direction, while the volume analysis helps confirm the strength of these trends. This combination allows trend followers to stay in profitable trades longer and exit when the trend shows signs of weakening.
2. **Volume-Based Traders:**
- Traders who focus on volume as a key indicator of market strength can leverage the UVES volume table to gain insights into the buying and selling pressure behind price movements. By monitoring the buy/sell ratio, these traders can identify periods of strong conviction (high buy volume) or potential reversals (high sell volume) with greater accuracy.
3. **Scalpers and Day Traders:**
- For traders operating on shorter time frames, UVES provides quick and reliable signals that are essential for making rapid trading decisions. The ability to customize the EMA length and type allows scalpers to fine-tune the indicator for responsiveness, while the volume analysis offers an additional layer of confirmation to avoid false signals.
4. **Swing Traders:**
- Swing traders, who typically hold positions for several days to weeks, can use UVES to identify medium-term trends and potential entry and exit points. The indicator’s ability to filter out market noise through the signal line and volume analysis makes it ideal for capturing significant price movements without being misled by short-term volatility.
5. **Position Traders and Long-Term Investors:**
- Even long-term investors can benefit from UVES by using it to identify major trend reversals or confirm the strength of long-term trends. The flexibility to adjust the EMA and signal line to longer periods ensures that the indicator remains relevant for detecting shifts in market sentiment over extended time frames.
#### **Optimal Settings for Different Markets**
- **Forex Markets:**
- **EMA Length:** 9 to 14 periods.
- **Signal Line:** Use VWMA or WMA for the signal line to incorporate volume data, which is crucial in the highly liquid Forex markets.
- **Best Use:** Short-term trend following, with an emphasis on identifying rapid changes in market sentiment.
- **Stock Markets:**
- **EMA Length:** 20 to 50 periods.
- **Signal Line:** SMA or EMA with a slightly longer length (e.g., 50 periods) to capture broader market trends.
- **Best Use:** Medium to long-term trend identification, with volume analysis confirming the strength of institutional buying or selling.
- **Cryptocurrency Markets:**
- **EMA Length:** 9 to 12 periods, due to the high volatility in crypto markets.
- **Signal Line:** SMMA or EMA for smoothing out extreme price fluctuations.
- **Best Use:** Identifying entry and exit points in volatile markets, with the volume table providing insights into market manipulation or sudden shifts in trader sentiment.
- **Commodity Markets:**
- **EMA Length:** 14 to 21 periods.
- **Signal Line:** WMA or VWMA, considering the impact of trading volume on commodity prices.
- **Best Use:** Capturing medium-term price movements and confirming trend strength with volume data.
#### **Customization for Advanced Users**
- **Advanced Offset Usage:** Traders can experiment with different offset values to see how shifting the EMA and signal line impacts the timing of buy/sell signals. This can be particularly useful in markets with known latency or for strategies that require a delayed confirmation of trend changes.
- **Volume Table Integration:** The position, size, and colors of the volume table can be adjusted to fit seamlessly into any trading setup. For example, a trader might choose to position the table in the bottom-right corner and use a smaller size to keep the focus on price action while still having access to volume data.
- **Signal Filtering:** By combining the signal line with the primary EMA, traders can filter out false signals during periods of low volatility or when the market is range-bound. Adjusting the length of the signal line allows for greater control over the sensitivity of the trend detection.
#### **Conclusion**
The **Uptrick: Volume-Weighted EMA Signal (UVES)** is a powerful and adaptable indicator designed for traders who demand more from their technical analysis tools. By integrating dynamic EMA trend signals with real-time volume analysis, UVES offers a comprehensive view of market conditions, making it an invaluable resource for identifying trends, confirming signals, and understanding market sentiment. Whether you are a day trader, swing trader, or long-term investor, UVES provides the versatility, precision, and customization needed to make more informed and profitable trading decisions. With its ability to adapt to various markets and trading styles, UVES is not just an indicator but a complete trend analysis solution.

Uptrick: SMA Pivot Marker### Uptrick: SMA Pivot Marker (SPM) — Extensive Guide
#### Introduction
The **Uptrick: SMA Pivot Marker (SPM)** is a sophisticated technical analysis tool crafted by Uptrick to help traders interpret market trends and identify key price levels where significant reversals might occur. By integrating the principles of the Simple Moving Average (SMA) with pivot point analysis, the SPM offers a comprehensive approach to understanding market dynamics. This extensive guide explores the purpose, functionality, and practical applications of the SPM, providing an in-depth analysis of its features, settings, and usage across various trading strategies.
#### Purpose of the SPM
The **SMA Pivot Marker (SPM)** aims to enhance trading strategies by offering a dual approach to market analysis:
1. **Trend Identification**:
- **Objective**: To discern the prevailing market direction and guide trading decisions based on the overall trend.
- **Method**: Utilizes the SMA to smooth out price fluctuations, providing a clearer picture of the trend. This helps traders align their trades with the market's direction, increasing the probability of successful trades.
2. **Pivot Point Detection**:
- **Objective**: To identify key levels where the price is likely to reverse, providing potential support and resistance zones.
- **Method**: Calculates and marks pivot highs and lows, which are significant price points where previous trends have reversed. These levels are used to predict future price movements and establish trading strategies.
3. **Trend Change Alerts**:
- **Objective**: To notify traders of potential shifts in market direction, enabling timely adjustments to trading positions.
- **Method**: Detects and highlights crossover and crossunder points of the smoothed line, indicating possible trend changes. This helps traders react promptly to changing market conditions.
#### Detailed Functionality
1. **Smoothing Line Calculation**:
- **Simple Moving Average (SMA)**:
- **Definition**: The SMA is a type of moving average that calculates the average of a security’s price over a specified number of periods. It smooths out price data to filter out short-term fluctuations and highlight the longer-term trend.
- **Calculation**: The SMA is computed by summing the closing prices of the chosen number of periods and then dividing by the number of periods. For example, a 20-period SMA adds the closing prices for the past 20 periods and divides by 20.
- **Purpose**: The SMA helps in identifying the direction of the trend. A rising SMA indicates an uptrend, while a falling SMA indicates a downtrend. This smoothing helps traders to avoid being misled by short-term price noise.
2. **Pivot Points Calculation**:
- **Pivot Highs and Lows**:
- **Definition**: Pivot points are significant price levels where a market trend is likely to reverse. A pivot high is the highest price over a certain period, surrounded by lower prices on both sides, while a pivot low is the lowest price surrounded by higher prices.
- **Calculation**: The SPM calculates pivot points based on a user-defined lookback period. For instance, if the lookback period is set to 3, the indicator will find the highest and lowest prices within the past 3 periods and mark these points.
- **Purpose**: Pivot points are used to identify potential support and resistance levels. Traders often use these levels to set entry and exit points, stop-loss orders, and to gauge market sentiment.
3. **Visualization**:
- **Smoothed Line Plot**:
- **Description**: The smoothed line, calculated using the SMA, is plotted on the chart to provide a visual representation of the trend. This line adjusts its color based on the trend direction, helping traders quickly assess the market condition.
- **Color Coding**: The smoothed line is colored green (upColor) when it is rising, indicating a bullish trend, and red (downColor) when it is falling, indicating a bearish trend. This color-coding helps traders visually differentiate between uptrends and downtrends.
- **Line Width**: The width of the line can be adjusted to improve visibility. A thicker line may be more noticeable, while a thinner line might provide a cleaner look on the chart.
- **Pivot Markers**:
- **Description**: Pivot highs and lows are marked on the chart with lines and labels. These markers help in visually identifying significant price levels.
- **Color and Labels**: Pivot highs are represented with green lines and labels ("H"), while pivot lows are marked with red lines and labels ("L"). This color scheme and labeling make it easy to distinguish between resistance (highs) and support (lows).
4. **Trend Change Detection**:
- **Trend Up**:
- **Detection**: The indicator identifies an upward trend change when the smoothed line crosses above its previous value. This crossover suggests a potential shift from a downtrend to an uptrend.
- **Usage**: Traders can interpret this signal as a potential buying opportunity or an indication to review and possibly adjust their trading positions to align with the new uptrend.
- **Trend Down**:
- **Detection**: A downward trend change is detected when the smoothed line crosses below its previous value. This crossunder indicates a potential shift from an uptrend to a downtrend.
- **Usage**: This signal can be used to consider selling opportunities or to reassess long positions in light of the emerging downtrend.
#### User Inputs
1. **Smoothing Period**:
- **Description**: This input determines the number of periods over which the SMA is calculated. It directly affects the smoothness of the line and the sensitivity of trend detection.
- **Range**: The smoothing period can be set to any integer value greater than or equal to 1. There is no specified upper limit, offering flexibility for various trading styles.
- **Default Value**: The default smoothing period is 20, which is a common choice for medium-term trend analysis.
- **Impact**: A longer smoothing period results in a smoother line, filtering out more noise and highlighting long-term trends. A shorter period makes the line more responsive to recent price changes, which can be useful for short-term trading strategies.
2. **Pivot Lookback**:
- **Description**: This input specifies the number of periods used to calculate the pivot highs and lows. It influences the sensitivity of pivot point detection and the relevance of the identified levels.
- **Range**: The pivot lookback period can be set to any integer value greater than or equal to 1, with no upper limit. Traders can adjust this parameter based on their trading timeframe and preferences.
- **Default Value**: The default lookback period is 3, which provides a balance between detecting significant pivots and avoiding excessive noise.
- **Impact**: A longer lookback period generates more stable pivot points, suitable for identifying long-term support and resistance levels. A shorter lookback period results in more frequent and recent pivot points, useful for intraday trading and quick responses to price changes.
#### Applications for Different Traders
1. **Trend Followers**:
- **Using the SMA**: Trend followers utilize the smoothed line to gauge the direction of the market. By aligning trades with the direction of the SMA, traders can capitalize on sustained trends and improve their chances of success.
- **Trend Change Alerts**: The trend change markers alert trend followers to potential shifts in market direction. These alerts help traders make timely decisions to enter or exit positions, ensuring they stay aligned with the prevailing trend.
2. **Reversal Traders**:
- **Pivot Points**: Reversal traders focus on pivot highs and lows to identify potential reversal points in the market. These points indicate where the market has previously reversed direction, providing potential entry and exit levels for trades.
- **Pivot Markers**: The visual markers for pivot highs and lows serve as clear signals for reversal traders. By monitoring these levels, traders can anticipate price reversals and plan their trades to exploit these opportunities.
3. **Swing Traders**:
- **Combining SMA and Pivot Points**: Swing traders can use the combination of the smoothed line and pivot points to identify medium-term trading opportunities. The smoothed line helps in understanding the broader trend, while pivot points provide specific levels for potential swings.
- **Trend Change Alerts**: Trend change markers help swing traders spot new swing opportunities as the market shifts direction. These markers provide potential entry points for swing trades and help traders adjust their strategies to capitalize on market movements.
4. **Scalpers**:
- **Short-Term Analysis**: Scalpers benefit from the short-term signals provided by the SPM. The smoothed line and pivot points offer insights into rapid price movements, while the trend change markers highlight quick trading opportunities.
- **Pivot Points**: For scalpers, pivot points are particularly useful in identifying key levels where price may reverse within a short time frame. By focusing on these levels, scalpers can plan trades with tight stop-loss orders and capitalize on quick price changes.
#### Implementation and Best Practices
1. **Setting Parameters**:
- **Smoothing Period**: Adjust the smoothing period according to your trading strategy and market conditions. For long-term analysis, use a longer period to filter out noise and highlight broader trends. For short-term trading, a shorter period provides more immediate insights into price movements.
- **Pivot Lookback**: Choose a lookback period that matches your trading timeframe. For intraday trading, a shorter lookback period offers quick identification of recent price levels. For swing trading or long-term strategies, a longer lookback period provides more stable pivot points.
2. **Combining with Other Indicators**:
- **Integration with Technical Tools**: The SPM can be used in conjunction with other technical indicators to enhance trading decisions. For instance, combining the
SPM with indicators like RSI (Relative Strength Index) or MACD (Moving Average Convergence Divergence) can provide additional confirmation for trend signals and pivot points.
- **Support and Resistance**: Integrate the SPM’s pivot points with other support and resistance levels to gain a comprehensive view of market conditions. This combined approach helps in identifying stronger levels of support and resistance, improving trade accuracy.
3. **Backtesting**:
- **Historical Performance**: Conduct backtesting with historical data to evaluate the effectiveness of the SPM. Analyze past performance to fine-tune the smoothing period and pivot lookback settings, ensuring they align with your trading style and market conditions.
- **Scenario Analysis**: Test the SPM under various market scenarios to understand its performance in different conditions. This analysis helps in assessing the reliability of the indicator and making necessary adjustments for diverse market environments.
4. **Customization**:
- **Visual Adjustments**: Customize the appearance of the smoothed line and pivot markers to enhance chart readability and match personal preferences. Clear visual representation of these elements improves the effectiveness of the indicator.
- **Alert Configuration**: Set up alerts for trend changes to receive timely notifications. Alerts help traders act quickly on potential market shifts without constant monitoring, allowing for more efficient trading decisions.
#### Conclusion
The **Uptrick: SMA Pivot Marker (SPM)** is a versatile and powerful technical analysis tool that combines the benefits of the Simple Moving Average with pivot point analysis. By providing insights into market trends, identifying key reversal points, and detecting trend changes, the SPM caters to a wide range of trading strategies, including trend following, reversal trading, swing trading, and scalping.
With its customizable inputs, visual markers, and trend change alerts, the SPM offers traders the flexibility to adapt the indicator to different market conditions and trading styles. Whether used independently or in conjunction with other technical tools, the SPM is designed to enhance trading decision-making and improve overall trading performance. By mastering the use of the SPM, traders can gain a valuable edge in navigating the complexities of financial markets and making more informed trading decisions.
