SMT Divergence x outofoptions🔍 SMT Divergence — Advanced Market Correlation Analysis
This was created with and approved by @outofoptions to bring you smaller SMTs based on his original SMT Divergence indicator
SMT Divergence is a sophisticated technical analysis indicator designed to identify high-probability reversal and continuation signals through intelligent correlation analysis between related markets. This powerful tool reveals hidden market dynamics by comparing price action divergences across correlated instruments, providing traders with institutional-level market insight.
🎯 Core Capabilities:
Multi-Market Analysis : Automatically compares your chart with a correlated instrument to identify divergence patterns and market inefficiencies
Smart Liquidity Detection : Advanced algorithms identify key liquidity levels and sweep patterns for enhanced signal accuracy
Dynamic Divergence Mapping : Real-time visualization of bullish and bearish divergences with customizable line styles and colors
Intelligent Signal Validation : Optional candle-based confirmation system to filter high-probability setups from noise
Automated Line Management : Smart removal of invalidated divergences to maintain clean, actionable chart analysis
📊 Professional Features:
The SMT Divergence indicator excels at revealing market structure imbalances that often precede significant price movements. By analyzing the relationship between correlated markets, it identifies when institutional money may be positioned differently than retail sentiment suggests, providing early warning signals for potential reversals.
⚙️ Advanced Customization:
Flexible correlation pair selection for any market combination
Customizable visual styling with multiple line types and color schemes
Adjustable validation criteria for different trading styles
Professional alert system with detailed message customization
Automatic cleanup of broken or invalidated divergences
🎨 Visual Excellence:
Clean, professional line drawing with customizable styling
Dynamic labeling system with size and color options
Real-time divergence tracking and management
Institutional-grade chart presentation
Optimized performance for extended analysis periods
📈 Ideal For:
Swing traders seeking high-probability reversal signals
Multi-market analysts comparing correlated instruments
Institutional-style traders using correlation analysis
Advanced technical analysts studying market structure
Those seeking early warning signals for trend changes
🔔 Smart Alerts:
Comprehensive alert system with customizable messaging allows you to stay informed of new divergences across multiple timeframes and market sessions, ensuring you never miss critical market developments.
💡 Market Intelligence:
SMT Divergence transforms complex inter-market relationships into clear, actionable signals, giving you the same analytical edge used by professional trading institutions to identify market turning points before they become obvious to retail traders.
Educational Tool: This indicator is designed for educational and analytical purposes. Divergence analysis requires understanding of market correlation principles. Always combine with proper risk management and additional analysis methods.
Cari dalam skrip untuk "accuracy"

Time Range Marker By BCB ElevateThe Time Range Marker is a simple yet powerful visual tool for traders who want to focus on specific time intervals within the trading day. This indicator highlights a custom time range on your chart using a background color, helping you visually isolate key trading sessions or event windows such as:
Market open/close hours
News release periods
High-volatility trading zones
Personal strategy testing windows
⚙️ Key Features:
Customizable start and end time (hour & minute)
Works across all intraday timeframes
Adjustable highlight color to match your chart theme
Built using Pine Script v5 for speed and flexibility
🔧 Settings:
Start Hour / Minute – Set the beginning of the time range (in 24-hour format)
End Hour / Minute – Define when the range ends
Highlight Color – Choose the background color for better visibility
🕒 Timezone Note:
The indicator uses UTC time by default to ensure accuracy across markets. If your broker uses a different timezone (like EST, IST, etc.), the script can be adjusted to reflect your local market hours.
✅ How to Use the Time Range Marker Indicator
This indicator is used to visually highlight a specific time window each trading day, such as:
Market open or close sessions (e.g., NYSE, London, Tokyo)
High-impact news release periods
Custom time slots for strategy testing or scalping
🛠️ Installation Steps
Open TradingView and go to any chart.
Click on Pine Editor at the bottom of the screen.
Copy and paste the full Pine Script (shared above) into the editor.
Click the “Add to Chart” ▶️ button.
The indicator will appear on the chart with a highlighted background during the time range you set.
⚙️ How to Customize the Time Range
After adding the indicator:
Click the gear icon ⚙️ next to the indicator’s name on the chart.
Adjust the following settings:
Start Hour / Start Minute: The beginning of your time range (in 24-hour format).
End Hour / End Minute: When the highlight should stop.
Highlight Color: Pick a color and transparency for visual clarity.
Click OK to apply changes.
🕒 Timezone Consideration
By default, the indicator uses UTC (Coordinated Universal Time).
To match your broker’s timezone (e.g., EST, IST, etc.), you'll need to adjust the script by changing:
sessStart = timestamp("Etc/UTC", ...)
sessEnd = timestamp("Etc/UTC", ...)
to your correct timezone, like "Asia/Kolkata" for IST or "America/New_York" for EST.
Let me know your broker or local timezone, and I’ll update it for you.
📈 Tips for Traders
Combine this with volume, price action, or breakout indicators to focus your strategy on high-probability time windows.
Use multiple versions of this script if you want to highlight more than one time range in a day.

WT + Stoch RSI Reversal ComboOverview – WT + Stoch RSI Reversal Combo
This custom TradingView indicator combines WaveTrend (WT) and Stochastic RSI (Stoch RSI) to detect high-probability market reversal zones and generate Buy/Sell signals.
It enhances accuracy by requiring confirmation from both oscillators, helping traders avoid false signals during noisy or weak trends.
🔧 Key Features:
WaveTrend Oscillator with optional Laguerre smoothing.
Stochastic RSI with adjustable smoothing and thresholds.
Buy/Sell combo signals when both indicators agree.
Histogram for WT momentum visualization.
Configurable overbought/oversold levels.
Custom dotted white lines at +100 / -100 levels for reference.
Alerts for buy/sell combo signals.
Toggle visibility for each element (lines, signals, histogram, etc.).
✅ How to Use the Indicator
1. Add to Chart
Paste the full Pine Script code into TradingView's Pine Editor and click "Add to Chart".
2. Understand the Signals
Green Triangle (BUY) – Appears when:
WT1 crosses above WT2 in oversold zone.
Stoch RSI %K crosses above %D in oversold region.
Red Triangle (SELL) – Appears when:
WT1 crosses below WT2 in overbought zone.
Stoch RSI %K crosses below %D in overbought region.
⚠️ A signal only appears when both WT and Stoch RSI agree, increasing reliability.
3. Tune Settings
Open the settings ⚙️ and adjust:
Channel Lengths, smoothing, and thresholds for both indicators.
Enable/disable visibility of:
WT lines
Histogram
Stoch RSI
Horizontal level lines
Combo signals
4. Use with Price Action
Use this indicator in conjunction with support/resistance zones, chart patterns, or trendlines.
Works best on lower timeframes (5m–1h) for scalping or 1h–4h for swing trading.
5. Set Alerts
Set alerts using:
"WT + Stoch RSI Combo BUY Signal"
"WT + Stoch RSI Combo SELL Signal"
This helps you catch setups in real time without watching the chart constantly.
📊 Ideal Use Cases
Reversal trading from extremes
Mean reversion strategies
Timing entries/exits during consolidations
Momentum confirmation for breakouts

Portfolio Tracker ARJO (V-01)Portfolio Tracker ARJO (V-01)
This indicator is a user-friendly portfolio tracking tool designed for TradingView charts. It overlays a customizable table on your chart to monitor up to 15 stocks or symbols in your portfolio. It calculates real-time metrics like current market price (CMP), gains/losses, and stoploss breaches, helping you stay on top of your investments without switching between multiple charts. The table uses color-coding for quick visual insights: green for profits, red for losses, and highlights breached stoplosses in red for alerts. It also shows portfolio-wide totals for overall performance.
Key Features
Supports up to 15 Symbols: Enter stock tickers (e.g., NSE:RELIANCE or BSE:TCS) with details like buy price, date, units, and stoploss.
Symbol: The stock ticker and description.
Buy Date: When you purchased it.
Units: Number of shares/units held.
Buy Price: Your entry price.
Stop Loss: Your set stoploss level (highlighted in red if breached by CMP).
CMP: Current market price (fetched from the chart's timeframe).
% Gain/Loss: Percentage change from buy price (color-coded: green for positive, red for negative).
Gain/Loss: Total monetary gain/loss based on units.
Optional Timeframe Columns: Toggle to show % change over 1 Week (1W), 1 Month (1M), 3 Months (3M), and 6 Months (6M) for historical performance.
Portfolio Summary: At the top of the table, see total % gain/loss and absolute gain/loss for your entire portfolio.
Visual Customizations: Adjust table position (e.g., Top Right), size, colors for positive/negative values, and intensity cutoff for gradients.
Benchmark Index-Based Header: The title row's background color reflects NIFTY's weekly trend (green if above 10-week SMA, red if below) for market context.
Benchmark Index-Based Header: The title row's background color reflects NIFTY's weekly trend (green if above 10-week SMA, red if below) for market context.
How to Use It: Step-by-Step Guide
Add the Indicator to Your Chart: Search for "Portfolio Tracker ARJO (V-01)" in TradingView's indicator library and add it to any chart (preferably Daily timeframe for accuracy).
Input Your Portfolio Symbols:
Open the indicator settings (gear icon).
In the "Symbol 1" to "Symbol 15" groups, fill in:
Symbol: Enter the ticker (e.g., NSE:INFY).
Year/Month/Day: Select your buy date (e.g., 2024-07-01).
Buy Price: Your purchase price per unit.
Stoploss: Your exit price if things go south.
Units: How many shares you own.
Only fill what you need—leave extras blank. The table auto-adjusts to show only entered symbols.
Customize the Table (Optional):
In "Table settings":
Choose position (e.g., Top Right) and size (% of chart).
Toggle "Show Timeframe Columns" to add 1W/1M/3M/6M performance.
In "Color settings":
Pick colors for positive (green) and negative (red) cells.
Set "Color intensity cutoff (%)" to control how strong the colors get (e.g., 10% means changes above 10% max out the color).
Interpret the Table on Your Chart:
The table appears overlaid—scan rows for each symbol's stats.
Look at colors: Greener = better gains; redder = bigger losses.
Check CMP cell: Red means stoploss breached—consider selling!
Portfolio Gain/Loss at the top gives a quick overall health check.
For Best Results:
Use on a Daily chart to avoid CMP errors (the script will warn if on Weekly/Monthly).
Refresh the chart or wait for a new bar if data doesn't update immediately.
For Indian stocks, prefix with NSE: or BSE: (e.g., BSE:RELIANCE).
This is for tracking only—not trading signals. Combine with your strategy.
If no symbols show, ensure inputs are valid (e.g., buy price > 0, valid date).
Finally, this tool makes it quite easy for beginners to track their portfolios, while also giving advanced traders powerful and customizable insights. I'd love to hear your feedback—happy trading!

Timeframe Quadrants | InvrsROBINHOODTimeframe Quadrant Visualizer
Summary
This indicator is a powerful visualization tool designed to help traders analyze price action by dividing various timeframes into four distinct, color-coded quadrants. By breaking down periods from a full year to a single minute, it offers a unique perspective on market cycles and intraday patterns. The script includes fully customizable colors and display styles, allowing you to tailor the visual output to your specific charting needs.
Key Features
Multiple Timeframe Divisions: Choose to divide a Year, Month, Week, Day, Hour, or Minute into four parts.
Customizable Quadrant Logic:
Year: Divided into calendar quarters (Jan-Mar, Apr-Jun, Jul-Sep, Oct-Dec).
Month: Divided into four approximate weeks (Days 1-7, 8-14, 15-21, 22-end).
Week: Divided into four 42-hour blocks, starting from Sunday at 00:00.
Day: Divided into four 6-hour blocks.
Hour: Divided into four 15-minute blocks.
Minute: Divided into four 15-second blocks.
Flexible Display Options: Visualize the quadrants as either a full Background Color overlay or a Bar Overlay that colors the price bars directly.
Timeframe Separators: A vertical line is automatically drawn at the beginning of each selected timeframe (e.g., at the start of each new day when "Day" is selected), making it easy to see where each period begins.
Full Color Customization: All four quadrant colors are user-definable, along with a global transparency setting to ensure the indicator complements your chart without obscuring price action.
Timezone-Aware: All calculations are performed based on a user-selected timezone from a dropdown menu, ensuring accuracy and consistency across different markets and trading sessions. As an added option, there is a manual input if the timezone is not available.
How to Use
Add to Chart: Add the "Timeframe Quadrants" indicator to your chart.
Open Settings: Hover over the indicator's name on your chart and click the Settings (gear) icon.
Configure the Indicator:
Timeframe: Select the primary time period you want to divide (e.g., "Day", "Week", "Hour").
Display Method: Choose whether you want the quadrants to appear as a Background Color or a Bar Overlay.
Timezone: Select the desired timezone from the dropdown menu. This is crucial for aligning the quadrants with specific market sessions (e.g., "America/New_York" for the NYSE session).
Quadrant Colors: Customize the color for each of the four quadrants.
Transparency %: Adjust the transparency of the colors to your preference.
Underlying Concepts
This script operates by using Pine Script's built-in time and date variables. It identifies the current bar's position within the user-selected timeframe (timeframe_choice) and assigns it to one of four quadrants based on pre-defined logic. For example, when "Day" is selected, it uses the hour() function to determine which 6-hour block the current bar falls into. The vertical separator lines are generated by detecting a change in the relevant time unit (e.g., ta.change(dayofmonth)), which marks the first bar of a new period.
Disclaimer: This tool is intended for visual analysis and pattern recognition. It does not generate buy or sell signals and should be used in conjunction with your own trading strategy and risk management. Past performance is not indicative of future results.

LANZ Strategy 6.0 [Backtest]🔷 LANZ Strategy 6.0 — Precision Backtesting Based on 09:00 NY Candle, Dynamic SL/TP, and Lot Size per Trade
LANZ Strategy 6.0 is the simulation version of the original LANZ 6.0 indicator. It executes a single LIMIT BUY order per day based on the 09:00 a.m. New York candle, using dynamic Stop Loss and Take Profit levels derived from the candle range. Position sizing is calculated automatically using capital, risk percentage, and pip value — allowing accurate trade simulation and performance tracking.
📌 This is a strategy script — It simulates real trades using strategy.entry() and strategy.exit() with full money management for risk-based backtesting.
🧠 Core Logic & Trade Conditions
🔹 BUY Signal Trigger:
At 09:00 a.m. NY (New York time), if:
The current candle is bullish (close > open)
→ A BUY order is placed at the candle’s close price (EP)
Only one signal is evaluated per day.
⚙️ Stop Loss / Take Profit Logic
SL can be:
Wick low (0%)
Or dynamically calculated using a % of the full candle range
TP is calculated using the user-defined Risk/Reward ratio (e.g., 1:4)
The TP and SL levels are passed to strategy.exit() for each trade simulation.
💰 Risk Management & Lot Size Calculation
Before placing the trade:
The system calculates pip distance from EP to SL
Computes the lot size based on:
Account capital
Risk % per trade
Pip value (auto or manual)
This ensures every trade uses consistent, scalable risk regardless of instrument.
🕒 Manual Close at 3:00 p.m. NY
If the trade is still open by 15:00 NY time, it will be closed using strategy.close().
The final result is the actual % gain/loss based on how far price moved relative to SL.
📊 Backtest Accuracy
One trade per day
LIMIT order at the candle close
SL and TP pre-defined at execution
No repainting
Session-restricted (only runs on 1H timeframe)
✅ Ideal For:
Traders who want to backtest a clean and simple daily entry system
Strategy developers seeking reproducible, high-conviction trades
Users who prefer non-repainting, session-based simulations
👨💻 Credits:
💡 Developed by: LANZ
🧠 Logic & Money Management Engine: LANZ
📈 Designed for: 1H charts
🧪 Purpose: Accurate simulation of LANZ 6.0's NY Candle Entry system

Quantum Dip Hunter | AlphaNattQuantum Dip Hunter | AlphaNatt
🎯 Overview
The Quantum Dip Hunter is an advanced technical indicator designed to identify high-probability buying opportunities when price temporarily dips below dynamic support levels. Unlike simple oversold indicators, this system uses a sophisticated quality scoring algorithm to filter out low-quality dips and highlight only the best entry points.
"Buy the dip" - but only the right dips. Not all dips are created equal.
⚡ Key Features
5 Detection Methods: Choose from Dynamic, Fibonacci, Volatility, Volume Profile, or Hybrid modes
Quality Scoring System: Each dip is scored from 0-100% based on multiple factors
Smart Filtering: Only signals above your quality threshold are displayed
Visual Effects: Glow, Pulse, and Wave animations for the support line
Risk Management: Automatic stop-loss and take-profit calculations
Real-time Statistics: Live dashboard showing current market conditions
📊 How It Works
The indicator calculates a dynamic support line using your selected method
When price dips below this line, it evaluates the dip quality
Quality score is calculated based on: trend alignment (30%), volume (20%), RSI (20%), momentum (15%), and dip depth (15%)
If the score exceeds your minimum threshold, a buy signal arrow appears
Stop-loss and take-profit levels are automatically calculated and displayed
🚀 Detection Methods Explained
Dynamic Support
Adapts to recent price action
Best for: Trending markets
Uses ATR-adjusted lowest points
Fibonacci Support
Based on 61.8% and 78.6% retracement levels
Best for: Pullbacks in strong trends
Automatically switches between fib levels
Volatility Support
Uses Bollinger Band methodology
Best for: Range-bound markets
Adapts to changing volatility
Volume Profile Support
Finds high-volume price levels
Best for: Identifying institutional support
Updates dynamically as volume accumulates
Hybrid Mode
Combines all methods for maximum accuracy
Best for: All market conditions
Takes the most conservative support level
⚙️ Key Settings
Dip Detection Engine
Detection Method: Choose your preferred support calculation
Sensitivity: Higher = more sensitive to price movements (0.5-3.0)
Lookback Period: How far back to analyze (20-200 bars)
Dip Depth %: Minimum dip size to consider (0.5-10%)
Quality Filters
Trend Filter: Only buy dips in uptrends when enabled
Minimum Dip Score: Quality threshold for signals (0-100%)
Trend Strength: Required trend score when filter is on
📈 Trading Strategies
Conservative Approach
Use Dynamic method with Trend Filter ON
Set minimum score to 80%
Risk:Reward ratio of 2:1 or higher
Best for: Swing trading
Aggressive Approach
Use Hybrid method with Trend Filter OFF
Set minimum score to 60%
Risk:Reward ratio of 1:1
Best for: Day trading
Scalping Setup
Use Volatility method
Set sensitivity to 2.0+
Focus on Target 1 only
Best for: Quick trades
🎨 Visual Customization
Color Themes:
Neon: Bright cyan/magenta for dark backgrounds
Ocean: Cool blues and teals
Solar: Warm yellows and oranges
Matrix: Classic green terminal look
Gradient: Smooth color transitions
Line Styles:
Solid: Clean, simple line
Glow: Adds depth with glow effect
Pulse: Animated breathing effect
Wave: Oscillating wave pattern
💡 Pro Tips
Start with the Trend Filter ON to avoid catching falling knives
Higher quality scores (80%+) have better win rates but fewer signals
Use Volume Profile method near major support/resistance levels
Combine with your favorite momentum indicator for confirmation
The pulse animation can help draw attention to key levels
⚠️ Important Notes
This indicator identifies potential entries, not guaranteed profits
Always use proper risk management
Works best on liquid instruments with good volume
Backtest your settings before live trading
Not financial advice - use at your own risk
📊 Statistics Panel
The live statistics panel shows:
Current detection method
Support level value
Trend direction
Distance from support
Current signal status
🤝 Support
Created by AlphaNatt
For questions or suggestions, please comment below!
Happy dip hunting! 🎯
Not financial advice, always do your own research

Exchanges Combined Volume📊 Exchanges Combined Volume
(Aggregated Multi-Exchange Volume: Binance, OKX, Bybit, etc.) by BIGTAKER*
🔍 Purpose
The Exchanges Combined Volume indicator aggregates real-time trading volumes from multiple global exchanges for a specific asset (e.g., a cryptocurrency).
Instead of relying on a single market, it provides a broader view of market activity, helping users detect abnormal volume behavior and increased participation across the entire market.
⚙️ Supported Exchanges
* USDT Markets
`Binance`, `OKX`, `Bybit`, `Bitget`, `Gate.io`
* USD Markets
`Coinbase`, `Bitfinex`, `Bitstamp`
* Default
Includes the current chart symbol’s native volume by default.
🧮 Core Calculation Logic
1. 📛 Symbol Normalization (cleanSymbol)
Prefixes such as `1000`, `10000`, `100000`, or `1M` (common in leveraged tickers) are automatically removed to extract the base token.
> Example:
> `1000PEPEUSDT` → `PEPEUSDT`
2. 📈 Volume Requests from External Exchanges
Volume is retrieved using the `` format (e.g., `'BINANCE:PEPEUSDT'`, `'COINBASE:BTCUSD'`).
Invalid or delisted pairs are safely ignored using `ignore_invalid_symbol=true`.
3. 📊 Total Volume Calculation
totalVolume = usdtVolume + usdVolume + currentSymbolVolume
The indicator sums the volume from all target exchanges plus the volume from the current chart symbol.
4. 📏 Comparison to Average Volume
* Period: `length = 60` (Simple Moving Average over 60 candles)
* A candle is considered **high-intensity** if:
5. 🎨 Visual Styling
| Condition | Color | Meaning |
| -------------------------- | --------------------- | ----------------------- |
| High-volume Bullish Candle | Light Green (#30db78) | Strong Buying Activity |
| High-volume Bearish Candle | Bright Red (#ff0000) | Strong Selling Activity |
| Normal Bullish Candle | Dark Green (#3c7058) | Regular Buying Volume |
| Normal Bearish Candle | Dark Red (#682e2c) | Regular Selling Volume |
📌 Use Cases
* Detect synchronized volume surges across major global exchanges.
* Identify pre-pump accumulation phases on altcoins.
* Combine with premium gap indicators (e.g., Kimchi Premium) to identify leading market sentiment.
* Confirm breakout momentum with multi-exchange volume validation.
📘 Notes & Warnings
* Listing differences across exchanges may result in **zero volume** on some platforms.
* Prefixes like `1000`, `1M`, etc., are automatically removed to **improve symbol matching accuracy**.
* As volume units are not standardized, this indicator is best suited for **absolute value analysis**, not ratio-based comparisons.

Expansion Triangle [TradingFinder] MegaPhone Broadening🔵 Introduction
The Expanding Triangle, also known as the Broadening Formation, is one of the key technical analysis patterns that clearly reflects growing market volatility, increasing indecision among participants, and the potential for sharp price explosions.
This pattern is typically defined by a sequence of higher highs and lower lows, forming within two diverging trendlines. Unlike traditional triangles that converge to a breakout point, the expanding triangle pattern becomes wider over time, leaving no precise apex for a breakout to occur.
From a price action perspective, the pattern represents a prolonged tug-of-war between buyers and sellers, where neither side has taken control yet. Each aggressive swing opens the door to new opportunities whether it's a trend reversal, range trading, or a momentum breakout. This dual nature makes the pattern highly versatile across market conditions, from exhausted trend ends to volatile consolidation zones.
The custom-built indicator for this pattern uses a combination of smart algorithms and detailed analysis of swing dynamics to automatically detect expanding triangles and highlight low-risk entry points.
Traders can use this tool to capitalize on high-probability setups from shorting near the upper edge of the structure with confirmation, to trading bearish breakouts during trend continuations, or entering long positions near the lower boundary during bullish reversals. The chart examples included in this article demonstrate these three highly practical trading scenarios in live market conditions.
A major advantage of this indicator lies in its structural filtering engine, which analyzes the behavior of each price leg in the triangle. With four adjustable filter levels from Very Aggressive, which highlights all potential patterns, to Very Defensive, which only triggers when price actually touches the triangle's trendlines the indicator ensures that only structurally sound and verified setups appear on the chart, reducing noise and false signals significantly.
Long Setup :
Short Setup :
🔵 How to Use
The pattern typically forms in conditions of heightened uncertainty and volatility, where price swings generate a series of higher highs and lower lows. The expanding triangle consists of three key legs bounded by diverging trendlines. The indicator intelligently analyzes each leg's direction and angle to determine whether a valid pattern is forming.
At the core of the indicator’s logic is its leg filtering system, which controls the quality of the pattern and filters out weak or noisy setups. Four structural filter modes are available to suit different trading styles and risk preferences. In Very Aggressive mode, filters are disabled, and the indicator detects any pattern purely based on the sequence of swing points.
This mode is ideal for traders who want to see everything and apply their own discretion.
In Aggressive mode, the indicator checks whether each new leg extends no more than twice the length of the previous one. If a leg overshoots excessively, the structure is invalidated.
In Defensive mode, the filter enforces a minimum movement requirement each leg must move at least 2% of the previous one. This prevents the formation of shallow, weak patterns that visually resemble triangles but lack substance.
The strictest setting, Very Defensive, combines all previous filters and additionally requires the price to physically touch the triangle’s trendlines before issuing a signal. This ensures that setups only appear when real market interaction with key structural levels has occurred, not based on assumptions or geometry alone. This mode is ideal for traders seeking maximum precision and minimal risk.
🟣 Bullish Setup
A bullish setup within the Expanding Triangle pattern occurs when price revisits the lower support boundary after a series of broad swings typically near the third leg of the formation. This area often represents a shift in momentum, where sellers begin to lose strength and buyers prepare to take control.
Ideally, the setup is accompanied by a bullish reversal candle (e.g. doji, pin bar, or engulfing) near the lower trendline. If the Very Defensive filter is active, the indicator will only issue a signal if price makes a confirmed touch on the trendline and reacts from that level. This significantly improves signal accuracy and filters out premature entries.
After confirmation, traders may choose to enter a long position on the bullish candle or shortly afterward. A logical stop-loss is placed just below the recent swing low within the pattern. The target can be set at or near the upper trendline, or projected using the full height of the triangle added to the breakout point. On higher timeframes, this reversal often marks the beginning of a strong uptrend.
🟣 Bearish Setup
A bearish setup forms when price climbs toward the upper resistance trendline, usually as the third leg completes. This is where buyers often begin to show exhaustion, and sellers step in with strength providing an ideal low-risk entry point for short positions.
As with the bullish setup, if the Candle Confirmation filter is enabled, the indicator will only show a signal when a bearish reversal candle forms at the point of contact. If Defensive or Very Defensive filters are also active, the setup must meet strict criteria of proportionate leg movement and an actual trendline touch to qualify.
Once confirmed, traders can enter on the reversal candle, placing a stop-loss slightly above the recent high. The target can be set at the lower trendline or calculated based on the triangle's full height, projected downward. This setup is particularly useful at the end of weak bullish trends or in volatile market tops.
🔵 Settings
🟣 Logic Settings
Pivot Period : Defines how many bars are analyzed to identify swing highs and lows. Higher values detect larger, slower structures, while lower values respond to faster patterns. The default value of 13 offers a balanced sensitivity.
Pattern Filter :
Very Aggressive : Detects all patterns based on point sequence with no structural checks.
Aggressive : Ensures each leg is no more than 2x the size of the previous one.
Defensive : Requires each leg to be at least 2% the size of the previous leg.
Very Defensive : The strictest level; only confirms patterns when price touches trendlines.
Candle Confirmation : When enabled, the indicator requires a valid confirmation candle (doji, pin bar, engulfing) at the interaction point with the trendline before issuing a signal. This reduces false entries and improves entry precision.
🟣 Alert Settings
Alert : Enables alerts for SSS.
Message Frequency : Determines the frequency of alerts. Options include 'All' (every function call), 'Once Per Bar' (first call within the bar), and 'Once Per Bar Close' (final script execution of the real-time bar). Default is 'Once per Bar'.
Show Alert Time by Time Zone : Configures the time zone for alert messages. Default is 'UTC'.
🔵 Conclusion
The Expanding Triangle pattern, with its wide structure and volatility-driven nature, represents chaos but also opportunity. For traders who can read its behavior, it provides some of the most powerful setups for reversals, breakouts, and range-based trades. While the pattern may seem messy at first glance, it is built on clear logic and when properly detected, it offers high-probability opportunities.
This indicator doesn’t just draw expanding triangles it intelligently evaluates their structural quality, validates price interaction through candle confirmation, and allows the trader to fine-tune the detection logic through adjustable filter levels. Whether you’re a reversal trader looking for a turning point, or a breakout trader hunting momentum, this tool adapts to your strategy.
In volatile or uncertain markets, where fakeouts and sudden shifts are common, this indicator can become a cornerstone of your trading system helping you turn volatility into structured, high-quality opportunities.

LANZ Strategy 5.0 [Backtest]🔷 LANZ Strategy 5.0 — Rule-Based BUY Logic with Time Filter, Session Limits and Auto SL/TP Execution
This is the backtest version of LANZ Strategy 5.0, built as a strategy script to evaluate real performance under fixed intraday conditions. It automatically places BUY and SELL trades based on structured candle confirmation, EMA trend alignment, and session-based filters. The system simulates real-time execution with precise Stop Loss and Take Profit levels.
📌 Built for traders seeking to simulate clean intraday logic with fully automated entries and performance metrics.
🧠 Core Logic & Strategy Conditions
✅ BUY Signal Conditions:
Price is above the EMA200
The last 3 candles are bullish (close > open)
The signal occurs within the defined session window (NY time)
Daily trade limit has not been exceeded
If all are true, a BUY order is executed at market, with SL and TP set immediately.
🔻 SELL Signal Conditions (Optional):
Exactly inverse to BUY (below EMA + 3 bearish candles). Disabled by default.
🕐 Operational Time Filter (New York Time)
You can fully customize your intraday window:
Start Time: e.g., 01:15 NY
End Time: e.g., 16:00 NY
The system evaluates signals only within this range, even across midnight if configured.
🔁 Trade Management System
One trade at a time per signal
Trades include a Stop Loss (SL) and Take Profit (TP) based on pip distance
Trade result is calculated automatically
Each signal is shown with a triangle marker (BUY only, by default)
🧪 Backtest Accuracy
This version uses:
strategy.order() for entries
strategy.exit() for SL and TP
strategy.close_all() at the configured manual closing time
This ensures realistic behavior in the TradingView strategy tester.
⚙️ Flow Summary (Step-by-Step)
On every bar, check:
Is the time within the operational session?
Is the price above the EMA?
Are the last 3 candles bullish?
If conditions met → A BUY trade is opened:
SL = entry – X pips
TP = entry + Y pips
Trade closes:
If SL or TP is hit
Or at the configured manual close time (e.g., 16:00 NY)
📊 Settings Overview
Timeframe: 1-hour (ideal)
SL/TP: Configurable in pips
Max trades/day: User-defined (default = 99 = unlimited)
Manual close: Adjustable by time
Entry type: Market (not limit)
Visuals: Plotshape triangle for BUY entry
👨💻 Credits:
💡 Developed by: LANZ
🧠 Strategy logic & execution: LANZ
✅ Designed for: Clean backtesting, clarity in execution, and intraday logic simulation

MP MTF LiquidityMP MTF Liquidity
Multi-Timeframe Liquidity Levels – Automatic High/Low Tracking
This indicator automatically tracks and draws liquidity levels (recent highs and lows) from up to 6 custom timeframes directly on your chart. It’s designed for advanced traders who want to visualize important swing points and liquidity pools across multiple timeframes—ideal for Smart Money Concepts (SMC), ICT, and price action trading.
Key Features:
Multi-Timeframe Support:
Select up to 6 different timeframes (ex: 1H, 4H, Daily, Weekly, etc.), each with separate color and visibility controls.
Real Liquidity (No Repaint):
Levels are only drawn from fully closed bars on each timeframe—no lines from currently forming candles, ensuring accuracy and no forward-looking bias.
Automatic Detection:
Highs and lows are detected automatically. Levels that get swept (price breaks through) are converted to dashed lines for easy visual distinction.
Customizable:
Choose line colors for highs/lows and set the maximum number of active levels per timeframe to keep charts clean.
Extended Lines:
All levels are extended to the right, helping you see how current price interacts with past liquidity.
How It Works:
On every new bar of your chosen higher timeframe(s), the indicator records the high and low of the previous (just-closed) candle.
These levels are extended as rays until price sweeps (crosses) them.
When a level is swept, it is redrawn as a dashed line to highlight liquidity grabs or stop hunts.
No lines are drawn for the “live” bar—only confirmed, closed levels are displayed.
Who is this for?
SMC, ICT, and price action traders seeking high-confidence liquidity zones.
Intraday, swing, and multi-timeframe traders who want an automated, visual edge.
Anyone wanting to avoid repainting or “fake” levels from unfinished candles.
Tip:
Combine this indicator with your favorite order block, fair value gap (FVG), or market structure tools for even greater context and confluence.
Disclaimer:
No indicator guarantees profits. Always use with proper risk management and in conjunction with your trading plan.

Ralph Indicator - ZaraTrust Smart MoneyThe Ralph Indicator – ZaraTrust Smart Money is a powerful yet simple Smart Money Concepts (SMC) based tool designed for traders who want to trade like institutions. It auto-detects high-probability Buy/Sell zones, Support/Resistance levels, and Demand/Supply areas on the chart — giving you clear, visual, and actionable signals without the clutter.
⸻
🔍 Key Features:
✅ Smart Money Structure
• Uses pivot-based logic to identify potential structure points
• Helps you understand market flow (e.g., BOS, CHoCH simplified logic)
✅ Automatic Support & Resistance
• Plots major levels based on significant highs and lows
• Helps catch key reversal or breakout zones
✅ Demand & Supply Zones
• Visually shows areas where price may react strongly
• Based on smart pivot detection from recent swings
✅ Buy/Sell Trade Signals
• Highlights buy when price breaks resistance (possible bullish shift)
• Highlights sell when price breaks support (possible bearish shift)
✅ Clean & Easy UI
• Toggle features on/off from settings panel
• Labels and shapes are plotted clearly on the chart for instant reading
⸻
🛠️ Recommended Use:
• Use on 15min to 4H timeframe for intraday or swing trading
• Combine with price action (e.g., confirmation candles, liquidity grab)
• Works best when paired with institutional logic (OBs, FVG, liquidity)
⸻
⚠️ Disclaimer:
This indicator is a tool, not a signal service.
It does not guarantee 98% accuracy, but it’s designed to highlight smart money zones and high-probability areas. Always do your own risk management and backtest before using on a live account.

VSA-Stopping VolumeVSA Stopping Volume Indicator
Stopping Volume occurs when candles show decreasing body sizes (narrow spreads) while volume steadily increases.
Example chart:
As you see:
3 consecutive candles in same direction (all green OR all red)
Body sizes (spreads) decreasing progressively: Candle 1 > Candle 2 > Candle 3
Volume increasing progressively: Volume 1 < Volume 2 < Volume 3
This pattern indicates price absorption - increased buying/selling pressure but declining price movement, often signaling exhaustion and potential reversal.
Indicator Features
This indicator detects Stopping Volume candlestick clusters with two signal types:
🔹 BUY/SELL Signals: Generated when pattern occurs at support/resistance zones
🔹 Directional Alerts (▲-green, ▼-red): Generated when pattern occurs outside key levels
Trading Guidelines:
⚠️ Auto-drawn S/R zones are reference only - manual level plotting recommended for accuracy
📊 Best for scalping: M5, M10, M15 timeframes
🛡️ Stop Loss: Place beyond the S/R zone you're trading
🎯 Take Profit: Based on your risk management
Key Concept: Volume expansion + price contraction = potential reversal, especially at SnR levels.
Perfect for scalpers looking to catch reversals at critical zones!

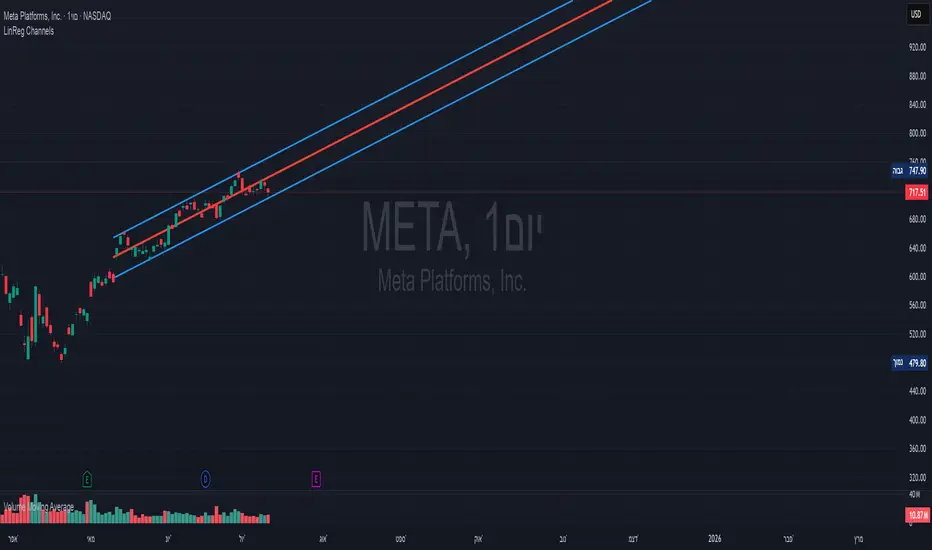
Linear Regression Channels📈 Linear Regression Channels
🌟 Overview
A professional dual linear regression channel indicator designed for comprehensive trend analysis. This powerful tool provides simultaneous short-term and long-term trend perspectives through two independent regression channels with customizable standard deviation bands.
🔧 Core Features
📊 Dual Channel System
Channel 1: 43-period regression analysis for long-term trend identification
Channel 2: 20-period regression analysis for short-term momentum tracking
Independent Configuration: Each channel fully customizable with separate parameters
Real-Time Updates: Dynamic calculations with every new candle
📐 Standard Deviation Bands
Multiple Levels: Configurable deviation bands (1σ, 2σ, 3σ)
Dynamic Support/Resistance: Automatically calculated price levels
Trend Boundaries: Clear visualization of trend strength and direction
Statistical Precision: Mathematically accurate regression calculations
🎨 Customization Options
🎭 Visual Styling
Individual Colors: Separate color schemes for each channel
Line Styles: Choose between Solid, Dashed, or Dotted lines
Line Width: Adjustable thickness (1-5 pixels) for optimal visibility
Extension Options: Project lines into the future for analysis
⚙️ Technical Parameters
Period Length: Fully adjustable lookback periods
Source Selection: Choose from Close, Open, High, Low, or custom sources
Deviation Levels: Customizable standard deviation multipliers
Display Control: Toggle individual channels on/off
📈 Trading Applications
🎯 Trend Analysis
Dual Timeframe Perspective: Simultaneous short and long-term view
Trend Confirmation: When both channels align in direction
Trend Strength: Measured by price position within channels
🔍 Support & Resistance
Dynamic Levels: Standard deviation bands as S/R zones
Channel Boundaries: Natural support and resistance areas
Confluence Trading: Multiple level confirmations
⚡ Entry & Exit Signals
Channel Breakouts: Trend continuation opportunities
Mean Reversion: Trades back to center line
Channel Crossovers: When price moves between timeframes
🚀 Key Benefits
✅ Multi-Timeframe Analysis - Complete market perspective
✅ Mathematical Precision - Least squares regression accuracy
✅ High Customization - Adaptable to any trading style
✅ Clean Interface - Professional chart appearance
✅ Performance Optimized - Smooth real-time operation
✅ Versatile Application - Works on all markets and timeframes
💡 Professional Usage
Combine both channels for confluence signals
Use longer channel for overall trend bias
Trade shorter channel signals within longer trend
Monitor channel width for volatility analysis
Essential tool for traders seeking precise trend analysis and dynamic support/resistance levels.
Pattern Detector [theUltimator5]🎯 Overview
The Pattern Detector is a comprehensive technical analysis indicator that automatically identifies and visualizes multiple pattern types on your charts. Built with advanced ZigZag technology and sophisticated pattern recognition algorithms, this tool helps traders spot high-probability trading opportunities across all timeframes and markets.
✨ Key Features
🔍 Multi-Pattern Detection System
Harmonic Patterns: Butterfly, Gartley, Bat, and Crab patterns with precise Fibonacci ratios
Classic Reversal Patterns: Head & Shoulders and Inverse Head & Shoulders
Double Patterns: Double Tops and Double Bottoms with extreme validation
Wedge Patterns: Rising and Falling Wedges with volume confirmation
📊 Advanced ZigZag Engine
Customizable sensitivity (5-50 levels)
Depth multiplier for multi-timeframe analysis
Real-time pivot detection with noise filtering
Option to display ZigZag lines only for pure price action analysis
🎨 Visualization
Clean pattern lines with distinct color coding
Point labeling system (X, A, B, C, D for harmonics / LS, H, RS for H&S)
Pattern name displays with bullish/bearish direction
Price target projections with arrow indicators
Subtle pattern fills for enhanced visibility
🛠️ Settings & Configuration
Core ZigZag Settings
ZigZag Sensitivity (5-50): Controls pattern detection sensitivity. Lower values detect more patterns but may include noise. Higher values focus on major swings only.
ZigZag Depth Multiplier (1-5): Multiplies sensitivity for deeper analysis. Level 1 = most responsive, Level 5 = major swings only.
Pattern Detection Toggles
Show ZigZag Lines Only: Displays pure ZigZag without pattern detection for price structure analysis
Detect Harmonic Patterns: Enable/disable Fibonacci-based harmonic pattern detection
Detect Head & Shoulders: Toggle classic reversal pattern identification
Detect Double Tops/Bottoms: Enable double pattern detection with extreme validation
Detect Wedge Patterns: Toggle wedge pattern detection with volume confirmation
Display Options
Show Pattern Names: Display pattern names directly on chart (e.g., "Butterfly (Bullish)")
Show Point Labels: Add lettered labels at key pattern points for structure identification
Project Harmonic Targets: Show projected completion points for incomplete harmonic patterns
📈 Pattern Types Explained
Harmonic Patterns 🦋
Advanced Fibonacci-based patterns that provide high-probability reversal signals:
Butterfly: AB=0.786 XA, BC=0.382-0.886 AB, CD=1.618-2.24 BC
Gartley: AB=0.618 XA, BC=0.382-0.886 AB, CD=1.272-1.618 BC
Bat: AB=0.382-0.50 XA, BC=0.382-0.886 AB, CD=1.618-2.24 BC
Crab: AB=0.382-0.618 XA, BC=0.382-0.886 AB, CD=2.24-3.618 BC
Head & Shoulders 👤
Classic three-peak reversal pattern indicating trend exhaustion:
Standard H&S: Bearish reversal at tops
Inverse H&S: Bullish reversal at bottoms
Automatic neckline validation and price target calculation
Double Patterns 📊
Powerful reversal patterns with extreme validation:
Double Top: Two similar highs with valley between (bearish)
Double Bottom: Two similar lows with peak between (bullish)
Includes lookback period validation to ensure patterns are significant extremes
Wedge Patterns 📐
Continuation/reversal patterns with converging trend lines:
Rising Wedge: Converging upward slopes (typically bearish)
Falling Wedge: Converging downward slopes (typically bullish)
Volume confirmation required for increased accuracy
🎯 Trading Applications
Entry Signals
Harmonic Patterns: Enter at point D completion with targets at point A
H&S Patterns: Enter on neckline break with calculated targets
Double Patterns: Enter on support/resistance break with measured moves
Wedge Patterns: Enter on breakout direction with volume confirmation
Risk Management
Use pattern structure for logical stop placement
Pattern invalidation levels provide clear exit rules
Multiple pattern confirmation increases probability
Multi-Timeframe Analysis
Higher ZigZag depth for longer-term patterns
Lower sensitivity for short-term trading patterns
Combine with other timeframes for confluence
⚙️ Optimal Settings
For Day Trading (1m-15m charts)
ZigZag Sensitivity: 5-9
Depth Multiplier: 1-2
Enable all pattern types for maximum opportunities
For Swing Trading (1H-4H charts)
ZigZag Sensitivity: 9-15
Depth Multiplier: 2-3
Focus on harmonic and H&S patterns
For Position Trading (Daily+ charts)
ZigZag Sensitivity: 15-25
Depth Multiplier: 3-5
Emphasize major harmonic and double patterns
🔧 Technical Specifications
Maximum Lookback: 5000 bars for comprehensive analysis
Pattern Overlap Prevention: Intelligent filtering prevents duplicate patterns
Performance Optimized: Efficient algorithms for real-time detection
Volume Integration: Advanced volume analysis for wedge confirmation
Fibonacci Precision: 10% tolerance for harmonic ratio validation
📚 How to Use
Add to Chart: Apply indicator to any timeframe/market
Configure Settings: Adjust sensitivity based on trading style
Enable Patterns: Toggle desired pattern types
Analyze Results: Look for completed patterns with clear structure
Plan Trades: Use price targets and pattern invalidation for trade management
Perfect for both novice and experienced traders seeking systematic pattern recognition with visualization and entry/exit signals.

Support and Resistance Levels with BreaksThis indicator identifies dynamic support and resistance levels using pivot point analysis and provides clear trading signals when these levels are broken with volume confirmation. Enhanced version with improved signal clarity for better trading decisions.
## 🔧 Key Features
### Support & Resistance Detection
- Automatically identifies key pivot high and low levels
- Draws clear visual lines (red for resistance, blue for support)
- Configurable sensitivity with left/right bar settings
### Enhanced Trading Signals
- **BUY** signals when resistance is broken with volume confirmation
- **SELL** signals when support is broken with volume confirmation
- **Bull Wick** alerts for potential reversals at resistance
- **Bear Wick** alerts for potential reversals at support
### Volume Confirmation
- Built-in volume oscillator using 5 and 10-period EMAs
- Filters out low-volume false breakouts
- Adjustable volume threshold (default: 20%)
### Complete Alert System
- Support Broken alerts
- Resistance Broken alerts
- Bull Wick reversal alerts
- Bear Wick reversal alerts
## ⚙️ Settings
- **Show Breaks**: Toggle signal display
- **Left Bars**: Pivot detection lookback (default: 15)
- **Right Bars**: Pivot detection lookforward (default: 15)
- **Volume Threshold**: Minimum volume increase for valid signals (default: 20%)
## 📈 Best For
- Swing trading strategies
- Breakout confirmation
- Support/resistance trading
- Volume-based entry signals
## 🔍 How It Works
1. Identifies pivot highs/lows using configurable periods
2. Calculates volume oscillator for confirmation
3. Generates BUY signals on resistance breaks with volume
4. Generates SELL signals on support breaks with volume
5. Detects wick patterns for potential reversals
## 📋 Updates in This Version
- Enhanced BUY/SELL signal clarity (replaced generic "B" labels)
- Added Bull Wick and Bear Wick alert conditions
- Updated to Pine Script v6 compatibility
- Improved signal filtering and accuracy
## ⚠️ Disclaimer
This indicator is for educational and informational purposes only. Always conduct your own analysis and risk management before making trading decisions. Past performance does not guarantee future results.
---
**Original Script**: "Support and Resistance Levels with Breaks" by LuxAlgo
**License**: CC BY-NC-SA 4.0
**Enhanced by**: profitgang
**Version**: Pine Script v6
Essa's Sessions IndicatorOverview
This powerful tool is designed to visually map out the key trading sessions: Asia, London, and New York directly on your chart. By highlighting these periods and plotting their respective highs and lows, it helps you identify critical price levels, gauge market sentiment, and pinpoint potential breakout opportunities with ease.
What It Does
Visualizes Key Trading Sessions: Automatically draws colored backgrounds for the Asia, London, and New York sessions to show you exactly when the most important market activity is happening.
Plots Session Highs & Lows: Displays precise horizontal lines for the highest and lowest prices reached during each session, acting as key support and resistance levels.
Dual Timezone Mode: Easily switch between London (GMT/BST) and New York (EST/EDT) timezones with a single click. The indicator automatically adjusts all session times for you, ensuring accuracy no matter where you are.
Interactive & Informative Labels: Hover over any session high or low label to see a detailed tooltip containing:
The exact price level.
The session's price range (calculated in pips or points).
The total daily price range for broader context.
A simple volatility gauge (from "Low Vol 😴" to "High Vol 🔥").
Customizable Alerts: Enable breakout alerts to receive instant notifications the moment the price closes above a session high or below a session low.
Simple, powerful, and highly informative, this indicator is an essential tool for traders looking to build strategies around session-based price action.

Zero-Lag RSI DivergenceZero-Lag RSI Divergence
Overview
This indicator identifies RSI divergences in real-time without delay, providing immediate signals as price-momentum discrepancies develop. The indicator analyzes price action against RSI momentum across dual configurable periods, enabling traders to detect potential reversal opportunities with zero lag.
Key Features
Instant Divergence Detection : Identifies bullish and bearish divergences immediately upon formation without waiting for candle confirmation or historical validation. This eliminates signal delay but may increase false signals due to higher sensitivity.
Dual Period Analysis : Configure detection across two independent cycles - Short Period (default 15) and Long Period (default 50) - allowing for multi-timeframe divergence analysis and enhanced signal validation across different market conditions.
Visual Divergence Lines : Automatically draws dashed lines connecting divergence points between price highs/lows and corresponding RSI peaks/troughs, clearly illustrating the momentum-price relationship.
Customizable RSI Parameters : Adjustable RSI length (default 14) allows optimization for different market volatility and trading timeframes.
How It Works
The indicator continuously monitors price action patterns and RSI momentum:
- Bullish Divergence : Detected when price makes lower lows while RSI makes higher lows, suggesting potential upward momentum
- Bearish Divergence : Identified when price makes higher highs while RSI makes lower highs, indicating potential downward momentum
The algorithm uses candle color transitions and immediate RSI comparisons to trigger signals without historical repainting , ensuring backtesting accuracy and real-time reliability.
How To Read
Important Notes
Higher Signal Frequency : The zero-lag approach increases signal sensitivity, generating more frequent alerts that may include false signals. Consider using additional confirmation methods for trade entries.
Non-Repainting : All signals are generated and maintained without historical modification, ensuring consistent backtesting and forward-testing results.
Input Parameters
RSI Length: Period for RSI calculation (default: 14)
Short/Long Periods: Lookback periods for divergence detection (default: 15/50)
Line Colors: Customizable colors for short and long period divergence lines
Label Settings: Optional divergence labels with custom text
This indicator is designed for traders seeking immediate divergence identification across multiple timeframes while maintaining signal integrity and backtesting reliability.

Volume-Confirmed Price Momentum# **Volume-Confirmed Price Momentum (VCPM) Indicator**
## **🔍 Overview**
Introducing the **Volume-Confirmed Price Momentum (VCPM)**, a sophisticated dual-metric indicator designed to identify high-probability momentum moves by analyzing the relationship between price action and volume dynamics. This indicator combines correlation analysis with volume strength validation to filter out weak signals and highlight institutional-backed movements.
---
## **⚙️ Core Mechanics**
**Price-Volume Correlation Engine:**
- Calculates real-time correlation between price movements and volume
- Configurable lookback period (default: 8 bars)
- Option to use price changes or absolute values
- Correlation range: -1.0 (perfect negative) to +1.0 (perfect positive)
**Volume Strength Analyzer:**
- Compares current volume against its moving average (default: 128 periods)
- Normalizes volume ratio to 0-1 scale for consistent interpretation
- Identifies when volume significantly exceeds historical norms
---
## **📊 Signal Generation**
### **🟢 Bullish Confirmation Signal**
**Trigger:** Positive correlation > 0.6 + Volume ratio > 0.5
- Price and volume moving in harmony upward
- Above-average volume confirms the move
- Indicates strong institutional buying interest
### **🔴 Bearish Confirmation Signal**
**Trigger:** Negative correlation < -0.6 + Volume ratio > 0.5
- Price declining with increasing volume
- Suggests distribution or institutional selling
- High-confidence bearish momentum
---
## **🎯 Trading Applications**
**Breakout Validation:**
Filter false breakouts by requiring volume confirmation before entering positions.
**Trend Continuation:**
Identify when existing trends have strong volume backing for continuation plays.
**Distribution Detection:**
Spot potential tops when price struggles despite high volume (negative correlation).
**Entry Timing:**
Built-in alert system notifies when both conditions align for optimal entry points.
---
## **🔧 Customization Features**
- **Correlation Period:** Adjust sensitivity (2-500 bars)
- **Volume Averaging:** Modify volume comparison timeframe
- **Alert Thresholds:** Fine-tune correlation and volume ratio triggers
- **Visual Options:** Toggle volume histogram display
- **Price Source:** Choose from OHLC or custom sources
---
## **💡 Why VCPM Works**
Traditional momentum indicators often generate false signals during low-volume periods. VCPM solves this by requiring **dual confirmation**: price momentum must be supported by corresponding volume activity. This approach:
- Reduces whipsaws and false breakouts
- Identifies institutional participation
- Provides higher conviction trade setups
- Works across all timeframes and markets
---
## **📈 Best Use Cases**
✅ **Crypto markets** (high volatility, volume-driven)
✅ **Stock breakouts** (earnings, news events)
✅ **Forex majors** (during high-impact news)
✅ **Futures trading** (momentum confirmation)
---
## **⚠️ Important Notes**
- Works best in liquid markets with consistent volume data
- Combine with support/resistance levels for enhanced accuracy
- Consider market context (trending vs. ranging conditions)
- Not recommended for extremely low-volume periods
---
## **🚀 Getting Started**
1. Add VCPM to your chart as a sub-panel indicator
2. Configure correlation threshold (start with 0.6)
3. Set volume ratio threshold (start with 0.5)
4. Enable alerts for automated signal detection
5. Backtest on your preferred timeframe and instrument
---
**Ready to enhance your momentum trading with volume confirmation? Try VCPM and experience the difference institutional-backed signals can make in your trading results.**
*Available in Pine Script v6 - Compatible with all TradingView accounts*

Position Size Calculator with Fees# Position Size Calculator with Portfolio Management - Manual
## Overview
The Position Size Calculator with Portfolio Management is an advanced Pine Script indicator designed to help traders calculate optimal position sizes based on their total portfolio value and risk management strategy. This tool automatically calculates your risk amount based on portfolio allocation percentages and determines the exact position size needed while accounting for trading fees.
## Key Features
- **Portfolio-Based Risk Management**: Calculates risk based on total portfolio value
- **Tiered Risk Allocation**: Separates trading allocation from total portfolio
- **Automatic Trade Direction Detection**: Determines long/short based on entry vs stop loss
- **Fee Integration**: Accounts for trading fees in position size calculations
- **Risk Factor Adjustment**: Allows scaling of position size up or down
- **Visual Display**: Shows all calculations in a clear, color-coded table
- **Automatic Risk Calculation**: No need to manually input risk amount
## Input Parameters
### Total Portfolio ($)
- **Purpose**: The total value of your investment portfolio
- **Default**: 0.0
- **Range**: Any positive value
- **Step**: 0.01
- **Example**: If your total portfolio is worth $100,000, enter 100000
### Trading Portfolio Allocation (%)
- **Purpose**: The percentage of your total portfolio allocated to active trading
- **Default**: 20.0%
- **Range**: 0.0% to 100.0%
- **Step**: 0.01
- **Example**: If you allocate 20% of your portfolio to trading, enter 20
### Risk from Trading (%)
- **Purpose**: The percentage of your trading allocation you're willing to risk per trade
- **Default**: 0.1%
- **Range**: Any positive value
- **Step**: 0.01
- **Example**: If you risk 0.1% of your trading allocation per trade, enter 0.1
### Entry Price ($)
- **Purpose**: The price at which you plan to enter the trade
- **Default**: 0.0
- **Range**: Any positive value
- **Step**: 0.01
### Stop Loss ($)
- **Purpose**: The price at which you will exit if the trade goes against you
- **Default**: 0.0
- **Range**: Any positive value
- **Step**: 0.01
### Risk Factor
- **Purpose**: A multiplier to scale your position size up or down
- **Default**: 1.0 (no scaling)
- **Range**: 0.0 to 10.0
- **Step**: 0.1
- **Examples**:
- 1.0 = Normal position size
- 2.0 = Double the position size
- 0.5 = Half the position size
### Fee (%)
- **Purpose**: The percentage fee charged per transaction
- **Default**: 0.01% (0.01)
- **Range**: 0.0% to 1.0%
- **Step**: 0.001
## How Risk Amount is Calculated
The script automatically calculates your risk amount using this formula:
```
Risk Amount = Total Portfolio × Trading Allocation (%) × Risk % ÷ 10,000
```
### Example Calculation:
- Total Portfolio: $100,000
- Trading Allocation: 20%
- Risk per Trade: 0.1%
**Risk Amount = $100,000 × 20 × 0.1 ÷ 10,000 = $20**
This means you would risk $20 per trade, which is 0.1% of your $20,000 trading allocation.
## Portfolio Structure Example
Let's say you have a $100,000 portfolio:
### Allocation Structure:
- **Total Portfolio**: $100,000
- **Trading Allocation (20%)**: $20,000
- **Long-term Investments (80%)**: $80,000
### Risk Management:
- **Risk per Trade (0.1% of trading)**: $20
- **Maximum trades at risk**: Could theoretically have 1,000 trades before risking entire trading allocation
## How Position Size is Calculated
### Trade Direction Detection
- **Long Trade**: Entry price > Stop loss price
- **Short Trade**: Entry price < Stop loss price
### Position Size Formulas
#### For Long Trades:
```
Position Size = -Risk Factor × Risk Amount / (Stop Loss × (1 - Fee) - Entry Price × (1 + Fee))
```
#### For Short Trades:
```
Position Size = -Risk Factor × Risk Amount / (Entry Price × (1 - Fee) - Stop Loss × (1 + Fee))
```
## Output Display
The indicator displays a comprehensive table with color-coded sections:
### Portfolio Information (Light Blue Background)
- **Portfolio (USD)**: Your total portfolio value
- **Trading Portfolio Allocation (%)**: Percentage allocated to trading
- **Risk as % of Trading**: Risk percentage per trade
### Trade Setup (Gray Background)
- **Entry Price**: Your specified entry price
- **Stop Loss**: Your specified stop loss price
- **Fee (%)**: Trading fee percentage
- **Risk Factor**: Position size multiplier
### Risk Analysis (Red Background)
- **Risk Amount**: Automatically calculated dollar risk
- **Effective Entry**: Actual entry cost including fees
- **Effective Exit**: Actual exit value including fees
- **Expected Loss**: Calculated loss if stop loss is hit
- **Deviation from Risk %**: Accuracy of risk calculation
### Final Result (Blue Background)
- **Position Size**: Number of shares/units to trade
## Usage Examples
### Example 1: Conservative Long Trade
- **Total Portfolio**: $50,000
- **Trading Allocation**: 15%
- **Risk per Trade**: 0.05%
- **Entry Price**: $25.00
- **Stop Loss**: $24.00
- **Risk Factor**: 1.0
- **Fee**: 0.01%
**Calculated Risk Amount**: $50,000 × 15% × 0.05% ÷ 100 = $3.75
### Example 2: Aggressive Short Trade
- **Total Portfolio**: $200,000
- **Trading Allocation**: 30%
- **Risk per Trade**: 0.2%
- **Entry Price**: $150.00
- **Stop Loss**: $155.00
- **Risk Factor**: 2.0
- **Fee**: 0.01%
**Calculated Risk Amount**: $200,000 × 30% × 0.2% ÷ 100 = $120
**Actual Risk**: $120 × 2.0 = $240 (due to risk factor)
## Color Coding System
- **Green/Red Header**: Trade direction (Long/Short)
- **Light Blue**: Portfolio management parameters
- **Gray**: Trade setup parameters
- **Red**: Risk-related calculations and results
- **Blue**: Final position size result
## Best Practices
### Portfolio Management
1. **Keep trading allocation reasonable** (typically 10-30% of total portfolio)
2. **Use conservative risk percentages** (0.05-0.2% per trade)
3. **Don't risk more than you can afford to lose**
### Risk Management
1. **Start with small risk factors** (1.0 or less) until comfortable
2. **Monitor your total exposure** across all open positions
3. **Adjust risk based on market conditions**
### Trade Execution
1. **Always validate calculations** before placing trades
2. **Account for slippage** in volatile markets
3. **Consider position size relative to liquidity**
## Risk Management Guidelines
### Conservative Approach
- Trading Allocation: 10-20%
- Risk per Trade: 0.05-0.1%
- Risk Factor: 0.5-1.0
### Moderate Approach
- Trading Allocation: 20-30%
- Risk per Trade: 0.1-0.15%
- Risk Factor: 1.0-1.5
### Aggressive Approach
- Trading Allocation: 30-40%
- Risk per Trade: 0.15-0.25%
- Risk Factor: 1.5-2.0
## Troubleshooting
### Common Issues
1. **Position Size shows 0**
- Verify all portfolio inputs are greater than 0
- Check that entry price differs from stop loss
- Ensure calculated risk amount is positive
2. **Very small position sizes**
- Increase risk percentage or risk factor
- Check if your risk amount is too small for the price difference
3. **Large risk deviation**
- Normal for very small positions
- Consider adjusting entry/stop loss levels
### Validation Checklist
- Total portfolio value is realistic
- Trading allocation percentage makes sense
- Risk percentage is conservative
- Entry and stop loss prices are valid
- Trade direction matches your intention
## Advanced Features
### Risk Factor Usage
- **Scaling up**: Use risk factors > 1.0 for high-confidence trades
- **Scaling down**: Use risk factors < 1.0 for uncertain trades
- **Never exceed**: Risk factors that would risk more than your comfort level
### Multiple Timeframe Analysis
- Use different risk factors for different timeframes
- Consider correlation between positions
- Adjust trading allocation based on market conditions
## Disclaimer
This tool is for educational and planning purposes only. Always verify calculations manually and consider market conditions, liquidity, and correlation between positions. The automated risk calculation assumes you're comfortable with the mathematical relationship between portfolio allocation and individual trade risk. Past performance doesn't guarantee future results, and all trading involves risk of loss.

Fair Value Gap [Custom]📌 FVG Indicator – Smart Money Concepts Tool
This script is based on Smart Money Concepts (SMC) and automatically detects and marks Fair Value Gaps (FVG) on the chart, helping traders identify unbalanced price areas left behind by institutional moves.
🧠 What is an FVG?
An FVG (Fair Value Gap) is the price gap formed when the market moves rapidly, leaving behind a candle range where no trading occurred — typically between Candle 1’s high and Candle 3’s low (in a three-candle pattern). These gaps often signal imbalance, created during structural breaks or liquidity grabs, and may act as retrace zones or entry points.
🛠 Features:
✅ Automatically detects and highlights FVG zones (high-low range)
✅ Differentiates between open (unfilled) and closed (filled) FVGs
✅ Adjustable timeframe settings (works best on 1H–4H charts)
✅ Option to toggle display of filled FVGs
✅ Great for identifying pullback entries, continuation zones, or reversal setups
💡 Recommended Use:
After BOS/CHoCH, watch for price to return to the FVG for entry
Combine with Order Blocks and liquidity zones for higher accuracy
Best used as part of an ICT or SMC-based trading system

Warrior Trading Momentum Strategy
# 🚀 Warrior Trading Momentum Strategy - Day Trading Excellence
## Strategy Overview
This comprehensive Pine Script strategy replicates the proven methodologies taught by Ross Cameron and the Warrior Trading community. Designed for active day traders, it identifies high-probability momentum setups with strict risk management protocols.
## 📈 Core Trading Setups
### 1. Gap and Go Trading
- **Primary Focus**: Stocks gapping up 2%+ with volume confirmation
- **Entry Logic**: Breakout above gap open with momentum validation
- **Volume Filter**: 2x average volume requirement for quality setups
### 2. ABCD Pattern Recognition
- **Pattern Detection**: Automated identification of classic ABCD reversal patterns
- **Validation**: A-B and C-D move relationship analysis
- **Entry Trigger**: D-point breakout with volume confirmation
### 3. VWAP Momentum Plays
- **Strategy**: Entries near VWAP with bounce confirmation
- **Distance Filter**: Configurable percentage distance for optimal entries
- **Direction Bias**: Above VWAP bullish momentum validation
### 4. Red to Green Reversals
- **Setup**: Reversal patterns after consecutive red candles
- **Confirmation**: Volume spike with bullish close required
- **Momentum**: Trend change validation with RSI support
### 5. Breakout Momentum
- **Logic**: Breakouts above recent highs with volume
- **Filters**: EMA20 and RSI confirmation for quality
- **Trend**: Established momentum direction validation
## ⚡ Key Features
### Smart Risk Management
- **Position Sizing**: Automatic calculation based on account risk percentage
- **Stop Loss**: 2 ATR-based stops for volatility adjustment
- **Take Profit**: Configurable risk-reward ratios (default 1:2)
- **Trailing Stops**: Profit protection with adjustable triggers
### Advanced Filtering System
- **Time Filters**: Market hours trading with lunch hour avoidance
- **Volume Confirmation**: Multi-timeframe volume analysis
- **Momentum Indicators**: RSI and moving average trend validation
- **Quality Control**: Multiple confirmation layers for signal accuracy
### PDT-Friendly Design
- **Trade Limiting**: Built-in daily trade counter for accounts under $25K
- **Selective Trading**: Priority scoring system for A+ setups only
- **Quality over Quantity**: Maximum 2-3 high-probability trades per day
## 🎯 Optimal Usage
### Best Timeframes
- **Primary**: 5-minute charts for entry timing
- **Secondary**: 1-minute for precise execution
- **Context**: Daily charts for gap analysis
### Ideal Market Conditions
- **Volatility**: High-volume, momentum-driven markets
- **Stocks**: Market cap $100M+, average volume 1M+ shares
- **Sectors**: Technology, biotech, growth stocks with news catalysts
### Account Requirements
- **Minimum**: $500+ for proper position sizing
- **Recommended**: $25K+ for unlimited day trading
- **Risk Tolerance**: Active day trading experience preferred
## 📊 Performance Optimization
### Entry Criteria (All Must Align)
1. ✅ Time filter (market hours, avoid lunch)
2. ✅ Volume spike (2x+ average volume)
3. ✅ Momentum confirmation (RSI 50-80)
4. ✅ Trend alignment (above EMA20)
5. ✅ Pattern completion (setup-specific)
### Risk Parameters
- **Maximum Risk**: 1-2% per trade
- **Position Size**: 25% of account maximum
- **Stop Loss**: 2 ATR below entry
- **Take Profit**: 2:1 risk-reward minimum
## 🔧 Customization Options
### Gap Trading Settings
- Minimum gap percentage threshold
- Volume multiplier requirements
- Gap validation criteria
### Pattern Recognition
- ABCD ratio parameters
- Swing point sensitivity
- Pattern completion filters
### Risk Management
- Risk-reward ratio adjustment
- Maximum daily trade limits
- Trailing stop trigger levels
### Time and Session Filters
- Trading session customization
- Lunch hour avoidance toggle
- Market condition filters
## ⚠️ Important Disclaimers
### Risk Warning
- **High Risk**: Day trading involves substantial risk of loss
- **Capital Requirements**: Only trade with risk capital
- **Experience**: Strategy requires active monitoring and experience
- **Market Conditions**: Performance varies with market volatility
### PDT Considerations
- **Day Trading Rules**: Accounts under $25K limited to 3 day trades per 5 days
- **Compliance**: Strategy includes trade counting for PDT compliance
- **Alternative**: Consider swing trading modifications for smaller accounts
### Backtesting vs Live Trading
- **Slippage**: Real trading involves execution delays and slippage
- **Commissions**: Factor in broker fees for accurate performance
- **Market Impact**: Large positions may affect fill prices
- **Psychological Factors**: Live trading involves emotional challenges
## 📚 Educational Value
This strategy serves as an excellent learning tool for understanding:
- Professional day trading methodologies
- Risk management principles
- Pattern recognition techniques
- Volume and momentum analysis
- Multi-timeframe analysis
## 🤝 Community and Support
Based on proven Warrior Trading methodologies with active community support. Strategy includes comprehensive plotting and information tables for educational purposes and trade analysis.
---
**Disclaimer**: This strategy is for educational purposes. Past performance does not guarantee future results. Always practice proper risk management and never risk more than you can afford to lose.
**Tags**: #DayTrading #Momentum #WarriorTrading #GapAndGo #ABCD #VWAP #PatternTrading #RiskManagement

Fisher Transform Background StripesThe "Fisher Transform Background Stripes" indicator is an easy-to-use tool that helps traders identify extreme market conditions using the Fisher Transform, a technical indicator that normalizes price data to highlight potential reversals. It displays colored background stripes on your chart to show when the market is oversold or undersold, making it simple to spot trading opportunities.
How It Works:Fisher Transform Calculation: The indicator calculates the Fisher Transform based on a user-defined period (default: 9), using the average of high and low prices to measure market momentum and identify extreme price movements.
Oversold/Undersold Levels: It highlights when the Fisher Transform is above a user-set oversold level (default: 3.0) with red background stripes, or below an undersold level (default: -2.0) with green background stripes.
Visual Feedback: Red and green stripes appear on the chart to mark oversold or undersold conditions, helping you quickly understand market extremes.
Customization: You can adjust the Fisher Transform period, oversold/undersold levels, background colors, and transparency. You can also enable an optional Fisher Transform plot or display values on the chart for debugging.
Wait for Close Option: You can choose whether the indicator waits for the timeframe’s candle to close before showing stripes, ensuring more reliable signals.
Alerts: Optional alerts notify you when the Fisher Transform crosses into oversold or undersold zones (always using confirmed values for accuracy).
Who It’s For: This indicator is ideal for beginner and intermediate traders looking for a clear, visual way to track extreme market conditions and potential reversals using the Fisher Transform.
Key Features:Colored background stripes for oversold (red) and undersold (green) conditions.
Customizable settings for period, levels, colors, and transparency.
Option to wait for candle close for more accurate signals.
Optional Fisher Transform plot and value display for analysis.
Alerts to notify you of key Fisher Transform level crossings.
This indicator provides a straightforward way to monitor market extremes and make informed trading decisions.
