Volume Based Price Prediction [EdgeTerminal]This indicator combines price action, volume analysis, and trend prediction to forecast potential future price movements. The indicator creates a dynamic prediction zone with confidence bands, helping you visualize possible price trajectories based on current market conditions.
Key Features
Dynamic price prediction based on volume-weighted trend analysis
Confidence bands showing potential price ranges
Volume-based candle coloring for enhanced market insight
VWAP and Moving Average overlay
Customizable prediction parameters
Real-time updates with each new bar
Technical Components:
Volume-Price Correlation: The indicator analyzes the relationship between price movements and volume, Identifies stronger trends through volume confirmation and uses Volume-Weighted Average Price (VWAP) for price equilibrium
Trend Strength Analysis: Calculates trend direction using exponential moving averages, weights trend strength by relative volume and incorporates momentum for improved accuracy
Prediction Algorithm: combines current price, trend, and volume metrics, projects future price levels using weighted factors and generates confidence bands based on price volatility
Customizable Parameters:
Moving Average Length: Controls the smoothing period for calculations
Volume Weight Factor: Adjusts how much volume influences predictions
Prediction Periods: Number of bars to project into the future
Confidence Band Width: Controls the width of prediction bands
How to use it:
Look for strong volume confirmation with green candles, watch for prediction line slope changes, use confidence bands to gauge potential volatility and compare predictions with key support/resistance levels
Some useful tips:
Start with default settings and adjust gradually
Use wider confidence bands in volatile markets
Consider prediction lines as zones rather than exact levels
Best applications of this indicator:
Trend continuation probability assessment
Potential reversal point identification
Risk management through confidence bands
Volume-based trend confirmation
Cari dalam skrip untuk "accuracy"

Price Movement Predictor (PMP)The Price Movement Predictor (PMP) is a versatile trading indicator designed to assist traders in identifying potential buy and sell opportunities in the market. This indicator utilizes a combination of technical analysis tools to generate signals based on the relative strength index (RSI) and moving averages, ensuring a robust and strategic approach to trading.
Key Features:
RSI-Based Signal Generation:
The indicator monitors the RSI to identify overbought and oversold conditions in the market.
A buy signal is generated when the RSI drops below a predefined oversold threshold, indicating potential upward price movement.
Conversely, a sell signal is triggered when the RSI exceeds a specified overbought level, suggesting a possible price decline.
Moving Average Confirmation:
The indicator employs two moving averages: a short-term and a long-term moving average.
Buy and sell signals are confirmed only after a crossover event occurs, ensuring that trades are entered in alignment with market trends.
The short moving average crossing above the long moving average confirms a buy signal, while a crossover below confirms a sell signal.
Take Profit and Stop Loss Management:
The PMP includes adjustable take profit and stop loss levels, which are automatically calculated based on user-defined percentages.
Labels indicating the take profit (TP) and stop loss (SL) levels are plotted on the chart, helping traders manage their risk effectively.
Alerts are available for both TP and SL conditions, allowing traders to stay informed about their trade outcomes.
User-Friendly Interface:
The indicator provides an intuitive setup with adjustable parameters for moving average lengths, RSI levels, and TP/SL ratios.
Clear buy and sell signals are displayed directly on the chart, making it easy for traders to act on potential opportunities.
Usage:
The Price Movement Predictor is ideal for traders who seek a systematic approach to identify trading opportunities and manage risk. By combining RSI signals with moving average crossovers, the indicator helps filter out false signals and enhances the accuracy of trade entries. It is suitable for various trading styles, including day trading, swing trading, and long-term investing.

Engulfing Pattern & Impulse [UAlgo]The Engulfing Pattern & Impulse is a tool designed for technical traders who utilize price action and volume analysis to assess market trends and potential reversals. This indicator identifies two powerful trading signals: Engulfing Patterns and Volume Impulses, which are essential components for evaluating potential bullish or bearish market momentum.
Engulfing Patterns are classic candlestick formations often associated with reversals or trend continuations, depending on the overall trend context. This indicator highlights both bullish and bearish engulfing patterns based on configurable criteria such as trend detection settings, comparison with average body size, and a customizable body multiplier for validation. The Volume Impulse feature signals moments of significant volume compared to historical levels, which often precede substantial price movements. Together, these features provide traders with a versatile tool for better timing entry and exit points.
The indicator also offers an adaptive trend detection system, allowing traders to choose from multiple methods (e.g., SMA50 or SMA50/SMA200 combinations) to assess the trend context, making it ideal for various market conditions.
🔶Key Features
Engulfing Pattern Detection: Identifies bullish and bearish engulfing patterns with customizable parameters, including body length and average size comparison.
Configurable trend basis: Choose between SMA50 or SMA50 with SMA200 to define trend direction.
Body size multiplier: Adjust the size threshold for valid engulfing patterns, providing flexibility based on market conditions.
Volume Impulse Signal: Highlights volume spikes that meet or exceed a specified multiplier, which can indicate increased buying or selling interest.
Customizable volume period and multiplier: Allows you to tailor the volume impulse detection based on the instrument’s average volume behavior.
Trend Detection Options: Select different trend detection methods to suit various trading styles and instruments.
SMA50-based detection: Classifies the trend based on the position of price relative to the 50-period SMA.
SMA50 and SMA200 combination: Incorporates a dual-moving average approach, classifying trends based on the relationship between price, SMA50, and SMA200.
Enhanced Visualization: Distinguishes bullish and bearish signals with customizable colors, providing clear and immediate visual cues for easy interpretation.
Custom label colors: Allows you to set distinct colors for bullish, bearish, and neutral signals for quick identification.
Pattern filtering: Enable or disable specific patterns (Bullish, Bearish, or Both) based on your trading preferences.
🔶 Interpreting Indicator
Bullish Engulfing Pattern: Indicates a potential bullish reversal in a downtrend. This signal occurs when a white candlestick with a body size exceeding a specified multiplier completely engulfs the previous black candlestick. The pattern will display a “BE” label below the candle if it meets the criteria, signaling potential upward momentum.
Bearish Engulfing Pattern: Indicates a potential bearish reversal in an uptrend. A black candlestick with a body size exceeding the specified multiplier fully engulfs the previous white candlestick, signaling possible downward movement. The “BE” label appears above the candle to denote this pattern.
Volume Impulse Up: Displays a “VI” label below the candle when the volume surpasses the defined multiplier, and the price closes higher than it opened, indicating strong upward buying interest.
Volume Impulse Down: Displays a “VI” label above the candle when the volume meets or exceeds the specified threshold, and the price closes lower than it opened, signaling strong selling pressure.
Indicator uses the SMA50 and SMA200 to determine trend direction due to their popularity in technical analysis as indicators of medium- and long-term trends. The SMA50 reflects the average price over the past 50 periods, providing insight into intermediate trends, while the SMA200 is often used to identify the broader trend direction. These SMAs help traders quickly assess whether the market is in an uptrend, downtrend, or consolidation phase, enhancing decision-making for both short-term and long-term strategies.
🔶 Disclaimer
Use with Caution: This indicator is provided for educational and informational purposes only and should not be considered as financial advice. Users should exercise caution and perform their own analysis before making trading decisions based on the indicator's signals.
Not Financial Advice: The information provided by this indicator does not constitute financial advice, and the creator (UAlgo) shall not be held responsible for any trading losses incurred as a result of using this indicator.
Backtesting Recommended: Traders are encouraged to backtest the indicator thoroughly on historical data before using it in live trading to assess its performance and suitability for their trading strategies.
Risk Management: Trading involves inherent risks, and users should implement proper risk management strategies, including but not limited to stop-loss orders and position sizing, to mitigate potential losses.
No Guarantees: The accuracy and reliability of the indicator's signals cannot be guaranteed, as they are based on historical price data and past performance may not be indicative of future results.

Power Root SuperTrend [AlgoAlpha]📈🚀 Power Root SuperTrend by AlgoAlpha - Elevate Your Trading Strategy! 🌟
Introducing the Power Root SuperTrend by AlgoAlpha, an advanced trading indicator that enhances the traditional SuperTrend by incorporating Root-Mean-Square (RMS) calculations for a more responsive and adaptive trend detection. This innovative tool is designed to help traders identify trend directions, potential take-profit levels, and optimize entry and exit points with greater accuracy, making it an excellent addition to your trading arsenal.
Key Features:
🔹 Root-Mean-Square SuperTrend Calculation : Utilizes the RMS of closing prices to create a smoother and more sensitive SuperTrend line that adapts quickly to market changes.
🔸 Multiple Take-Profit Levels : Automatically calculates and plots up to seven take-profit levels (TP1 to TP7) based on market volatility and the change in SuperTrend values.
🟢 Dynamic Trend Coloring : Visually distinguish between bullish and bearish trends with customizable colors for clearer market visualization.
📊 RSI-Based Take-Profit Signals : Incorporates the Relative Strength Index (RSI) of the distance between the price and the SuperTrend line to generate additional take-profit signals.
🔔 Customizable Alerts : Set alerts for trend direction changes, achievement of take-profit levels, and RSI-based take-profit conditions to stay informed without constant chart monitoring.
How to Use:
Add the Indicator : Add the indicator to favorites by pressing the ⭐ icon or search for "Power Root SuperTrend " in the TradingView indicators library and add it to your chart. Adjust parameters such as the ATR multiplier, ATR length, RMS length, and RSI take-profit length to suit your trading style and the specific asset you are analyzing.
Analyze the Chart : Observe the SuperTrend line and the plotted take-profit levels. The color changes indicate trend directions—green for bullish and red for bearish trends.
Set Alerts : Utilize the built-in alert conditions to receive notifications when the trend direction changes, when each TP level is drawn, or when RSI-based take-profit conditions are met.
How It Works:
The Power Root SuperTrend indicator enhances traditional SuperTrend calculations by applying a Root-Mean-Square (RMS) function to the closing prices, resulting in a more responsive trend line that better reflects recent price movements. It calculates the Average True Range (ATR) to determine the volatility and sets the upper and lower SuperTrend bands accordingly. When a trend direction change is detected—signified by the SuperTrend line switching from above to below the price or vice versa—the indicator calculates the change in the SuperTrend value. This change is then used to establish multiple take-profit levels (TP1 to TP7), each representing incremental targets based on market volatility. Additionally, the indicator computes the RSI of the distance between the current price and the SuperTrend line to generate extra take-profit signals when the RSI crosses under a specific threshold. The combination of RMS calculations, multiple TP levels, dynamic coloring, and RSI signals provides traders with a comprehensive tool for identifying trends and optimizing trade exits. Customizable alerts ensure that traders can stay updated on important market developments without needing to constantly watch the charts.
Elevate your trading strategy with the Power Root SuperTrend indicator and gain a smarter edge in the markets! 🚀✨

SMA- Ashish SinghSMA
This script implements a Simple Moving Average (SMA) crossover strategy using three SMAs: 200-day, 50-day, and 20-day, with buy and sell signals triggered based on specific conditions involving these moving averages. The indicator is overlaid on the price chart, providing visual cues for potential buy and sell opportunities based on moving average crossovers.
Key Features:
Moving Averages:
The 200-day, 50-day, and 20-day SMAs are calculated and plotted on the price chart. These are key levels that traders use to assess trends.
The 200-day SMA represents the long-term trend, the 50-day SMA is used for medium-term trends, and the 20-day SMA is for short-term analysis.
Buy Signal:
A buy signal is triggered when the price is below all three moving averages (200 SMA, 50 SMA, 20 SMA) and the SMAs are in a specific downward trend (200 SMA > 50 SMA > 20 SMA). This is an indication of a potential upward reversal.
The buy signal is marked with a green triangle below the price bar.
Sell Signal:
A sell signal is triggered when the price is above all three moving averages and the SMAs are in a specific upward trend (200 SMA < 50 SMA < 20 SMA). This signals a potential downward reversal.
The sell signal is marked with a red triangle above the price bar.
Trade Information:
After a buy signal, the buy price, bar index, and timestamp are recorded. When a sell signal occurs, the percentage gain or loss is calculated along with the number of days between the buy and sell signals.
The script automatically displays a label on the chart showing the gain or loss percentage along with the number of days the trade lasted. Green labels represent gains, and red labels represent losses.
User-friendly Visuals:
The buy and sell signals are plotted as small triangles directly on the chart for easy identification.
Detailed trade information is provided with well-formatted labels to highlight the profit or loss after each trade.
How It Works:
This strategy helps traders to identify trend reversals by leveraging long-term and short-term moving averages.
A single buy or sell signal is triggered based on price movement relative to the SMAs and their order.
The tool is designed to help traders quickly spot buying and selling opportunities with clear visual indicators and gain/loss metrics.
This indicator is ideal for traders looking to implement a systematic SMA-based strategy with well-defined buy/sell points and automatic performance tracking for each trade.
Disclaimer: The information provided here is for educational and informational purposes only. It is not intended as financial advice or as a recommendation to buy or sell any stocks. Please conduct your own research or consult a financial advisor before making any investment decisions. ProfitLens does not guarantee the accuracy, completeness, or reliability of any information presented.

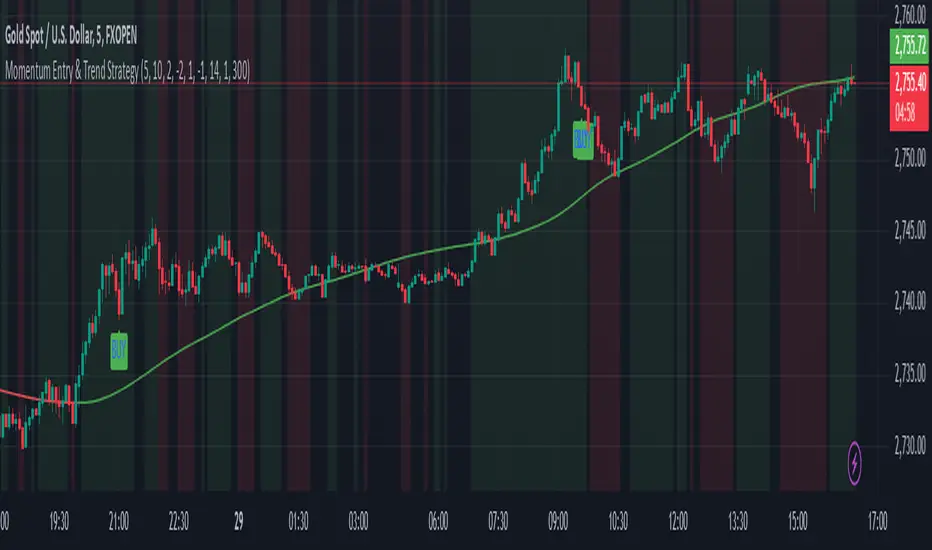
Momentum Entry & Trend Strategy M5Momentum Entry & Trend Strategy M5
Description:
The Momentum Entry & Trend Strategy M5 is an indicator script designed to assist traders in determining optimal buy and sell moments based on momentum and trend analysis. This script operates using two different momentum levels—Momentum Length for Entry (5) and Momentum Length for Trend (10)—along with the HMA (Hull Moving Average) indicator for trend confirmation.
Key Features:
Momentum Entry: Calculates momentum using the difference between the current price and the price from previous periods to determine the strength and direction of price movements.
Trend Identification: Utilizes two momentum levels (5 and 10) to identify bullish and bearish trend conditions.
HMA for Trend Confirmation: The HMA indicator is used to provide trend confirmation signals. When HMA indicates bullish, a buy signal is displayed; conversely, a bearish HMA results in a sell signal.
Signal Display: Displays buy (BUY) and sell (SELL) signals on the chart when the conditions for market entry are met, providing clear visualization for traders.
Background Color: Offers a green background for uptrends and a red background for downtrends, allowing traders to easily identify the overall market condition.
ATR (Average True Range): Calculates and plots a smoothed ATR to help traders measure market volatility.
Settings:
Momentum Length for Entry: 5 (to determine entry signals)
Momentum Length for Trend: 10 (to determine trend conditions)
HMA Length: 300 (period length for HMA to confirm trends)
ATR Length: 14 (period length for ATR to measure volatility)
Benefits:
This script is designed to provide visual and data-driven guidance for better trading decision-making. By combining momentum and trend analysis, traders can enhance the accuracy of their signals and reduce the risk of errors when identifying entry and exit points in the market.
Note:
This script is intended for use on the M5 time frame but can be adjusted for other time frames as needed. It is always recommended to conduct thorough testing before applying trading strategies on a live account.
5-0 Harmonic Pattern [TradingFinder] 0XABCD 50 Harmonic Detector🔵 Introduction
Harmonic patterns are a powerful tool in technical analysis, widely used to detect reversal points and trend changes. Among these, the 5-0 Harmonic Pattern stands out due to its reliance on specific Fibonacci ratios—1.13, 1.618, 2.24, and 0.45 to 0.55—anchored at points 0, X, A, B, C, and D. This pattern provides a structured approach for identifying critical buy and sell points, helping traders achieve optimal entry and exit levels in volatile markets.
This 5-0 Harmonic Pattern indicator automatically detects and marks bullish and bearish formations on the chart, offering precise trading signals based on established harmonic ratios. With its dynamic signals, the 5-0 pattern enables traders to anticipate market movements and capitalize on favorable price trends.
Especially in fast-moving markets, harmonic patterns, particularly the 5-0 Harmonic Pattern, equip traders with an essential framework for identifying reversal opportunities and refining their trading strategies.
Bullish 5-0 Pattern :
Bearish 5-0 Pattern :
🔵 How to Use
The 5-0 Harmonic Pattern indicator is designed to automatically mark the key levels of the harmonic structure: 0, X, A, B, C, and D. By doing so, it detects both bullish and bearish patterns and helps traders recognize optimal entry and exit points.
Formed through specific Fibonacci levels, this pattern signals potential shifts in trend direction, giving traders critical insights for managing entries and exits effectively. The tool proves valuable in high-volatility settings, enabling traders to leverage these signals for refined decision-making.
🟣 Bullish 5-0 Pattern
A bullish 5-0 pattern materializes when Fibonacci levels indicate a potential price reversal to the upside. With points 0, X, A, B, C, and D in alignment, the indicator highlights this upward momentum by displaying a green arrow as a buy signal on the chart. This marking provides a clear entry point, indicating that prices are likely to rise, making it a prime moment for traders to enter long positions.
Additionally, the bullish 5-0 pattern is equipped with tools for traders to set stop-loss and take-profit points based on harmonic lines within the pattern, which represent support and resistance levels. Using these dynamic points, traders can create a more effective risk-reward setup while following the bullish signals in a standalone harmonic strategy.
🟣 Bearish 5-0 Pattern
The bearish 5-0 pattern functions similarly but signals a likely downturn. This pattern emerges when Fibonacci ratios align at points 0, X, A, B, C, and D, predicting a reversal downward. The indicator generates a sell signal, marked by a red arrow, prompting traders to exit long positions or initiate short trades to capitalize on falling prices.
Traders can utilize this bearish pattern for defining exit strategies and setting key levels for stop-loss and take-profit orders. The bearish 5-0 pattern enhances traders’ abilities to gauge critical price levels and manage trade risk effectively, especially in volatile markets. For traders focused on profiting from downward trends, this indicator serves as a powerful tool for timely entries and exits.
🔵 Setting
🟣 Logical Setting
ZigZag Pivot Period : You can adjust the period so that the harmonic patterns are adjusted according to the pivot period you want. This factor is the most important parameter in pattern recognition.
Show Valid Forma t: If this parameter is on "On" mode, only patterns will be displayed that they have exact format and no noise can be seen in them. If "Off" is, the patterns displayed that maybe are noisy and do not exactly correspond to the original pattern.
Show Formation Last Pivot Confirm : if Turned on, you can see this ability of patterns when their last pivot is formed. If this feature is off, it will see the patterns as soon as they are formed. The advantage of this option being clear is less formation of fielded patterns, and it is accompanied by the latest pattern seeing and a sharp reduction in reward to risk.
Period of Formation Last Pivot : Using this parameter you can determine that the last pivot is based on Pivot period.
🟣 Genaral Setting
Show : Enter "On" to display the template and "Off" to not display the template.
Color : Enter the desired color to draw the pattern in this parameter.
LineWidth : You can enter the number 1 or numbers higher than one to adjust the thickness of the drawing lines. This number must be an integer and increases with increasing thickness.
LabelSize : You can adjust the size of the labels by using the "size.auto", "size.tiny", "size.smal", "size.normal", "size.large" or "size.huge" entries.
🟣 Alert Setting
Alert : On / Off
Message Frequency : This string parameter defines the announcement frequency. Choices include: "All" (activates the alert every time the function is called), "Once Per Bar" (activates the alert only on the first call within the bar), and "Once Per Bar Close" (the alert is activated only by a call at the last script execution of the real-time bar upon closing). The default setting is "Once per Bar".
Show Alert Time by Time Zone : The date, hour, and minute you receive in alert messages can be based on any time zone you choose. For example, if you want New York time, you should enter "UTC-4". This input is set to the time zone "UTC" by default.
Conclusion
The 5-0 Harmonic Pattern indicator serves as a robust solution for technical analysts and traders looking to pinpoint market reversal points. By automatically recognizing 5-0 patterns and generating buy and sell signals based on Fibonacci ratios, this tool supports precise trend analysis and entry/exit timing. The indicator’s adjustable alerts, color themes, and pattern toggles allow for comprehensive customization, ensuring alignment with individual trading strategies.
Harmonic patterns, especially the 5-0 Harmonic Pattern, guide traders in identifying high-accuracy entry and exit points, thus aiding in more informed trading decisions. By combining Fibonacci ratio analysis with real-time signal updates, this indicator provides a well-rounded approach for risk management and capitalizing on trading opportunities. Professional traders can harness this tool to enhance technical analysis precision and capitalize on price trends effectively, maximizing profitability in both bullish and bearish markets.

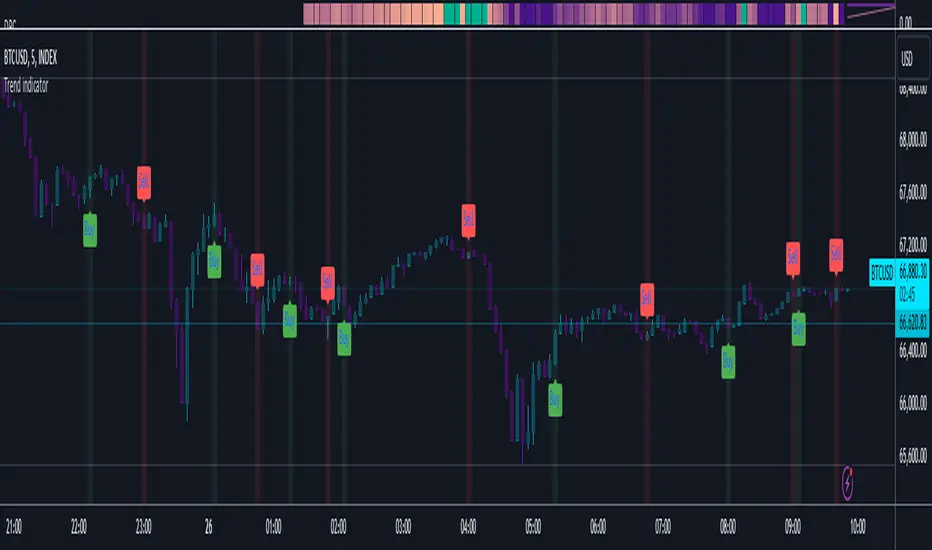
Trend indicatorThe Trend Indicator script is a custom oscillator-based tool designed for identifying potential entry and exit points in the market. Using a combination of Exponential Moving Average (EMA) and Relative Moving Average (RMA) calculations, it captures the trend direction and signals market momentum shifts. The indicator visually presents buy and sell signals and color-codes background conditions based on potential trend reversals, offering a clear and structured approach for trend-based trading strategies.
Key Components
1. User Inputs
Smoothing Length (smoothLength): The script allows the trader to input a smoothing length for adjusting the EMA and RMA calculations. This parameter fine-tunes the indicator's sensitivity to price movements, where lower values result in a more responsive oscillator, while higher values make it smoother and less reactive to minor fluctuations.
Source (source): This is the price data input for the script, defaulting to the close price but customizable to other price points (e.g., open, high, or low) based on user preference.
2. Smoothed Price Calculation
Using an Exponential Moving Average (EMA), the script smooths the selected source price to reduce noise and make trends clearer. The EMA’s calculation length is determined by the smoothLength input, and this moving average forms the baseline from which other components derive.
3. Oscillator Calculation
The oscillator value represents the relative strength or weakness of price momentum. Here, the oscillator is computed using Relative Moving Average (RMA), applied to the difference between the smoothed price and the SMA of the source price. The RMA further filters short-term fluctuations to identify the core trend direction.
This oscillator measures the divergence between the smoothed price and the SMA, providing insight into whether the market is experiencing bullish or bearish pressure.
4. Signal Line
The Signal Line is a Simple Moving Average (SMA) of the oscillator, using the same smoothLength parameter. The SMA smooths the oscillator’s values, offering a secondary reference that traders can use to identify changes in momentum when it crosses the oscillator line.
5. Buy and Sell Signals
Buy Signal (bullSignal): The script triggers a buy signal when the oscillator crosses above zero. This indicates that momentum may be shifting in favor of buyers, potentially signaling an uptrend.
Sell Signal (bearSignal): The script triggers a sell signal when the oscillator crosses below zero, suggesting a shift in momentum to the downside, potentially initiating a downtrend.
Visualization
1. Plotting the Oscillator and Signal Line
The oscillator line is plotted in blue, representing the current momentum of the price. The signal line, plotted in red, serves as a smoother baseline.
When the oscillator crosses the signal line, it hints at a potential trend shift, which can be a signal for cautious traders to pay attention to trend reversals.
2. Buy/Sell Signal Markers
Buy Signal Marker: A green label appears below the bar whenever the oscillator crosses above zero, indicating a potential buying opportunity.
Sell Signal Marker: A red label appears above the bar whenever the oscillator crosses below zero, marking a potential selling opportunity.
These visual cues make it easy for traders to spot signals directly on the chart without needing to watch the oscillator values closely.
3. Background Coloring for Trend Direction
To further aid in trend identification, the background color changes to green when a bullish signal is active and red during bearish signals. This coloring helps visually reinforce the current trend direction, allowing traders to spot prolonged uptrends or downtrends easily.
Trading Strategy Suggestions
This indicator can be adapted to various trading strategies. Here are a few practical suggestions:
Trend-Following Strategy:
When the oscillator crosses above zero (green background), it could indicate the start of a potential uptrend. Consider entering a long position on this signal and holding it until the oscillator crosses back below zero.
Conversely, a cross below zero (red background) may signal a downtrend, making it suitable for short positions or exiting long trades.
Cross-Confirmation with Signal Line:
Use the crossover of the oscillator and signal line to confirm trends. For example, when the oscillator is above zero and crosses above the signal line, it could reinforce a strong buy signal. Similarly, a cross below the signal line when the oscillator is below zero could strengthen a sell signal.
Combining with Other Indicators:
For added accuracy, combine this indicator with other trend-confirming tools like Moving Averages or Bollinger Bands to confirm the validity of buy/sell signals.
Risk Management:
Always set stop-losses below recent lows in uptrends or above recent highs in downtrends. This indicator is useful for entry and exit points but should always be paired with solid risk management practices.
The Trend Indicator is a comprehensive tool for identifying market momentum and potential reversal points. By smoothing out price data and using an oscillator to track momentum shifts, it offers traders a structured approach to trading trends. Its built-in buy/sell markers and background coloring make it visually accessible and easy to interpret at a glance. However, as with any indicator, it's most effective when combined with other strategies and a disciplined approach to risk management.
Enhanced CCI with Trend FiltersThis indicator combines the power of the Commodity Channel Index (CCI) with adaptive trend filters and divergence detection to identify high-probability trading opportunities. It's designed to reduce false signals by incorporating trend direction and divergence confirmation.
🔍 How It Works:
1. Trend Detection:
- Uses an adaptive Simple Moving Average (SMA) that automatically adjusts between daily and weekly timeframes
- Daily mode: Default 200 SMA for longer-term trend
- Weekly mode: Default 40 SMA for broader market perspective
- Trend direction is determined by comparing current SMA value to its previous value
2. CCI Component:
- Traditional CCI calculation with customizable length (default: 20)
- Adjustable overbought (default: +100) and oversold (default: -100) levels
- Color-coded CCI line for quick visual reference:
* Green: Overbought and rising
* Red: Oversold and falling
* Gray: Neutral zone
3. Signal Generation:
- Buy Signal (Green Background):
* CCI crosses above oversold level AND
* Main trend is confirmed bullish (rising SMA)
- Sell Signal (Red Background):
* CCI crosses below overbought level AND
* Main trend is confirmed bearish (falling SMA)
4. Divergence Detection:
- Automatically identifies bullish and bearish divergences
- Bullish Divergence: Price makes lower low while CCI makes higher low
- Bearish Divergence: Price makes higher high while CCI makes lower high
- Visualized with distinct markers on the CCI line
- Can be used to set up alerts for divergence confirmations
⚙️ Customization Options:
- CCI calculation length and price source
- Overbought/Oversold levels
- SMA lengths for daily and weekly modes
- Divergence lookback period
- Signal colors and visualization settings
🔔 Alert Capabilities:
- Set alerts for CCI crossovers of overbought/oversold levels
- Create divergence detection alerts
- Configure trend change notifications
- Combine multiple conditions for complex alert strategies
💡 Trading Tips:
- Combine divergence signals with trend direction for better accuracy
- Wait for signal confirmation before entering trades
- Use additional indicators or price action for exit decisions
This indicator helps traders identify potential trend reversals while keeping them aligned with the main market trend. Perfect for both trend following and counter-trend strategies when used appropriately.
Tags: CCI, trend following, divergence, momentum, signals, SMA, multi-timeframe, technical analysis, trend filter, oversold, overbought
Note: Past performance does not guarantee future results. Always combine with proper risk management.

TechniTrend: Trend and Volume Indicator🟪 Overview
The "TechniTrend: Trend and Volume Indicator" is designed to assist traders in identifying optimal entry and exit points in the market by combining trend detection and volume analysis. This indicator integrates moving average-based trend recognition with volume threshold analysis to provide clear buy and sell signals. Additionally, it includes divergence filtering and correlation analysis to enhance the accuracy of signals, making it suitable for traders who want to identify strong trends and high-probability trading opportunities.
🟪 Indicator Components
🔹Trend Moving Average (MA):
The indicator calculates a moving average based on the closing prices to identify the overall trend. Various moving average types are available for customization:
Simple Moving Average (SMA)
Exponential Moving Average (EMA)
Weighted Moving Average (WMA)
Hull Moving Average (HMA)
The length of the moving average can be adjusted via the Trend MA Length input to adapt to different market conditions.
🔹Volume Analysis:
A volume moving average is calculated over a specified period (Volume MA Length), with a volume threshold derived by multiplying this average by a user-defined Volume Threshold Factor.
This threshold helps to classify volume as either high or low, which plays a crucial role in signal generation.
🔹Divergence Detection:
The indicator can filter out signals when there is a divergence between the price movement and volume changes. Divergence occurs when the price moves in one direction while the volume moves in the opposite direction, indicating a potential weakening of the trend.
🔹Correlation Analysis:
The correlation between price and volume changes is calculated over the same length as the trend moving average. The user can enable this filter to ensure that buy or sell signals are only generated when the correlation exceeds a specified threshold (Correlation Threshold).
🟪 Signals and Alerts
🔹Buy Signal: Generated when the price is above the trend moving average (indicating an uptrend), and the current volume exceeds the volume threshold (indicating high volume). The signal can be filtered based on divergence or correlation settings.
🔹Sell Signal: Triggered when the price is below the trend moving average (indicating a downtrend), and the volume is above the threshold. Similarly, the signal is affected by divergence and correlation filters.
🔹Visual Indicators:
The trend line is plotted on the chart for easy trend identification.
Buy and sell signals are displayed using green and red labels, respectively.
Background highlighting is used to mark areas of high volume on the chart.
🟪 Customizable Inputs
🔹Trend MA Length: Adjusts the moving average length used to detect trends.
🔹Volume MA Length: Sets the length for the volume moving average calculation.
🔹MA Type for Trend: Select the type of moving average for trend detection (SMA, EMA, WMA, HMA).
🔹Volume Threshold Factor: Multiplier used to define high-volume conditions based on the volume moving average.
🔹Enable Divergence Filter: Allows the user to filter out signals where divergence between price and volume is detected.
🔹Enable Correlation Filter: Enables filtering of signals based on the correlation between price and volume changes.
🔹Correlation Threshold: Sets the minimum correlation value required for a signal to be considered valid.
🟪 Alerts
The indicator provides alert conditions for buy and sell signals, allowing traders to receive notifications when new trading opportunities arise.
🟪 Usage Tips
🔹Adjust Moving Average Lengths: Shorter lengths can make the indicator more sensitive to recent market changes, while longer lengths provide a smoother, more reliable trend signal.
🔹Volume Threshold Factor: Increasing this factor raises the volume required to generate high-volume signals, which can help filter.
🟪 Disclaimer:
The "TechniTrend: Trend and Volume Indicator" is a technical analysis tool intended for educational and informational purposes only. It is not a guarantee of future performance or a recommendation to buy, sell, or hold any financial instrument. Trading involves significant risk, and past performance is not indicative of future results. Users should conduct their own research and seek advice from a qualified financial professional before making any investment decisions. The creators of this indicator are not liable for any financial losses or damages incurred through its use.

Rolling Reversion BandsRolling Reversion Bands: A Technical Trading Indicator
This indicator helps traders spot potential reversal opportunities by showing where price might be overextended and likely to return to average levels. It combines two powerful technical tools - Volume Weighted Average Price (VWAP) and Hull Moving Average (HMA) smoothing - to create a more reliable signal.
Key Features:
Golden centerline: A smoothed VWAP that filters out market noise
Uses volume-weighted pricing for better accuracy than simple averages
HMA smoothing reduces false signals while staying responsive to real moves
Works like a "fair value" level that price tends to return to
Colored bands:
Turquoise bands (#32f0dd): Show shorter-term price ranges (100 periods)
Pink/red bands (#c2024f): Show longer-term price ranges (200 periods)
Two levels for each color (inner and outer bands)
How to Use It:
When price moves outside the bands, it might be overextended
The golden HMA-smoothed VWAP centerline acts as a target level where price often returns to
Wider bands show higher volatility, narrower bands show lower volatility
You can toggle different bands on/off to keep your chart clean
Customization:
Adjust HMA smoothing to make the centerline more or less responsive
Change how wide you want the bands to be
Turn different bands on or off as needed
The indicator combines advanced technical concepts (VWAP, HMA, volatility bands) in a visually clean way, using smoothing techniques to reduce noise and help identify clearer trading opportunities.

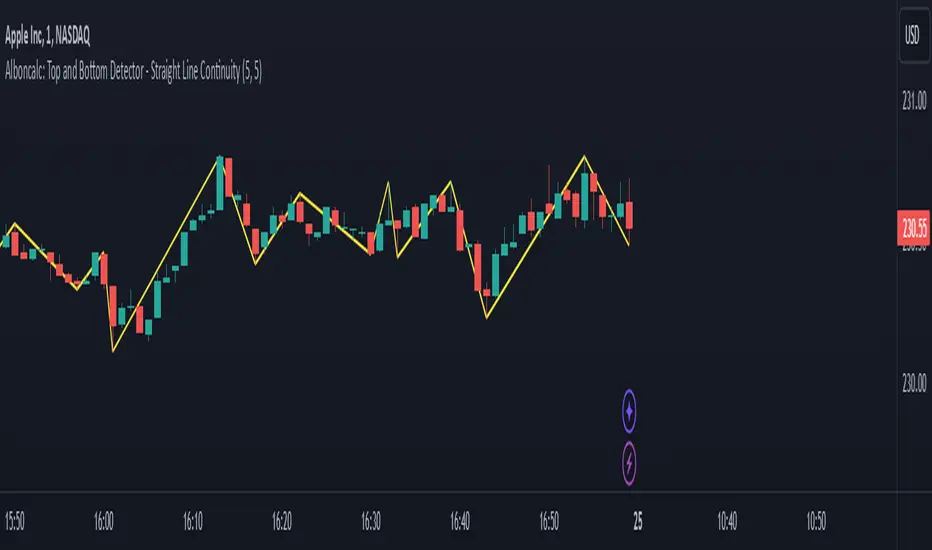
Alboncalc: Top and Bottom Detector - Straight Line ContinuityDescription:
The "Alboncalc: Top and Bottom Detector - Straight Line Continuity" is an innovative indicator for identifying key price reversal points (tops and bottoms) with precision. Unlike traditional indicators that focus on abstract data representations like oscillators or momentum-based lines, this indicator directly overlays the price chart. It draws a continuous line connecting highs and lows (tops and bottoms), providing traders with a clear and immediate visual representation of market swings. The lines automatically adjust in real-time, maintaining a straight path during trend continuations and only shifting when a trend reversal is detected.
Originality and Usefulness:
This indicator stands out from other tools available on TradingView due to its unique ability to maintain a continuous line across price swings, preserving accuracy and visual clarity. Most traditional top-and-bottom detectors merely mark points or provide indicators that are disconnected from price action, making it harder for traders to spot patterns. This script takes a different approach by drawing lines directly on the price chart, offering greater precision and better trend visualization. This innovation is particularly useful for traders who rely on visual cues and price action analysis to make decisions. It simplifies the process of identifying reversal points and trends without needing to rely on lagging indicators.
How It Works:
This indicator detects tops and bottoms based on user-defined periods. When the highest point in a given period is detected, it marks it as a top, and similarly, when the lowest point is detected, it marks it as a bottom. As the price moves, the indicator adjusts the lines to connect consecutive tops and bottoms. If the trend continues in the same direction (e.g., an uptrend), the line remains straight and extends. If a reversal is detected, a new line is drawn to connect the previous bottom (or top) to the new reversal point, providing an accurate visual representation of market trends.
How to Use:
1. Load the Indicator: Add the "Alboncalc: Top and Bottom Detector - Straight Line Continuity" to your chart from the TradingView script library.
2. Customize Settings: Adjust the "Top Period" and "Bottom Period" inputs to fine-tune the sensitivity of top and bottom detection based on your preferred timeframe.
3. Observe Price Action: As the price moves, the indicator will draw lines directly over the price chart, connecting tops and bottoms.
4. Interpret the Lines: Use the continuous lines to identify ongoing trends and potential reversal points. The line remains straight during trend continuation, indicating sustained movement in one direction. A new line signifies a reversal in the trend.
This tool is ideal for traders using trend-following strategies, breakout detection, or those who prefer clean, visual price action analysis (Only Tops and Bottons).
Underlying Concepts:
The core of this indicator is based on the highest high and lowest low concept, which is common in technical analysis. The logic is simple:
- A top is detected when the price reaches a high point compared to a user-defined number of prior candles (i.e., the `top_period`).
- A bottom is detected when the price hits a low point compared to the prior candles (i.e., the `bottom_period`).
When the price continues in the same trend, the line is extended without a break. This behavior ensures that trends are represented in a clear and consistent manner, which helps traders better identify trend continuations and reversals.
Code Breakdown:
```pinescript
//@version=5
indicator("Top and Bottom Detector - Straight Line Continuity", overlay=true)
```
- This initializes the indicator and specifies that it will overlay directly on the price chart.
```pinescript
var int top_period = input.int(5, title="Top Period", minval=1)
var int bottom_period = input.int(5, title="Bottom Period", minval=1)
```
- These inputs allow the user to customize the number of candles used to identify tops and bottoms. A higher period results in fewer but more significant top/bottom detections, while a lower period increases sensitivity.
```pinescript
isTop = ta.highest(top_period) == high
isBottom = ta.lowest(bottom_period) == low
```
- These lines check if the current candle has the highest high or the lowest low in the defined period. If true, the current price is either a top or a bottom.
```pinescript
var line currentLine = na
var float last_price = na
var int last_index = na
var bool isUpTrend = na
```
- These variables store the current line being drawn (`currentLine`), the last detected price (`last_price`), and the direction of the trend (`isUpTrend`). `last_index` tracks where the last top or bottom was detected.
```pinescript
if (isTop or isBottom)
if (not na(last_price))
if ((isTop and isUpTrend) or (isBottom and not isUpTrend))
line.set_xy2(currentLine, bar_index, (isTop ? high : low))
else
currentLine := line.new(x1=last_index, y1=last_price, x2=bar_index, y2=(isTop ? high : low), color=color.yellow, width=2)
last_price := (isTop ? high : low)
last_index := bar_index
isUpTrend := isTop
```
- The `if` block handles the logic of drawing the line. If a top or bottom is detected, and the trend continues (either an uptrend for tops or a downtrend for bottoms), the current line is extended using `line.set_xy2`. If a reversal is detected, a new line is drawn using `line.new`.
- The `last_price` and `last_index` variables are updated after each detection, and the `isUpTrend` flag is set based on whether a top or bottom was found.
Conclusion:
This indicator offers a more precise and visually intuitive way of identifying tops and bottoms directly on the price chart, making it an essential tool for traders focused on price action. Its ability to draw continuous lines through ongoing trends and adjust only upon a reversal makes it superior in terms of visual clarity compared to most conventional indicators.
Smart Money Setup 07 [TradingFinder] Liquidity Hunts & Minor OB🔵 Introduction
The Smart Money Concept relies on analyzing market structure, tracking liquidity flows, and identifying order blocks. Research indicates that traders who apply these methods can improve their accuracy in predicting market movements by up to 30%.
These elements allow traders to understand the behavior of market makers, including banks and large financial institutions, which have the ability to influence price movements and shape major market trends. By recognizing how these entities operate, traders can align their strategies with Smart Money actions and better anticipate shifts in the market.
Smart Money typically enters the market at points of high liquidity where trading opportunities are more attractive. By following these liquidity flows, professional traders can position themselves at market reversal points, leading to profitable trades.
The Smart Money Setup 07 indicator has been specifically designed to detect these complex patterns. Using advanced algorithms, this indicator automatically identifies both bullish and bearish trading setups, assisting traders in discovering hidden market opportunities.
As a powerful technical analysis tool, the Smart Money Setup indicator helps predict the actions of major market participants and highlights optimal entry and exit points. Essentially, this tool enables traders to act like institutional investors and market makers, making the most of price fluctuations in their favor.
Ultimately, the Smart Money Setup 07 indicator transforms complex technical analysis into a simple and practical tool. By detecting order blocks and liquidity zones, this tool helps traders execute their strategies with greater precision, leading to more informed and successful trading decisions.
🟣 Bullish Setup
🟣 Bearish Setup
🔵 How to Use
One of the key strengths of the Smart Money Setup 07 indicator is its ability to accurately identify order blocks and analyze liquidity flows. Order blocks represent areas where large buy or sell orders are placed by Smart Money investors, which often indicate key reversal points in the market. Traders can use these order blocks to pinpoint potential entry and exit opportunities.
The Smart Money Setup indicator detects and visually displays these order blocks on the chart, helping traders identify the best zones to enter or exit trades. Since these zones are frequently used by large institutional investors, following these blocks allows traders to capitalize on price fluctuations and trade with confidence.
🟣 Bullish Smart Money Setup
A Bullish Smart Money Setup forms when the market creates Higher Lows and Higher Highs. In this situation, the indicator analyzes pivot points, liquidity flows, and order blocks to identify buy opportunities. Liquidity points in these setups indicate areas where Smart Money is likely to enter long positions.
In the bullish setup image, multiple Higher Lows and Higher Highs are formed. The green zone represents a Bullish Order Block, signaling traders to enter a long trade. The Smart Money Setup indicator displays a green arrow, indicating a high-probability upward price movement from this liquidity zone.
🟣 Bearish Smart Money Setup
A Bearish Smart Money Setup occurs when the market structure shows Lower Highs and Lower Lows, indicating weakness in price. The indicator identifies these patterns and highlights potential sell opportunities. Liquidity points in this setup mark areas where Smart Money enters sell positions.
In the bearish setup image, a Lower High is followed by a Lower Low, with the red liquidity zone acting as a Bearish Order Block. The Smart Money Setup indicator shows a red arrow, signaling a likely downward move, offering traders an opportunity to enter short positions.
🔵 Settings
Pivot Period : This setting determines how many candles are needed to form a pivot point. A default value of 2 is optimal for quickly identifying key pivot points in price action.
Order Block Validity Period : This parameter defines the lifespan of an order block. Traders can adjust how long each order block remains valid. For instance, setting it to 500 means that an order block will be valid for 500 bars after its formation.
Mitigation Level OB : This setting allows traders to select whether order blocks should be based on the "Proximal," "50% OB," or "Distal" levels, helping traders manage risk more effectively.
Order Block Refinement : Traders can refine the order blocks with precision. The indicator offers two refinement modes: Defensive and Aggressive. The Defensive mode identifies safer order blocks, while the Aggressive mode targets higher-risk blocks with the potential for larger reversals.
🔵 Conclusion
The Smart Money Setup 07 indicator is a powerful tool for identifying key Smart Money movements in the market. It provides traders with essential insights for making informed trading decisions, particularly when combined with technical analysis and liquidity flow analysis. This indicator allows traders to accurately pinpoint entry and exit points, helping them maximize profits and minimize risk.
By offering a range of customizable settings, the Smart Money Setup indicator adapts to different trading styles and strategies. Furthermore, its ability to detect order blocks and identify supply and demand zones makes it an indispensable tool for any trader looking to enhance their strategy.
In conclusion, the Smart Money Setup 07 is a crucial tool for traders aiming to optimize their trading performance. By utilizing the concepts of Smart Money in technical analysis, traders can make more precise decisions and take advantage of market fluctuations.

Adaptive Fibonacci Trend Ribbon[FibonacciFlux]Adaptive Fibonacci Trend Ribbon (FibonacciFlux)
Overview
The Adaptive Fibonacci Trend Ribbon is a versatile technical analysis tool designed for traders who want to leverage the power of multiple moving averages while integrating Fibonacci numbers. This indicator provides a dynamic visual representation of market trends, enhancing decision-making processes in trading.
Key Features
1. Multi-Moving Averages
- The indicator calculates eight different moving averages based on user-defined periods, including Fibonacci numbers such as 5, 8, 13, 21, 34, 55, 89, and 144.
- Traders can choose from various moving average types, including EMA, HMA, WMA, VWMA, ALMA, SMA, RMA, and TMA , allowing for tailored analysis based on market conditions.
2. Trend Detection
- Each moving average is color-coded based on its trend direction, with green indicating an upward trend and red indicating a downward trend.
- This visual clarity helps traders quickly assess market sentiment and make informed decisions.
3. Fill Areas for Enhanced Insight
- The indicator features fill areas between the moving averages, which dynamically change color according to their relative positions.
- This provides a clear visual cue of trend strength and potential reversal points, allowing traders to identify key areas of interest.
4. Customizable Inputs
- Users can easily adjust the source data, moving average lengths, and ALMA parameters (offset and sigma) to fit their trading strategies.
- This flexibility ensures that traders can adapt the tool to various market conditions and personal preferences.
Insights and Applications
1. Fibonacci Integration
- By incorporating Fibonacci numbers into the moving average periods, this indicator allows traders to align their strategies with key levels of support and resistance.
- This can enhance the accuracy of entry and exit points, particularly in trending markets.
2. Trend Continuation and Reversal Analysis
- The adaptive nature of the moving averages provides insights into potential trend continuations or reversals.
- Traders can use the indicator to identify when to enter or exit positions based on the interaction between the moving averages.
3. Visual Clarity for Quick Decisions
- The color-coded moving averages and fill areas offer immediate visual feedback on market conditions, helping traders react swiftly to changing dynamics.
- This is especially useful in fast-moving markets where timely decisions are critical.
Conclusion
The Adaptive Fibonacci Trend Ribbon is an essential tool for traders looking to enhance their technical analysis capabilities. By combining multiple moving averages with Fibonacci integration and dynamic visual cues, this indicator offers a robust framework for understanding market trends. Its flexibility and clarity make it an invaluable asset for both novice and experienced traders alike.
Open Source Contribution
This indicator is open source, inviting contributions and improvements from the trading community. Feel free to fork, enhance, and share your insights with the world, helping to foster a collaborative environment for traders everywhere.

VWAP2 --ClaireIndicator Release Notes
I am excited to introduce a powerful multi-timeframe Volume Weighted Average Price (VWAP) indicator. This tool helps traders analyze market trends and identify key support and resistance levels across various timeframes. Below are the main features and usage guidelines for this indicator:
Key Features
Open Price for Each Timeframe
The "Open" option represents the opening price for each specific timeframe, such as daily, weekly, monthly, etc.
Previous vs. Current Levels
Levels prefixed with 'P' (e.g., pwval) are calculated for the previous period, while those without 'P' (e.g., wval) represent the current period. For instance, pwval is the VWAP-calculated Value Area Low (VAL) for the previous week, whereas wval applies to the current week.
VWAP Calculation Standards
VWAP can be calculated using a standard deviation (S) or a percentage (P). The "Multiplier" indicates how many standard deviations are applied, with a default setting of S (standard deviation) and a multiplier of 1.
Data Source Default
The default data source for calculations is hlc3, which is the average of high, low, and close prices. This can be adjusted if needed.
Merge Function
The Merge option visually groups data that is closely aligned within a specified range, allowing for a clearer representation of critical price levels.
Viewing Recommendations
When analyzing higher dimensions, it is recommended to enable Quarter (Q) and Year (Y) settings to identify important price levels near the current price. For detailed attention, you can disable levels that are significantly distant from the current price.
Data Limitations
Free TradingView accounts can pull data from up to 20,000 candles. This means the indicator is most accurate and comprehensive on 1-hour and 4-hour timeframes, given these data constraints.
Usage Guidelines
Trend Analysis: Utilize VWAP and bands across different timeframes to identify market trend continuations or reversals.
Support and Resistance Identification: Use the calculated upper and lower bands as potential support or resistance levels to optimize entry and exit points in your trading.
Combined Application: It is recommended to use this indicator alongside other technical analysis tools to improve the accuracy of your analysis and the reliability of your trading decisions.
I believe this versatile and highly customizable VWAP indicator will become an essential part of your trading toolkit, helping you to better understand market dynamics and make more precise trading decisions.

Confluence StrategyOverview of Confluence Strategy
The Confluence Strategy in trading refers to the combination of multiple technical indicators, support/resistance levels, and chart patterns to identify high-probability trading opportunities. The idea is that when several indicators agree on a price movement, the likelihood of that movement being successful increases.
Key Components
Technical Indicators:
Moving Averages (MA): Commonly used to determine the trend direction. Look for crossovers (e.g., the 50-day MA crossing above the 200-day MA).
Relative Strength Index (RSI): Helps identify overbought or oversold conditions. A reading above 70 may indicate overbought conditions, while below 30 suggests oversold.
MACD (Moving Average Convergence Divergence): Useful for spotting changes in momentum. Look for MACD crossovers and divergence from price.
Support and Resistance Levels:
Identify key levels where price has historically reversed. These can be drawn from previous highs/lows, Fibonacci retracement levels, or psychological price levels.
Chart Patterns:
Patterns like head and shoulders, double tops/bottoms, or flags can indicate potential reversals or continuations in price.
Strategy Implementation
Set Up Your Chart:
Add the desired indicators (e.g., MA, RSI, MACD) to your TradingView chart.
Mark significant support and resistance levels.
Identify Confluence Points:
Look for situations where multiple indicators align. For instance, if the price is near a support level, the RSI is below 30, and the MACD shows bullish divergence, this may signal a buying opportunity.
Entry and Exit Points:
Entry: Place a trade when your confluence conditions are met. Use limit orders for better prices.
Exit: Set profit targets based on resistance levels or use trailing stops. Consider the risk-reward ratio to ensure your trades are favorable.
Risk Management:
Always implement stop-loss orders to protect against unexpected market moves. Position size should reflect your risk tolerance.
Example of a Confluence Trade
Setup:
Price approaches a strong support level.
RSI shows oversold conditions (below 30).
The 50-day MA is about to cross above the 200-day MA (bullish crossover).
Action:
Enter a long position as the conditions align.
Set a stop loss just below the support level and a take profit at the next resistance level.
Conclusion
The Confluence Strategy can significantly enhance trading accuracy by ensuring that multiple indicators support a trade decision. Traders on TradingView can customize their indicators and charts to fit their personal trading styles, making it a flexible approach to technical analysis.

(MA-EWMA) with ChannelsHamming Windowed Volume-Weighted Bidirectional Momentum-Adaptive Exponential Weighted Moving Average
This script is an advanced financial indicator that calculates a Hamming Windowed Volume-Weighted Bidirectional Momentum-Adaptive Exponential Weighted Moving Average (MA-EWMA). It adapts dynamically to market conditions, adjusting key parameters like lookback period, momentum length, and volatility sensitivity based on price volatility.
Key Components:
Dynamic Adjustments: The indicator adjusts its lookback and momentum length using the ATR (Average True Range), making it more responsive to volatile markets.
Volume Weighting: It incorporates volume data, weighting the moving average based on the volume activity, adding further sensitivity to price movement.
Bidirectional Momentum: It calculates upward and downward momentum separately, using these values to determine the directional weighting of the moving average.
Hamming Window: This technique smooths the price data by applying a Hamming window, which helps to reduce noise in the data and enhances the accuracy of the moving average.
Channels: Instead of plotting a single line, the script creates dynamic channels, providing more context for support and resistance levels based on the market's behavior.
The result is a highly adaptive and sophisticated moving average indicator that responds dynamically to both price momentum and volume trends.

Fluid Dynamics-Inspired Indicator with Bidirectional ScalingThe "Enhanced Fluid Dynamics-Inspired Indicator with Bidirectional Scaling" is a sophisticated technical analysis tool that draws inspiration from the principles of fluid dynamics to measure both upward and downward price movements, while also incorporating volatility and momentum into its calculations. The indicator aims to provide traders with a clear understanding of market dynamics by analyzing "streamflow" (price and volume movements) in both directions, enhanced with adaptive scaling techniques.
Key Features:
Bidirectional Price Momentum:
The indicator separately calculates positive and negative momentum using the price's rate of change. This allows for independent analysis of upward and downward price movements, providing a balanced view of the market's direction.
Streamflow Model:
The "streamflow" is calculated by multiplying volume flow with price momentum. This approach treats the market as a fluid system, where the momentum and volume of trades influence the flow of prices in both upward and downward directions. Streamflow is calculated independently for each direction.
Adaptive Volatility Scaling:
Volatility is dynamically calculated using the Average True Range (ATR) and is weighted to adjust to varying market conditions. An adaptive logarithmic scaling factor is applied to the volatility to capture the dynamic nature of market environments.
DRMA (Displaced Rolling Moving Average):
The indicator uses the DRMA function to smooth out price and volume data, improving the accuracy of its measurements. This allows the indicator to capture longer-term trends while still being responsive to short-term fluctuations.
Non-Linear Scaling and Normalization:
To ensure that the output values are within a usable range, the indicator employs a sigmoid-based non-linear scaling function. This helps normalize the composite output, making it easier to interpret overbought and oversold conditions.
Visual Representation:
The indicator plots two separate lines for upward and downward market movements, making it easy to distinguish between bullish and bearish trends. Background colors are also used to highlight periods of strong upward or downward momentum, as well as high volatility.
Overbought/Oversold Conditions:
Upper and lower thresholds are used to signal potential overbought and oversold conditions. Alerts are triggered when the market moves into extreme levels, helping traders identify potential entry and exit points.
Usage:
This indicator is designed for traders who are looking for a more nuanced and dynamic tool to measure both bullish and bearish trends. By using bidirectional scaling, it provides clearer signals for market direction, while adaptive volatility and momentum adjustments ensure the indicator responds to different market environments. The alert conditions make it especially useful for timing trades in highly volatile conditions or when price movements reach extreme levels.

Savitzky Golay Median Filtered RSI [BackQuant]Savitzky Golay Median Filtered RSI
Introducing BackQuant's Savitzky Golay Median Filtered RSI, a cutting-edge indicator that enhances the classic Relative Strength Index (RSI) by applying both a Savitzky-Golay filter and a median filter to provide smoother and more reliable signals. This advanced approach helps reduce noise and captures true momentum trends with greater precision. Let’s break down how the indicator works, the features it offers, and how it can improve your trading strategy.
Core Concept: Relative Strength Index (RSI)
The Relative Strength Index (RSI) is a widely used momentum oscillator that measures the speed and change of price movements. It oscillates between 0 and 100, with levels above 70 typically indicating overbought conditions and levels below 30 indicating oversold conditions. However, the standard RSI can sometimes generate noisy signals, especially in volatile markets, making it challenging to identify reliable entry and exit points.
To improve upon the traditional RSI, this indicator introduces two powerful filters: the Savitzky-Golay filter and a median filter.
Savitzky-Golay Filter: Smoothing with Precision
The Savitzky-Golay filter is a digital filtering technique used to smooth data while preserving important features, such as peaks and trends. Unlike simple moving averages that can distort important price data, the Savitzky-Golay filter uses polynomial regression to fit the data, providing a more accurate and less lagging result.
In this script, the Savitzky-Golay filter is applied to the RSI values to smooth out short-term fluctuations and provide a more reliable signal. By using a window size of 5 and a polynomial degree of 2, the filter effectively reduces noise without compromising the integrity of the underlying price movements.
Median Filter: Reducing Outliers
After applying the Savitzky-Golay filter, the median filter is applied to the smoothed RSI values. The median filter is particularly effective at removing short-lived outliers, further enhancing the accuracy of the RSI by reducing the impact of sudden and temporary price spikes or drops. This combination of filters creates an ultra-smooth RSI that is better suited for detecting true market trends.
Long and Short Signals
The Savitzky Golay Median Filtered RSI generates long and short signals based on user-defined threshold levels:
Long Signals: A long signal is triggered when the filtered RSI exceeds the Long Threshold (default set at 176). This indicates that momentum is shifting upward, and it may present a good buying opportunity.
Short Signals: A short signal is generated when the filtered RSI falls below the Short Threshold (default set at 162). This suggests that momentum is weakening, potentially signaling a selling opportunity or exit from a long position.
These threshold levels can be adjusted to suit different market conditions and timeframes, allowing traders to fine-tune the sensitivity of the indicator.
Customization and Visualization Options
The Savitzky Golay Median Filtered RSI comes with several customization options, enabling traders to tailor the indicator to their specific needs:
Calculation Source: Select the price source for the RSI calculation (default is OHLC4, but it can be changed to close, open, high, or low prices).
RSI Period: Adjust the lookback period for the RSI calculation (default is 14).
Median Filter Length: Control the length of the median filter applied to the smoothed RSI, affecting how much noise is removed from the signal.
Threshold Levels: Customize the long and short thresholds to define the sensitivity for generating buy and sell signals.
UI Settings: Choose whether to display the RSI and thresholds on the chart, color the bars according to trend direction, and adjust the line width and colors used for long and short signals.
Visual Feedback: Color-Coded Signals and Thresholds
To make the signals easier to interpret, the indicator offers visual feedback by coloring the price bars and the RSI plot according to the current market trend:
Green Bars indicate long signals when momentum is bullish.
Red Bars indicate short signals when momentum is bearish.
Gray Bars indicate neutral or undecided conditions when no clear signal is present.
In addition, the Long and Short Thresholds can be plotted directly on the chart to provide a clear reference for when signals are triggered, allowing traders to visually gauge the strength of the RSI relative to its thresholds.
Alerts for Automation
For traders who prefer automated notifications, the Savitzky Golay Median Filtered RSI includes built-in alert conditions for long and short signals. You can configure these alerts to notify you when a buy or sell condition is met, ensuring you never miss a trading opportunity.
Trading Applications
This indicator is versatile and can be used in a variety of trading strategies:
Trend Following: The combination of Savitzky-Golay and median filtering makes this RSI particularly useful for identifying strong trends without being misled by short-term noise. Traders can use the long and short signals to enter trades in the direction of the prevailing trend.
Reversal Trading: By adjusting the threshold levels, traders can use this indicator to spot potential reversals. When the RSI moves from overbought to oversold levels (or vice versa), it may signal a shift in market direction.
Swing Trading: The smoothed RSI provides a clear signal for short to medium-term price movements, making it an excellent tool for swing traders looking to capitalize on momentum shifts.
Risk Management: The filtered RSI can be used as part of a broader risk management strategy, helping traders avoid false signals and stay in trades only when the momentum is strong.
Final Thoughts
The Savitzky Golay Median Filtered RSI takes the classic RSI to the next level by applying advanced smoothing techniques that reduce noise and improve signal reliability. Whether you’re a trend follower, swing trader, or reversal trader, this indicator provides a more refined approach to momentum analysis, helping you make better-informed trading decisions.
As with all indicators, it is important to backtest thoroughly and incorporate sound risk management strategies when using the Savitzky Golay Median Filtered RSI in your trading system.
Thus following all of the key points here are some sample backtests on the 1D Chart
Disclaimer: Backtests are based off past results, and are not indicative of the future.
INDEX:BTCUSD
INDEX:ETHUSD
BINANCE:SOLUSD

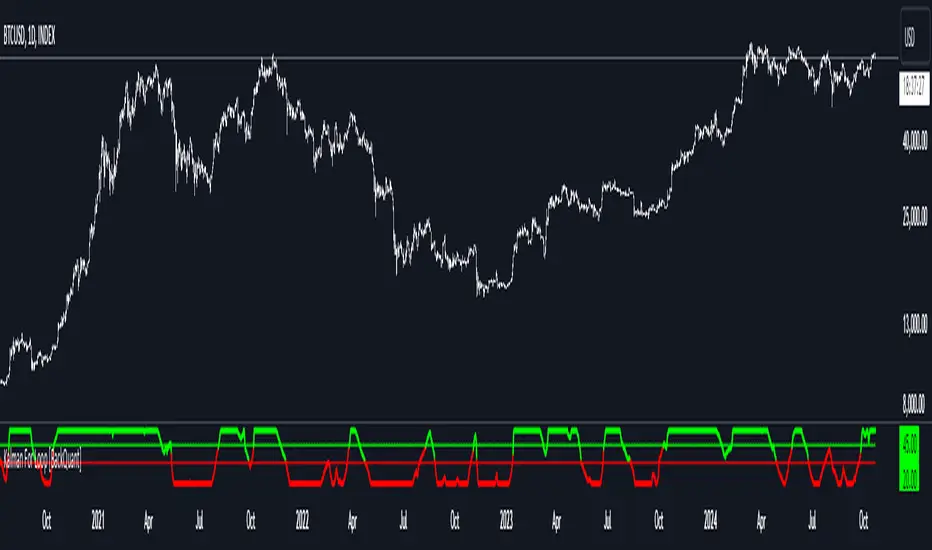
Kalman For Loop [BackQuant]Kalman For Loop
Introducing BackQuant's Kalman For Loop (Kalman FL) — a highly adaptive trading indicator that uses a Kalman filter to smooth price data and generate actionable long and short signals. This advanced indicator is designed to help traders identify trends, filter out market noise, and optimize their entry and exit points with precision. Let’s explore how this indicator works, its key features, and how it can enhance your trading strategies.
Core Concept: Kalman Filter
The Kalman Filter is a mathematical algorithm used to estimate the state of a system by filtering noisy data. It is widely used in areas such as control systems, signal processing, and time-series analysis. In the context of trading, a Kalman filter can be applied to price data to smooth out short-term fluctuations, providing a clearer view of the underlying trend.
Unlike moving averages, which use fixed weights to smooth data, the Kalman Filter adjusts its estimate dynamically based on the relationship between the process noise and the measurement noise. This makes the filter more adaptive to changing market conditions, providing more accurate trend detection without the lag associated with traditional smoothing techniques.
Please see the original Kalman Price Filter
In this script, the Kalman For Loop applies the Kalman filter to the price source (default set to the closing price) to generate a smoothed price series, which is then used to calculate signals.
Adaptive Smoothing with Process and Measurement Noise
Two key parameters govern the behavior of the Kalman filter:
Process Noise: This controls the extent to which the model allows for uncertainty in price changes. A lower process noise value will make the filter smoother but slower to react to price changes, while a higher value makes it more sensitive to recent price fluctuations.
Measurement Noise: This represents the uncertainty or "noise" in the observed price data. A higher measurement noise value gives the filter more leeway to ignore short-term fluctuations, focusing on the broader trend. Lowering the measurement noise makes the filter more responsive to minor changes in price.
These settings allow traders to fine-tune the Kalman filter’s sensitivity, adjusting it to match their preferred trading style or market conditions.
For-Loop Scoring Mechanism
The Kalman FL further enhances the effectiveness of the Kalman filter by using a for-loop scoring system. This mechanism evaluates the smoothed price over a range of periods (defined by the Calculation Start and Calculation End inputs), assigning a score based on whether the current filtered price is higher or lower than previous values.
Long Signals: A long signal is generated when the for-loop score surpasses the Long Threshold (default set at 20), indicating a strong upward trend. This helps traders identify potential buying opportunities.
Short Signals: A short signal is triggered when the score crosses below the Short Threshold (default set at -10), signaling a potential downtrend or selling opportunity.
These signals are plotted on the chart, giving traders a clear visual indication of when to enter long or short positions.
Customization and Visualization Options
The Kalman For Loop comes with a range of customization options to give traders full control over how the indicator operates and is displayed on the chart:
Kalman Price Source: Choose the price data used for the Kalman filter (default is the closing price), allowing you to apply the filter to other price points like open, high, or low.
Filter Order: Set the order of the Kalman filter (default is 5), controlling how far back the filter looks in its calculations.
Process and Measurement Noise: Fine-tune the sensitivity of the Kalman filter by adjusting these noise parameters.
Signal Line Width and Colors: Customize the appearance of the signal line and the colors used to indicate long and short conditions.
Threshold Lines: Toggle the display of the long and short threshold lines on the chart for better visual clarity.
The indicator also includes the option to color the candlesticks based on the current trend direction, allowing traders to quickly identify changes in market sentiment. In addition, a background color feature further highlights the overall trend by shading the background in green for long signals and red for short signals.
Trading Applications
The Kalman For Loop is a versatile tool that can be adapted to a variety of trading strategies and markets. Some of the primary use cases include:
Trend Following: The adaptive nature of the Kalman filter helps traders identify the start of new trends with greater precision. The for-loop scoring system quantifies the strength of the trend, making it easier to stay in trades for longer when the trend remains strong.
Mean Reversion: For traders looking to capitalize on short-term reversals, the Kalman filter's ability to smooth price data makes it easier to spot when price has deviated too far from its expected path, potentially signaling a reversal.
Noise Reduction: The Kalman filter excels at filtering out short-term price noise, allowing traders to focus on the broader market movements without being distracted by minor fluctuations.
Risk Management: By providing clear long and short signals based on filtered price data, the Kalman FL helps traders manage risk by entering positions only when the trend is well-defined, reducing the chances of false signals.
Alerts and Automation
To further assist traders, the Kalman For Loop includes built-in alert conditions that notify you when a long or short signal is generated. These alerts can be configured to trigger notifications, helping you stay on top of market movements without constantly monitoring the chart.
Final Thoughts
The Kalman For Loop is a powerful and adaptive trading indicator that combines the precision of the Kalman filter with a for-loop scoring mechanism to generate reliable long and short signals. Whether you’re a trend follower or a reversal trader, this indicator offers the flexibility and accuracy needed to navigate complex markets with confidence.
As always, it’s important to backtest the indicator and adjust the settings to fit your trading style and market conditions. No indicator is perfect, and the Kalman FL should be used alongside other tools and sound risk management practices for the best results.
XAUUSD Multi-Timeframe Trend AnalyzerOverview
The "XAUUSD Multi-Timeframe Trend Analyzer" is an advanced script designed to provide a comprehensive analysis of the XAUUSD (Gold/US Dollar) trend across multiple timeframes simultaneously. By combining several key technical indicators, this tool helps traders quickly assess the market direction and trend strength for M15, M30, H1, H4, and D1 timeframes.
Multi-Timeframe Analysis: Displays the trend direction and strength across M15, M30, H1, H4, and D1 timeframes, allowing for a complete overview in a single glance.
Comprehensive Indicator Blend: Utilizes six popular technical indicators to determine the trend—Moving Averages, RSI, MACD, Bollinger Bands, DMI, and Parabolic SAR.
Trend Strength Scoring: Provides a numerical trend strength score (from -6 to 6) based on the alignment of the indicators, with positive values indicating uptrends and negative values for downtrends.
Visual Table Display: Displays results in a color-coded table (green for uptrend, red for downtrend, yellow for neutral) with a strength score for each timeframe, helping traders quickly assess market conditions.
How It Works
This script calculates the overall trend and its strength for each selected timeframe by analyzing six widely-used technical indicators:
Moving Averages (MA): The script uses a Fast and a Slow Moving Average. When the Fast MA crosses above the Slow MA, it indicates an uptrend. When the Fast MA crosses below, it signals a downtrend.
Relative Strength Index (RSI): The RSI is used to assess momentum. An RSI value above 50 suggests bullish momentum, while a value below 50 suggests bearish momentum.
Moving Average Convergence Divergence (MACD): MACD measures momentum and trend direction. When the MACD line crosses above the signal line, it signals bullish momentum; when it crosses below, it signals bearish momentum.
Bollinger Bands: These measure price volatility. When the price is above the middle Bollinger Band, the script considers the trend to be bullish, and when it's below, bearish.
Directional Movement Index (DMI): The DMI compares positive directional movement (DI+) and negative directional movement (DI-). A stronger DI+ over DI- signals an uptrend and vice versa.
Parabolic SAR: This indicator is used for determining potential trend reversals and setting stop-loss levels. If the price is above the Parabolic SAR, it indicates an uptrend, and if below, a downtrend.
Trend Strength Calculation
The script calculates a trend strength score for each timeframe:
Each indicator adds or subtracts 1 to the score based on whether it aligns with an uptrend or a downtrend.
A score of 6 indicates a Strong Uptrend, with all indicators aligned bullishly.
A score of -6 indicates a Strong Downtrend, with all indicators aligned bearishly.
Intermediate scores (e.g., 2 or -2) indicate Weak Uptrend or Weak Downtrend, suggesting that not all indicators are in agreement.
A score between 1 and -1 indicates a Neutral trend, suggesting uncertainty in the market.
How to Use
Assess Trend Direction and Strength: The table provides an easy-to-read summary of the trend and its strength on different timeframes. Look for timeframes where the strength is high (either 6 for a strong uptrend or -6 for a strong downtrend) to confirm the market’s overall direction.
Use in Conjunction with Other Strategies: This indicator is designed to provide a comprehensive view of the market. Traders should combine it with other strategies, such as price action analysis or candlestick patterns, to further confirm their trades.
Trend Reversal or Continuation: A weak trend (e.g., a strength of 2 or -2) could signal a possible reversal or a trend that has lost momentum. Strong trends (with a strength of 6 or -6) indicate higher confidence in trend continuation.
Multiple Timeframe Confirmation: Look for alignment across multiple timeframes to confirm the strength and direction of the trend before entering trades. For example, if M15, M30, and H1 are all showing a strong uptrend, it suggests a higher probability of the trend continuing.
Customization Options
- Adjustable Indicators: Users can modify the length and parameters of the Moving Averages, RSI, MACD, Bollinger Bands, DMI, and Parabolic SAR to suit their trading style.
- Flexible Timeframes: You can toggle between different timeframes (M15, M30, H1, H4, D1) to focus on the intervals most relevant to your strategy.
Ideal For
- Traders looking for a detailed, multi-timeframe trend analysis tool for XAUUSD.
- Traders who rely on trend-following strategies and need confirmation across multiple timeframes.
- Those who prefer a multi-indicator approach to avoid false signals and improve the accuracy of their trades.
Disclaimer
This indicator is for informational and educational purposes only. It is recommended to combine this with proper risk management strategies and your own analysis. Past performance does not guarantee future results. Always perform your own due diligence before making trading decisions.

Advanced Supply and Demand Indicator# Advanced Supply and Demand Indicator
This Pine Script™ indicator helps traders identify potential supply and demand zones in financial markets. It uses price action, volume, and historical data to plot these zones on your chart, providing valuable insights for trading decisions.
## Key Features:
- Automatically detects and plots supply and demand zones
- Customizable lookback period for zone identification
- Adjustable strength multiplier for more precise zone detection
- User-defined opacity for visual clarity
- Combines price action and volume analysis for improved accuracy
## How It Works:
1. Identifies significant price levels using a specified lookback period
2. Analyzes volume data to confirm potential supply and demand zones
3. Plots supply zones in red and demand zones in green
4. Displays the current price for easy reference
## Customization Options:
- Lookback Period: Adjust the historical data range (1-100 bars)
- Zone Strength Multiplier: Fine-tune the sensitivity of zone detection (1.0-3.0)
- Zone Opacity: Set the transparency of plotted zones (10-100%)
This indicator is designed to help traders identify potential areas of support and resistance, allowing for more informed entry and exit decisions in their trading strategies.

Signals Pro [traderslog]The "Signals Pro" indicator is an advanced and versatile trading tool designed to help traders accurately identify key buy and sell signals using a combination of technical analysis factors such as candle patterns , RSI (Relative Strength Index) , and candle stability . It is highly customizable and offers a range of options that make it suitable for both short-term and long-term traders. By filtering market noise and providing actionable insights, this indicator enhances decision-making and helps traders capitalize on market movements.
At the core of the "Signals Pro" indicator is the concept of Candle Stability . The Candle Stability Index measures the ratio between a candle's body and its wicks, providing insight into the strength of the price movement during that period. A higher value indicates that the candle is more stable, meaning that the price has moved significantly without much retracement. This stability filter is crucial because it prevents the generation of signals during volatile or choppy market conditions where price direction is uncertain. Traders can adjust the Candle Stability Index from 0 to 1, allowing for precise control over how stable a candle must be for the indicator to generate a signal.
Another key feature is the use of RSI (Relative Strength Index) , a momentum oscillator that measures the speed and change of price movements. The RSI index parameter in the indicator can be customized to detect overbought or oversold conditions. When the RSI falls below the defined threshold, it signals that the market may be oversold , which can indicate a potential buying opportunity . Conversely, when the RSI exceeds a certain value, it suggests that the market is overbought , signaling a potential selling opportunity . This allows traders to time their trades more effectively by entering when market conditions are favorable and exiting before a potential reversal occurs.
The Candle Delta Length is another critical element of the "Signals Pro" indicator. This parameter measures how much the price has increased or decreased over a specific number of candles. By adjusting the Candle Delta Length , traders can define how many periods the indicator should analyze before generating a signal. A longer Candle Delta Length means the price has been trending in one direction for a longer period, providing more reliable signals. For instance, if the price has been steadily decreasing for five candles, this could signal a bullish reversal , triggering a buy signal .
To further enhance its accuracy, the "Signals Pro" indicator includes a unique feature that allows traders to disable repeating signals . This is particularly useful in situations where the market is moving sideways or during low volatility periods, where multiple signals may cluster close together, creating confusion. By enabling the disable repeating signals option, traders can prevent these repeated signals and focus on the most important and confirmed signals, ensuring cleaner charts and reducing the risk of overtrading.
A key technical aspect of the indicator is its ability to detect bullish and bearish engulfing patterns . The indicator looks for bullish engulfing patterns, which occur when a bullish candle fully engulfs the body of the previous bearish candle, signaling a potential bullish reversal . Conversely, bearish engulfing patterns occur when a bearish candle fully engulfs the previous bullish candle, indicating a bearish reversal . By incorporating these candle patterns with the Candle Stability Index and RSI levels , the indicator provides highly reliable signals based on price action and market sentiment.
Visual customization is another major advantage of the "Signals Pro" indicator. Traders can choose from several different label styles , such as text bubbles , triangles , or arrows to mark the buy and sell signals on the chart. This makes the signals stand out and easy to interpret at a glance. Furthermore, the color of these signals can be customized: green for buy signals and red for sell signals , along with options to adjust the text size and label styles for even more personalization. Traders can make the signals more or less prominent based on their preference, enhancing readability and workflow efficiency.
The indicator also includes a comprehensive alert system , ensuring traders never miss an opportunity. Alerts can be set for both buy and sell signals , and the system triggers in real-time when a valid signal is generated. This is especially useful for active traders who want to stay on top of the markets without constantly monitoring their screens. The alert system helps ensure that traders are notified of potential trading opportunities as soon as they arise, allowing them to act quickly in volatile markets.
From a practical standpoint, the "Signals Pro" indicator is designed to work seamlessly across multiple timeframes, making it suitable for scalpers, day traders, swing traders, and even long-term investors. Its flexibility allows it to adapt to different trading styles and time horizons, providing value for a wide range of market participants.
In summary, the Signals Pro indicator offers a robust and customizable solution for identifying buy and sell signals . By combining candle stability , RSI analysis , and engulfing patterns , the indicator provides traders with reliable signals to enter or exit trades. The ability to customize signal appearance, coupled with a real-time alert system , makes the "Signals Pro" indicator an invaluable tool for traders looking to improve their timing and decision-making. Whether you are looking to capture short-term price movements or want to time entries and exits in longer-term trends, this indicator offers the insights needed to navigate the markets with confidence.
