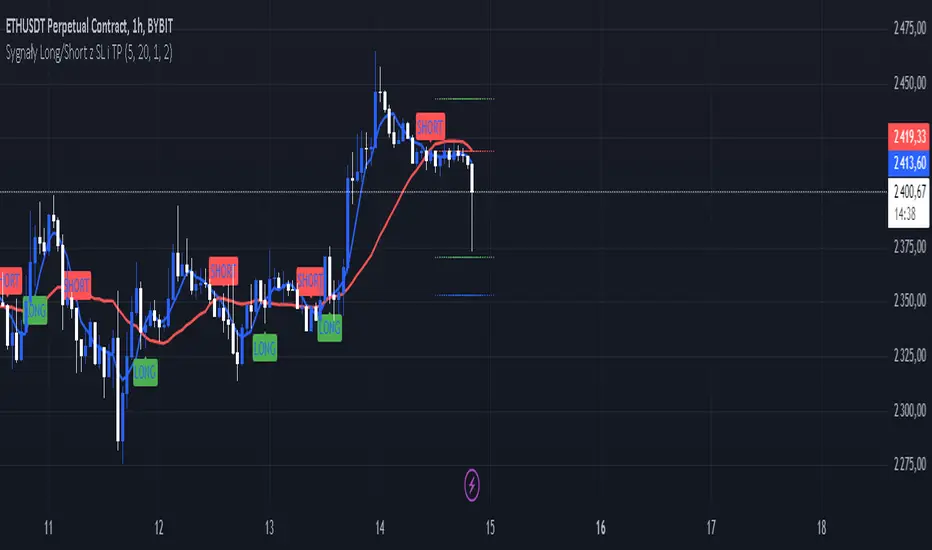
Sygnały Long/Short z SL i TPChoosing the Best Timeframe for Your Trading Strategy
The ideal timeframe for your trading strategy depends on several factors, including your trading style, risk preferences, and the goals of your strategy. Here’s a guide to different timeframes and their applications:
Timeframes and Their Uses:
Short-Term Timeframes (e.g., 5-minute, 15-minute):
Advantages: Provide more frequent signals and allow for quick responses to market changes. Ideal for day traders who prefer short, rapid trades.
Disadvantages: Can generate more false signals and be more susceptible to market noise. Requires more frequent attention and monitoring.
Medium-Term Timeframes (e.g., 1-hour, 4-hour):
Advantages: Offer fewer false signals compared to shorter timeframes. Suitable for swing traders looking to capture short-term trends.
Disadvantages: Fewer signals compared to shorter timeframes. Requires less frequent monitoring.
Long-Term Timeframes (e.g., daily, weekly):
Advantages: Provide more stable signals and are less affected by market noise. Ideal for long-term investors and those trading based on trends.
Disadvantages: Fewer signals, which may be less frequent but more reliable. Requires longer confirmation times.
Recommendation for Your Strategy:
For a strategy based on moving averages (MA) and generating long/short signals, the 5-minute and 15-minute timeframes might be suitable if:
You are a day trader and want to generate multiple signals per day.
You prefer quick responses to price changes and want to execute trades within a shorter timeframe.
For more stable signals and fewer false signals:
1-hour or 4-hour timeframes might be more appropriate.
Testing and Optimization:
Test Different Timeframes: See how your strategy performs on various timeframes to find the one that works best for you.
Adjust Parameters: Modify the lengths of the short and long SMAs, as well as the SL and TP levels, to fit the chosen timeframe.
How to Test:
Add the script to your chart on different timeframes on TradingView.
Observe the effectiveness and accuracy of the signals.
Adjust settings based on results and personal preferences.
Summary:
There isn’t a single “best” timeframe as it depends on your trading style and objectives. Start by testing on shorter timeframes if you are interested in day trading, and then explore how the strategy performs on longer timeframes for more stable signals.
Cari dalam skrip untuk "accuracy"
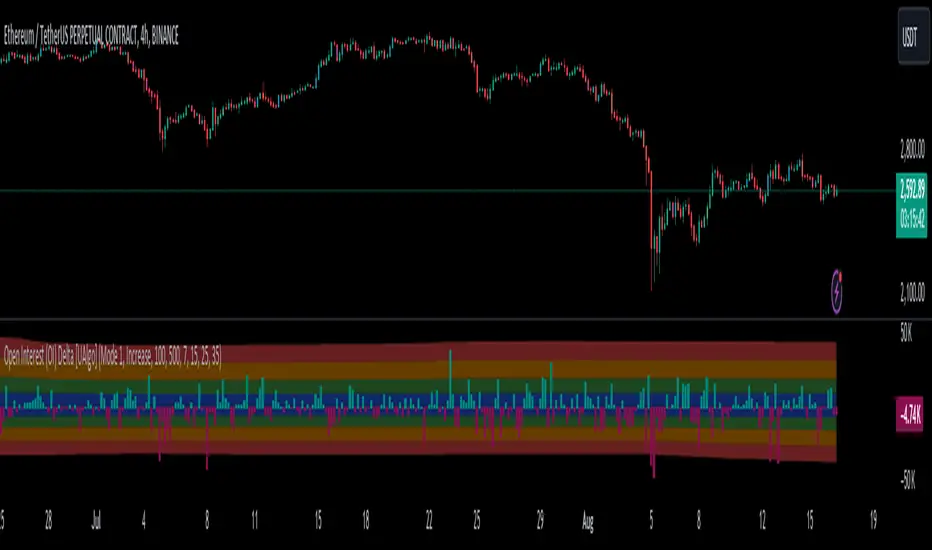
Volatility Trend Bands [UAlgo]The Volatility Trend Bands is a trend-following indicator that combines the concepts of volatility and trend detection. Built using the Average True Range (ATR) to measure volatility, this indicator dynamically adjusts upper and lower bands around price movements. The bands act as dynamic support and resistance levels, making it easier to identify trend shifts and potential entry and exit points.
With the ATR multiplier, this indicator effectively captures volatility-based shifts in the market. The use of midline values allows for accurate trend detection, which is displayed through color-coded signals on the chart. Additionally, this tool provides clear buy and sell signals, accompanied by intuitive graphical markers for ease of use.
The Volatility Trend Bands is ideal for traders seeking an adaptive trend-following method that responds to changing market conditions while maintaining robust volatility control.
🔶 Key Features
Dynamic Support and Resistance: The indicator utilizes volatility to create dynamic bands. The upper band acts as resistance, and the lower band acts as support for the price. Wider bands indicate higher volatility, while narrower bands indicate lower volatility.
Customizable Inputs
You can tailor the indicator to your strategy by adjusting the:
Price Source: Select the price data (e.g., closing price) used for calculations.
ATR Length: Define the lookback period for the Average True Range (ATR) volatility measure.
ATR Multiplier: This factor controls the width of the volatility bands relative to the ATR value.
Color Options: Choose colors for the bands and signal arrows for better visualization.
Visual Signals: Arrows ("▲" for buy, "▼" for sell) appear on the chart when the trend changes, providing clear entry point indications.
Alerts: Integrated alerts for both buy and sell conditions, allowing you to receive notifications for potential trade opportunities.
🔶 Interpreting Indicator
Upper and Lower Bands: The upper and lower bands are dynamic, adjusting based on market volatility using the ATR. These bands serve as adaptive support and resistance levels. When price breaks above the upper band, it indicates a potential bullish breakout, signaling a strong uptrend. Conversely, a break below the lower band signals a bearish breakout, indicating a downtrend.
Buy/Sell Signals: The indicator provides clear buy and sell signals at breakout points. A buy signal ("▲") is generated when the price breaks above the upper band, suggesting the start of a bullish trend. A sell signal ("▼") is triggered when the price breaks below the lower band, indicating the beginning of a bearish trend. These signals help traders identify potential entry and exit points at key breakout levels.
Color-Coded Bars: The bars on the chart change color based on the trend direction. Teal bars represent bullish momentum, while purple bars signify bearish momentum. This color coding provides a quick visual cue about the market's current direction.
🔶 Disclaimer
Use with Caution: This indicator is provided for educational and informational purposes only and should not be considered as financial advice. Users should exercise caution and perform their own analysis before making trading decisions based on the indicator's signals.
Not Financial Advice: The information provided by this indicator does not constitute financial advice, and the creator (UAlgo) shall not be held responsible for any trading losses incurred as a result of using this indicator.
Backtesting Recommended: Traders are encouraged to backtest the indicator thoroughly on historical data before using it in live trading to assess its performance and suitability for their trading strategies.
Risk Management: Trading involves inherent risks, and users should implement proper risk management strategies, including but not limited to stop-loss orders and position sizing, to mitigate potential losses.
No Guarantees: The accuracy and reliability of the indicator's signals cannot be guaranteed, as they are based on historical price data and past performance may not be indicative of future results.

buysellsignal-yashgode9The "buysellsignal-yashgode9" indicator utilizes a signal library to generate buy and sell signals based on price action, allowing traders to make informed decisions in their trading strategies.
Overview of the Indicator
The "buysellsignal-yashgode9" indicator is a technical analysis tool that identifies potential buying and selling points in the market. It does this by leveraging a signal library imported from `yashgode9/signalLib/2`, which contains predefined algorithms for analyzing market trends based on specified parameters.
Key Features
1.Input Parameters: The indicator allows users to customize several parameters:
- Depth: Determines the number of bars to look back for price analysis (default is 150).
- Deviation: Sets the threshold for price movement (default is 120).
- Backstep: Defines how many bars to step back when evaluating signals (default is 100).
- Label Transparency: Adjusts the transparency of labels displayed on the chart.
- Color Customization: Users can specify colors for buy and sell signals.
2.Signal Generation: The core functionality is driven by the `signalLib.signalLib` function, which analyzes the low and high prices over the specified depth and deviation. It returns a direction indicator along with price points (`zee1` and `zee2`) that are used to determine whether to issue a buy or sell signal.
3. Labeling and Visualization:
- The indicator creates labels on the chart to indicate buy and sell points based on the direction of the signal.
- Labels are color-coded according to user-defined settings, enhancing visual clarity.
- The indicator also manages the deletion of previous labels and lines to avoid clutter on the chart.
4. Repainting Logic: The script includes a repainting option, allowing it to update signals in real-time as new price data comes in. This can be beneficial for traders who want to see the most current signals but may also lead to misleading signals if not used cautiously.
Conclusion:-
The "buysellsignal-yashgode9" indicator is a versatile tool for traders looking to enhance their decision-making process by identifying key market entry and exit points. By allowing customization of parameters and colors, it caters to individual trading preferences while providing clear visual signals based on price action analysis. This indicator is particularly useful for those who rely on technical analysis in their trading strategies, as it combines automated signal generation with user-friendly visual cues.
Benefits and Applications:
1.Intraday Trading: The "buysellsignal-yashgode9" indicator is particularly well-suited for intraday trading, as it provides accurate and timely buy and sell signals based on the current market dynamics.
2.Trend-following Strategies: Traders who employ trend-following strategies can leverage the indicator's ability to identify the overall market direction, allowing them to align their trades with the dominant trend.
3.Swing Trading: The dynamic price tracking and signal generation capabilities of the indicator can be beneficial for swing traders, who aim to capture medium-term price movements.
Security Measures:
1. The code includes a security notice at the beginning, indicating that it is subject to the Mozilla Public License 2.0, which is a reputable open-source license.
2. The code does not appear to contain any obvious security vulnerabilities or malicious content that could compromise user data or accounts.
NOTE:- This indicator is provided under the Mozilla Public License 2.0 and is subject to its terms and conditions.
Disclaimer: The usage of "buysellsignal-yashgode9" indicator might or might not contribute to your trading capital(money) profits and losses and the author is not responsible for the same.
IMPORTANT NOTICE:
While the indicator aims to provide reliable buy and sell signals, it is crucial to understand that the market can be influenced by unpredictable events, such as natural disasters, political unrest, changes in monetary policies, or economic crises. These unforeseen situations may occasionally lead to false signals generated by the "buysellsignal-yashgode9" indicator.
Users should exercise caution and diligence when relying on the indicator's signals, as the market's behavior can be unpredictable, and external factors may impact the accuracy of the signals. It is recommended to thoroughly backtest the indicator's performance in various market conditions and to use it as one of the many tools in a comprehensive trading strategy, rather than solely relying on its output.
Ultimately, the success of the "buysellsignal-yashgode9" indicator will depend on the user's ability to adapt it to their specific trading style, market conditions, and risk management approach. Continuous monitoring, analysis, and adjustment of the indicator's settings may be necessary to maintain its effectiveness in the ever-evolving financial markets.
Author:- yashgode9
PineScript-version:- 5
This indicator aims to enhance trading decision-making by combining DEPTH, DEVIATION, BACKSTEP with custom signal generation, offering a comprehensive tool for traders seeking clear buy and sell signals on the TradingView platform.

Adaptive RSI-Stoch with Butterworth Filter [UAlgo]The Adaptive RSI-Stoch with Butterworth Filter is a technical indicator designed to combine the strengths of the Relative Strength Index (RSI), Stochastic Oscillator, and a Butterworth Filter to provide a smooth and adaptive momentum-based trading signal. This custom-built indicator leverages the RSI to measure market momentum, applies Stochastic calculations for overbought/oversold conditions, and incorporates a Butterworth Filter to reduce noise and smooth out price movements for enhanced signal reliability.
By utilizing these combined methods, this indicator aims to help traders identify potential market reversal points, momentum shifts, and overbought/oversold conditions with greater precision, while minimizing false signals in volatile markets.
🔶 Key Features
Adaptive RSI and Stochastic Oscillator: Calculates RSI using a configurable period and applies a dual-smoothing mechanism with Stochastic Oscillator values (K and D lines).
Helps in identifying momentum strength and potential trend reversals.
Butterworth Filter: An advanced signal processing filter that reduces noise and smooths out the indicator values for better trend identification.
The filter can be enabled or disabled based on user preferences.
Customizable Parameters: Flexibility to adjust the length of RSI, the smoothing factors for Stochastic (K and D values), and the Butterworth Filter period.
🔶 Interpreting the Indicator
RSI & Stochastic Calculations:
The RSI is calculated based on the closing price over the user-defined period, and further smoothed to generate Stochastic Oscillator values.
The K and D values of the Stochastic Oscillator provide insights into short-term overbought or oversold conditions.
Butterworth Filter Application:
What is Butterworth Filter and How It Works?
The Butterworth Filter is a type of signal processing filter that is designed to have a maximally flat frequency response in the passband, meaning it doesn’t distort the frequency components of the signal within the desired range. It is widely used in digital signal processing and technical analysis to smooth noisy data while preserving the important trends in the underlying data. In this indicator, the Butterworth Filter is applied to the trigger value, making the resulting signal smoother and more stable by filtering out short-term fluctuations or noise in price data.
Key Concepts Behind the Butterworth Filter:
Filter Design: The Butterworth filter works by calculating weighted averages of current and past inputs (price or indicator values) and outputs to produce a smooth output. It is characterized by the absence of ripple in the passband and a smooth roll-off after the cutoff frequency.
Cutoff Frequency: The period specified in the indicator acts as a control for the cutoff frequency. A higher period means the filter will remove more high-frequency noise and retain longer-term trends, while a lower period means it will respond more to short-term fluctuations in the data.
Smoothing Process: In this script, the Butterworth Filter is calculated recursively using the following formula,
butterworth_filter(series float input, int period) =>
float wc = math.tan(math.pi / period)
float k1 = 1.414 * wc
float k2 = wc * wc
float a0 = k2 / (1 + k1 + k2)
float a1 = 2 * a0
float a2 = a0
float b1 = 2 * (k2 - 1) / (1 + k1 + k2)
float b2 = (1 - k1 + k2) / (1 + k1 + k2)
wc: This is the angular frequency, derived from the period input.
k1 and k2: These are intermediate coefficients used in the filter calculation.
a0, a1, a2: These are the feedforward coefficients, which determine how much of the current and past input values will contribute to the filtered output.
b1, b2: These are feedback coefficients, which determine how much of the past output values will contribute to the current output, effectively allowing the filter to "remember" past behavior and smooth the signal.
Recursive Calculation: The filter operates by taking into account not only the current input value but also the previous two input values and the previous two output values. This recursive nature helps it smooth the signal by blending the recent past data with the current data.
float filtered_value = a0 * input + a1 * prev_input1 + a2 * prev_input2
filtered_value -= b1 * prev_output1 + b2 * prev_output2
input: The current input value, which could be the trigger value in this case.
prev_input1, prev_input2: The previous two input values.
prev_output1, prev_output2: The previous two output values.
This means the current filtered value is determined by the combination of:
A weighted sum of the current input and the last two inputs.
A correction based on the last two output values to ensure smoothness and remove noise.
In conclusion when filter is enabled, the Butterworth Filter smooths the RSI and Stochastic values to reduce market noise and highlight significant momentum shifts.
The filtered trigger value (post-Butterworth) provides a cleaner representation of the market's momentum.
Cross Signals for Trade Entries:
Buy Signal: A bullish crossover of the K value above the D value, particularly when the values are below 40 and when the Stochastic trigger is below 1 and the filtered trigger is below 35.
Sell Signal: A bearish crossunder of the K value below the D value, particularly when the values are above 60 and when the Stochastic trigger is above 99 and the filtered trigger is above 90.
These signals are plotted visually on the chart for easy identification of potential trading opportunities.
Overbought and Oversold Zones:
The indicator highlights the overbought zone when the filtered trigger surpasses a specific threshold (typically above 100) and the oversold zone when it drops below 0.
The color-coded fill areas between the Stochastic and trigger lines help visualize when the market may be overbought (likely a reversal down) or oversold (potential reversal up).
🔶 Disclaimer
Use with Caution: This indicator is provided for educational and informational purposes only and should not be considered as financial advice. Users should exercise caution and perform their own analysis before making trading decisions based on the indicator's signals.
Not Financial Advice: The information provided by this indicator does not constitute financial advice, and the creator (UAlgo) shall not be held responsible for any trading losses incurred as a result of using this indicator.
Backtesting Recommended: Traders are encouraged to backtest the indicator thoroughly on historical data before using it in live trading to assess its performance and suitability for their trading strategies.
Risk Management: Trading involves inherent risks, and users should implement proper risk management strategies, including but not limited to stop-loss orders and position sizing, to mitigate potential losses.
No Guarantees: The accuracy and reliability of the indicator's signals cannot be guaranteed, as they are based on historical price data and past performance may not be indicative of future results.

Solar System in 3D [Astro Tool w/ Zodiac]Hello Traders and Developers,
I am excited to announce my latest Open Source indicator. At the core, this is a demonstration of PineScript’s capabilities in Rendering 3D Animations, while at the same time being a practical tool for Financial Astrologists.
This 3D Engine dynamically renders all the major celestial bodies with their individual orbits, rotation speeds, polar inclinations and astrological aspects, all while maintaining accurate spatial relationships and perspective.
This is a Geocentric model of the solar system (viewed from the perspective of Earth), since that is what most Astrologists use. Thanks to the AstroLib Library created by @BarefootJoey, this model uses the real coordinates of cosmic bodies for every timestamp.
This script truly comes to life when using the “Bar Replay” mode in TradingView, as you can observe the relationships between planets and price action as time progresses, with the full animation capabilities as mentioned above.
In addition to what I have described, this indicator also displays the orbital trajectories for each cosmic body, and has labels for everything. I have also added the ability to hover on all the labels, and see a short description of what they imply in Astrology.
Optional Planetary Aspect Computation
This indicator supports all the Major Planetary Aspects, with an accuracy defined by the user (1° by default).
Conjunction: 0° Alignment. This draws a RED line starting from the center, and going through both planets.
Sextile: 60° Alignment. This draws three YELLOW lines, connecting the planets to each other and to the center.
Square: 90° Alignment. This draws three BLUE lines, connecting the planets to each other and to the center.
Trine: 120° Alignment. This draws three PURPLE lines, connecting the planets to each other and to the center.
Opposition: 180° Alignment. This draws a GREEN line starting from one planet, passing through the center and ending on the second planet.
The below image depicts a Top-Down view of the system, with the Moon in Opposition to Venus and with Mars in Square with Neptune .
Retrograde Computation
This indicator also displays when a planet enters Retrograde (Apparent Backward Motion) by making its orbital trajectory dashed and the planet name getting a red background.
The image below displays an example of Jupiter, Saturn, Neptune and Pluto in Retrograde Motion, from the camera perspective of a 65 degree inclination.
Optional Zodiac Computation (Tropical and Sidereal)
Zodiac represents the relatively stationary star formations that rest along the ecliptic plane, with planets transitioning from one to the next, each with a 30° separation (making 12 in total). I have implemented the option to switch between Tropical mode (where these stars were 2,000 years ago) and Sidereal (where these stars are today).
The image below displays the Zodiac labels with clear lines denoting where each planet falls into.
While this indicator is deployed in a separate pane, it is trivial to transfer it onto your price chart, just by clicking and dragging the graphics. After that, you can adjust the visuals by dragging the scale on the side, or optimizing model settings. You can also drag the model above or below the price, as shown in the following image:
Of course, there are a lot of options to customize this planetary model to your tastes and analytical needs. Aside from visual changes for the labels, colors or resolution you can also disable certain planets that don’t meet your needs as shown below:
Once can also infer the current lunar phases using the Aspects between the Sun and Moon. When the Moon is Opposite the Sun that is a Full Moon, while when they are Conjunct that is a New Moon (and sometimes Eclipse).
—---------------------------------------------------------------------------
I have made this indicator open source to help PineScript programmers understand how to approach 3D graphics rendering, enabling them to develop ever more capable scripts and continuously push the boundaries of what's possible on TradingView.
The code is well documented with comments and has a clear naming convention for functions and variables, to aid developers understand how everything operates.
For financial astrologists, this indicator offers a new way to visualize and correlate planetary movements, adding depth and ease to astrological market analysis.
Regards,
Hawk

Dema AFR | viResearchDema AFR | viResearch
Conceptual Foundation and Innovation
The "Dema AFR" indicator combines the Double Exponential Moving Average (DEMA) with an Average True Range (ATR)-based adaptive factor to create a responsive and adaptable trend-following system. The DEMA is known for its ability to smooth price data while reducing lag, making it highly effective for trend detection. By incorporating the ATR as a volatility factor, this indicator adapts dynamically to market conditions, allowing traders to capture trends while accounting for changes in volatility. The result is the Adaptive Factor Range (AFR), which provides clear signals for potential trend shifts and helps manage risk through its adaptive nature. This combination of DEMA smoothing and an ATR-based factor enables traders to follow trends more effectively while maintaining sensitivity to changing market conditions.
Technical Composition and Calculation
The "Dema AFR" script consists of two main components: the Double Exponential Moving Average (DEMA) and the Adaptive Factor Range (AFR). The DEMA is calculated over a user-defined length, smoothing out price fluctuations while reducing lag compared to traditional moving averages. The ATR is used to create a dynamic factor that adjusts the AFR based on market volatility. The factor is calculated by multiplying the ATR by a user-defined factor value, which scales the ATR to define upper and lower bounds for the AFR. The Adaptive Factor Range is derived from the DEMA, with upper and lower bounds set by adding or subtracting the ATR-based factor from the DEMA. When the price moves outside these bounds, the AFR is adjusted, and signals are generated. If the lower bound is exceeded, the AFR adjusts upward, while exceeding the upper bound causes the AFR to adjust downward. This dynamic adjustment helps the indicator stay responsive to market movements.
Features and User Inputs
The "Dema AFR" script provides several customizable inputs, allowing traders to tailor the indicator to their strategies. The DEMA Length controls the smoothing period for the DEMA, while the ATR Period defines the window for calculating the Average True Range. The ATR Factor determines the scale of the adaptive factor, controlling how much the AFR adjusts to volatility. Additionally, customizable bar colors and alert conditions allow traders to visualize the trend direction and receive notifications when key trend shifts occur.
Practical Applications
The "Dema AFR" indicator is designed for traders who want to capture trends while adapting to market volatility. The adaptive nature of the AFR makes it responsive to trend changes, providing early signals of potential trend reversals as the AFR adjusts to market movements. By incorporating ATR into the AFR calculation, the indicator adjusts to changing volatility, helping traders manage risk by staying aligned with market conditions. The AFR also helps confirm whether a price move is supported by momentum, improving the accuracy of trade entries and exits.
Advantages and Strategic Value
The "Dema AFR" script offers a significant advantage by combining the smoothness of the DEMA with the adaptability of the ATR-based factor. This dynamic combination allows the indicator to adjust to market conditions, providing more reliable trend signals in both trending and volatile markets. The adaptive nature of the AFR reduces the risk of false signals and helps traders stay on the right side of the trend while managing risk through volatility-adjusted ranges.
Alerts and Visual Cues
The script includes alert conditions that notify traders of key trend changes. The "Dema AFR Long" alert is triggered when the AFR indicates a potential upward trend, while the "Dema AFR Short" alert signals a potential downward trend. Visual cues such as color changes in the bar chart help traders quickly identify shifts in trend direction, allowing them to make informed decisions in real time.
Summary and Usage Tips
The "Dema AFR | viResearch" indicator provides traders with a powerful tool for trend analysis by combining DEMA smoothing with an ATR-based adaptive factor. This script helps traders stay aligned with trends while accounting for market volatility, improving their ability to detect trend reversals and manage risk. By incorporating this indicator into your trading strategy, you can make more informed decisions, whether in trending or volatile market environments. The "Dema AFR" offers a reliable and flexible solution for traders at all levels.
Note: Backtests are based on past results and are not indicative of future performance.

Hull For Loop | viResearchHull For Loop | viResearch
Conceptual Foundation and Innovation
The "Hull For Loop" indicator brings together the smoothness and responsiveness of the Hull Moving Average (HMA) with a dynamic loop-based scoring system. The HMA is known for its ability to reduce lag while maintaining smooth trend representation, making it a popular choice for traders looking for a responsive and reliable moving average. By incorporating a for loop system that compares current and past HMA values over a user-defined range, the "Hull For Loop" script generates a score that allows traders to detect potential trend changes and assess the strength of ongoing trends. This combination of the HMA and a loop-based evaluation system provides traders with a powerful tool for understanding market momentum and making informed trading decisions.
Technical Composition and Calculation
The "Hull For Loop" script consists of two key elements: the Hull Moving Average (HMA) and the For Loop Scoring System. The HMA is calculated using a weighted moving average (WMA) of the price data, adjusted to reduce lag and provide a smoother trend line. The for loop compares the current HMA to past values over a customizable range, generating a score based on whether the current HMA is higher or lower than previous values.
For the Hull Moving Average, the calculation involves applying a WMA to the source price over the selected length. The result is then used in a secondary WMA calculation to further smooth the output and reduce lag. The For Loop Scoring System evaluates the HMA over a defined range (from and to) by adding or subtracting from the score depending on whether the current HMA is higher or lower than past values. This final score reflects the overall trend strength and direction.
Features and User Inputs
The "Hull For Loop" script offers several customizable inputs, allowing traders to tailor the indicator to their strategies. The Hull Length controls the period over which the HMA is calculated, affecting how quickly the indicator responds to price changes. The Loop Range (From and To) defines the range over which the for loop compares past HMA values, offering flexibility in assessing trend strength over different timeframes. Additionally, customizable thresholds allow traders to define when the score signals an uptrend or downtrend, providing control over the indicator's sensitivity to market conditions.
Practical Applications
The "Hull For Loop" indicator is designed for traders looking to capitalize on the smooth trend representation of the HMA while gaining insights into market momentum through a loop-based scoring system. This tool is particularly effective for identifying trend reversals, as the for loop scoring system provides early signals of potential trend reversals by comparing the current HMA to past values, giving traders an advantage in volatile markets. By analyzing the HMA across a range of past values, the indicator helps confirm whether trends are gaining or losing strength, improving trade entry and exit points. The customizable parameters allow traders to adjust the indicator to different market conditions, making it suitable for both short-term and long-term strategies.
Advantages and Strategic Value
The "Hull For Loop" script provides a significant advantage by combining the smoothness of the HMA with a dynamic scoring system. The HMA's ability to reduce lag while providing a clear trend signal makes it ideal for trend-following strategies, while the loop-based scoring system adds a layer of analysis that helps reduce false signals. This combination results in a reliable tool for identifying and confirming trends, allowing traders to adapt more effectively to changing market conditions.
Alerts and Visual Cues
The script includes alert conditions to notify traders of key trend changes. The "Hull For Loop Long" alert is triggered when the score crosses the upper threshold, signaling a potential upward trend. Conversely, the "Hull For Loop Short" alert signals a possible downward trend when the score crosses below the lower threshold. Visual cues, such as changes in the background color, highlight these trend shifts on the chart, helping traders quickly identify potential market reversals.
Summary and Usage Tips
The "Hull For Loop | viResearch" indicator offers traders a robust tool for trend analysis by combining the benefits of the Hull Moving Average with a dynamic loop-based scoring system. By incorporating this script into your trading strategy, you can improve your ability to detect and confirm trends with greater accuracy, reducing the impact of market noise. Whether you are focused on identifying early trend reversals or confirming ongoing trends, the "Hull For Loop" provides a reliable and customizable solution for traders of all levels.
Note: Backtests are based on past results and are not indicative of future performance.

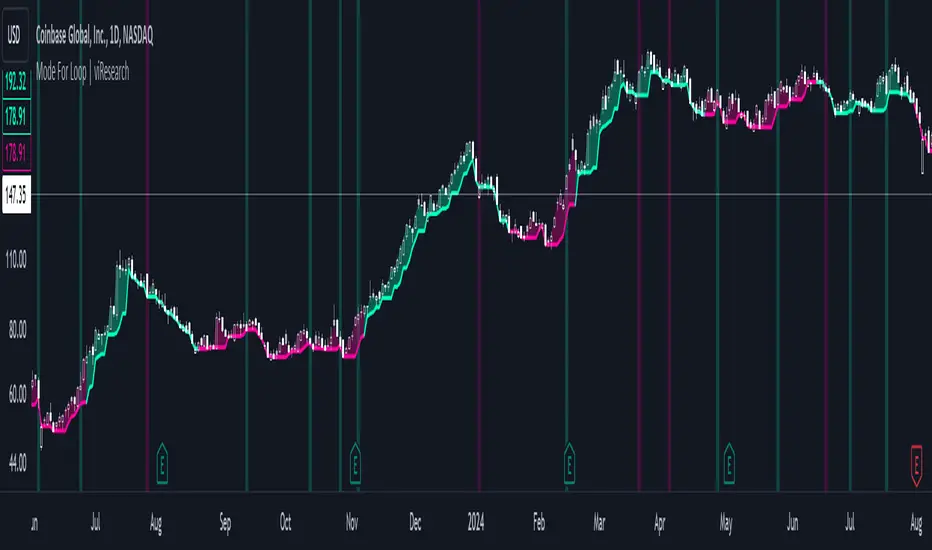
Mode For Loop | viResearchMode For Loop | viResearch
Conceptual Foundation and Innovation
The "Mode For Loop" indicator introduces a novel approach to market analysis by incorporating the mode calculation into a dynamic scoring system. The mode, which represents the most frequent price over a specified period, provides a robust measure of price centrality that can filter out random fluctuations and offer a clear picture of market trends. Combined with a loop-based evaluation system, this indicator generates a score that helps traders identify potential trend reversals and the strength of ongoing trends. By comparing the current mode with past values over a defined range, the "Mode For Loop" script offers traders a comprehensive tool for understanding market momentum and trend dynamics.
Technical Composition and Calculation
The "Mode For Loop" script consists of two key elements: Mode Calculation and the For Loop Scoring System. The mode represents the most frequent price point within a user-defined length. This value is calculated from the selected source price (e.g., close) and provides a smoothed central price that reflects market consensus over the period. The for loop compares the current mode to historical mode values over a customizable range. The score is calculated by evaluating whether the current mode is higher or lower than past values. A positive score indicates upward momentum, while a negative score suggests downward momentum.
For the Mode Calculation, the mode is determined using the ta.mode function, which identifies the most common price over the selected length. The loop iterates over the defined range (from and to), comparing the current mode to historical values. The score is updated by adding or subtracting based on whether the current mode is greater than or less than the past values, resulting in a total score that reflects the trend direction.
Features and User Inputs
The "Mode For Loop" script offers multiple customizable inputs, allowing traders to fine-tune the indicator to suit their strategies. The Mode Length defines the period over which the mode is calculated, controlling how the indicator smooths out price fluctuations and identifies central price trends. The Loop Range (From and To) allows users to set the range over which the mode is compared to previous values, offering flexibility in assessing trend strength over different time horizons. Customizable thresholds determine when the score signals an uptrend or downtrend, allowing traders to adjust the indicator’s sensitivity to market conditions.
Practical Applications
The "Mode For Loop" indicator is designed for traders who want to leverage the mode’s ability to filter out noise and focus on the most frequent price points. This tool can be particularly effective for detecting trend reversals, as the loop-based scoring system provides early signals of potential reversals by comparing the current mode with past values. This helps traders act before significant market shifts occur. The indicator also excels at confirming trend strength. By analyzing the mode across a range of past values, it offers a clearer view of the strength and sustainability of trends, improving trade entry and exit points. The customizable parameters enable traders to adapt the indicator to various market conditions, making it suitable for both short-term and long-term trading strategies.
Advantages and Strategic Value
The key advantage of the "Mode For Loop" script is its ability to provide a more stable and central measure of price trends using the mode calculation, while also applying a dynamic scoring system for enhanced trend detection. This combination offers traders a more reliable tool for reducing false signals and improving the accuracy of trend-following strategies. The mode’s focus on the most frequent price makes it a robust choice for understanding true market behavior, while the loop-based evaluation ensures that trends are analyzed comprehensively.
Alerts and Visual Cues
The script includes alert conditions to notify traders of key trend signals. The "Mode For Loop Long" alert signals a potential upward trend when the score exceeds the upper threshold, while the "Mode For Loop Short" alert indicates a possible downward trend when the score falls below the lower threshold. The indicator also includes visual cues, with background colors changing when the score crosses key levels, helping traders quickly identify potential shifts in market direction.
Summary and Usage Tips
The "Mode For Loop | viResearch" indicator offers a powerful combination of mode-based price smoothing and dynamic trend scoring, giving traders a detailed and responsive tool for trend analysis. By incorporating this script into your trading system, you can improve your ability to detect and confirm trends while minimizing the impact of market noise. Whether you're focused on capturing early trend reversals or confirming ongoing trends, this indicator provides a reliable and flexible solution.
Note: Backtests are based on past results and are not indicative of future performance.
Price Action Volumetric Order Blocks [UAlgo]"Price Action Volumetric Order Blocks" indicator aims to identify significant price zones in the market based on a combination of price action and volume analysis. It utilizes the concept of "Order Blocks," which are areas on the chart where large orders are believed to have been placed, influencing price behavior. By analyzing price swings and volume activity, the indicator attempts to highlight potential support and resistance levels.
🔶 Key Features
Swing Length: This input allows you to adjust the timeframe used to identify price swings for order block detection. A longer swing length will focus on larger timeframes and potentially capture stronger order blocks.
Show Last X Order Blocks: This controls the number of order blocks displayed on the chart. You can choose to visualize a specific number of the most recent order blocks.
Violation Check: This setting determines how the indicator identifies potential order block violations. You can choose between "Wick" or "Close" violations. A "Wick" violation occurs when the price (wick) extends beyond the order block boundaries, while a "Close" violation signifies that the closing price breaches the order block.
Hide Overlap: This option allows you to manage the display of overlapping order blocks. If set to "True," only non-overlapping order blocks will be shown, potentially offering a clearer visualization.
Colors: You can customize the color scheme for bullish (upward) and bearish (downward) order blocks to enhance visual clarity on the chart.
🔶 Interpreting the Indicator
Order Blocks: The teal-colored boxes represent bullish order blocks, indicating areas of demand where buying pressure is likely to be strong. Red-colored boxes represent bearish order blocks, indicating areas of supply where selling pressure is likely to be dominant. These zones often signal potential reversal points or consolidation areas.
Strength Calculations: The indicator calculates the relative strength of bullish and bearish blocks based on volume. A higher bullish strength indicates stronger buying pressure, while higher bearish strength suggests more selling pressure. Traders can use this information to gauge the strength of a price level and predict future price movements.
Market Structure Lines: The indicator displays horizontal lines to depict the current market structure, labeled as "MSB" (Market Sell Balance) or "BOS" (Break of Structure). These lines can help visualize the prevailing trend direction.
Order Block Violations: When a price wick or close breaches an order block (depending on the chosen violation type), the corresponding order block visualization is removed from the chart. This can signify a potential weakening of the identified support or resistance zone.
🔶 Disclaimer
Use with Caution: This indicator is provided for educational and informational purposes only and should not be considered as financial advice. Users should exercise caution and perform their own analysis before making trading decisions based on the indicator's signals.
Not Financial Advice: The information provided by this indicator does not constitute financial advice, and the creator (UAlgo) shall not be held responsible for any trading losses incurred as a result of using this indicator.
Backtesting Recommended: Traders are encouraged to backtest the indicator thoroughly on historical data before using it in live trading to assess its performance and suitability for their trading strategies.
Risk Management: Trading involves inherent risks, and users should implement proper risk management strategies, including but not limited to stop-loss orders and position sizing, to mitigate potential losses.
No Guarantees: The accuracy and reliability of the indicator's signals cannot be guaranteed, as they are based on historical price data and past performance may not be indicative of future results.

Median Standard Deviation | viResearchMedian Standard Deviation | viResearch
The "Median Standard Deviation" indicator, developed by viResearch, introduces a unique combination of median smoothing and standard deviation to detect trends and volatility in market data. This tool provides traders with a stable and accurate measure of price trends by integrating median smoothing with a customized calculation of the standard deviation. This innovative approach allows for enhanced sensitivity to market fluctuations while filtering out short-term price noise.
Technical Composition and Calculation:
The "Median Standard Deviation" indicator incorporates median smoothing and dynamic standard deviation calculations to build upon traditional volatility measures.
Median Smoothing:
DEMA Calculation (len_dema): The script applies a Double Exponential Moving Average (DEMA) to smooth the price data over a user-defined period, reducing noise and helping traders focus on broader market trends.
Median Calculation (median_len): The smoothed DEMA data is further refined by calculating the 50th percentile (median) over a specified length, ensuring that the central tendency of price data is captured more accurately than with a simple moving average.
Volatility Measurement:
ATR Calculation (atr_len, atr_mul): The script incorporates the Average True Range (ATR) to measure market volatility. The user-defined ATR multiplier is applied to this value to calculate upper and lower trend bands around the median, providing a dynamic measure of potential price movement based on recent volatility.
Standard Deviation Analysis:
Standard Deviation Calculation (len_sd): The script calculates the standard deviation of the median over a user-defined length, providing another layer of volatility measurement. The upper and lower standard deviation bands (sdd, sdl) act as additional indicators of price extremes.
Trend Detection:
Trend Logic: The indicator uses the calculated bands to identify whether the price is moving within or outside the standard deviation and ATR bands. Crosses above or below these bands are used to signal potential uptrends or downtrends, offering traders a clear view of market direction.
Features and User Inputs:
The "Median Standard Deviation" script offers a variety of user inputs to customize the indicator to suit traders' styles and market conditions:
DEMA Length: Allows traders to adjust the sensitivity of the DEMA smoothing to control the amount of noise filtered from the price data.
Median Length: Users can define the length over which the median price is calculated, providing flexibility in capturing short-term or long-term trends.
ATR Length and Multiplier: These inputs let traders fine-tune the ATR calculation, affecting the size of the dynamic upper and lower bands.
Standard Deviation Length: Controls how the standard deviation is calculated, allowing for further customization in detecting price volatility.
Practical Applications:
The "Median Standard Deviation" indicator is particularly effective in volatile markets where price swings can lead to false signals using traditional methods. By combining median smoothing and standard deviation, this tool provides a more robust analysis of trends and price movements.
Key Uses:
Trend Following: The upper and lower bands provide clear signals for entering and exiting trades based on whether the price is moving outside the calculated ranges.
Volatility Detection: The integration of ATR and standard deviation bands allows traders to assess market volatility in real time, enabling more informed trading decisions.
Noise Reduction: The use of median smoothing ensures that short-term price fluctuations do not interfere with broader trend analysis, making this indicator ideal for traders looking to avoid whipsaws in volatile markets.
Advantages and Strategic Value:
The "Median Standard Deviation" indicator offers several key advantages:
Precision in Trend Detection: The combination of median smoothing and standard deviation allows traders to detect trends with greater accuracy, reducing the risk of false signals.
Customization: With several adjustable parameters, traders can fine-tune the indicator to suit different timeframes and trading strategies.
Volatility Sensitivity: By incorporating ATR and standard deviation, this indicator provides an adaptive measure of market volatility, ensuring that traders are always aware of potential price swings.
Summary and Usage Tips:
The "Median Standard Deviation" indicator is a powerful tool for traders looking to refine their analysis of market trends and volatility. Its combination of median smoothing and standard deviation provides a nuanced view of market movements, helping traders make better-informed decisions. It's recommended to experiment with the various input parameters to optimize the indicator for specific needs, whether used for trend detection, volatility analysis, or noise reduction. The "Median Standard Deviation" offers a reliable and adaptable solution for modern trading strategies.
Please keep in mind the following text: Backtests are based on past results and are not indicative of future performance.

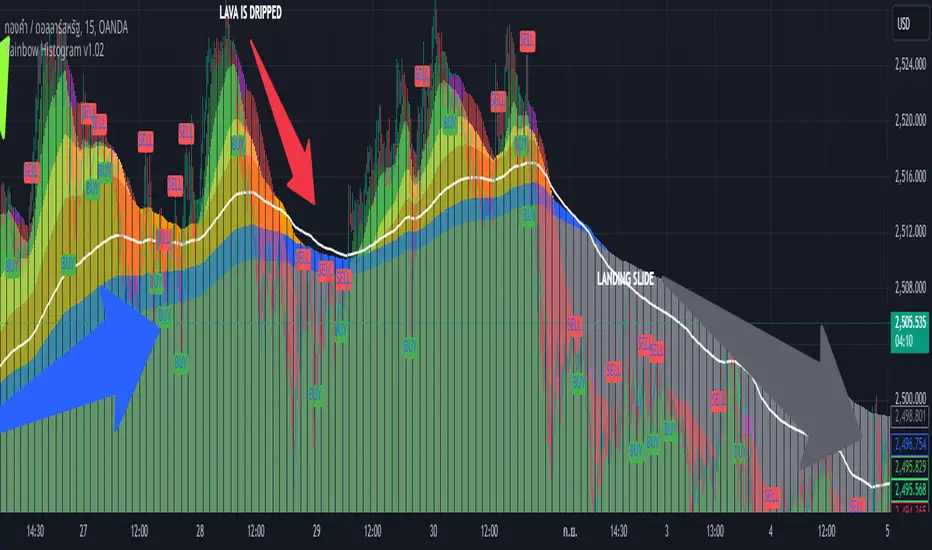
Rainbow Histogram v1.01Sure! Here’s a compelling English version of the article for your TradingView post:
---
### 🌈 **Introducing Rainbow Histogram: A Fusion of EMA and MA for Enhanced Trading Analysis**
**Hello Traders,**
I’m excited to introduce a fresh concept that combines technical analysis techniques into a new indicator called **Rainbow Histogram**. This innovative tool blends Exponential Moving Averages (EMA) and Moving Averages (MA) to provide you with a powerful and accurate tool for making trading decisions.
#### **🎨 What is Rainbow Histogram?**
The Rainbow Histogram is designed to help you identify market trends and signal precise entry and exit points by blending EMA and MA into a colorful "Rainbow" display. This visual approach enhances your ability to spot trend strength and direction with clarity.
#### **📈 How Does Rainbow Histogram Work?**
1. **Exponential Moving Average (EMA):** Captures short-term trends and reacts quickly to price changes.
2. **Moving Average (MA):** Tracks long-term trends and provides a broader view of the market direction.
**Rainbow Histogram** uses the combination of EMA and MA to create a histogram that shows the difference between these two averages in distinct colors. This makes it easy to visualize trend changes and market momentum.
#### **🔧 Setting It Up**
1. **EMA:** Adjust the EMA settings based on your trading timeframe and strategy (e.g., EMA 9, EMA 21).
2. **MA:** Set the MA parameters to capture long-term trends (e.g., MA 50, MA 200).
#### **🌟 Why Use Rainbow Histogram?**
- **Simplified Analysis:** Quickly identify trends and their strength with a clear visual representation.
- **Distinct Colors:** Differentiate between EMA and MA with vibrant colors for easy interpretation.
- **Precise Signals:** Get clear buy and sell signals based on histogram changes.
#### **📥 Get Started**
Add **Rainbow Histogram** to your TradingView charts by searching for the script in TradingView’s library or set it up manually using the recommended settings.
#### **📝 In Summary**
**Rainbow Histogram** is a unique tool that simplifies trend analysis and enhances accuracy by merging EMA and MA into a single, colorful indicator. Use this tool to refine your trading strategy and make more informed financial decisions.
If you have any questions or feedback about **Rainbow Histogram**, feel free to comment below or send me a message!
**Happy Trading!** 🌟
---
I hope this version effectively captures attention and engages your audience!
Uptrick: Dual Moving Average Volume Oscillator
Title: Uptrick: Dual Moving Average Volume Oscillator (DPVO)
### Overview
The "Uptrick: Dual Moving Average Volume Oscillator" (DPVO) is an advanced trading tool designed to enhance market analysis by integrating volume data with price action. This indicator is specially developed to provide traders with deeper insights into market dynamics, making it easier to spot potential entry and exit points based on volume and price interactions. The DPVO stands out by offering a sophisticated approach to traditional volume analysis, setting it apart from typical volume indicators available on the TradingView platform.
### Unique Features
Unlike traditional indicators that analyze volume and price movements separately, the DPVO combines these two critical elements to offer a comprehensive view of market behavior. By calculating the Volume Impact, which involves the product of the exponential moving averages (EMAs) of volume and the price range (close - open), this indicator highlights significant trading activities that could indicate strong buying or selling pressure. This method allows traders to see not just the volume spikes, but how those spikes relate to price movements, providing a clearer picture of market sentiment.
### Customization and Inputs
The DPVO is highly customizable, catering to various trading styles and strategies:
- **Oscillator Length (`oscLength`)**: Adjusts the period over which the volume and price difference is analyzed, allowing traders to set it according to their trading timeframe.
- **Fast and Slow Moving Averages (`fastMA` and `slowMA`)**: These parameters control the responsiveness of the DPVO. A shorter `fastMA` coupled with a longer `slowMA` can help in identifying trends quicker or smoothing out market noise for more conservative approaches.
- **Signal Smoothing (`signalSmooth`)**: This input helps in reducing signal noise, making the crossover and crossunder points between the DVO and its smoothed signal line clearer and easier to interpret.
### Functionality Details
The DPVO operates through a sequence of calculated steps that integrate volume data with price movement:
1. **Volume Impact Calculation**: This is the foundational step where the product of the EMA of volume and the EMA of price range (close - open) is calculated. This metric highlights trading sessions where significant volume accompanies substantial price movements, suggesting a strong market response.
2. **Dynamic Volume Oscillator (DVO)**: The heart of the indicator, the DVO, is derived by calculating the difference between the fast EMA and the slow EMA of the Volume Impact. This result is then normalized by dividing by the EMA of the volume over the same period to scale the output, making it consistent across various trading environments.
3. **Signal Generation**: The final output is smoothed using a simple moving average of the DVO to filter out market noise. Buy and sell signals are generated based on the crossover and crossunder of the DVO with its smoothed version, providing clear cues for market entry or exit.
### Originality
The DPVO's originality lies in its innovative integration of volume and price movement, a novel approach not typically observed in other volume indicators. By analyzing the product of volume and price change EMAs, the DPVO captures the essence of market dynamics more holistically than traditional tools, which often only reflect volume levels without contextualizing them with price actions. This dual analysis provides traders with a deeper understanding of market forces, enabling them to make more informed decisions based on a combination of volume surges and significant price movements. The DPVO also introduces a unique normalization and smoothing technique that refines the oscillator's output, offering cleaner and more reliable signals that are adaptable to various market conditions and trading styles.
### Practical Application
The DPVO excels in environments where volume plays a crucial role in validating price movements. Traders can utilize the buy and sell signals generated by the DPVO to enhance their decision-making process. The signals are plotted directly on the trading chart, with buy signals appearing below the price bars and sell signals above, ensuring they are prominent and actionable. This setup is particularly useful for day traders and swing traders who rely on timely and accurate signals to maximize their trading opportunities.
### Best Practices
To maximize the effectiveness of the DPVO, traders should consider the following best practices:
- **Market Selection**: Use the DPVO in markets known for strong volume-price correlation such as major forex pairs, popular stocks, and cryptocurrencies.
- **Signal Confirmation**: While the DPVO provides powerful signals, confirming these signals with additional indicators such as RSI or MACD can increase trade reliability.
- **Risk Management**: Always use stop-loss orders to manage risks associated with trading signals. Adjust the position size based on the volatility of the asset to avoid significant losses.
### Practical Example + How to use it
Practical Example1: Day Trading Cryptocurrencies
For a day trader focusing on the highly volatile cryptocurrency market, the DPVO can be an effective tool on a 15-minute chart. Suppose a trader is monitoring Bitcoin (BTC) during a period of high market activity. The DPVO might show an upward crossover of the DVO above its smoothed signal line while also indicating a significant increase in volume. This could signal that strong buying pressure is entering the market, suggesting a potential short-term rally. The trader could enter a long position based on this signal, setting a stop-loss just below the recent support level to manage risk. If the DPVO later shows a crossover in the opposite direction with decreasing volume, it might signal a good exit point, allowing the trader to lock in profits before a potential pullback.
- **Swing Trading Stocks**: For a swing trader looking at stocks, the DPVO could be applied on a daily chart. If the oscillator shows a consistent downward trend along with increasing volume, this could suggest a potential sell-off, providing a sell signal before a significant downturn.
You can look for:
--> Increase in volume - You can use indicators like 24-hour-Volume to have a better visualization
--> Uptrend/Downtrend in the indicator (HH, HL, LL, LH)
--> Confirmation (Buy signal/Sell signal)
--> Correct Price action (Not too steep moves up or down. Stable moves.) (Optional)
--> Confirmation with other indicators (Optional)
Quick image showing you an example of a buy signal on SOLANA:
### Technical Notes
- **Calculation Efficiency**: The DPVO utilizes exponential moving averages (EMAs) in its calculations, which provides a balance between responsiveness and smoothing. EMAs are favored over simple moving averages in this context because they give more weight to recent data, making the indicator more sensitive to recent market changes.
- **Normalization**: The normalization of the DVO by the EMA of the volume ensures that the oscillator remains consistent across different assets and timeframes. This means the indicator can be used on a wide variety of markets without needing significant adjustments, making it a versatile tool for traders.
- **Signal Line Smoothing**: The final signal line is smoothed using a simple moving average (SMA) to reduce noise. The choice of SMA for smoothing, as opposed to EMA, is intentional to provide a more stable signal that is less prone to frequent whipsaws, which can occur in highly volatile markets.
- **Lag and Sensitivity**: Like all moving average-based indicators, the DPVO may introduce a slight lag in signal generation. However, this is offset by the indicator’s ability to filter out market noise, making it a reliable tool for identifying genuine trends and reversals. Adjusting the `fastMA`, `slowMA`, and `signalSmooth` inputs allows traders to fine-tune the sensitivity of the DPVO to match their specific trading strategy and market conditions.
- **Platform Compatibility**: The DPVO is written in Pine Script™ v5, ensuring compatibility with the latest features and functionalities offered by TradingView. This version takes advantage of optimized functions for performance and accuracy in calculations, making it well-suited for real-time analysis.
Conclusion
The "Uptrick: Dual Moving Average Volume Oscillator" is a revolutionary tool that merges volume analysis with price movement to offer traders a more nuanced understanding of market trends and reversals. Its ability to provide clear, actionable signals based on a unique combination of volume and price changes makes it an invaluable addition to any trader's toolkit. Whether you are managing long-term positions or looking for quick trades, the DPVO provides insights that can help refine any trading strategy, making it a standout choice in the crowded field of technical indicators.
Nothing from this indicator or any other Uptrick Indicators is financial advice. Only you are ultimately responsible for your choices.

Bat Harmonic Pattern [TradingFinder] Bat Chart Indicator🔵 Introduction
The Bat Harmonic Pattern, created by Scott Carney in the 1990s, is a sophisticated tool in technical analysis, used to identify potential reversal points in price movements by leveraging Fibonacci ratios.
This pattern is classified into two primary types: the Bullish Bat Pattern, which signals the end of a downtrend and the beginning of an uptrend, and the Bearish Bat Pattern, which indicates the conclusion of an uptrend and the onset of a downtrend.
🟣 Bullish Bat Pattern
The Bullish Bat Pattern is designed to identify when a downtrend is likely to end and a new uptrend is about to begin. The key feature of this pattern is Point D, which typically aligns near the 88.6% Fibonacci retracement of the XA leg.
This point is considered a strong buy zone. When the price reaches Point D after a significant downtrend, it often indicates a potential reversal, presenting a buying opportunity for traders anticipating the start of an upward movement.
🟣 Bearish Bat Pattern
In contrast, the Bearish Bat Pattern forms when an uptrend is nearing its conclusion. Point D, which also typically aligns near the 88.6% Fibonacci retracement of the XA leg, serves as a critical point for traders.
This point is regarded as a strong sell zone, signaling that the uptrend may be ending, and a downtrend could be imminent. Traders often open short positions when they identify this pattern, aiming to capitalize on the anticipated downward movement.
🔵 How to Use
The Bat Pattern consists of five key points: X, A, B, C, and D, and four waves: XA, AB, BC, and CD. Fibonacci ratios play a crucial role in this pattern, helping traders pinpoint precise entry and exit points. In both the Bullish and Bearish Bat Patterns, the 88.6% retracement of the XA leg is a critical level for identifying potential reversal points.
🟣 Bullish Bat Pattern
Traders typically enter buy positions after Point D forms, expecting the downtrend to end and a new uptrend to start. This point, located near the 88.6% retracement of the XA leg, serves as a reliable buy signal.
🟣 Bearish Bat Pattern
Traders usually open short positions after identifying Point D, expecting the uptrend to end and a downtrend to begin. This point, also near the 88.6% retracement of the XA leg, acts as a valid sell signal.
🟣 Trading Tips for the Bat Pattern
Accurate Fibonacci Point Identification : Accurately identify Points X, A, B, C, and D, and calculate the Fibonacci ratios between these points. Point D should ideally be near the 88.6% retracement of the XA leg.
Signal Confirmation with Other Tools : To enhance the pattern's accuracy, avoid trading solely based on the Bat Pattern.
Risk Management : Always use stop-loss orders. In a Bullish Bat Pattern, place the stop-loss below Point X, and in a Bearish Bat Pattern, above Point X. This helps limit potential losses if the pattern fails.
Wait for Price Movement Confirmation : After identifying Point D, wait for the price to move in the anticipated direction to confirm the pattern's validity before entering a trade.
Set Realistic Profit Targets : Use Fibonacci retracement levels to set realistic profit targets, such as 38.2%, 50%, and 61.8% retracement levels of the CD leg. This strategy helps maximize profits and prevents premature exits.
🔵 Setting
🟣 Logical Setting
ZigZag Pivot Period : You can adjust the period so that the harmonic patterns are adjusted according to the pivot period you want. This factor is the most important parameter in pattern recognition.
Show Valid Forma t: If this parameter is on "On" mode, only patterns will be displayed that they have exact format and no noise can be seen in them. If "Off" is, the patterns displayed that maybe are noisy and do not exactly correspond to the original pattern.
Show Formation Last Pivot Confirm : if Turned on, you can see this ability of patterns when their last pivot is formed. If this feature is off, it will see the patterns as soon as they are formed. The advantage of this option being clear is less formation of fielded patterns, and it is accompanied by the latest pattern seeing and a sharp reduction in reward to risk.
Period of Formation Last Pivot : Using this parameter you can determine that the last pivot is based on Pivot period.
🟣 Genaral Setting
Show : Enter "On" to display the template and "Off" to not display the template.
Color : Enter the desired color to draw the pattern in this parameter.
LineWidth : You can enter the number 1 or numbers higher than one to adjust the thickness of the drawing lines. This number must be an integer and increases with increasing thickness.
LabelSize : You can adjust the size of the labels by using the "size.auto", "size.tiny", "size.smal", "size.normal", "size.large" or "size.huge" entries.
🟣 Alert Setting
Alert : On / Off
Message Frequency : This string parameter defines the announcement frequency. Choices include: "All" (activates the alert every time the function is called), "Once Per Bar" (activates the alert only on the first call within the bar), and "Once Per Bar Close" (the alert is activated only by a call at the last script execution of the real-time bar upon closing). The default setting is "Once per Bar".
Show Alert Time by Time Zone : The date, hour, and minute you receive in alert messages can be based on any time zone you choose. For example, if you want New York time, you should enter "UTC-4". This input is set to the time zone "UTC" by default.
🔵 Conclusion
The Bat Harmonic Pattern is a powerful tool in technical analysis, offering traders the ability to identify critical reversal points using Fibonacci ratios. By recognizing the Bullish and Bearish Bat Patterns, traders can anticipate potential trend reversals and make informed trading decisions.
However, it is essential to combine the Bat Pattern with other technical analysis tools and confirm signals for better trading outcomes. With proper use, this pattern can help traders minimize risk and optimize their entry and exit points in the market.

Trend Signals with TP & SL [UAlgo] StrategyThe "Trend Signals with TP & SL Strategy" is a trading strategy designed to capture trend continuation signals while incorporating sophisticated risk management techniques. This strategy is tailored for traders who wish to capitalize on trending market conditions with precise entry and exit points, automatically calculating Take Profit (TP) and Stop Loss (SL) levels based on either Average True Range (ATR) or percentage values. The strategy aims to enhance trade management by preventing multiple simultaneous positions and dynamically adapting to changing market conditions.
This strategy is highly configurable, allowing traders to adjust sensitivity, the ATR calculation method, and the cloud moving average length. Additionally, the strategy can display buy and sell signals directly on the chart, along with visual representation of entry points, stop losses, and take profits. It also features a cloud-based trend analysis using a MACD-driven color fill that indicates the strength and direction of the trend.
🔶 Key Features
Configurable Trend Continuation Signals:
Source Selection: The strategy uses the midpoint of the high-low range as the default source, but it is adjustable.
Sensitivity: The sensitivity of the trend signals can be adjusted using a multiplier, ranging from 0.5 to 5.
ATR Calculation: The strategy allows users to choose between two ATR calculation methods for better adaptability to different market conditions.
Cloud Moving Average: Traders can adjust the cloud moving average length, which is used in conjunction with MACD to provide a visual trend indication.
Take Profit & Stop Loss Management:
ATR-Based or Percent-Based: The strategy offers flexibility in setting TP and SL levels, allowing traders to choose between ATR-based multipliers or fixed percentage values.
Dynamic Adjustment: TP and SL levels are dynamically adjusted according to the selected method, ensuring trades are managed based on real-time market conditions.
Prevention of Multiple Positions:
Single Position Control: To reduce risk and enhance strategy reliability, the strategy includes an option to prevent multiple positions from being opened simultaneously.
Visual Trade Indicators:
Buy/Sell Signals: Clearly displays buy and sell signals on the chart for easy interpretation.
Entry, SL, and TP Lines: Draws lines for entry price, stop loss, and take profit directly on the chart, helping traders to monitor trades visually.
Trend Cloud: A color-filled cloud based on MACD and the cloud moving average provides a visual cue of the trend’s direction and strength.
Performance Summary Table:
In-Chart Statistics: A table in the top right of the chart displays key performance metrics, including total trades, wins, losses, and win rate percentage, offering a quick overview of the strategy’s effectiveness.
🔶 Interpreting the Indicator
Trend Signals: The strategy identifies trend continuation signals based on price action relative to an ATR-based threshold. A buy signal is generated when the price crosses above a key level, indicating an uptrend. Conversely, a sell signal occurs when the price crosses below a level, signaling a downtrend.
Cloud Visualization: The cloud, derived from MACD and moving averages, changes color to reflect the current trend. A positive cloud in aqua suggests an uptrend, while a red cloud indicates a downtrend. The transparency of the cloud offers further nuance, with more solid colors denoting stronger trends.
Entry and Exit Management: Once a trend signal is generated, the strategy automatically sets TP and SL levels based on your chosen method (ATR or percentage). The stop loss and take profit lines will appear on the chart, showing where the strategy will exit the trade. If the price reaches either the SL or TP, the trade is closed, and the respective line is deleted from the chart.
Performance Metrics: The strategy’s performance is tracked in real-time with an in-chart table. This table provides essential information about the number of trades executed, the win/loss ratio, and the overall win rate. This information helps traders assess the strategy's effectiveness and make necessary adjustments.
This strategy is designed for those who seek to engage with trending markets, offering robust tools for entry, exit, and overall trade management. By understanding and leveraging these features, traders can potentially improve their trading outcomes and risk management.
🔷 Related Script
🔶 Disclaimer
Use with Caution: This indicator is provided for educational and informational purposes only and should not be considered as financial advice. Users should exercise caution and perform their own analysis before making trading decisions based on the indicator's signals.
Not Financial Advice: The information provided by this indicator does not constitute financial advice, and the creator (UAlgo) shall not be held responsible for any trading losses incurred as a result of using this indicator.
Backtesting Recommended: Traders are encouraged to backtest the indicator thoroughly on historical data before using it in live trading to assess its performance and suitability for their trading strategies.
Risk Management: Trading involves inherent risks, and users should implement proper risk management strategies, including but not limited to stop-loss orders and position sizing, to mitigate potential losses.
No Guarantees: The accuracy and reliability of the indicator's signals cannot be guaranteed, as they are based on historical price data and past performance may not be indicative of future results.

Breaker Blocks + Order Blocks confirm [TradingFinder] BBOB Alert🔵 Introduction
In the realm of technical analysis, various tools and concepts are employed to identify key levels on price charts. These tools assist traders in analyzing market trends with greater precision, enabling them to optimize their trading decisions. Among these tools, the Order Block and Breaker Block hold a significant place, serving as effective instruments for analyzing market structure.
🟣 Order Block
An Order Block refers to zones on a chart where large financial institutions and high-volume traders place their orders. Due to the substantial volume of buy or sell orders in these areas, they are often regarded as pivotal points for potential price reversals or temporary pauses in a trend. Order Blocks are particularly crucial when prices react to these zones after a strong market move, acting as strong support or resistance levels.
🟣 Breaker Block
On the other hand, a Breaker Block refers to areas on a chart that previously functioned as Order Blocks but where the price has managed to break through and continue in the opposite direction. These zones are typically recognized as key points where market trends might shift, helping traders identify potential reversal points in the market.
🟣 Overlapping Block (BBOB)
Now, imagine a scenario where these two essential concepts in technical analysis—Order Blocks and Breaker Blocks—overlap on a chart. Although this overlap is not specifically discussed within the ICT (Inner Circle Trader) trading framework, exploring and utilizing this overlap can provide traders with powerful insights into strong support and resistance zones. The combination of these two robust concepts can highlight critical areas in trading, potentially offering significant advantages in making informed trading decisions.
In this article, we will delve into the concept of this overlap, explaining how to utilize it in trading strategies. Additionally, we will analyze the potential outcomes and benefits of incorporating this concept into your trading decisions.
Bullish Overlapping Block (BBOB) :
Bearish Overlapping Block (BBOB) :
🔵 How to Use
The overlap between Order Blocks and Breaker Blocks is a compelling and powerful concept that can help traders identify key levels on the chart with a high probability of success. This overlap is particularly valuable because it combines two well-regarded concepts in technical analysis—zones of high order volume and critical market shifts.
🟣 Here’s how to effectively use this overlap in your trading
1. Dentifying the Overlapping Block : To make the most of the overlap between Order Blocks and Breaker Blocks, begin by identifying these zones separately. Order Blocks are areas where price typically reacts and reverses after a strong market move.
Breaker Blocks are areas where a previous Order Block has been breached, and the price continues in the opposite direction. When these two zones overlap on a chart, it’s crucial to pay close attention to this area, as it represents a high-probability reaction zone.
2. Analyzing the Overlapping Block : After identifying the overlap zone, carefully analyze price action within this region. Candlestick patterns and price behavior can provide essential clues.
If the price reaches this overlap zone and strong reversal patterns such as Pin Bars or Engulfing patterns are observed, it’s likely that this zone will act as a pivotal reversal point. In such cases, entering a trade with confidence becomes more feasible.
3. Entering the Trade : When sufficient signs of price reaction are present in the overlap zone, you can proceed to enter the trade. If the overlap zone is within an uptrend and bullish reversal signals are evident, a long position might be appropriate.
Conversely, if the overlap zone is in a downtrend and bearish reversal signals are observed, a short position would be more suitable.
4. Risk Management : One of the most critical aspects of trading in overlap zones is managing risk. To protect your capital, place your stop loss near the lowest point of the Order Block (for buy trades) or the highest point (for sell trades). This approach minimizes potential losses if the overlap zone fails to hold.
5. Price Targets : After entering the trade, set your price targets based on other key levels on the chart. These targets could include other support and resistance zones, Fibonacci levels, or pivot points.
Bullish Overlapping Block :
Bearish Overlapping Block :
🟣 Benefits of the Overlapping Block Between Order Block and Breaker Block
1. Enhanced Precision in Identifying Key Levels : The overlap between these two zones usually acts as a highly reliable area for price reactions, increasing the accuracy of identifying entry and exit points.
2. Reduced Trading Risk : Given the high importance of the overlap zone, the likelihood of making incorrect decisions is reduced, contributing to overall lower trading risk.
3. Increased Probability of Success : The overlap between Order Blocks and Breaker Blocks combines two powerful concepts, enhancing the likelihood of success in trades, as multiple indicators confirm the importance of the area.
4. Creation of Better Trading Opportunities : Overlap zones often provide traders with more robust trading opportunities, as these areas typically represent strong reversal points in the market.
5. Compatibility with Other Technical Tools : This concept seamlessly integrates with other technical analysis tools such as Fibonacci retracements, trend lines, and chart patterns, offering a more comprehensive market analysis.
🔵 Setting
🟣 Global Setting
Pivot Period of Order Blocks Detector : Enter the desired pivot period to identify the Order Block.
Order Block Validity Period (Bar) : You can specify the maximum time the Order Block remains valid based on the number of candles from the origin.
Mitigation Level Order Block : Determining the basic level of a Order Block. When the price hits the basic level, the Order Block due to mitigation.
Mitigation Level Breaker Block : Determining the basic level of a Breaker Block. When the price hits the basic level, the Breaker Block due to mitigation.
Mitigation Level Overlapping Block : Determining the basic level of a Overlapping Block. When the price hits the basic level, the Overlapping Block due to mitigation.
🟣 Overlapping Block Display
Show All Overlapping Block : If it is turned off, only the last Order Block will be displayed.
Demand Overlapping Block : Show or not show and specify color.
Supply Overlapping Block : Show or not show and specify color.
🟣 Order Block Display
Show All Order Block : If it is turned off, only the last Order Block will be displayed.
Demand Main Order Block : Show or not show and specify color.
Demand Sub (Propulsion & BoS Origin) Order Block : Show or not show and specify color.
Supply Main Order Block : Show or not show and specify color.
Supply Sub (Propulsion & BoS Origin) Order Block : Show or not show and specify color.
🟣 Breaker Block Display
Show All Breaker Block : If it is turned off, only the last Breaker Block will be displayed.
Demand Main Breaker Block : Show or not show and specify color.
Demand Sub (Propulsion & BoS Origin) Breaker Block : Show or not show and specify color.
Supply Main Breaker Block : Show or not show and specify color.
Supply Sub (Propulsion & BoS Origin) Breaker Block : Show or not show and specify color.
🟣 Order Block Refinement
Refine Order Blocks : Enable or disable the refinement feature. Mode selection.
🟣 Alert
Alert Name : The name of the alert you receive.
Alert Overlapping Block Mitigation :
On / Off
Message Frequency :
This string parameter defines the announcement frequency. Choices include: "All" (activates the alert every time the function is called), "Once Per Bar" (activates the alert only on the first call within the bar), and "Once Per Bar Close" (the alert is activated only by a call at the last script execution of the real-time bar upon closing). The default setting is "Once per Bar".
Show Alert Time by Time Zone :
The date, hour, and minute you receive in alert messages can be based on any time zone you choose. For example, if you want New York time, you should enter "UTC-4". This input is set to the time zone "UTC" by default.
🔵 Conclusion
The overlap between Order Blocks and Breaker Blocks represents a critical and powerful area in technical analysis that can serve as an effective tool for determining entry and exit points in trading.
These zones, due to the combination of two key concepts in technical analysis, hold significant importance and can help traders make more confident trading decisions.
Although this concept is not specifically discussed in the ICT framework and is introduced as a new idea, traders can achieve better results in their trades through practice and testing.
Utilizing the overlap between Order Blocks and Breaker Blocks, in conjunction with other technical analysis tools, can significantly improve the chances of success in trading.

ADV_RSIADV_RSI - Advanced Relative Strength Index
Description: The ADV_RSI indicator is an advanced and mutated version of the classic Relative Strength Index (RSI), enhanced with multiple moving averages and a dynamic color-coding system. It provides traders with deeper insights into market momentum and potential trend reversals by incorporating two different moving averages of the RSI (21, and 50 periods). The indicator helps to visualize overbought and oversold conditions more effectively and offers a clear, color-coded representation of the RSI value relative to key thresholds.
Features:
RSI Calculation: The core of the indicator is based on the traditional RSI, calculated over a customizable period.
Multiple Moving Averages: The script includes two RSI moving averages (21, and 50 periods) to help identify trend strength and potential reversal points.
Dynamic RSI Color Coding: The RSI line is color-coded based on its value, ranging from red for overbought conditions to aqua for oversold conditions. This makes it easier to interpret the market's momentum at a glance.
Threshold Bands: The indicator includes horizontal threshold lines at key RSI levels (20, 30, 40, 50, 60, 70, 80), with shaded areas between them, providing a visual aid to quickly identify overbought and oversold zones.
How to Use:
The RSI line fluctuates between 0 and 100, with traditional overbought and oversold levels set at 70 and 30, respectively.
When the RSI crosses above the 70 level, it may indicate overbought conditions, signaling a potential selling opportunity.
When the RSI falls below the 30 level, it may indicate oversold conditions, signaling a potential buying opportunity.
The included moving averages of the RSI can help confirm trend direction and potential reversals.
The color coding of the RSI line provides a quick visual cue for momentum changes.
Ideal For:
Traders looking for a more nuanced understanding of market momentum.
Those who prefer visual aids for quick decision-making in identifying overbought and oversold conditions.
Traders who utilize multiple timeframes and need a comprehensive RSI tool for better accuracy in their analysis.

MTF Candle Multi HubMTF Candle Multi Hub Indicator - Guide 日本語解説は下記
Introduction
The "MTF Candle Multi Hub" indicator is a versatile and comprehensive tool designed to visualize multiple timeframes' candlestick data, Heikin Ashi candles, and moving averages on a single chart. This indicator also includes a Zigzag feature with the ability to draw horizontal lines at significant swing points, making it a powerful tool for technical analysis.
Key Features
Multi-Timeframe Candlestick Display:
The indicator allows you to display candlesticks from different timeframes, including 5-minute, 15-minute, 1-hour, 4-hour, daily, and weekly timeframes.
Each timeframe's candlestick can be toggled on or off using the settings panel.
Candlesticks are color-coded based on whether the close is higher or lower than the open, with customizable colors for bullish and bearish candles.
Heikin Ashi Candlesticks:
Heikin Ashi candlesticks are also available for 5-minute, 15-minute, 1-hour, 4-hour, daily, and weekly timeframes.
Like the standard candlesticks, these can be toggled on or off, and their colors are customizable.
Moving Averages (MA):
The indicator supports up to four different moving averages, which can be either Simple Moving Average (SMA) or Exponential Moving Average (EMA).
The user can toggle each moving average on or off and adjust the period and type from the settings panel.
An additional feature allows the space between two moving averages to be filled with a color, indicating the relative position of the MAs.
Zigzag Indicator with Horizontal Lines:
The Zigzag feature plots lines between significant swing highs and lows, helping identify trends and potential reversal points.
Two Zigzag lines can be configured, each with customizable swing length, line color, style, and width.
The indicator also offers the ability to draw horizontal lines at the start and end of each Zigzag swing. These horizontal lines can be customized in terms of color, style, width, and length.
The number of horizontal lines to be drawn can be set, allowing for focused analysis of the most recent swings.
Label and Comment Display:
The indicator provides the option to display custom labels and comments on the chart.
You can enter up to ten different comments, which will be displayed in a label at the last candlestick of the chart.
The label's position, background color, text color, and text size are fully customizable.
Trading Strategy
Trend Following with Multi-Timeframe Analysis:
Use the multi-timeframe candlestick and Heikin Ashi features to assess the trend across different timeframes. For example, if both the daily and 4-hour Heikin Ashi candles are bullish, it may indicate a strong uptrend.
Entry and Exit Signals:
Use the Zigzag indicator to identify potential entry points by looking for a new swing high or low.
Horizontal lines from the Zigzag can be used as support and resistance levels, helping to determine potential entry and exit points.
Moving Average Crossovers:
Monitor the crossovers of the moving averages. For example, when a shorter-term MA crosses above a longer-term MA, it may signal a potential buy opportunity.
Confluence of Signals:
The best trading opportunities may arise when multiple signals align. For example, a bullish Zigzag swing, supported by bullish Heikin Ashi candles and a moving average crossover, could provide a strong buy signal.
Disclaimer
For Educational Purposes Only: This indicator is provided for educational purposes and should not be used as the sole basis for any trading decisions.
No Guarantees: The indicator is provided "as is" without any guarantees of accuracy or completeness. Market conditions can change rapidly, and this indicator may not always reflect the most accurate market state.
Test Thoroughly: Bugs may exist in the script. It is highly recommended to test this script on a demo account before using it in live trading.
Use with Caution: Always use this indicator in conjunction with other analysis tools. Do not rely solely on this indicator for making trading decisions.
Sudden Changes or Removal: The indicator may be subject to sudden changes or removal without prior notice. The developer is not responsible for any issues this may cause.
By using this indicator, you agree to these terms.
MTF Candle Multi Hub インジケーター - ガイド
はじめに
「MTF Candle Multi Hub」インジケーターは、複数の時間枠のローソク足データ、平均足、移動平均線を1つのチャート上で視覚化するために設計された多用途かつ包括的なツールです。このインジケーターには、水平線を描画する機能を備えたジグザグ機能も含まれており、テクニカル分析において強力なツールとなります。
主な機能
マルチタイムフレームのローソク足表示:
5分足、15分足、1時間足、4時間足、日足、週足のローソク足を表示することができます。
各時間枠のローソク足は設定パネルでオンまたはオフに切り替えることができます。
ローソク足は、終値が始値より高いか低いかに基づいて色分けされており、強気と弱気のローソク足の色をカスタマイズできます。
平均足ローソク足:
5分足、15分足、1時間足、4時間足、日足、週足の平均足ローソク足を表示することができます。
標準のローソク足と同様に、これらをオンまたはオフに切り替え、色をカスタマイズすることが可能です。
移動平均線(MA):
このインジケーターは、単純移動平均線(SMA)または指数移動平均線(EMA)のいずれかを選択できる4つの移動平均線をサポートしています。
各移動平均線をオンまたはオフに切り替え、期間やタイプを設定パネルから調整できます。
また、2本の移動平均線の間に色を塗ることで、MAの相対的な位置を視覚的に表示する機能もあります。
ジグザグインジケーターと水平線:
ジグザグ機能は、重要なスイングの高値と安値の間に線を引き、トレンドや潜在的な反転ポイントを識別するのに役立ちます。
2本のジグザグラインを設定することができ、それぞれのスイングの長さ、線の色、スタイル、幅をカスタマイズできます。
また、ジグザグのスイングの始点と終点に水平線を描画する機能も提供されています。これらの水平線は、色、スタイル、幅、長さをカスタマイズできます。
描画する水平線の本数を設定でき、最新のスイングに焦点を当てた分析が可能です。
ラベルとコメントの表示:
インジケーターは、チャート上にカスタムラベルとコメントを表示するオプションを提供します。
最大10個の異なるコメントを入力することができ、これらはチャートの最新のローソク足にラベルとして表示されます。
ラベルの位置、背景色、テキストの色、テキストのサイズは完全にカスタマイズ可能です。
トレード戦略
マルチタイムフレーム分析を使用したトレンドフォロー:
マルチタイムフレームのローソク足や平均足の機能を使用して、異なる時間枠でのトレンドを評価します。例えば、日足と4時間足の平均足が共に強気であれば、強い上昇トレンドを示している可能性があります。
エントリーとエグジットシグナル:
ジグザグインジケーターを使用して、新たなスイング高値または安値を確認し、エントリーポイントを見極めます。
ジグザグの水平線をサポートおよびレジスタンスレベルとして使用し、エントリーやエグジットのタイミングを判断します。
移動平均線のクロスオーバー:
移動平均線のクロスオーバーを監視します。例えば、短期の移動平均線が長期の移動平均線を上抜けた場合、買いのシグナルとなる可能性があります。
シグナルのコンフルエンス:
複数のシグナルが一致する場合、最も良いトレード機会が生まれるかもしれません。例えば、強気のジグザグスイング、強気の平均足、移動平均線のクロスオーバーが揃うと、強力な買いシグナルとなる可能性があります。
免責事項
教育目的のみ: このインジケーターは教育目的で提供されており、トレードの決定を行う際の唯一の基準として使用すべきではありません。
保証なし: インジケーターは「現状のまま」提供されており、その正確性や完全性についての保証はありません。市場の状況は急速に変化する可能性があり、このインジケーターが常に最も正確な市場状況を反映するとは限りません。
十分なテストを: このスクリプトにはバグが存在する可能性があります。実際のトレードで使用する前に、デモ口座で十分にテストすることを強くお勧めします。
慎重に使用: このインジケーターを他の分析ツールと併用して使用してください。このインジケーターだけに頼ってトレードの決定を行うべきではありません。
突然の変更や削除の可能性: このインジケーターは予告なく変更や削除が行われる場合があります。そのため、利用者に不利益が生じる可能性がありますが、開発者はその責任を負いません。
このインジケーターを使用することで、これらの条件に同意したものとみなされます。
Volume Profile Heatmap [UAlgo]The "Volume Profile Heatmap " indicator is a tool designed to visualize the distribution of trading volume across different price levels over a specified period. This heatmap-style indicator helps traders identify significant price levels where a high volume of trading activity has occurred, which can be crucial for making informed trading decisions. The indicator divides the price range into multiple levels and calculates the volume of trades occurring at each level, presenting this data in a visually intuitive manner using a gradient of colors.
By analyzing the volume profile, traders can gain insights into areas of support and resistance, as well as the Point of Control (POC)—the price level with the highest traded volume. This information is valuable in assessing market sentiment, potential reversal points, and key areas of interest where price action might consolidate or react.
🔶 Key Features
Customizable Analysis Period: The indicator allows users to specify the analysis period, defining the historical range over which the volume profile is calculated.
Adjustable Number of Levels: Users can set the number of price levels to divide the price range, offering flexibility in the granularity of the volume analysis.
Color-Coded Heatmap: The indicator uses a gradient color scheme to visually represent volume intensity at each price level. Higher volume areas are shaded differently than lower volume areas, making it easy to spot significant price levels.
Opacity Control: Users can adjust the opacity of the volume boxes, enabling a clearer or more subtle visualization according to their preferences.
Point of Control (POC) Display: The indicator highlights the Point of Control, the price level with the highest traded volume, with a distinct line on the chart, allowing traders to easily identify this critical level.
🔶 Disclaimer
Use with Caution: This indicator is provided for educational and informational purposes only and should not be considered as financial advice. Users should exercise caution and perform their own analysis before making trading decisions based on the indicator's signals.
Not Financial Advice: The information provided by this indicator does not constitute financial advice, and the creator (UAlgo) shall not be held responsible for any trading losses incurred as a result of using this indicator.
Backtesting Recommended: Traders are encouraged to backtest the indicator thoroughly on historical data before using it in live trading to assess its performance and suitability for their trading strategies.
Risk Management: Trading involves inherent risks, and users should implement proper risk management strategies, including but not limited to stop-loss orders and position sizing, to mitigate potential losses.
No Guarantees: The accuracy and reliability of the indicator's signals cannot be guaranteed, as they are based on historical price data and past performance may not be indicative of future results.

Advanced Keltner Channel/Oscillator [MyTradingCoder]This indicator combines a traditional Keltner Channel overlay with an oscillator, providing a comprehensive view of price action, trend, and momentum. The core of this indicator is its advanced ATR calculation, which uses statistical methods to provide a more robust measure of volatility.
Starting with the overlay component, the center line is created using a biquad low-pass filter applied to the chosen price source. This provides a smoother representation of price than a simple moving average. The upper and lower channel lines are then calculated using the statistically derived ATR, with an additional set of mid-lines between the center and outer lines. This creates a more nuanced view of price action within the channel.
The color coding of the center line provides an immediate visual cue of the current price momentum. As the price moves up relative to the ATR, the line shifts towards the bullish color, and vice versa for downward moves. This color gradient allows for quick assessment of the current market sentiment.
The oscillator component transforms the channel into a different perspective. It takes the price's position within the channel and maps it to either a normalized -100 to +100 scale or displays it in price units, depending on your settings. This oscillator essentially shows where the current price is in relation to the channel boundaries.
The oscillator includes two key lines: the main oscillator line and a signal line. The main line represents the current position within the channel, smoothed by an exponential moving average (EMA). The signal line is a further smoothed version of the oscillator line. The interaction between these two lines can provide trading signals, similar to how MACD is often used.
When the oscillator line crosses above the signal line, it might indicate bullish momentum, especially if this occurs in the lower half of the oscillator range. Conversely, the oscillator line crossing below the signal line could signal bearish momentum, particularly if it happens in the upper half of the range.
The oscillator's position relative to its own range is also informative. Values near the top of the range (close to 100 if normalized) suggest that price is near the upper Keltner Channel band, indicating potential overbought conditions. Values near the bottom of the range (close to -100 if normalized) suggest proximity to the lower band, potentially indicating oversold conditions.
One of the strengths of this indicator is how the overlay and oscillator work together. For example, if the price is touching the upper band on the overlay, you'd see the oscillator at or near its maximum value. This confluence of signals can provide stronger evidence of overbought conditions. Similarly, the oscillator hitting extremes can draw your attention to price action at the channel boundaries on the overlay.
The mid-lines on both the overlay and oscillator provide additional nuance. On the overlay, price action between the mid-line and outer line might suggest strong but not extreme momentum. On the oscillator, this would correspond to readings in the outer quartiles of the range.
The customizable visual settings allow you to adjust the indicator to your preferences. The glow effects and color coding can make it easier to quickly interpret the current market conditions at a glance.
Overlay Component:
The overlay displays Keltner Channel bands dynamically adapting to market conditions, providing clear visual cues for potential trend reversals, breakouts, and overbought/oversold zones.
The center line is a biquad low-pass filter applied to the chosen price source.
Upper and lower channel lines are calculated using a statistically derived ATR.
Includes mid-lines between the center and outer channel lines.
Color-coded based on price movement relative to the ATR.
Oscillator Component:
The oscillator component complements the overlay, highlighting momentum and potential turning points.
Normalized values make it easy to compare across different assets and timeframes.
Signal line crossovers generate potential buy/sell signals.
Advanced ATR Calculation:
Uses a unique method to compute ATR, incorporating concepts like root mean square (RMS) and z-score clamping.
Provides both an average and mode-based ATR value.
Customizable Visual Settings:
Adjustable colors for bullish and bearish moves, oscillator lines, and channel components.
Options for line width, transparency, and glow effects.
Ability to display overlay, oscillator, or both simultaneously.
Flexible Parameters:
Customizable inputs for channel width multiplier, ATR period, smoothing factors, and oscillator settings.
Adjustable Q factor for the biquad filter.
Key Advantages:
Advanced ATR Calculation: Utilizes a statistical method to generate ATR, ensuring greater responsiveness and accuracy in volatile markets.
Overlay and Oscillator: Provides a comprehensive view of price action, combining trend and momentum analysis.
Customizable: Adjust settings to fine-tune the indicator to your specific needs and trading style.
Visually Appealing: Clear and concise design for easy interpretation.
The ATR (Average True Range) in this indicator is derived using a sophisticated statistical method that differs from the traditional ATR calculation. It begins by calculating the True Range (TR) as the difference between the high and low of each bar. Instead of a simple moving average, it computes the Root Mean Square (RMS) of the TR over the specified period, giving more weight to larger price movements. The indicator then calculates a Z-score by dividing the TR by the RMS, which standardizes the TR relative to recent volatility. This Z-score is clamped to a maximum value (10 in this case) to prevent extreme outliers from skewing the results, and then rounded to a specified number of decimal places (2 in this script).
These rounded Z-scores are collected in an array, keeping track of how many times each value occurs. From this array, two key values are derived: the mode, which is the most frequently occurring Z-score, and the average, which is the weighted average of all Z-scores. These values are then scaled back to price units by multiplying by the RMS.
Now, let's examine how these values are used in the indicator. For the Keltner Channel lines, the mid lines (top and bottom) use the mode of the ATR, representing the most common volatility state. The max lines (top and bottom) use the average of the ATR, incorporating all volatility states, including less common but larger moves. By using the mode for the mid lines and the average for the max lines, the indicator provides a nuanced view of volatility. The mid lines represent the "typical" market state, while the max lines account for less frequent but significant price movements.
For the color coding of the center line, the mode of the ATR is used to normalize the price movement. The script calculates the difference between the current price and the price 'degree' bars ago (default is 2), and then divides this difference by the mode of the ATR. The resulting value is passed through an arctangent function and scaled to a 0-1 range. This scaled value is used to create a color gradient between the bearish and bullish colors.
Using the mode of the ATR for this color coding ensures that the color changes are based on the most typical volatility state of the market. This means that the color will change more quickly in low volatility environments and more slowly in high volatility environments, providing a consistent visual representation of price momentum relative to current market conditions.
Using a good IIR (Infinite Impulse Response) low-pass filter, such as the biquad filter implemented in this indicator, offers significant advantages over simpler moving averages like the EMA (Exponential Moving Average) or other basic moving averages.
At its core, an EMA is indeed a simple, single-pole IIR filter, but it has limitations in terms of its frequency response and phase delay characteristics. The biquad filter, on the other hand, is a two-pole, two-zero filter that provides superior control over the frequency response curve. This allows for a much sharper cutoff between the passband and stopband, meaning it can more effectively separate the signal (in this case, the underlying price trend) from the noise (short-term price fluctuations).
The improved frequency response of a well-designed biquad filter means it can achieve a better balance between smoothness and responsiveness. While an EMA might need a longer period to sufficiently smooth out price noise, potentially leading to more lag, a biquad filter can achieve similar or better smoothing with less lag. This is crucial in financial markets where timely information is vital for making trading decisions.
Moreover, the biquad filter allows for independent control of the cutoff frequency and the Q factor. The Q factor, in particular, is a powerful parameter that affects the filter's resonance at the cutoff frequency. By adjusting the Q factor, users can fine-tune the filter's behavior to suit different market conditions or trading styles. This level of control is simply not available with basic moving averages.
Another advantage of the biquad filter is its superior phase response. In the context of financial data, this translates to more consistent lag across different frequency components of the price action. This can lead to more reliable signals, especially when it comes to identifying trend changes or price reversals.
The computational efficiency of biquad filters is also worth noting. Despite their more complex mathematical foundation, biquad filters can be implemented very efficiently, often requiring only a few operations per sample. This makes them suitable for real-time applications and high-frequency trading scenarios.
Furthermore, the use of a more sophisticated filter like the biquad can help in reducing false signals. The improved noise rejection capabilities mean that minor price fluctuations are less likely to cause unnecessary crossovers or indicator movements, potentially leading to fewer false breakouts or reversal signals.
In the specific context of a Keltner Channel, using a biquad filter for the center line can provide a more stable and reliable basis for the entire indicator. It can help in better defining the overall trend, which is crucial since the Keltner Channel is often used for trend-following strategies. The smoother, yet more responsive center line can lead to more accurate channel boundaries, potentially improving the reliability of overbought/oversold signals and breakout indications.
In conclusion, this advanced Keltner Channel indicator represents a significant evolution in technical analysis tools, combining the power of traditional Keltner Channels with modern statistical methods and signal processing techniques. By integrating a sophisticated ATR calculation, a biquad low-pass filter, and a complementary oscillator component, this indicator offers traders a comprehensive and nuanced view of market dynamics.
The indicator's strength lies in its ability to adapt to varying market conditions, providing clear visual cues for trend identification, momentum assessment, and potential reversal points. The use of statistically derived ATR values for channel construction and the implementation of a biquad filter for the center line result in a more responsive and accurate representation of price action compared to traditional methods.
Furthermore, the dual nature of this indicator – functioning as both an overlay and an oscillator – allows traders to simultaneously analyze price trends and momentum from different perspectives. This multifaceted approach can lead to more informed decision-making and potentially more reliable trading signals.
The high degree of customization available in the indicator's settings enables traders to fine-tune its performance to suit their specific trading styles and market preferences. From adjustable visual elements to flexible parameter inputs, users can optimize the indicator for various trading scenarios and time frames.
Ultimately, while no indicator can predict market movements with certainty, this advanced Keltner Channel provides traders with a powerful tool for market analysis. By offering a more sophisticated approach to measuring volatility, trend, and momentum, it equips traders with valuable insights to navigate the complex world of financial markets. As with any trading tool, it should be used in conjunction with other forms of analysis and within a well-defined risk management framework to maximize its potential benefits.
Smoothed SuperTrend with VWAP Confirmation [CHE] Smoothed SuperTrend with Automated Optimization and VWAP Confirmation
Overview
The "Smoothed SuperTrend with VWAP Confirmation" is an advanced technical analysis indicator designed for precise trend identification and trading signal generation. This script integrates a smoothed version of the popular SuperTrend indicator with an additional layer of confirmation using the Volume-Weighted Average Price (VWAP). The combination of these two elements offers traders a powerful tool for identifying optimal entry and exit points in the market.
Key Features
1. Smoothed SuperTrend
- Super Smoother Algorithm: The SuperTrend in this script is not just a regular one; it is enhanced by the Super Smoother filter, which reduces market noise and provides more reliable trend signals.
- Customizable Parameters: Traders can adjust three different sets of SuperTrend parameters (factor and ATR length), allowing them to tailor the indicator to their specific trading strategies.
- Automatic Optimization: The script automatically evaluates the performance of each SuperTrend parameter set and selects the one with the best cumulative performance. This selection process can be set to pick either the best or the worst performing parameter set, depending on the trader's preference.
2. VWAP Confirmation
- Precise Trend Confirmation: Once the best-performing SuperTrend is identified, the script further refines the signals by using VWAP as a confirmation tool. VWAP is a highly respected indicator in the trading community, often used to assess the true average price of an asset.
- Long and Short Signal Generation: The script generates Long and Short signals only when the price action is confirmed by both the SuperTrend and VWAP. For a Long signal, the price must be above the VWAP, and for a Short signal, it must be below the VWAP. This dual confirmation ensures higher accuracy and reduces the likelihood of false signals.
3. Visual and Informative Labels
- Signal Labels: Upon confirmation of a trend reversal by both the SuperTrend and VWAP, the script plots clear labels on the chart, indicating confirmed Long or Short signals. These labels are customizable in terms of color, text, and size, ensuring they fit seamlessly into any chart setup.
- Best Parameters Display: At the close of the most recent bar, the script displays a label that provides detailed information about the best-performing SuperTrend parameters and their cumulative performance. This feature keeps traders informed about which settings are currently most effective.
Input Customization Options
1. Super Smoother Length
- Traders can define the length of the Super Smoother filter, which is used to smooth both price data and ATR (Average True Range) values. This input allows traders to control the sensitivity of the indicator, with shorter lengths providing faster responses and longer lengths offering smoother trends.
2. SuperTrend Parameters
- Factor: For each of the three SuperTrends, traders can set a unique factor that determines the distance of the SuperTrend bands from the average price. A higher factor results in wider bands and fewer signals, while a lower factor results in narrower bands and more signals.
- ATR Length: Traders can also specify the length of the ATR used in each SuperTrend calculation. A longer ATR period captures broader market volatility, while a shorter period focuses on more immediate price movements.
3. Label Settings
- Label Colors: The script allows full customization of label colors for Long and Short signals, ensuring that they match the trader’s chart aesthetics.
- Label Text Colors and Sizes: Traders can adjust the text color and size of the labels for Long, Short, and information labels, allowing them to prioritize visibility and readability on their charts.
4. Performance Selection Mode
- Best or Worst Performer: This input allows traders to select whether the script should optimize for the best or worst performing SuperTrend parameter set. This flexibility is useful in different market conditions, where a trader might want to analyze either the strongest trend or focus on a contrarian strategy.
5. VWAP Calculation
- The script automatically recalculates the VWAP based on trend changes, ensuring that the confirmation signals are as accurate and relevant as possible to the current market context.
Important Note
This script is designed to provide more accurate trend signals and confirmations, but like all technical indicators, it should not be used in isolation. It is recommended to use this tool as part of a broader trading strategy, including proper risk management and consideration of fundamental market conditions.
Conclusion
The "Smoothed SuperTrend with VWAP Confirmation" script is an innovative trading tool that combines the strengths of the SuperTrend and VWAP indicators. By integrating smoothing techniques and automatic parameter optimization, this indicator provides traders with more accurate and reliable trend signals. The added confirmation by VWAP further enhances the precision of the entry and exit points, making it an excellent choice for traders looking to improve their technical analysis and trading outcomes. This tool is especially valuable for those who prefer customizable inputs and a systematic approach to trading, ensuring that the indicator adapts to various market conditions and individual trading styles.
Best regards
Chervolino

Uptrick: Adaptive Trend Strength Index (ATSI)### **Adaptive Trend Strength Index (ATSI): Trend Detection Tool**
---
### Introduction
The **Adaptive Trend Strength Index (ATSI)** is a state-of-the-art indicator designed to offer traders an unparalleled view into market trends. By combining the principles of adaptive trend analysis with advanced volatility filtering, ATSI provides a powerful and visually intuitive method for identifying and following market trends. Its unique algorithm and customizable features make it an essential tool for traders across all markets—whether you're trading stocks, forex, commodities, or cryptocurrencies.
### The Purpose and Design Philosophy
At its core, the ATSI was built with the understanding that financial markets are dynamic, ever-changing entities influenced by a multitude of factors, including market sentiment, economic data, geopolitical events, and, critically, volatility. Traditional trend indicators often fall short by either over-smoothing price data (thus lagging behind the actual trend) or reacting too quickly to minor price fluctuations, resulting in false signals.
**ATSI solves this dilemma by adapting to market conditions in real-time.** It effectively filters out market noise while being sensitive enough to detect meaningful shifts in trend direction. The result is a trend line that is both responsive and smooth, providing traders with a clear, actionable view of the market's current trajectory.
### Key Features and Functionality
#### 1. **Adaptive Trend Calculation**
The heart of ATSI is its adaptive trend algorithm, which adjusts based on market conditions. It leverages a combination of price action analysis and volatility filtering to determine the strength and direction of the trend. Here’s how it works:
- **Volatility Sensitivity:** ATSI incorporates the Average True Range (ATR) to measure market volatility. This volatility measure is then adjusted by a user-defined sensitivity factor. This ensures that the indicator responds dynamically to different market environments—be it high-volatility breakouts or low-volatility consolidations.
- **Adaptive Smoothing:** The trend calculation is further enhanced by an exponential moving average (EMA) applied not just to the raw price data, but also to the resulting trend line itself. This dual-layer smoothing process helps to eliminate noise, resulting in a cleaner and more reliable trend line.
- **Real-Time Adaptation:** Unlike rigid indicators that require constant tweaking to stay relevant in changing market conditions, ATSI adapts in real-time. This adaptability makes it particularly valuable in fast-moving markets where conditions can change rapidly.
#### 2. **Visual Clarity**
In trading, visual clarity can make the difference between spotting a lucrative trend and missing out. ATSI excels in this regard by offering a clear, color-coded trend line that provides instant feedback on market conditions:
- **Thicker and Smoother Line:** ATSI’s trend line is designed to be visually prominent. By default, it is thicker than most standard indicators, making it easy to spot even in dense charts. Additionally, the smoothing applied to the line ensures that it flows smoothly, avoiding the jagged, noisy appearance that can plague other indicators.
- **Color-Coded Trends:** The trend line changes color based on the direction and strength of the trend:
- **Green Line**: Indicates a bullish trend, suggesting upward momentum in the market.
- **Red Line**: Indicates a bearish trend, signaling downward momentum.
- **Gold Line**: Represents a neutral or weak trend, where the market is consolidating or where there is no clear direction.
This color-coding is not just for aesthetics—it’s a critical feature that allows traders to quickly assess market conditions at a glance.
#### 3. **Customizable Parameters**
ATSI is built with the understanding that every trader’s strategy is unique. Whether you’re a day trader looking for short-term trends or a swing trader interested in catching longer moves, ATSI can be tailored to fit your needs:
- **Trend Length:** The length parameter controls how much historical data is considered in the trend calculation. A shorter length will make the indicator more sensitive to recent price changes, while a longer length will smooth out short-term fluctuations, focusing on the broader trend.
- **Smoothing Factor:** This parameter controls the level of smoothing applied to the trend line. A higher smoothing factor will result in a smoother, more stable trend line, while a lower factor will make the line more responsive to quick changes in price.
- **Volatility Sensitivity:** By adjusting the volatility sensitivity, you can control how reactive the indicator is to market volatility. A higher sensitivity makes the indicator more likely to detect trends in volatile markets, while a lower sensitivity helps to filter out noise in calmer markets.
- **Line Width:** ATSI allows you to adjust the thickness of the trend line, ensuring that it stands out on your chart. This is particularly useful when trading on charts with a lot of overlays or when you need a clear, bold line to guide your trading decisions.
- **Color Customization:** The colors for bullish, bearish, and neutral trends can be fully customized to match your personal preferences or to integrate seamlessly with your existing chart setup.
### Practical Applications
ATSI is a versatile indicator that can be applied to a wide range of trading strategies. Here’s how it can enhance your trading:
#### 1. **Trend Following**
For traders who thrive on catching and riding trends, ATSI is a game-changer. Its adaptive nature ensures that you stay in the trend for as long as possible without being shaken out by minor fluctuations. The clear color-coded line makes it easy to identify when a trend starts and ends, providing clear entry and exit signals.
#### 2. **Risk Management**
One of the biggest challenges in trading is managing risk, particularly in volatile markets. ATSI’s volatility sensitivity feature helps traders adjust their strategies based on current market conditions. For example, in a high-volatility environment, the indicator will become more sensitive, allowing you to tighten your stop losses or take profits earlier. Conversely, in a low-volatility market, the indicator will smooth out minor fluctuations, reducing the risk of being stopped out prematurely.
#### 3. **Trend Reversals and Consolidations**
ATSI is also highly effective in identifying trend reversals and periods of consolidation. The neutral (gold) line indicates periods where the market is undecided, which can often precede significant moves. Recognizing these periods can help you avoid getting caught in choppy markets and position yourself for the next big move.
#### 4. **Market Timing**
Timing the market is often seen as the holy grail of trading. While no indicator can predict the future with 100% accuracy, ATSI’s real-time adaptation gives you a significant edge. By responding to changes in market conditions as they happen, ATSI helps you make timely decisions, whether you’re entering a trade, exiting a position, or adjusting your risk parameters.
### Comparative Advantage
What sets ATSI apart from other trend indicators is its combination of adaptability, visual clarity, and ease of use:
- **Adaptability:** Most trend indicators are static—they apply the same calculations regardless of market conditions. ATSI, however, adapts to the market in real-time, ensuring that it remains relevant and reliable across different market environments.
- **Visual Clarity:** The thicker, smoother, color-coded line is not just aesthetically pleasing—it’s a functional design choice that helps you quickly interpret market conditions. Whether you’re glancing at your chart or conducting an in-depth analysis, the ATSI line stands out, providing immediate insight.
- **Ease of Use:** Despite its advanced features, ATSI is incredibly easy to use. The default settings are optimized for general use, but the indicator offers a high degree of customization for those who want to tailor it to their specific trading strategy.
### Conclusion
The **Adaptive Trend Strength Index (ATSI)** is more than just another trend indicator—it’s a comprehensive tool designed to give traders an edge in today’s fast-paced, volatile markets. By combining adaptive trend analysis with advanced volatility filtering, ATSI offers a unique blend of responsiveness and reliability. Its clear, color-coded visual representation of trends makes it easy to use, even for traders who are new to technical analysis, while its customizable parameters provide the flexibility that experienced traders demand.
Whether you’re looking to ride the next big trend, manage your risk more effectively, or simply get a clearer picture of the market’s current direction, ATSI is an invaluable addition to your trading toolkit. With its cutting-edge design and powerful functionality, ATSI is poised to become the go-to indicator for traders seeking to enhance their market analysis and improve their trading outcomes.

Price Action Smart Money Concepts [BigBeluga]THE SMART MONEY CONCEPTS Toolkit
The Smart Money Concepts [ BigBeluga ] is a comprehensive toolkit built around the principles of "smart money" behavior, which refers to the actions and strategies of institutional investors.
The Smart Money Concepts Toolkit brings together a suite of advanced indicators that are all interconnected and built around a unified concept: understanding and trading like institutional investors, or "smart money." These indicators are not just randomly chosen tools; they are features of a single overarching framework, which is why having them all in one place creates such a powerful system.
This all-in-one toolkit provides the user with a unique experience by automating most of the basic and advanced concepts on the chart, saving them time and improving their trading ideas.
Real-time market structure analysis simplifies complex trends by pinpointing key support, resistance, and breakout levels.
Advanced order block analysis leverages detailed volume data to pinpoint high-demand zones, revealing internal market sentiment and predicting potential reversals. This analysis utilizes bid/ask zones to provide supply/demand insights, empowering informed trading decisions.
Imbalance Concepts (FVG and Breakers) allows traders to identify potential market weaknesses and areas where price might be attracted to fill the gap, creating opportunities for entry and exit.
Swing failure patterns help traders identify potential entry points and rejection zones based on price swings.
Liquidity Concepts, our advanced liquidity algorithm, pinpoints high-impact events, allowing you to predict market shifts, strong price reactions, and potential stop-loss hunting zones. This gives traders an edge to make informed trading decisions based on liquidity dynamics.
🔵 FEATURES
The indicator has quite a lot of features that are provided below:
Swing market structure
Internal market structure
Mapping structure
Adjustable market structure
Strong/Weak H&L
Sweep
Volumetric Order block / Breakers
Fair Value Gaps / Breakers (multi-timeframe)
Swing Failure Patterns (multi-timeframe)
Deviation area
Equal H&L
Liquidity Prints
Buyside & Sellside
Sweep Area
Highs and Lows (multi-timeframe)
🔵 BASIC DEMONSTRATION OF ALL FEATURES
1. MARKET STRUCTURE
The preceding image illustrates the market structure functionality within the Smart Money Concepts indicator.
➤ Solid lines: These represent the core indicator's internal structure, forming the foundation for most other components. They visually depict the overall market direction and identify major reversal points marked by significant price movements (denoted as 'x').
➤ Internal Structure: These represent an alternative internal structure with the potential to drive more rapid market shifts. This is particularly relevant when a significant gap exists in the established swing structure, specifically between the Break of Structure (BOS) and the most recent Change of High/Low (CHoCH). Identifying these formations can offer opportunities for quicker entries and potential short-term reversals.
➤ Sweeps (x): These signify potential turning points in the market where liquidity is removed from the structure. This suggests a possible trend reversal and presents crucial entry opportunities. Sweeps are identified within both swing and internal structures, providing valuable insights for informed trading decisions.
➤ Mapping structure: A tool that automatically identifies and connects significant price highs and lows, creating a zig-zag pattern. It visualizes market structure, highlights trends, support/resistance levels, and potential breakouts. Helps traders quickly grasp price action patterns and make informed decisions.
➤ Color-coded candles based on market structure: These colors visually represent the underlying market structure, making it easier for traders to quickly identify trends.
➤ Extreme H&L: It visualizes market structure with extreme high and lows, which gives perspective for macro Market Structure.
2. VOLUMETRIC ORDER BLOCKS
Order blocks are specific areas on a financial chart where significant buying or selling activity has occurred. These are not just simple zones; they contain valuable information about market dynamics. Within each of these order blocks, volume bars represent the actual buying and selling activity that took place. These volume bars offer deeper insights into the strength of the order block by showing how much buying or selling power is concentrated in that specific zone.
Additionally, these order blocks can be transformed into Breaker Blocks. When an order block fails—meaning the price breaks through this zone without reversing—it becomes a breaker block. Breaker blocks are particularly useful for trading breakouts, as they signal that the market has shifted beyond a previously established zone, offering opportunities for traders to enter in the direction of the breakout.
Here's a breakdown:
➤ Bear Order Blocks (Red): These are zones where a lot of selling happened. Traders see these areas as places where sellers were strong, pushing the price down. When the price returns to these zones, it might face resistance and drop again.
➤ Bull Order Blocks (Green): These are zones where a lot of buying happened. Traders see these areas as places where buyers were strong, pushing the price up. When the price returns to these zones, it might find support and rise again.
These Order Blocks help traders identify potential areas for entering or exiting trades based on past market activity. The volume bars inside blocks show the amount of trading activity that occurred in these blocks, giving an idea of the strength of buying or selling pressure.
➤ Breaker Block: When an order block fails, meaning the price breaks through this zone without reversing, it becomes a breaker block. This indicates a significant shift in market liquidity and structure.
➤ A bearish breaker block occurs after a bullish order block fails. This typically happens when there's an upward trend, and a certain level that was expected to support the market's rise instead gives way, leading to a sharp decline. This decline indicates that sellers have overcome the buyers, absorbing liquidity and shifting the sentiment from bullish to bearish.
Conversely, a bullish breaker block is formed from the failure of a bearish order block. In a downtrend, when a level that was expected to act as resistance is breached, and the price shoots up, it signifies that buyers have taken control, overpowering the sellers.
3. FAIR VALUE GAPS:
A fair value gap (FVG), also referred to as an imbalance, is an essential concept in Smart Money trading. It highlights the supply and demand dynamics. This gap arises when there's a notable difference between the volume of buy and sell orders. FVGs can be found across various asset classes, including forex, commodities, stocks, and cryptocurrencies.
FVGs in this toolkit have the ability to detect raids of FVG which helps to identify potential price reversals.
Mitigation option helps to change from what source FVGs will be identified: Close, Wicks or AVG.
4. SWING FAILURE PATTERN (SFP):
The Swing Failure Pattern is a liquidity engineering pattern, generally used to fill large orders. This means, the SFP generally occurs when larger players push the price into liquidity pockets with the sole objective of filling their own positions.
SFP is a technical analysis tool designed to identify potential market reversals. It works by detecting instances where the price briefly breaks a previous high or low but fails to maintain that breakout, quickly reversing direction.
How it works:
Pattern Detection: The indicator scans for price movements that breach recent highs or lows.
Reversal Confirmation: If the price quickly reverses after breaching these levels, it's identified as an SFP.
➤ SFP Display:
Bullish SFP: Marked with a green symbol when price drops below a recent low before reversing upwards.
Bearish SFP: Marked with a red symbol when price rises above a recent high before reversing downwards.
➤ Deviation Levels: After detecting an SFP, the indicator projects white lines showing potential price deviation:
For bullish SFPs, the deviation line appears above the current price.
For bearish SFPs, the deviation line appears below the current price.
These deviation levels can serve as a potential trading opportunity or areas where the reversal might lose momentum.
With Volume Threshold and Filtering of SFP traders can adjust their trading style:
Volume Threshold: This setting allows traders to filter SFPs based on the volume of the reversal candle. By setting a higher volume threshold, traders can focus on potentially more significant reversals that are backed by higher trading activity.
SFP Filtering: This feature enables traders to filter SFP detection. It includes parameters such as:
5. LIQUIDITY CONCEPTS:
➤ Equal Lows (EQL) and Equal Highs (EQH) are important concepts in liquidity-based trading.
EQL: A series of two or more swing lows that occur at approximately the same price level.
EQH: A series of two or more swing highs that occur at approximately the same price level.
EQLs and EQHs are seen as potential liquidity pools where a large number of stop loss orders or limit orders may be clustered. They can be used as potential reverse points for trades.
This multi-period feature allows traders to select less and more significant EQL and EQH:
➤ Liquidity wicks:
Liquidity wicks are a minor representation of a stop-loss hunt during the retracement of a pivot point:
➤ Buy and Sell side liquidity:
The buy side liquidity represents a concentration of potential buy orders below the current price level. When price moves into this area, it can lead to increased buying pressure due to the execution of these orders.
The sell side liquidity indicates a pool of potential sell orders below the current price level. Price movement into this area can result in increased selling pressure as these orders are executed.
➤ Sweep Liquidation Zones:
Sweep Liquidation Zones are crucial for understanding market structure and potential future price movements. They provide insights into areas where significant market participants have been forced out of their positions, potentially setting up new trading opportunities.
🔵 USAGE & EXAMPLES
The core principle behind the success of this toolkit lies in identifying "confluence." This refers to the convergence of multiple trading indicators all signaling the same information at a specific point or area. By seeking such alignment, traders can significantly enhance the likelihood of successful trades.
MS + OBs
The chart illustrates a highly bullish setup where the price is rejecting from a bullish order block (POC), while simultaneously forming a bullish Swing Failure Pattern (SFP). This occurs after an internal structure change, marked by a bullish Change of Character (CHoCH). The price broke through a bearish order block, transforming it into a breaker block, further confirming the bullish momentum.
The combination of these elements—bullish order blocks, SFP, and CHoCH—creates a powerful bullish signal, reinforcing the potential for upward movement in the market.
SFP + Bear OB
This chart above displays a bearish setup with a high probability of a price move lower. The price is currently rejecting from a bear order block, which represents a key resistance area where significant selling pressure has previously occurred. A Swing Failure Pattern (SFP) has also formed near this bear order block, indicating that the price briefly attempted to break above a recent high but failed to sustain that upward movement. This failure suggests that buyers are losing momentum, and the market could be preparing for a move to the downside.
Additionally, we can toggle on the Deviation Area in the SFP section to highlight potential levels where price deviation might occur. These deviation areas represent zones where the price is likely to react after the Swing Failure Pattern:
BUY – SELL sides + EQL
The chart showcases a bullish setup with a high probability of price breaking out of the current sell-side resistance level. The market structure indicates a formation of Equal Lows (EQL), which often suggests a build-up of liquidity that could drive the price higher.
The presence of strong buy-side pressure (69%), indicated by the green zone at the bottom, reinforces this bullish outlook. This area represents a key support zone where buyers are outpacing sellers, providing the foundation for a potential upward breakout.
EQL + Bull ChoCh
This chart illustrates a potential bullish setup, driven by the formation of Equal Lows (EQL) followed by a bullish Change of Character (CHoCH). The presence of Equal Lows often signals a liquidity build-up, which can lead to a reversal when combined with additional bullish signals.
Liquidity grab + Bull ChoCh + FVGs
This chart demonstrates a strong bullish scenario, where several important market dynamics are at play. The price begins its upward momentum from Liquidity grab following a bullish Change of Character (CHoCH), signaling the transition from a bearish phase to a bullish one.
As the price progresses, it performs liquidity grabs, which serve to gather the necessary fuel for further movement. These liquidity grabs often occur before significant price surges, as large market participants exploit these areas to accumulate positions before pushing the price higher.
The chart also highlights a market imbalance area, showing strong momentum as the price moves swiftly through this zone.
In this examples, we see how the combination of multiple “smart money” tools helps identify a potential trade opportunities. This is just one of the many scenarios that traders can spot using this toolkit. Other combinations—such as order blocks, liquidity grabs, fair value gaps, and Swing Failure Patterns (SFPs)—can also be layered on top of these concepts to further refine your trading strategy.
🔵 SETTINGS
Window: limit calculation period
Swing: limit drawing function
Mapping structure: show structural points
Algorithmic Logic: (Extreme-Adjusted) Use max high/low or pivot point calculation
Algorithmic loopback: pivot point look back
Show Last: Amount of Order block to display
Hide Overlap: hide overlapping order blocks
Construction: Size of the order blocks
Fair value gaps: Choose between normal FVG or Breaker FVG
Mitigation: (close - wick - avg) point to mitigate the order block/imbalance
SFP lookback: find a higher / lower point to improve accuracy
Threshold: remove less relevant SFP
Equal H&L: (short-mid-long term) display longer term
Liquidity Prints: Shows wicks of candles where liquidity was grabbed
Sweep Area: Identify Sweep Liquidation areas
By combining these indicators in one toolkit, traders are equipped with a comprehensive suite of tools that address every angle of the Smart Money Concept. Instead of relying on disparate tools spread across various platforms, having them integrated into a single, cohesive system allows traders to easily see confluence and make more informed trading decisions.

Open Interest (OI) Delta [UAlgo]The Open Interest (OI) Delta indicator is a tool designed to provide insights into the dynamics of Open Interest changes within the futures market. Open Interest (OI) refers to the total number of outstanding derivative contracts, such as options or futures, that have not been settled. The OI Delta measures the change in Open Interest over a specified period, allowing traders to assess whether new money is entering the market or existing positions are being closed.
This indicator offers two distinct display modes to visualize OI Delta, along with customizable levels that help in categorizing the magnitude of OI changes. Additionally, it provides the option to color-code the bars on the price chart based on the intensity and direction of OI Delta, making it easier for traders to interpret market sentiment and potential future price movements.
🔶 Key Features
Two Display Modes: Choose between two different modes for visualizing OI Delta, depending on your analysis preferences:
Mode 1: Displays the OI Delta directly as positive or negative values.
Mode 2: Separates positive and negative OI Delta values, displaying them as absolute values for easier comparison.
Customizable Levels: Set up to four levels of OI Delta magnitude, each with customizable thresholds and colors. These levels help categorize the OI changes into Normal, Medium, Large, and Extreme ranges, allowing for a more nuanced interpretation of market activity.
MA Length and Standard Deviation Period: Adjust the moving average length and standard deviation period for OI Delta, which smooths out the data and helps in identifying significant deviations from the norm.
Color-Coded Bar Chart: Optionally color the price bars on your chart based on the OI Delta levels, helping to visually correlate price action with changes in Open Interest.
Heatmap Display: Toggle the display of OI Delta levels on the chart, with the option to fill the areas between these levels for a more visually intuitive understanding of the data.
🔶 Interpreting Indicator
Positive vs. Negative OI Delta:
A positive OI Delta indicates that the Open Interest is increasing, suggesting that new contracts are being created, which could imply fresh capital entering the market.
A negative OI Delta suggests that Open Interest is decreasing, indicating that contracts are being closed out or settled, which might reflect profit-taking or a reduction in market interest.
Magnitude Levels:
Level 1 (Normal OI Δ): Represents typical, less significant changes in OI. If the OI Delta stays within this range, it may indicate routine market activity without any substantial shift in sentiment.
Level 2 (Medium OI Δ): Reflects a more significant change in OI, suggesting increased market interest and possibly the beginning of a new trend or phase of market participation.
Level 3 (Large OI Δ): Indicates a strong change in OI, often associated with a decisive move in the market. This could signify strong conviction among market participants, either bullish or bearish.
Level 4 (Extreme OI Δ): The highest level of OI change, often preceding major market moves. Extreme OI Δ can be a signal of potential market reversals or the final phase of a strong trend.
Color-Coded Bars:
When enabled, the color of the price bars will reflect the magnitude and direction of the OI Delta. This visual aid helps in quickly assessing the correlation between price movements and changes in market sentiment as indicated by OI.
This indicator is particularly useful for futures traders looking to gauge the strength and direction of market sentiment by analyzing changes in Open Interest. By combining this with price action, traders can gain a deeper understanding of market dynamics and make more informed trading decisions
🔶 Disclaimer
Use with Caution: This indicator is provided for educational and informational purposes only and should not be considered as financial advice. Users should exercise caution and perform their own analysis before making trading decisions based on the indicator's signals.
Not Financial Advice: The information provided by this indicator does not constitute financial advice, and the creator (UAlgo) shall not be held responsible for any trading losses incurred as a result of using this indicator.
Backtesting Recommended: Traders are encouraged to backtest the indicator thoroughly on historical data before using it in live trading to assess its performance and suitability for their trading strategies.
Risk Management: Trading involves inherent risks, and users should implement proper risk management strategies, including but not limited to stop-loss orders and position sizing, to mitigate potential losses.
No Guarantees: The accuracy and reliability of the indicator's signals cannot be guaranteed, as they are based on historical price data and past performance may not be indicative of future results.