Cari dalam skrip untuk "accuracy"

Recession Warning Model [BackQuant]Recession Warning Model
Overview
The Recession Warning Model (RWM) is a Pine Script® indicator designed to estimate the probability of an economic recession by integrating multiple macroeconomic, market sentiment, and labor market indicators. It combines over a dozen data series into a transparent, adaptive, and actionable tool for traders, portfolio managers, and researchers. The model provides customizable complexity levels, display modes, and data processing options to accommodate various analytical requirements while ensuring robustness through dynamic weighting and regime-aware adjustments.
Purpose
The RWM fulfills the need for a concise yet comprehensive tool to monitor recession risk. Unlike approaches relying on a single metric, such as yield-curve inversion, or extensive economic reports, it consolidates multiple data sources into a single probability output. The model identifies active indicators, their confidence levels, and the current economic regime, enabling users to anticipate downturns and adjust strategies accordingly.
Core Features
- Indicator Families : Incorporates 13 indicators across five categories: Yield, Labor, Sentiment, Production, and Financial Stress.
- Dynamic Weighting : Adjusts indicator weights based on recent predictive accuracy, constrained within user-defined boundaries.
- Leading and Coincident Split : Separates early-warning (leading) and confirmatory (coincident) signals, with adjustable weighting (default 60/40 mix).
- Economic Regime Sensitivity : Modulates output sensitivity based on market conditions (Expansion, Late-Cycle, Stress, Crisis), using a composite of VIX, yield-curve, financial conditions, and credit spreads.
- Display Options : Supports four modes—Probability (0-100%), Binary (four risk bins), Lead/Coincident, and Ensemble (blended probability).
- Confidence Intervals : Reflects model stability, widening during high volatility or conflicting signals.
- Alerts : Configurable thresholds (Watch, Caution, Warning, Alert) with persistence filters to minimize false signals.
- Data Export : Enables CSV output for probabilities, signals, and regimes, facilitating external analysis in Python or R.
Model Complexity Levels
Users can select from four tiers to balance simplicity and depth:
1. Essential : Focuses on three core indicators—yield-curve spread, jobless claims, and unemployment change—for minimalistic monitoring.
2. Standard : Expands to nine indicators, adding consumer confidence, PMI, VIX, S&P 500 trend, money supply vs. GDP, and the Sahm Rule.
3. Professional : Includes all 13 indicators, incorporating financial conditions, credit spreads, JOLTS vacancies, and wage growth.
4. Research : Unlocks all indicators plus experimental settings for advanced users.
Key Indicators
Below is a summary of the 13 indicators, their data sources, and economic significance:
- Yield-Curve Spread : Difference between 10-year and 3-month Treasury yields. Negative spreads signal banking sector stress.
- Jobless Claims : Four-week moving average of unemployment claims. Sustained increases indicate rising layoffs.
- Unemployment Change : Three-month change in unemployment rate. Sharp rises often precede recessions.
- Sahm Rule : Triggers when unemployment rises 0.5% above its 12-month low, a reliable recession indicator.
- Consumer Confidence : University of Michigan survey. Declines reflect household pessimism, impacting spending.
- PMI : Purchasing Managers’ Index. Values below 50 indicate manufacturing contraction.
- VIX : CBOE Volatility Index. Elevated levels suggest market anticipation of economic distress.
- S&P 500 Growth : Weekly moving average trend. Declines reduce wealth effects, curbing consumption.
- M2 + GDP Trend : Monitors money supply and real GDP. Simultaneous declines signal credit contraction.
- NFCI : Chicago Fed’s National Financial Conditions Index. Positive values indicate tighter conditions.
- Credit Spreads : Proxy for corporate bond spreads using 10-year vs. 2-year Treasury yields. Widening spreads reflect stress.
- JOLTS Vacancies : Job openings data. Significant drops precede hiring slowdowns.
- Wage Growth : Year-over-year change in average hourly earnings. Late-cycle spikes often signal economic overheating.
Data Processing
- Rate of Change (ROC) : Optionally applied to capture momentum in data series (default: 21-bar period).
- Z-Score Normalization : Standardizes indicators to a common scale (default: 252-bar lookback).
- Smoothing : Applies a short moving average to final signals (default: 5-bar period) to reduce noise.
- Binary Signals : Generated for each indicator (e.g., yield-curve inverted or PMI below 50) based on thresholds or Z-score deviations.
Probability Calculation
1. Each indicator’s binary signal is weighted according to user settings or dynamic performance.
2. Weights are normalized to sum to 100% across active indicators.
3. Leading and coincident signals are aggregated separately (if split mode is enabled) and combined using the specified mix.
4. The probability is adjusted by a regime multiplier, amplifying risk during Stress or Crisis regimes.
5. Optional smoothing ensures stable outputs.
Display and Visualization
- Probability Mode : Plots a continuous 0-100% recession probability with color gradients and confidence bands.
- Binary Mode : Categorizes risk into four levels (Minimal, Watch, Caution, Alert) for simplified dashboards.
- Lead/Coincident Mode : Displays leading and coincident probabilities separately to track signal divergence.
- Ensemble Mode : Averages traditional and split probabilities for a balanced view.
- Regime Background : Color-coded overlays (green for Expansion, orange for Late-Cycle, amber for Stress, red for Crisis).
- Analytics Table : Optional dashboard showing probability, confidence, regime, and top indicator statuses.
Practical Applications
- Asset Allocation : Adjust equity or bond exposures based on sustained probability increases.
- Risk Management : Hedge portfolios with VIX futures or options during regime shifts to Stress or Crisis.
- Sector Rotation : Shift toward defensive sectors when coincident signals rise above 50%.
- Trading Filters : Disable short-term strategies during high-risk regimes.
- Event Timing : Scale positions ahead of high-impact data releases when probability and VIX are elevated.
Configuration Guidelines
- Enable ROC and Z-score for consistent indicator comparison unless raw data is preferred.
- Use dynamic weighting with at least one economic cycle of data for optimal performance.
- Monitor stress composite scores above 80 alongside probabilities above 70 for critical risk signals.
- Adjust adaptation speed (default: 0.1) to 0.2 during Crisis regimes for faster indicator prioritization.
- Combine RWM with complementary tools (e.g., liquidity metrics) for intraday or short-term trading.
Limitations
- Macro indicators lag intraday market moves, making RWM better suited for strategic rather than tactical trading.
- Historical data availability may constrain dynamic weighting on shorter timeframes.
- Model accuracy depends on the quality and timeliness of economic data feeds.
Final Note
The Recession Warning Model provides a disciplined framework for monitoring economic downturn risks. By integrating diverse indicators with transparent weighting and regime-aware adjustments, it empowers users to make informed decisions in portfolio management, risk hedging, or macroeconomic research. Regular review of model outputs alongside market-specific tools ensures its effective application across varying market conditions.

Range Filter Strategy [Real Backtest]Range Filter Strategy - Real Backtesting
# Overview
Advanced Range Filter strategy designed for realistic backtesting with precise execution timing and comprehensive risk management. Built specifically for cryptocurrency markets with customizable parameters for different assets and timeframes.
Core Algorithm
Range Filter Technology:
- Smooth Average Range calculation using dual EMA filtering
- Dynamic range-based price filtering to identify trend direction
- Anti-noise filtering system to reduce false signals
- Directional momentum tracking with upward/downward counters
Key Features
Real-Time Execution (No Delay)
- Process orders on tick: Immediate execution without waiting for bar close
- Bar magnifier integration for intrabar precision
- Calculate on every tick for maximum responsiveness
- Standard OHLC bypass for enhanced accuracy
Realistic Price Simulation
- HL2 entry pricing (High+Low)/2 for realistic fills
- Configurable spread buffer simulation
- Random slippage generation (0 to max slippage)
- Market liquidity validation before entry
Advanced Signal Filtering
- Volume-based filtering with customizable ratio
- Optional signal confirmation system (1-3 bars)
- Anti-repetition logic to prevent duplicate signals
- Daily trade limit controls
Risk Management
- Fixed Risk:Reward ratios with precise point calculation
- Automatic stop loss and take profit execution
- Position size management
- Maximum daily trades limitation
Alert System
- Real-time alerts synchronized with strategy execution
- Multiple alert types: Setup, Entry, Exit, Status
- Customizable message formatting with price/time inclusion
- TradingView alert panel integration
Default Parameters
Optimized for BTC 5-minute charts:
- Sampling Period: 100
- Range Multiplier: 3.0
- Risk: 50 points
- Reward: 100 points (1:2 R:R)
- Spread Buffer: 2.0 points
- Max Slippage: 1.0 points
Signal Logic
Long Entry Conditions:
- Price above Range Filter line
- Upward momentum confirmed
- Volume requirements met (if enabled)
- Confirmation period completed (if enabled)
- Daily trade limit not exceeded
Short Entry Conditions:
- Price below Range Filter line
- Downward momentum confirmed
- Volume requirements met (if enabled)
- Confirmation period completed (if enabled)
- Daily trade limit not exceeded
Visual Elements
- Range Filter line with directional coloring
- Upper and lower target bands
- Entry signal markers
- Risk/Reward ratio boxes
- Real-time settings dashboard
Customization Options
Market Adaptation:
- Adjust Sampling Period for different timeframes
- Modify Range Multiplier for various volatility levels
- Configure spread/slippage for different brokers
- Set appropriate R:R ratios for trading style
Filtering Controls:
- Enable/disable volume filtering
- Adjust confirmation requirements
- Set daily trade limits
- Customize alert preferences
Performance Features
- Realistic backtesting results aligned with live trading
- Elimination of look-ahead bias
- Proper order execution simulation
- Comprehensive trade statistics
Alert Configuration
Alert Types Available:
- Entry signals with complete trade information
- Setup alerts for early preparation
- Exit notifications for position management
- Filter direction changes for market context
Message Format:
Symbol - Action | Price: XX.XX | Stop: XX.XX | Target: XX.XX | Time: HH:MM
Usage Recommendations
Optimal Settings:
- Bitcoin/Major Crypto: Default parameters
- Forex: Reduce sampling period to 50-70, multiplier to 2.0-2.5
- Stocks: Reduce sampling period to 30-50, multiplier to 1.0-1.8
- Gold: Sampling period 60-80, multiplier 1.5-2.0
TradingView Configuration:
- Recalculate: "On every tick"
- Orders: "Use bar magnifier"
- Data: Real-time feed recommended
Risk Disclaimer
This strategy is designed for educational and analytical purposes. Past performance does not guarantee future results. Always test thoroughly on paper trading before live implementation. Consider market conditions, broker execution, and personal risk tolerance when using any automated trading system.
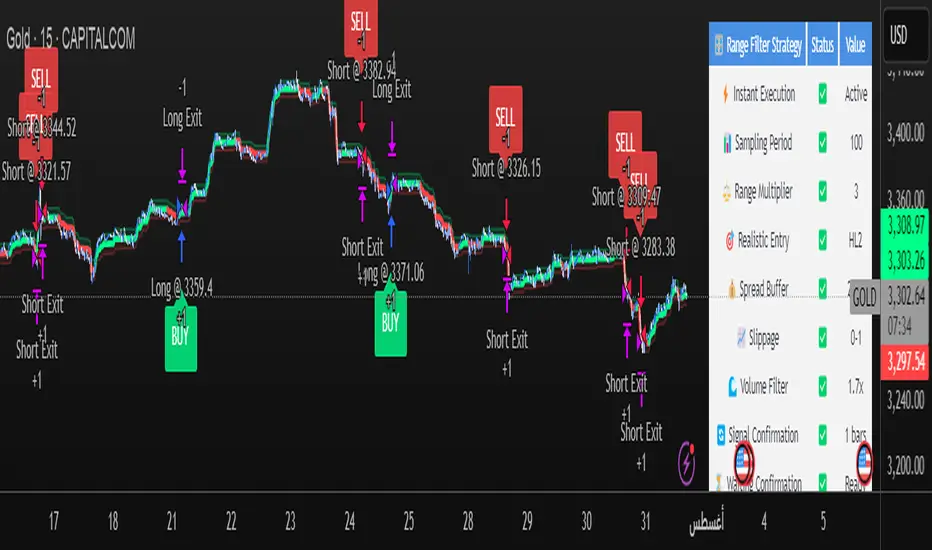
Best Settings Found for Gold 15-Minute Timeframe
After extensive testing and optimization, these are the most effective settings I've discovered for trading Gold (XAUUSD) on the 15-minute timeframe:
Core Filter Settings:
Sampling Period: 100
Range Multiplier: 3.0
Professional Execution Engine:
Realistic Entry: Enabled (HL2)
Spread Buffer: 2 points
Dynamic Slippage: Enabled with max 1 point
Volume Filter: Enabled at 1.7x ratio
Signal Confirmation: Enabled with 1 bar confirmation
Risk Management:
Stop Loss: 50 points
Take Profit: 100 points (2:1 Risk-Reward)
Max Trades Per Day: 5
These settings provide an excellent balance between signal accuracy and realistic market execution. The volume filter at 1.7x ensures we only trade during periods of sufficient market activity, while the 1-bar confirmation helps filter out false signals. The spread buffer and slippage settings account for real trading costs, making backtest results more realistic and achievable in live trading.
Momentum Oscillator ModifiedThis indicator is a custom momentum oscillator enhanced with True Range-adjusted price logic and dynamic Bollinger Bands, offering a refined way to track price strength, momentum shifts, and overbought/oversold extremes with reduced noise.
Key Features:
Dynamic Price Oscillator:
Measures momentum using both price change and a volatility-adjusted price for greater accuracy.
Smoothing factor lets you fine-tune the balance between responsiveness and noise filtering.
True Range-Based Volatility Adjustment:
Integrates true range calculations to adapt to current volatility, making signals more robust during different market conditions.
Adaptive Bollinger Bands:
Two sets of custom Bollinger Bands (standard and expanded) are drawn around the oscillator, adapting over time.
These bands help identify when momentum is exceptionally strong or weak relative to recent history.
Special fills dynamically highlight when the oscillator breaks above/below the bands, signaling potential trend extremes.
Customization:
Easily adjust lookback length and smoothing factor to fit your personal trading style (e.g., scalping or swing trading).
How to Use:
Watch for the oscillator crossing above the green Bollinger Bands or below the red bands for potential overbought/oversold or breakout scenarios.
Expanded bands provide a "super extreme" zone which may hint at exhaustion or trend climax.
The dynamic mean (black line) gives a visual reference for the normalized momentum level.

ALPHA 999This indicator is designed to provide traders with clear and reliable signals by combining essential technical tools into one simplified framework. Whether you’re trading crypto, stocks, or forex, this tool helps identify potential entry and exit points using . It is well-suited for both intraday and swing traders, offering customizable inputs, multi-timeframe compatibility, and real-time alerts. The indicator displays intuitive visual cues directly on the chart, making it easy to interpret market conditions and respond quickly. Ideal for traders who prefer clean charts with actionable signals, this tool enhances decision-making without overwhelming complexity. While powerful on its own, it can be paired with other indicators for greater confirmation and accuracy. Please note: this indicator is for educational purposes only and should be used with proper risk management and backtesting before applying to live trades.
BarUtils: Get Bar Index from DateLibrary "BarUtils"
getBarIndexFromDate(targetTimestamp)
Parameters:
targetTimestamp (int)
**Description**:
This utility provides a reliable way to calculate the `bar_index` of a specific calendar date, regardless of chart resolution. It's especially useful for anchoring scripts to historical events, labeling macroeconomic moments, or marking custom time-based signals that must remain consistent across timeframes.
Unlike hardcoded `bar_index - N` approaches, this function dynamically estimates the number of bars between a given `timestamp()` and the current bar using the actual time-per-bar (`time - time `). It works correctly on intraday, daily, weekly, and monthly charts.
### 💡 **Function Provided**:
import TradeTitan120/BarUtils/1
* `getBarIndexFromDate(int targetTimestamp)`
→ Returns the estimated `bar_index` that aligns with a given timestamp
### ✅ **Use Cases**:
* Marking past events like FOMC meetings, market crashes, or personal signals
* Backtesting entry/exit conditions from specific calendar dates
* Anchoring visual elements (shapes, lines, labels) across resolutions
This tool is simple, fast, and built for accuracy. Use it to enhance multi-timeframe compatibility in any script.
4H Bollinger Breakout StrategyThis strategy leverages Bollinger Bands on the 4-hour timeframe for long and short trades in trending or ranging markets. Entries trigger on BB breakouts with optional filters for volume, trend, and RSI. Exits occur on opposite BB crosses. Customizable for long-only, short-only, or indicator mode via code comments. Supports forex, stocks, or crypto with full equity allocation and 0.1% commission.
Length (Default: 20): Period for BB basis and std dev; shorter for sensitivity, longer for smoothing.
Basis MA Type (Default: SMA): Selects MA for middle band (SMA, EMA, etc.); EMA for faster response.
Source (Default: Close): Price input for calculations; use close for standard accuracy.
StdDev Multiplier (Default: 1.8): Band width control; higher for fewer signals, lower for more.
Offset (Default: 0): Shifts BB plots; typically unchanged.
Use Filters (Default: True): Applies volume, trend, RSI checks to filter signals.
Volume MA Length (Default: 20): For volume filter (long: >105% avg, short: >120%).
Trend MA Length (Default: 80): SMA for trend filter (long: above MA, short: below).
RSI Length (Default: 14): For short filter (entry if RSI <85).
Use Long/Short Signals (Defaults: True): Toggles directions; long entry on lower BB crossover, short on upper crossunder.
Visuals: BB plots (blue basis, red upper, green lower), orange trend MA, filled background.
Labels/Alerts: Green/red for long entry/exit, yellow/purple for short; alert conditions included.

EUR/USD Multi-Layer Statistical Regression StrategyStrategy Overview
This advanced EUR/USD trading system employs a triple-layer linear regression framework with statistical validation and ensemble weighting. It combines short, medium, and long-term regression analyses to generate high-confidence directional signals while enforcing strict risk controls.
Core Components
Multi-Layer Regression Engine:
Parallel regression analysis across 3 customizable timeframes (short/medium/long)
Projects future price values using prediction horizons
Statistical significance filters (R-squared, correlation, slope thresholds)
Signal Validation System:
Lookback validation tests historical prediction accuracy
Ensemble weighting of layer signals (adjustable influence per timeframe)
Confidence scoring combining statistical strength, layer agreement, and validation accuracy
Risk Management:
Position sizing scaled by signal confidence (1%-100% of equity)
Daily loss circuit breaker (halts trading at user-defined threshold)
Forex-tailored execution (pip slippage, percentage-based commissions)
Visual Intelligence:
Real-time regression line plots (3 layered colors)
Projection markers for short-term forecasts
Background coloring for market bias indication
Comprehensive statistics dashboard (R-squared metrics, validation scores, P&L)
Key Parameters
Category Settings
Regression Short/Med/Long lengths (20/50/100 bars)
Statistics Min R² (0.65), Correlation (0.7), Slope (0.0001)
Validation 30-bar lookback, 10-bar projection
Risk Controls 50% position size, 12% daily loss limit, 75% confidence threshold
Trading Logic
Entries require:
Ensemble score > |0.5|
Confidence > threshold
Short & medium-term significance
Active daily loss limit not breached
Exits triggered by:
Opposite high-confidence signals
Daily loss limit violation (emergency exit)
The strategy blends quantitative finance techniques with practical trading safeguards, featuring a self-optimizing design where signal quality directly impacts position sizing. The visual dashboard provides real-time feedback on model performance and market conditions.

Breakout + Retest StrategyThe Breakout + Retest Strategy is a proven price action approach used by professional traders to catch high-probability market moves after key levels are broken. This strategy aims to enter the market after confirmation — reducing false breakouts and improving entry accuracy.
🔍 Strategy Logic:
Identify a Key Support or Resistance Level
These could be recent swing highs/lows, consolidation zones, or session highs.
Wait for a Clean Breakout
Price must decisively break above resistance or below support with strong momentum.
Watch for the Retest
After the breakout, wait for the price to pull back to the broken level (now flipped support/resistance).
Enter on Retest Confirmation
Look for signs like rejection wicks, bullish/bearish engulfing candles, or strong volume on the retest.
Set Risk-Managed Stops and Targets
Stop loss goes below (for long) or above (for short) the retested level.
Target is usually set at a 1:2 or higher risk-to-reward ratio, or based on structure.
✅ Why It Works:
Filters out fake breakouts
Uses market structure and liquidity traps to your advantage
Combines both momentum and confirmation
⚙️ Best Timeframes:
15-minute to 1-hour for intraday setups
4-hour and daily for swing trades
📊 Ideal for:
Futures (NQ, ES, Gold)
Forex pairs
Crypto
Stocks near key earnings or breakout zones

Smart Elliott Wave [The_lurker]🔷 Smart Elliott Wave – موجات إليوت الذكية
A professional indicator for automatically detecting and analyzing Elliott Wave patterns on the chart. Built on classical Elliott Wave theory, it enhances accuracy with dynamic Fibonacci validation and geometric logic—solving the most common issues traders face when applying Elliott Wave manually: complexity, subjectivity, and misinterpretation of corrections.
🎯 Key Features
Smart Elliott Wave offers a layered intelligent system that:
- Automatically detects impulsive and corrective wave structures
- Validates wave formations using Fibonacci rules
- Highlights potential reversal zones (PRZ)
- Sends instant alerts for newly detected patterns
- Supports both bullish and bearish trends
- Includes fully customizable user settings
🧠 Core Concept
The indicator analyzes price movement over time using pivot points (discovered via `ta.pivothigh` and `ta.pivotlow`) to detect wave structures that conform to Elliott Wave sequencing:
- Impulse Wave: 0-1-2-3-4-5
- Simple Correction: ABC
- Complex Correction: WXY
Each structure is validated through a strict set of logical rules combined with Fibonacci ratio checks to ensure pattern integrity and reduce false signals.
🧩 Wave Structure Components
1️⃣ Impulse Waves
- Wave 3 is not the shortest
- Wave 4 does not overlap Wave 1
- Waves 1, 3, and 5 are impulsive; Waves 2 and 4 are corrective
- Fibonacci validation can be applied to Waves 2 and 4 if enabled
2️⃣ Simple Corrections (ABC)
- Wave B partially retraces Wave A
- Wave C completes the structure without invalid overlap
- Fibonacci ratios validate the symmetry of A, B, and C (if enabled)
3️⃣ Complex Corrections (WXY)
- Only used if ABC structure is insufficient
- Requires 6 sequential pivot points: W, X, Y
- W and Y are corrective; X is a linking wave
- Follows both structural and ratio-based validations
📏 Dynamic Fibonacci Validation
When Enable Fibonacci Rules is active:
- Validates against common ratios:
`38.2%`, `50%`, `61.8%`, `78.6%`, `127.2%`, `161.8%`
- Adjustable **Fibonacci Tolerance** allows for controlled deviation
- Patterns are ignored if ratios fall outside the accepted range
🔮 Potential Reversal Zones (PRZ)
- Calculated from the most recent completed impulse wave
- Uses Fibonacci extensions to project PRZ ahead of price
- Customizable visibility and color for each ratio
- Used as dynamic take-profit or stop-loss zones
🖍️ Dual Trend Detection & Wave Coloring
- Supports both bullish and bearish patterns
- Automatic wave coloring for quick visual recognition:
- 🟦 Blue: Bullish waves
- 🟥 Red: Bearish waves
- Optional fill color for correction zones
🔔 Smart Alert System
Instant alerts are triggered when a valid wave pattern is confirmed:
- New impulse wave detected
- ABC correction appears
- Complex WXY correction formed
> Alerts are triggered only after the bar closes to prevent repainting.
⚙️ Indicator Settings
📌 Wave Detection Settings
- Pivot Left Strength: Bars to the left used for pivot detection
- Pivot Right Strength: Bars to the right for confirmation (0 = real-time)
- Enable Fibonacci Rules: Toggle Fibonacci ratio validation
- Fibonacci Tolerance: Allowed deviation in percentage
🎨 Display Settings
- Show Previous Patterns: Toggle between all patterns or only the latest
- Fill correction zones with color
- Customize wave and PRZ color schemes
📉 PRZ Settings
- Show/hide specific Fibonacci ratios
- Customize each PRZ color
- Set maximum bar extension for PRZ display
🔕 Alert Settings
- Enable or disable alerts for each type of pattern
📚 Practical Use Cases
- Daily or intraday price structure analysis
- Combine with RSI, MACD, or momentum indicators
- Filter weak signals using Fibonacci-based pattern validation
- Use PRZ zones as dynamic entry/exit targets
- Learn and reinforce Elliott Wave theory through real-time examples
📝 Important Notes
- Setting `Pivot Right = 0` allows for real-time pattern previews (may repaint)
- Disabling Fibonacci validation increases pattern count but reduces accuracy
- TradingView limits to 500 visual objects (labels, boxes, lines); older patterns may be removed
- PRZ extends up to 100 bars or 0.618 of the previous impulse duration by default
⚠️ Disclaimer:
This indicator is for educational and analytical purposes only. It does not constitute financial, investment, or trading advice. Use it in conjunction with your own strategy and risk management. Neither TradingView nor the developer is liable for any financial decisions or losses.
🔷 Smart Elliott Wave – موجات إليوت الذكية
مؤشر احترافي لرصد وتحليل أنماط موجات إليوت تلقائيًا على الرسم البياني، يعتمد على المبادئ الكلاسيكية للنظرية مع تعزيزها بالتحقق الرياضي والهندسي، ويهدف إلى تجاوز العقبات التي يواجهها معظم المتداولين عند تطبيق موجات إليوت يدويًا، مثل صعوبة التحديد، التقديرات الذاتية، وتشويش التصحيحات.
🎯 ما الذي يميز هذا المؤشر؟
يُقدّم Smart Elliott Wave نظامًا تراكبيًا ذكيًا يقوم بـ:
رصد تلقائي للموجات (الدافعة والتصحيحية)
التحقق من صحة النموذج باستخدام قواعد فيبوناتشي
عرض مناطق الانعكاس المحتملة (PRZ)
توليد تنبيهات لحظية عند تشكّل أنماط جديدة
دعم الاتجاهين (الصاعد والهابط)
واجهة إعدادات مرنة قابلة للتخصيص الكامل
🧠 الفكرة الأساسية
يعتمد المؤشر على تحليل حركة السعر عبر تسلسل زمني من النقاط المحورية (Pivots)، والتي تُكتشف باستخدام دوال مدمجة مثل ta.pivothigh وta.pivotlow. ثم يُبني فوق هذه النقاط نماذج هندسية متوافقة مع تسلسل موجات إليوت:
الموجة الدافعة (Impulse): تسلسل 0-1-2-3-4-5
التصحيح البسيط (ABC)
التصحيح المعقد (WXY)
ويتم التحقق من كل نموذج اعتمادًا على قواعد إليوت + نسب فيبوناتشي، ما يضمن موضوعية التصنيف، ودقة التحديد.
🧩 مكوّنات التحليل:
1️⃣ الموجات الدافعة (Impulse Waves):
يُشترط أن تكون الموجة الثالثة غير الأقصر.
لا تتداخل الموجة الرابعة مع نطاق الموجة الأولى.
تأكيد أن الموجات 1 و3 و5 دافعة، و2 و4 تصحيحية.
يتم التحقق من نسب تصحيح الموجتين 2 و4 حسب قواعد فيبوناتشي عند تفعيلها.
2️⃣ التصحيح البسيط (ABC):
B تصحيح جزئي للموجة A.
C تُكمل الهيكل بدون تداخل مع A.
يتم التحقق من أطوال الموجات وفق نسب فيبوناتشي لضمان التناسق.
3️⃣ التصحيح المعقد (WXY):
لا يتم تفعيله إلا عند فشل ABC في تفسير النمط.
يتطلب 6 نقاط محورية متسلسلة: W, X, Y.
W وY تصحيحيتان، وX رابط مركزي.
يخضع أيضًا لقواعد النسب والتماثل البنائي.
📏 التحقق باستخدام نسب فيبوناتشي:
عند تفعيل خاصية Enable Fibonacci Rules، يتم التحقق الصارم من نسب تصحيح الموجات:
النسب المعتمدة:
38.2%, 50%, 61.8%, 78.6%, 127.2%, 161.8%
إذا لم تكن الموجة ضمن نطاق النسبة + نسبة التسامح (Tolerance)، يتم تجاهل النموذج.
يُستخدم هذا التحقق أيضًا لرسم مناطق الانعكاس المحتملة (PRZ).
🔮 مناطق الانعكاس المحتملة (PRZ)
تُحسب PRZ باستخدام نسب فيبوناتشي انطلاقًا من نهاية آخر موجة دافعة.
تُعرض بشكل مستطيلات شفافة أو ملونة.
يمكن تخصيص كل نسبة لونًا وشكلًا خاصًا.
تُستخدم PRZ كأداة توقع للموجة التالية أو لتحديد أهداف وقف الخسارة وجني الأرباح ديناميكيًا.
🖍️ دعم الاتجاهين وتلوين الموجات:
يدعم المؤشر النماذج الصاعدة والهابطة بشكل تلقائي.
يتم استخدام تلوين بصري لتسهيل التمييز:
الأزرق: للموجات الصاعدة
الأحمر: للموجات الهابطة
لون تعبئة مخصص لمناطق التصحيح
🔔 نظام التنبيهات الذكية
يحتوي المؤشر على تنبيهات تلقائية يتم تفعيلها عند اكتمال أي نمط جديد.
يدعم التنبيهات التالية:
موجة دافعة جديدة
تصحيح بسيط ABC
تصحيح معقد WXY
التنبيهات تُطلق بعد إغلاق الشمعة التي تحقق فيها النموذج (غير فوري Repainting-safe)
⚙️ إعدادات المؤشر
📌 إعدادات تحليل الموجة:
Pivot Left Strength: عدد الأعمدة (bars) إلى اليسار لتحديد الانعكاس
Pivot Right Strength: الأعمدة إلى اليمين لتأكيد الانعكاس (0 يعني تنبؤ لحظي)
Enable Fibonacci Rules: تفعيل/تعطيل التحقق من فيبوناتشي
Fibonacci Tolerance: نسبة التفاوت المقبولة بالنسب المئوية
🎨 إعدادات العرض:
Show Previous Patterns: إظهار كل الأنماط المكتشفة أو آخر نمط فقط
PRZ Settings:
إظهار أو إخفاء نسب معينة
تخصيص الألوان
تحديد امتداد مربع PRZ زمنيًا (Max Bars)
🔕 إعدادات التنبيهات:
تفعيل/تعطيل تنبيه عند كل نمط جديد
📚 حالات الاستخدام العملية:
تحليل الحركة السعرية في بداية كل جلسة
دمج المؤشر مع أدوات مثل RSI أو MACD للحصول على إشارات مركّبة
مراقبة الموجات التوسعية والتصحيحية على فواصل 4H / Daily
استخدام PRZ كأداة لتحديد الأهداف أو وقف الخسارة
التعلم العملي لنظرية إليوت من خلال أمثلة حية
📝 ملاحظات مهمة:
تعيين Pivot Right = 0 يعني نقاط فورية (قد يعاد رسمها لاحقًا)
تعطيل فيبوناتشي يزيد عدد النماذج، لكن قد يُضعف دقتها
TradingView يحد عدد الكائنات المرسومة (Labels, Boxes, Lines) إلى 500، مما قد يؤدي إلى حذف الأنماط الأقدم تلقائيًا
PRZ يمتد افتراضيًا حتى 100 شمعة، أو 0.618 من مدة الموجة الدافعة السابقة
⚠️ إخلاء مسؤولية:
هذا المؤشر لأغراض تعليمية وتحليلية فقط. لا يُمثل نصيحة مالية أو استثمارية أو تداولية. استخدمه بالتزامن مع استراتيجيتك الخاصة وإدارة المخاطر. لا يتحمل TradingView ولا المطور مسؤولية أي قرارات مالية أو خسائر.

BE-Indicator Aggregator toolkit█ Overview:
BE-Indicator Aggregator toolkit is a toolkit which is built for those we rely on taking multi-confirmation from different indicators available with the traders. This Toolkit aid's traders in understanding their custom logic for their trade setups and provides the summarized results on how it performed over the past.
█ How It Works:
Load the external indicator plots in the indicator input setting
Provide your custom logic for the trade setup
Set your expected SL & TP values
█ Legends, Definitions & Logic Building Rules:
Building the logic for your trade setup plays a pivotal role in the toolkit, it shall be broken into parts and toolkit aims to understand each of the logical parts of your setup and interpret the outcome as trade accuracy.
Toolkit broadly aims to understand 4 types of inputs in "Condition Builder"
Comments : Line which starts with single quotation ( ' ) shall be ignored by toolkit while understanding the logic.
Note: Blank line space or less than 3 characters are treated equally to comments.
Long Condition: Line which starts with " L- " shall be considered for identifying Long setups.
Short Condition: Line which starts with " S- " shall be considered for identifying Short setups.
Variables: Line which starts with " VAR- " shall be considered as variables. Variables can be one such criteria for Long or short condition.
Building Rules: Define all variables first then specify the condition. The usual declare and assign concept of programming. :p)
Criteria Rules: Criteria are individual logic for your one parent condition. multiple criteria can be present in one condition. Each parameter should be delimited with ' | ' key and each criteria should be delimited with ' , ' (Comma with a space - IMPORTANT!!!)
█ Sample Codes for Conditional Builder:
For Trading Long when Open = Low
For Trading Short when Open = High with a Red candle
'Long Setup <---- Comment
L-O|E|L
' E <- in the above line refers to Equals ' = '
'Short Setup
S-AND:O|E|H, O|G|C
' 2 Criteria for used building one condition. Since, both have to satisfied used "AND:" logic.
Understanding of Operator Legends:
"E" => Refers to Equals
"NE" => Refers to Not Equals
"NEOR" => Logical value is Either Comparing value 1 or Comparing value 2
"NEAND" => Logical value is Comparing value 1 And Comparing value 2
"G" => Logical value Greater than Comparing value 1
"GE" => Logical value Greater than and equal to Comparing value 1
"L" => Logical value Lesser than Comparing value 1
"LE" => Logical value Lesser than and equal to Comparing value 1
"B" => Logical value is Between Comparing value 1 & Comparing value 2
"BE" => Logical value is Between or Equal to Comparing value 1 & Comparing value 2
"OSE" => Logical value is Outside of Comparing value 1 & Comparing value 2
"OSI" => Logical value is Outside or Equal to Comparing value 1 & Comparing value 2
"ERR" => Logical value is 'na'
"NERR" => Logical value is not 'na'
"CO" => Logical value Crossed Over Comparing value 1
"CU" => Logical value Crossed Under Comparing value 1
Understanding of Condition Legends:
AND: -> All criteria's to be satisfied for the condition to be True.
NAND: -> Output of AND condition shall be Inversed for the condition to be True.
OR: -> One of criteria to be satisfied for the condition to be True.
NOR: -> Output of OR condition shall be Inversed for the condition to be True.
ATLEAST:X: -> At-least X no of criteria to be satisfied for the condition to be True.
Note: "X" can be any number
NATLEAST:X: -> Output of ATLEAST condition shall be Inversed for the condition to be True
WASTRUE:X: -> Single criteria WAS TRUE within X bar in past for the condition to be True.
Note: "X" can be any number.
ISTRUE:X: -> Single criteria is TRUE since X bar in past for the condition to be True.
Note: "X" can be any number.
Understanding of Variable Legends:
While Condition Supports 8 Types, Variable supports only 6 Types listed below
AND: -> All criteria's to be satisfied for the Variable to be True.
NAND: -> Output of AND condition shall be Inversed for the Variable to be True.
OR: -> One of criteria to be satisfied for the Variable to be True.
NOR: -> Output of OR condition shall be Inversed for the Variable to be True.
ATLEAST:X: -> At-least X no of criteria to be satisfied for the Variable to be True.
Note: "X" can be any number
NATLEAST:X: -> Output of ATLEAST condition shall be Inversed for the Variable to be True
█ Sample Outputs with Logics:
1. RSI Indicator + Technical Indicator: StopLoss: 2.25 against Reward ratio of 1.75 (3.94 value)
Plots Used in Indicator Settings:
Source 1:- RSI
Source 2:- RSI Based MA
Source 3:- Strong Buy
Source 4:- Strong Sell
Logic Used:
For Long Setup : RSI Should be above RSI Based MA, RSI has been Rising when compared to 3 candles ago, Technical Indicator signaled for a Strong Buy on the current candle, however in last 6 candles Technical indicator signaled for Strong Sell.
Similarly Inverse for Short Setup.
L-AND:ES1|GE|ES2, ES1|G|ES1
L-ES3|E|1
L-OR:ES4 |E|1, ES4 |E|1, ES4 |E|1, ES4 |E|1, ES4 |E|1, ES4 |E|1
S-AND:ES1|LE|ES2, ES1|L|ES1
S-ES4|E|1
S-OR:ES3 |E|1, ES3 |E|1, ES3 |E|1, ES3 |E|1, ES3 |E|1, ES3 |E|1
'Note: Last OR condition can also be written by using WASTRUE definition like below
'L-WASTRUE:6:ES4|E|1
'S-WASTRUE:6:ES3|E|1
Output:
2. Volumatic Support / Resistance Levels :
Plots Used in Indicator Settings:
Source 1:- Resistance
Source 2:- Support
Logic Used:
For Long Setup : Long Trade on Liquidity Support.
For Short Setup : Short Trade on Liquidity Resistance.
'Variable Named "ChkLowTradingAbvSupport" is declared to check if last 3 candles is trading above support line of liquidity.
VAR-ChkLowTradingAbvSupport:AND:L|G|ES2, L |G|ES2, L |G|ES2
'Variable Named "ChkCurBarClsdAbv4thBarHigh" is declared to check if current bar closed above the high of previous candle where the Liquidity support is taken (4th Bar).
VAR-ChkCurBarClsdAbv4thBarHigh:OR:C|GE|H , L|G|H
'Combining Condition and Variable to Initiate Long Trade Logic
L-L |LE|ES2
L-AND:ChkLowTradingAbvSupport, ChkCurBarClsdAbv4thBarHigh
VAR-ChkHghTradingBlwRes:AND:H|L|ES1, H |L|ES1, H |L|ES1
VAR-ChkCurBarClsdBlw4thBarLow:OR:C|LE|L , H|L|L
S-H |GE|ES1
S-AND:ChkHghTradingBlwRes, ChkCurBarClsdBlw4thBarLow
Output 1: Day Trading Version
Output 2: Scalper Version
Output 3: Position Version

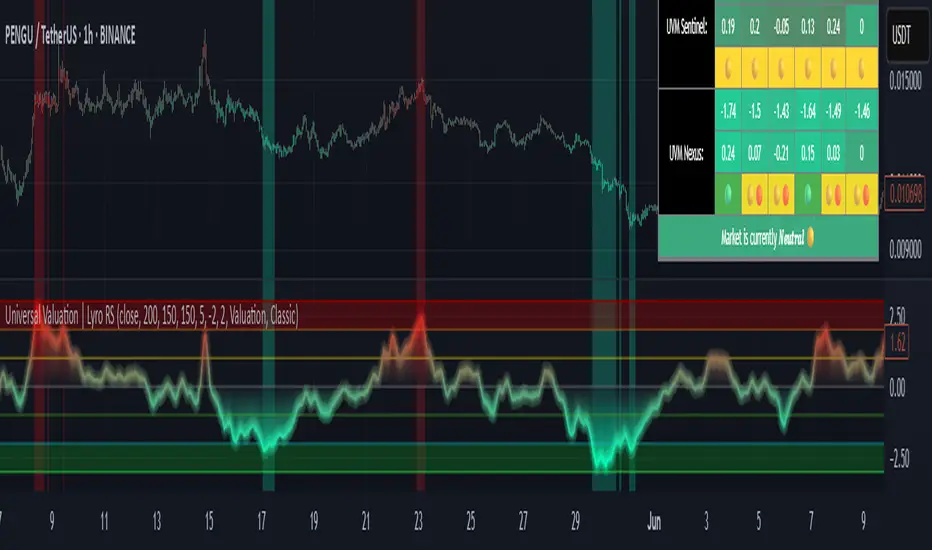
Universal Valuation | Lyro RSUniversal Valuation
⚠️Disclaimer: This indicator is a tool for technical analysis and does not provide guaranteed results. It should be used in conjunction with other analysis methods and proper risk management practices. The creators of this indicator are not responsible for any financial decisions made based on its signals.
Overview
The Universal Valuation indicator helps identify whether the market is undervalued/cheap or overvalued/expensive. And another mode this indicator offers is This cutting-edge tool works flawlessly ACROSS ALL TIMEFRAMES & TICKERS/CHARTS.
By combining regular TradingView indicators & some of our valuation indicators basic/simple with advanced statistical functions, this indicator offers a powerful, universal valuation tool.
Key Features
INPUTS: The Universal Valuation indicator offers flexibility through its customizable input sections. The "Indicator Settings" let you adjust lengths for the raw indicators and statistical functions. The "Signals" section defines thresholds for background color changes, helping you visually spot key market moments. The "Colors" section allows you to pick from pre-defined schemes or personalize colors for better clarity. Lastly, the "Tables" section gives you full control over the UV table’s size and positioning, including options to overlay it on the chart or place it in the allocated space.
A DEEPER INSIGHT: This indicator is built around three distinct categories: "UVM Andromeda," "UVM Sentinel," and "UVM Nexus." Each category has three different drivers. The statistical function powering this indicator is the Z-score. The Z-score is an incredibly powerful tool that helps determine if the market is overvalued/expensive or undervalued/cheap, offering critical insights for traders."
Plotting: The plotted value represents the average of all the drivers. In other words, it is the combined average of all 9 Z-scored indicators, providing a balanced and comprehensive market valuation.
What is Z-score? & Why does this system use it?
Z-score is an advanced statistical function used to measure how far a value deviates from the average in a data set. The formula for Z-score is: (x - h) / o, where x is the observed value, h is the average (mean) of the data set, and o is the standard deviation.
This system uses the Z-score because it helps determine whether the market is overvalued or undervalued based on historical data and how we apply the calculation. By measuring how far a value deviates from the average, the Z-score provides a clearer and more objective valuation of market conditions. In our case, a Z-score of -3 indicates an undervalued market, while a Z-score of 3 signals an overvalued market.
UVM Andromeda:
UVM stands for Universal Valuation Model, which is the core of this indicator. Andromeda, one of the most stunning galaxies in the universe, inspired by its name. We chose this name because a powerful indicator should not only be effective but also visually appealing.
You might be wondering what drives UVM Andromeda. The three key drivers are Price, RSI, and ROC. These indicators are pre-defined, while the "Indicator Settings" allow you to adjust the length of the Z-score calculation, refining how the model analyzes market conditions.
UVM Sentinel:
Sentinel, refers to a guard or watchman, someone or something that keeps watch and provides protection. In our case this name refers to a model that actively observes market conditions, acting as a vigilant tool that signals important shifts in valuation.
Wondering what drives UVM Sentinel? The three key drivers are BB%, CCI, and Crosby. While these indicators are simple on their own, applying our Z-score function elevates them to a whole new level, enhancing their ability to detect market conditions with greater accuracy.
UVM Nexus:
We chose the name Nexus simply because it sounds cool—there’s no deeper meaning behind it for us. However, the word itself does have a meaning; it refers to a connection or link between multiple things.
The three key drivers for UVM Nexus are the Sharpe, Sortino, and Omega ratios. These are all asset performance metrics, but by applying the Z-score, we transform them into powerful valuation indicators/drivers, giving you a deeper insight into market conditions.
Why do we use 9 different indicators instead of 1?
That's a great question, and the answer is quite simple. Think of it like this: if you have one super soldier, and they miss a shot, it’s game over. But if you have many soldiers, even if one misses, the others can step in and take the shot. The strength of using multiple indicators lies in their collective power – if one misses, the others still provide valuable insights, making the overall system more reliable.
Final Thoughts:
In our Universal Valuation indicator, you have the flexibility to customize it however you like using our inputs. The system is divided into three distinct categories, with each category containing three indicators. The value plotted on the chart is the average of all nine indicators. We apply the Z-score, an advanced statistical function, to each of these nine indicators. The final plotted average is the average of all the Z-scores, giving you a comprehensive and refined market valuation. This indicator can work on any timeframe & chart ticker.
20-Day SMA BIAS%20-day Bias is a commonly used indicator in technical analysis. It is used to measure the gap between the stock price and its 20-day moving average to determine whether the stock price deviates from the normal state and whether there is an overbought or oversold phenomenon.
How to calculate the 20-day deviation value:
The calculation formula of the deviation rate is: ((closing price of the day - 20-day moving average price) / 20-day moving average price) * 100%.
Interpretation of 20-day deviation value:
Positive deviation rate:
Indicates that the stock price is higher than the 20-day moving average, which means that the stock price is high and may face correction pressure.
Negative deviation rate:
Indicates that the stock price is lower than the 20-day moving average, which means that the stock price is low and there may be a rebound opportunity.
Absolute value of the deviation rate:
The larger the absolute value, the higher the deviation of the stock price, and the higher the degree of overbought or oversold.
Apply the deviation rate to determine the buying and selling opportunities:
Positive deviation rate is too large:
When the positive deviation rate of the stock price from the 20-day moving average is too large, and the stock price is already at a high level, this may be a sell signal.
Negative deviation rate is too large:
When the negative deviation rate of the stock price from the 20-day moving average is too large, and the stock price is already at a low level, this may be a buy signal.
Stock price fluctuates around the moving average:
Stock price usually fluctuates around the moving average and adjusts after over-rising or over-falling.
Practical operation suggestions:
The standards of the market and individual stocks are different:
When the positive and negative deviation rate of the market and the quarterly line is greater than 5%, there is a greater chance of correction; large-cap stocks are between 5% and 10%; small and medium-sized stocks may be above 15% to 20%.
Combined with other indicators:
The deviation rate is only one of the technical analysis indicators. It is recommended to combine it with other indicators, such as KD indicators, RSI, etc., to make a comprehensive judgment and improve accuracy.
Reference to historical experience:
You can refer to the situation where the deviation rate of the stock was too large in the past to determine whether the current deviation rate is also too large.
Summary:
The 20-day deviation value is an indicator to determine whether the stock price is overbought or oversold, which can help investors determine the timing of buying and selling, but it needs to be combined with other indicators and historical data, and adjusted according to market conditions.

Eliora Gold 1min (Heikin Ashi)Eliora -focused trading strategy designed for anything on the 1-minute timeframe using Heikin Ashi candles. This mode combines advanced market logic with structured risk management to deliver smooth, disciplined trade execution.
Key Features:
✅ Trend Confirmation – Aligns with dominant market direction for higher accuracy.
✅ ATR-Based Volatility Filter – Avoids high-risk conditions and chaotic price action.
✅ Candle Strength Logic – Filters weak setups, focusing on strong momentum.
✅ Balanced Risk/Reward – Calculates stop-loss and take-profit dynamically for consistent results.
✅ Cooldown & Overtrade Protection – Limits frequency to maintain trade quality.
This version of Eliora is built for scalpers and intraday traders seeking high-probability entries with graceful exits.

Fractal Pullback Market StructureFractal Pullback Market Structure
Author: The_Forex_Steward
License: Mozilla Public License 2.0
The Fractal Pullback Market Structure indicator is a sophisticated price action tool designed to visualize internal structure shifts and break-of-structure (BoS) events with high accuracy. It leverages fractal pullback logic to identify market swing points and confirm whether a directional change has occurred.
This indicator detects swing highs and lows based on fractal behavior, drawing zigzag lines to connect these key pivot points. It classifies and labels each structural point as either a Higher High (HH), Higher Low (HL), Lower High (LH), or Lower Low (LL). Internal shifts are marked using triangle symbols on the chart, distinguishing bullish from bearish developments.
Break of Structure events are confirmed when price closes beyond the most recent swing high or low, and a horizontal line is drawn at the breakout level. This helps traders validate when a structural trend change is underway.
Users can configure the lookback period that defines the sensitivity of the pullback detection, as well as a timeframe multiplier to align the logic with higher timeframes such as 4H or Daily. There are visual customization settings for the zigzag lines and BoS markers, including color, width, and style (solid, dotted, or dashed).
Alerts are available for each key structural label—HH, HL, LH, LL—as well as for BoS events. These alerts are filtered through a selectable alert mode that separates signals by timeframe category: Low Timeframe (LTF), Medium Timeframe (MTF), and High Timeframe (HTF). Each mode allows the user to receive alerts only when relevant to their strategy.
This indicator excels in trend confirmation and reversal detection. Traders can use it to identify developing structure, validate internal shifts, and anticipate breakout continuation or rejection. It is particularly useful for Smart Money Concept (SMC) traders, swing traders, and those looking to refine entries and exits based on price structure rather than lagging indicators.
Visual clarity, adaptable timeframe logic, and precise structural event detection make this tool a valuable addition to any price action trader’s toolkit.

IU Inside/Harami candlestick patternDESCRIPTION
The IU Inside/Harami Candlestick Pattern indicator is designed to detect bullish and bearish inside bar formations, also known as Harami patterns. This tool gives users flexibility by allowing pattern detection based on candle wicks, bodies, or a combination of both. It highlights detected patterns using colored boxes and optional text labels on the chart, helping traders quickly identify areas of consolidation and potential reversals.
USER INPUTS :
Pattern Recognition Based on =
Choose between "Wicks", "Body", or "Both" to determine how the inside candle pattern is identified.
Show Box =
Toggle the appearance of colored boxes that highlight the pattern zone.
Show Text =
Toggle on-screen labels for "Bullish Inside" or "Bearish Inside" when patterns are detected.
INDICATOR LOGIC :
Bullish Inside Bar (Harami) is detected when:
* The current candle's high is lower and low is higher than the previous candle (wick-based),
* or the current candle’s open and close are inside the previous candle’s body (body-based),
* and the current candle is bullish while the previous is bearish.
Bearish Inside Bar (Harami) is detected when:
* The current candle's high is lower and low is higher than the previous candle (wick-based),
* or the current candle’s open and close are inside the previous candle’s body (body-based),
* and the current candle is bearish while the previous is bullish.
The user can choose wick-based, body-based, or both logics for pattern confirmation.
Boxes are drawn between the highs and lows of the pattern, and alert messages are generated upon confirmation.
Optional labels show the pattern name for quick visual identification.
WHY IT IS UNIQUE :
Offers three different logic modes: wick-based, body-based, or combined.
Highlights patterns visually with customizable boxes and labels.
Includes built-in alerts for immediate notifications.
Uses clean and transparent plotting without repainting.
HOW USER CAN BENEFIT FROM IT :
Receive real-time alerts when Inside/Harami patterns are formed.
Use the boxes and text labels to spot price compression zones and breakout potential.
Combine it with other tools like trendlines or support/resistance for enhanced accuracy.
Suitable for scalpers, swing traders, and price action traders looking to trade inside bar breakouts or reversals.
DISCLAIMER :
This indicator is not financial advice, it's for educational purposes only highlighting the power of coding( pine script) in TradingView, I am not a SEBI-registered advisor. Trading and investing involve risk, and you should consult with a qualified financial advisor before making any trading decisions. I do not guarantee profits or take responsibility for any losses you may incur.

Fibonacci Retracement Engine (DFRE) [PhenLabs]📊 Fibonacci Retracement Engine (DFRE)
Version: PineScript™ v6
📌 Description
Dynamic Fibonacci Retracement Engine (DFRE) is a sophisticated technical analysis tool that automatically detects important swing points and draws precise Fibonacci retracement levels on various timeframes. The intelligent indicator eliminates the subjectivity of manual Fibonacci drawing using intelligent swing detection algorithms combined with multi timeframe confluence analysis.
Built for professional traders who demand accuracy and consistency, DFRE provides real time Fibonacci levels that adapt to modifications in market structure without sacrificing accuracy in changing market conditions. The indicator excels at identifying key support and resistance levels where price action is more likely to react, giving traders a potent edge in entry and exit timing.
🚀 Points of Innovation
Intelligent Swing Detection Algorithm : Advanced pivot detection with customizable confirmation bars and minimum swing percentage thresholds
Multi-Timeframe Confluence Engine : Simultaneous analysis across three timeframes to identify high-probability zones
Dynamic Level Management : Automatically updates and manages multiple Fibonacci sets while maintaining chart clarity
Adaptive Visualization System : Smart labeling that shows only the most relevant levels based on user preferences
Real-Time Confluence Detection : Identifies zones where multiple Fibonacci levels from different timeframes converge
Automated Alert System : Comprehensive notifications for level breakouts and confluence zone formations
🔧 Core Components
Swing Point Detection Engine : Uses pivot high/low calculations with strength confirmation to identify significant market turns
Fibonacci Calculator : Automatically computes standard retracement levels (0.236, 0.382, 0.5, 0.618, 0.786, 0.886) plus extensions (1.272, 1.618)
Multi-Timeframe Security Function : Safely retrieves Fibonacci data from higher timeframes without repainting
Confluence Analysis Module : Mathematically identifies zones where multiple levels cluster within specified thresholds
Dynamic Drawing Management : Efficiently handles line and label creation, updates, and deletion to maintain performance
🔥 Key Features
Customizable Swing Detection : Adjust swing length (3-50 bars) and strength confirmation (1-10 bars) to match your trading style
Selective Level Display : Choose which Fibonacci levels to show, from core levels to full extensions
Multi-Timeframe Analysis : Analyze up to 3 different timeframes simultaneously for confluence identification
Intelligent Labeling System : Options to show main levels only or all levels, with latest-set-only functionality
Visual Customization : Adjustable line width, colors, and extension options for optimal chart clarity
Performance Optimization : Limit maximum Fibonacci sets (1-5) to maintain smooth chart performance
Comprehensive Alerting : Get notified on level breakouts and confluence zone formations
🎨 Visualization
Dynamic Fibonacci Lines : Color-coded lines (green for uptrends, red for downtrends) with customizable width and extension
Smart Level Labels : Precise level identification with both ratio and price values displayed
Confluence Zone Highlighting : Visual emphasis on areas where multiple timeframe levels converge
Clean Chart Management : Automatic cleanup of old drawing objects to prevent chart clutter
Responsive Design : All visual elements adapt to different chart sizes and timeframes
📖 Usage Guidelines
Swing Detection Settings
Swing Detection Length - Default: 25 | Range: 3-50 | Controls the lookback period for identifying pivot points. Lower values detect more frequent swings but may include noise, while higher values focus on major market turns.
Swing Strength (Confirmation Bars) - Default: 2 | Range: 1-10 | Number of bars required to confirm a swing point. Higher values reduce false signals but increase lag.
Minimum Swing % Change - Default: 1.0% | Range: 0.1-10.0% | Minimum percentage change required to register a valid swing. Filters out insignificant price movements.
Fibonacci Level Settings
Individual Level Toggles : Enable/disable specific Fibonacci levels (0.236, 0.382, 0.5, 0.618, 0.786, 0.886)
Extensions : Show projection levels (1.272, 1.618) for target identification
Multi-Timeframe Settings
Timeframe Selection : Choose three higher timeframes for confluence analysis
Confluence Threshold : Percentage tolerance for level clustering (0.5-5.0%)
✅ Best Use Cases
Swing Trading : Identify optimal entry and exit points at key retracement levels
Confluence Trading : Focus on high-probability zones where multiple timeframe levels align
Support/Resistance Trading : Use dynamic levels that adapt to changing market structure
Breakout Trading : Monitor level breaks for momentum continuation signals
Target Setting : Utilize extension levels for profit target placement
⚠️ Limitations
Lagging Nature : Requires confirmed swing points, which means levels appear after significant moves
Market Condition Dependency : Works best in trending markets; less effective in extremely choppy conditions
Multiple Signal Complexity : Multiple timeframe analysis may produce conflicting signals requiring experience to interpret
Performance Considerations : Multiple Fibonacci sets and MTF analysis may impact indicator loading time on slower devices
💡 What Makes This Unique
Automated Precision : Eliminates manual drawing errors and subjective level placement
Multi-Timeframe Intelligence : Combines analysis from multiple timeframes for superior confluence detection
Adaptive Management : Automatically updates and manages multiple Fibonacci sets as market structure evolves
Professional-Grade Alerts : Comprehensive notification system for all significant level interactions
🔬 How It Works
Step 1 - Swing Point Identification : Scans price action using pivot high/low calculations with specified lookback periods, applies confirmation logic to eliminate false signals, and calculates swing strength based on surrounding price action for quality assessment.
Step 2 - Fibonacci Level Calculation : Automatically computes retracement and extension levels between confirmed swing points, creates dynamic level sets that update as new swing points are identified, and maintains multiple active Fibonacci sets for comprehensive market analysis.
Step 3 - Multi-Timeframe Confluence : Retrieves Fibonacci data from higher timeframes using secure request functions, analyzes level clustering across different timeframes within specified thresholds, and identifies high-probability zones where multiple levels converge.
💡 Note: This indicator works best when combined with other technical analysis tools and proper risk management. The multi-timeframe confluence feature provides the highest probability setups, but always confirm signals with additional analysis before entering trades.

Random Coin Toss Strategy📌 Overview
This strategy is a probability-based trading simulation that randomly decides trade direction using a coin-toss mechanism and executes trades with a customizable risk-reward ratio. It's designed primarily for testing entry frequency and risk dynamics, not predictive accuracy.
🎯 Core Concept
Every N bars (configurable), the strategy performs a pseudo-random coin toss.
Based on the result:
If heads → Buy
If tails → Sell
Once a position is opened, it sets a Stop-Loss (SL) and Take-Profit (TP) based on a multiple of the current ATR (Average True Range) value.
⚙️ Configurable Inputs
ATR Length Period for ATR calculation, determines volatility basis.
SL Multiplier SL distance = ATR × multiplier (e.g., 1.0 means 1x ATR) .
TP Multiplier TP distance = ATR × multiplier (e.g., 2.0 = 2x ATR) .
Entry Frequency Bars to wait between each new coin toss decision.
Show TP/SL Zones Toggle on/off for drawing visual TP and SL zones.
Box Size Number of bars used to define the width of the TP/SL boxes.
🔁 Entry & Exit Logic
Entry:
Happens only when no current position exists and it's the correct bar interval.
Entry direction is randomly decided.
Exit:
Positions exit at either:
Take-Profit (TP) level
Stop-Loss (SL) level
Both are calculated using the configured ATR-based distances.
🖼️ Visual Features
TP and SL zones:
Rendered as shaded rectangles (boxes) only once per trade.
Green box for TP zone, red box for SL zone.
Automatically deleted and redrawn for each new trade to avoid chart clutter.
ATR Display Table:
A minimal info table at the top-right shows the current ATR value.
Updates every few bars for performance.
🧪 Use Cases
Ideal for risk-reward modeling, strategy prototyping, and understanding how volatility-based SL/TP behavior affects results.
Great for backtesting frequency, RR tweaks (e.g., 2:5 or 3:1), and execution structure in random conditions.
⚠️ Disclaimer
Since the trade direction is random, this script is not meant for predictive trading but serves as a powerful experiment framework for studying how SL, TP, and volatility interact with random chance in a controlled, repeatable system.

Your trading time period background fillThis script allows you to add background highlights to charts during any regional trading session, customize your own trading time, and is precise and customizable yet simple and easy to use, making it more convenient to review transactions.
Support global mainstream time zones: The drop-down list includes 30 commonly used IANA time zones (default is Asia/Shanghai) (such as Asia/Shanghai, America/New_York, Europe/London, etc.), one-click switching, no need to manually calculate the time difference.
Fully localized time input: "Start hour/minute" and "End hour/minute" are filled in with the local time of the selected time zone. The end hour defaults to 23:00 and can be adjusted to 0-23 at will.
Accurate time difference splitting: The script internally splits the time zone offset into whole hours and remainder minutes (supports half-hour zones, such as UTC+5:30), and ensures that all parameters are integers when calling timestamp to avoid errors.
Dynamic background rendering: Each K-line is judged according to the UTC timestamp whether it falls within the set range. If it meets the time period, it will be marked with a semi-transparent green background, and it will return to its original state after crossing the time period, helping you to identify the opening, closing or active period of any market at a glance.
Wide range of scenarios: It can be used for time-sharing highlighting of all-weather varieties of foreign exchange and cryptocurrency, and can also be used in conjunction with backtesting and timing strategies to only send signals during the active period of the target market, greatly improving trading efficiency and strategy accuracy.
Just select the region and set the time, and the script will automatically complete all complex time zone conversions and drawing, allowing you to focus on the transaction itself.
Smart Money Trap SignalSmart Money Trap Signal – Indicator Description
The Smart Money Trap Signal is a precision-based trading tool designed to identify areas where institutional traders (smart money) are likely to trap retail traders through false breakouts and liquidity grabs. These traps often occur near key highs and lows, where retail traders are lured into trades just before price reverses sharply.
🔍 Key Features:
Liquidity Sweep Detection
Identifies false breakouts of recent swing highs or lows, signaling potential liquidity grabs by large players.
Reversal Confirmation
Confirms the trap using a classic price action reversal pattern (bullish or bearish engulfing), helping filter out weak signals.
Optional Volume Spike Filter
Allows additional confirmation based on a significant spike in volume, indicating potential institutional involvement.
Buy and Sell Trap Signals
🔴 Smart Money Short (SMT↓) – Triggered when price sweeps a high and reverses down.
🟢 Smart Money Long (SMT↑) – Triggered when price sweeps a low and reverses up.
Alerts & Labels
Real-time alert conditions and on-chart labels to help you catch setups without missing opportunities.
📈 How to Use:
Apply on Higher Timeframes (1H, 4H, Daily) for cleaner signals.
Look for SMT signals at key supply/demand zones or market structure points.
Combine with your existing trading strategy, such as order blocks or break of structure (BoS), for higher accuracy.
Use volume filter only if you're analyzing markets where volume data is reliable.
⚠️ Disclaimer:
This tool is meant to assist with trade identification, not trade execution. Always use proper risk management and validate setups with your trading plan.
Dual Supertrend Pro|ask2maniishDual Supertrend | ask2maniish
🔍 Overview
The Dual Supertrend indicator overlays two distinct Supertrend layers (Main & Fast) to deliver enhanced trend detection, signal filtering, and trade management. It combines traditional ATR-based trend logic with an optional dynamic risk model and visual trade tracking tools — ideal for intraday scalping, swing trading, or institutional-style strategies.
⚙️ Key Features
🔁 Dual Supertrend Logic: Combines a Main and Fast Supertrend for multi-layer confirmation.
🧠 Smart Entry Signals: Generates buy/sell signals only when both layers agree (combined confirmation).
🎯 Dynamic Trade Management:
Entry/SL/Target logic using ATR.
Auto Breakeven, Trailing SL, and Exit after Target 3.
📊 Trade State Dashboard:
On-chart table showing live status, targets, and trade side.
Visual labels for entry, SL hit, and each target.
🧾 Tooltip for SL Settings: Detailed ATR configurations based on strategy style (Scalping, Swing, Institutional, etc.).
🧠 Use Cases
Strategy Type ATR Period Multiplier Notes
Conservative Trading 14 1.0 – 1.5× Balanced, avoids whipsaws, better R:R
Volatile Markets 21 1.5 – 2.5× For crypto, indices, strong trends
Intraday Scalping 5 – 10 0.5 – 1.0× Tighter SLs for rapid trades
Swing Trades 14 – 21 1.5 – 3.0× Handles spikes, rides long trends
Institutional Logic Dynamic 1.5× below OB SL below CHoCH or Order Block structure zones
You can view this tooltip in the Trade Management group inputs.
🧰 Inputs
📌 Supertrend (Main)
ATR Period
ATR Multiplier
ATR Method (SMA/True Range)
Signal Toggle
Highlight Toggle
⚡ Supertrend (Fast)
ATR Period (Shorter)
ATR Multiplier (Smaller)
ATR Method (SMA/True Range)
Signal Toggle
Highlight Toggle
🎯 Trade Management
SL & Target ATR Period
Target Multiplier
Auto Exit after Target 3
Entry/Exit Label Toggle
Target Hit Label Toggle
Show SL/Target Lines
🧮 Trend State Table
Location Selectable
Combined Trend Label: Strong Up 🔼 / Down 🔽 / Mixed ⚠️
📈 Signals & Alerts
Trigger alerts for all the following:
Main Supertrend Buy/Sell
Fast Supertrend Buy/Sell
Confirmed Combined Buy/Sell when both layers align
📊 Visualization
📉 Supertrend bands with optional background fill
✅ Entry label with trend direction
🎯 Target hit labels with color-coded levels
🧾 Trade Dashboard with real-time trade info
📌 Best Practices
Use combined signals (CB, CS) for filtered trend entries.
Adjust ATR multiplier based on market volatility.
Use in confluence with SMC, OB, or CHoCH zones for higher accuracy.
Enable trade table for real-time tracking of SL and targets.
👨💻 Credits
Script developed by @ask2maniish, with adaptive trade logic and dual-layer Supertrend logic optimized for precision entries and automated exits.
Engulfing Bar AggressiveEngulfing Bar Aggressive
Engulfing Bar Aggressive is a precise price action indicator designed to detect strong bullish and bearish engulfing patterns in an aggressive way. This tool is perfect for traders who want early and confirmed signals based purely on candle formations, without relying on any indicators or moving averages.
🔍 Core Logic
The indicator scans for 2-bar engulfing patterns with additional strict conditions:
Bullish Engulfing
Current candle closes bullish (close > open).
Previous candle closes bearish (close < open ).
Current close completely engulfs previous open and high.
Current open is below previous close.
Signal triggers only after bar closure (confirmed pattern).
Bearish Engulfing
Current candle closes bearish (close < open).
Previous candle closes bullish (close > open ).
Current close completely engulfs previous open and low.
Current open is above previous close.
Signal triggers only after bar closure (confirmed pattern).
🛠 Features
Clear visual markers on the chart (green for bullish, red for bearish).
Configurable generic alert to receive notifications for any engulfing pattern detected.
Dedicated alerts for bullish and bearish engulfing setups.
Works on any timeframe and any market.
🎯 Use Case
Ideal for breakout traders, reversal traders, or as part of a multi-factor strategy.
Can be combined with support/resistance zones, ATR exhaustion levels, or trend filters for enhanced accuracy.

Tensor Market Analysis Engine (TMAE)# Tensor Market Analysis Engine (TMAE)
## Advanced Multi-Dimensional Mathematical Analysis System
*Where Quantum Mathematics Meets Market Structure*
---
## 🎓 THEORETICAL FOUNDATION
The Tensor Market Analysis Engine represents a revolutionary synthesis of three cutting-edge mathematical frameworks that have never before been combined for comprehensive market analysis. This indicator transcends traditional technical analysis by implementing advanced mathematical concepts from quantum mechanics, information theory, and fractal geometry.
### 🌊 Multi-Dimensional Volatility with Jump Detection
**Hawkes Process Implementation:**
The TMAE employs a sophisticated Hawkes process approximation for detecting self-exciting market jumps. Unlike traditional volatility measures that treat price movements as independent events, the Hawkes process recognizes that market shocks cluster and exhibit memory effects.
**Mathematical Foundation:**
```
Intensity λ(t) = μ + Σ α(t - Tᵢ)
```
Where market jumps at times Tᵢ increase the probability of future jumps through the decay function α, controlled by the Hawkes Decay parameter (0.5-0.99).
**Mahalanobis Distance Calculation:**
The engine calculates volatility jumps using multi-dimensional Mahalanobis distance across up to 5 volatility dimensions:
- **Dimension 1:** Price volatility (standard deviation of returns)
- **Dimension 2:** Volume volatility (normalized volume fluctuations)
- **Dimension 3:** Range volatility (high-low spread variations)
- **Dimension 4:** Correlation volatility (price-volume relationship changes)
- **Dimension 5:** Microstructure volatility (intrabar positioning analysis)
This creates a volatility state vector that captures market behavior impossible to detect with traditional single-dimensional approaches.
### 📐 Hurst Exponent Regime Detection
**Fractal Market Hypothesis Integration:**
The TMAE implements advanced Rescaled Range (R/S) analysis to calculate the Hurst exponent in real-time, providing dynamic regime classification:
- **H > 0.6:** Trending (persistent) markets - momentum strategies optimal
- **H < 0.4:** Mean-reverting (anti-persistent) markets - contrarian strategies optimal
- **H ≈ 0.5:** Random walk markets - breakout strategies preferred
**Adaptive R/S Analysis:**
Unlike static implementations, the TMAE uses adaptive windowing that adjusts to market conditions:
```
H = log(R/S) / log(n)
```
Where R is the range of cumulative deviations and S is the standard deviation over period n.
**Dynamic Regime Classification:**
The system employs hysteresis to prevent regime flipping, requiring sustained Hurst values before regime changes are confirmed. This prevents false signals during transitional periods.
### 🔄 Transfer Entropy Analysis
**Information Flow Quantification:**
Transfer entropy measures the directional flow of information between price and volume, revealing lead-lag relationships that indicate future price movements:
```
TE(X→Y) = Σ p(yₜ₊₁, yₜ, xₜ) log
```
**Causality Detection:**
- **Volume → Price:** Indicates accumulation/distribution phases
- **Price → Volume:** Suggests retail participation or momentum chasing
- **Balanced Flow:** Market equilibrium or transition periods
The system analyzes multiple lag periods (2-20 bars) to capture both immediate and structural information flows.
---
## 🔧 COMPREHENSIVE INPUT SYSTEM
### Core Parameters Group
**Primary Analysis Window (10-100, Default: 50)**
The fundamental lookback period affecting all calculations. Optimization by timeframe:
- **1-5 minute charts:** 20-30 (rapid adaptation to micro-movements)
- **15 minute-1 hour:** 30-50 (balanced responsiveness and stability)
- **4 hour-daily:** 50-100 (smooth signals, reduced noise)
- **Asset-specific:** Cryptocurrency 20-35, Stocks 35-50, Forex 40-60
**Signal Sensitivity (0.1-2.0, Default: 0.7)**
Master control affecting all threshold calculations:
- **Conservative (0.3-0.6):** High-quality signals only, fewer false positives
- **Balanced (0.7-1.0):** Optimal risk-reward ratio for most trading styles
- **Aggressive (1.1-2.0):** Maximum signal frequency, requires careful filtering
**Signal Generation Mode:**
- **Aggressive:** Any component signals (highest frequency)
- **Confluence:** 2+ components agree (balanced approach)
- **Conservative:** All 3 components align (highest quality)
### Volatility Jump Detection Group
**Volatility Dimensions (2-5, Default: 3)**
Determines the mathematical space complexity:
- **2D:** Price + Volume volatility (suitable for clean markets)
- **3D:** + Range volatility (optimal for most conditions)
- **4D:** + Correlation volatility (advanced multi-asset analysis)
- **5D:** + Microstructure volatility (maximum sensitivity)
**Jump Detection Threshold (1.5-4.0σ, Default: 3.0σ)**
Standard deviations required for volatility jump classification:
- **Cryptocurrency:** 2.0-2.5σ (naturally volatile)
- **Stock Indices:** 2.5-3.0σ (moderate volatility)
- **Forex Major Pairs:** 3.0-3.5σ (typically stable)
- **Commodities:** 2.0-3.0σ (varies by commodity)
**Jump Clustering Decay (0.5-0.99, Default: 0.85)**
Hawkes process memory parameter:
- **0.5-0.7:** Fast decay (jumps treated as independent)
- **0.8-0.9:** Moderate clustering (realistic market behavior)
- **0.95-0.99:** Strong clustering (crisis/event-driven markets)
### Hurst Exponent Analysis Group
**Calculation Method Options:**
- **Classic R/S:** Original Rescaled Range (fast, simple)
- **Adaptive R/S:** Dynamic windowing (recommended for trading)
- **DFA:** Detrended Fluctuation Analysis (best for noisy data)
**Trending Threshold (0.55-0.8, Default: 0.60)**
Hurst value defining persistent market behavior:
- **0.55-0.60:** Weak trend persistence
- **0.65-0.70:** Clear trending behavior
- **0.75-0.80:** Strong momentum regimes
**Mean Reversion Threshold (0.2-0.45, Default: 0.40)**
Hurst value defining anti-persistent behavior:
- **0.35-0.45:** Weak mean reversion
- **0.25-0.35:** Clear ranging behavior
- **0.15-0.25:** Strong reversion tendency
### Transfer Entropy Parameters Group
**Information Flow Analysis:**
- **Price-Volume:** Classic flow analysis for accumulation/distribution
- **Price-Volatility:** Risk flow analysis for sentiment shifts
- **Multi-Timeframe:** Cross-timeframe causality detection
**Maximum Lag (2-20, Default: 5)**
Causality detection window:
- **2-5 bars:** Immediate causality (scalping)
- **5-10 bars:** Short-term flow (day trading)
- **10-20 bars:** Structural flow (swing trading)
**Significance Threshold (0.05-0.3, Default: 0.15)**
Minimum entropy for signal generation:
- **0.05-0.10:** Detect subtle information flows
- **0.10-0.20:** Clear causality only
- **0.20-0.30:** Very strong flows only
---
## 🎨 ADVANCED VISUAL SYSTEM
### Tensor Volatility Field Visualization
**Five-Layer Resonance Bands:**
The tensor field creates dynamic support/resistance zones that expand and contract based on mathematical field strength:
- **Core Layer (Purple):** Primary tensor field with highest intensity
- **Layer 2 (Neutral):** Secondary mathematical resonance
- **Layer 3 (Info Blue):** Tertiary harmonic frequencies
- **Layer 4 (Warning Gold):** Outer field boundaries
- **Layer 5 (Success Green):** Maximum field extension
**Field Strength Calculation:**
```
Field Strength = min(3.0, Mahalanobis Distance × Tensor Intensity)
```
The field amplitude adjusts to ATR and mathematical distance, creating dynamic zones that respond to market volatility.
**Radiation Line Network:**
During active tensor states, the system projects directional radiation lines showing field energy distribution:
- **8 Directional Rays:** Complete angular coverage
- **Tapering Segments:** Progressive transparency for natural visual flow
- **Pulse Effects:** Enhanced visualization during volatility jumps
### Dimensional Portal System
**Portal Mathematics:**
Dimensional portals visualize regime transitions using category theory principles:
- **Green Portals (◉):** Trending regime detection (appear below price for support)
- **Red Portals (◎):** Mean-reverting regime (appear above price for resistance)
- **Yellow Portals (○):** Random walk regime (neutral positioning)
**Tensor Trail Effects:**
Each portal generates 8 trailing particles showing mathematical momentum:
- **Large Particles (●):** Strong mathematical signal
- **Medium Particles (◦):** Moderate signal strength
- **Small Particles (·):** Weak signal continuation
- **Micro Particles (˙):** Signal dissipation
### Information Flow Streams
**Particle Stream Visualization:**
Transfer entropy creates flowing particle streams indicating information direction:
- **Upward Streams:** Volume leading price (accumulation phases)
- **Downward Streams:** Price leading volume (distribution phases)
- **Stream Density:** Proportional to information flow strength
**15-Particle Evolution:**
Each stream contains 15 particles with progressive sizing and transparency, creating natural flow visualization that makes information transfer immediately apparent.
### Fractal Matrix Grid System
**Multi-Timeframe Fractal Levels:**
The system calculates and displays fractal highs/lows across five Fibonacci periods:
- **8-Period:** Short-term fractal structure
- **13-Period:** Intermediate-term patterns
- **21-Period:** Primary swing levels
- **34-Period:** Major structural levels
- **55-Period:** Long-term fractal boundaries
**Triple-Layer Visualization:**
Each fractal level uses three-layer rendering:
- **Shadow Layer:** Widest, darkest foundation (width 5)
- **Glow Layer:** Medium white core line (width 3)
- **Tensor Layer:** Dotted mathematical overlay (width 1)
**Intelligent Labeling System:**
Smart spacing prevents label overlap using ATR-based minimum distances. Labels include:
- **Fractal Period:** Time-based identification
- **Topological Class:** Mathematical complexity rating (0, I, II, III)
- **Price Level:** Exact fractal price
- **Mahalanobis Distance:** Current mathematical field strength
- **Hurst Exponent:** Current regime classification
- **Anomaly Indicators:** Visual strength representations (○ ◐ ● ⚡)
### Wick Pressure Analysis
**Rejection Level Mathematics:**
The system analyzes candle wick patterns to project future pressure zones:
- **Upper Wick Analysis:** Identifies selling pressure and resistance zones
- **Lower Wick Analysis:** Identifies buying pressure and support zones
- **Pressure Projection:** Extends lines forward based on mathematical probability
**Multi-Layer Glow Effects:**
Wick pressure lines use progressive transparency (1-8 layers) creating natural glow effects that make pressure zones immediately visible without cluttering the chart.
### Enhanced Regime Background
**Dynamic Intensity Mapping:**
Background colors reflect mathematical regime strength:
- **Deep Transparency (98% alpha):** Subtle regime indication
- **Pulse Intensity:** Based on regime strength calculation
- **Color Coding:** Green (trending), Red (mean-reverting), Neutral (random)
**Smoothing Integration:**
Regime changes incorporate 10-bar smoothing to prevent background flicker while maintaining responsiveness to genuine regime shifts.
### Color Scheme System
**Six Professional Themes:**
- **Dark (Default):** Professional trading environment optimization
- **Light:** High ambient light conditions
- **Classic:** Traditional technical analysis appearance
- **Neon:** High-contrast visibility for active trading
- **Neutral:** Minimal distraction focus
- **Bright:** Maximum visibility for complex setups
Each theme maintains mathematical accuracy while optimizing visual clarity for different trading environments and personal preferences.
---
## 📊 INSTITUTIONAL-GRADE DASHBOARD
### Tensor Field Status Section
**Field Strength Display:**
Real-time Mahalanobis distance calculation with dynamic emoji indicators:
- **⚡ (Lightning):** Extreme field strength (>1.5× threshold)
- **● (Solid Circle):** Strong field activity (>1.0× threshold)
- **○ (Open Circle):** Normal field state
**Signal Quality Rating:**
Democratic algorithm assessment:
- **ELITE:** All 3 components aligned (highest probability)
- **STRONG:** 2 components aligned (good probability)
- **GOOD:** 1 component active (moderate probability)
- **WEAK:** No clear component signals
**Threshold and Anomaly Monitoring:**
- **Threshold Display:** Current mathematical threshold setting
- **Anomaly Level (0-100%):** Combined volatility and volume spike measurement
- **>70%:** High anomaly (red warning)
- **30-70%:** Moderate anomaly (orange caution)
- **<30%:** Normal conditions (green confirmation)
### Tensor State Analysis Section
**Mathematical State Classification:**
- **↑ BULL (Tensor State +1):** Trending regime with bullish bias
- **↓ BEAR (Tensor State -1):** Mean-reverting regime with bearish bias
- **◈ SUPER (Tensor State 0):** Random walk regime (neutral)
**Visual State Gauge:**
Five-circle progression showing tensor field polarity:
- **🟢🟢🟢⚪⚪:** Strong bullish mathematical alignment
- **⚪⚪🟡⚪⚪:** Neutral/transitional state
- **⚪⚪🔴🔴🔴:** Strong bearish mathematical alignment
**Trend Direction and Phase Analysis:**
- **📈 BULL / 📉 BEAR / ➡️ NEUTRAL:** Primary trend classification
- **🌪️ CHAOS:** Extreme information flow (>2.0 flow strength)
- **⚡ ACTIVE:** Strong information flow (1.0-2.0 flow strength)
- **😴 CALM:** Low information flow (<1.0 flow strength)
### Trading Signals Section
**Real-Time Signal Status:**
- **🟢 ACTIVE / ⚪ INACTIVE:** Long signal availability
- **🔴 ACTIVE / ⚪ INACTIVE:** Short signal availability
- **Components (X/3):** Active algorithmic components
- **Mode Display:** Current signal generation mode
**Signal Strength Visualization:**
Color-coded component count:
- **Green:** 3/3 components (maximum confidence)
- **Aqua:** 2/3 components (good confidence)
- **Orange:** 1/3 components (moderate confidence)
- **Gray:** 0/3 components (no signals)
### Performance Metrics Section
**Win Rate Monitoring:**
Estimated win rates based on signal quality with emoji indicators:
- **🔥 (Fire):** ≥60% estimated win rate
- **👍 (Thumbs Up):** 45-59% estimated win rate
- **⚠️ (Warning):** <45% estimated win rate
**Mathematical Metrics:**
- **Hurst Exponent:** Real-time fractal dimension (0.000-1.000)
- **Information Flow:** Volume/price leading indicators
- **📊 VOL:** Volume leading price (accumulation/distribution)
- **💰 PRICE:** Price leading volume (momentum/speculation)
- **➖ NONE:** Balanced information flow
- **Volatility Classification:**
- **🔥 HIGH:** Above 1.5× jump threshold
- **📊 NORM:** Normal volatility range
- **😴 LOW:** Below 0.5× jump threshold
### Market Structure Section (Large Dashboard)
**Regime Classification:**
- **📈 TREND:** Hurst >0.6, momentum strategies optimal
- **🔄 REVERT:** Hurst <0.4, contrarian strategies optimal
- **🎲 RANDOM:** Hurst ≈0.5, breakout strategies preferred
**Mathematical Field Analysis:**
- **Dimensions:** Current volatility space complexity (2D-5D)
- **Hawkes λ (Lambda):** Self-exciting jump intensity (0.00-1.00)
- **Jump Status:** 🚨 JUMP (active) / ✅ NORM (normal)
### Settings Summary Section (Large Dashboard)
**Active Configuration Display:**
- **Sensitivity:** Current master sensitivity setting
- **Lookback:** Primary analysis window
- **Theme:** Active color scheme
- **Method:** Hurst calculation method (Classic R/S, Adaptive R/S, DFA)
**Dashboard Sizing Options:**
- **Small:** Essential metrics only (mobile/small screens)
- **Normal:** Balanced information density (standard desktop)
- **Large:** Maximum detail (multi-monitor setups)
**Position Options:**
- **Top Right:** Standard placement (avoids price action)
- **Top Left:** Wide chart optimization
- **Bottom Right:** Recent price focus (scalping)
- **Bottom Left:** Maximum price visibility (swing trading)
---
## 🎯 SIGNAL GENERATION LOGIC
### Multi-Component Convergence System
**Component Signal Architecture:**
The TMAE generates signals through sophisticated component analysis rather than simple threshold crossing:
**Volatility Component:**
- **Jump Detection:** Mahalanobis distance threshold breach
- **Hawkes Intensity:** Self-exciting process activation (>0.2)
- **Multi-dimensional:** Considers all volatility dimensions simultaneously
**Hurst Regime Component:**
- **Trending Markets:** Price above SMA-20 with positive momentum
- **Mean-Reverting Markets:** Price at Bollinger Band extremes
- **Random Markets:** Bollinger squeeze breakouts with directional confirmation
**Transfer Entropy Component:**
- **Volume Leadership:** Information flow from volume to price
- **Volume Spike:** Volume 110%+ above 20-period average
- **Flow Significance:** Above entropy threshold with directional bias
### Democratic Signal Weighting
**Signal Mode Implementation:**
- **Aggressive Mode:** Any single component triggers signal
- **Confluence Mode:** Minimum 2 components must agree
- **Conservative Mode:** All 3 components must align
**Momentum Confirmation:**
All signals require momentum confirmation:
- **Long Signals:** RSI >50 AND price >EMA-9
- **Short Signals:** RSI <50 AND price 0.6):**
- **Increase Sensitivity:** Catch momentum continuation
- **Lower Mean Reversion Threshold:** Avoid counter-trend signals
- **Emphasize Volume Leadership:** Institutional accumulation/distribution
- **Tensor Field Focus:** Use expansion for trend continuation
- **Signal Mode:** Aggressive or Confluence for trend following
**Range-Bound Markets (Hurst <0.4):**
- **Decrease Sensitivity:** Avoid false breakouts
- **Lower Trending Threshold:** Quick regime recognition
- **Focus on Price Leadership:** Retail sentiment extremes
- **Fractal Grid Emphasis:** Support/resistance trading
- **Signal Mode:** Conservative for high-probability reversals
**Volatile Markets (High Jump Frequency):**
- **Increase Hawkes Decay:** Recognize event clustering
- **Higher Jump Threshold:** Avoid noise signals
- **Maximum Dimensions:** Capture full volatility complexity
- **Reduce Position Sizing:** Risk management adaptation
- **Enhanced Visuals:** Maximum information for rapid decisions
**Low Volatility Markets (Low Jump Frequency):**
- **Decrease Jump Threshold:** Capture subtle movements
- **Lower Hawkes Decay:** Treat moves as independent
- **Reduce Dimensions:** Simplify analysis
- **Increase Position Sizing:** Capitalize on compressed volatility
- **Minimal Visuals:** Reduce distraction in quiet markets
---
## 🚀 ADVANCED TRADING STRATEGIES
### The Mathematical Convergence Method
**Entry Protocol:**
1. **Fractal Grid Approach:** Monitor price approaching significant fractal levels
2. **Tensor Field Confirmation:** Verify field expansion supporting direction
3. **Portal Signal:** Wait for dimensional portal appearance
4. **ELITE/STRONG Quality:** Only trade highest quality mathematical signals
5. **Component Consensus:** Confirm 2+ components agree in Confluence mode
**Example Implementation:**
- Price approaching 21-period fractal high
- Tensor field expanding upward (bullish mathematical alignment)
- Green portal appears below price (trending regime confirmation)
- ELITE quality signal with 3/3 components active
- Enter long position with stop below fractal level
**Risk Management:**
- **Stop Placement:** Below/above fractal level that generated signal
- **Position Sizing:** Based on Mahalanobis distance (higher distance = smaller size)
- **Profit Targets:** Next fractal level or tensor field resistance
### The Regime Transition Strategy
**Regime Change Detection:**
1. **Monitor Hurst Exponent:** Watch for persistent moves above/below thresholds
2. **Portal Color Change:** Regime transitions show different portal colors
3. **Background Intensity:** Increasing regime background intensity
4. **Mathematical Confirmation:** Wait for regime confirmation (hysteresis)
**Trading Implementation:**
- **Trending Transitions:** Trade momentum breakouts, follow trend
- **Mean Reversion Transitions:** Trade range boundaries, fade extremes
- **Random Transitions:** Trade breakouts with tight stops
**Advanced Techniques:**
- **Multi-Timeframe:** Confirm regime on higher timeframe
- **Early Entry:** Enter on regime transition rather than confirmation
- **Regime Strength:** Larger positions during strong regime signals
### The Information Flow Momentum Strategy
**Flow Detection Protocol:**
1. **Monitor Transfer Entropy:** Watch for significant information flow shifts
2. **Volume Leadership:** Strong edge when volume leads price
3. **Flow Acceleration:** Increasing flow strength indicates momentum
4. **Directional Confirmation:** Ensure flow aligns with intended trade direction
**Entry Signals:**
- **Volume → Price Flow:** Enter during accumulation/distribution phases
- **Price → Volume Flow:** Enter on momentum confirmation breaks
- **Flow Reversal:** Counter-trend entries when flow reverses
**Optimization:**
- **Scalping:** Use immediate flow detection (2-5 bar lag)
- **Swing Trading:** Use structural flow (10-20 bar lag)
- **Multi-Asset:** Compare flow between correlated assets
### The Tensor Field Expansion Strategy
**Field Mathematics:**
The tensor field expansion indicates mathematical pressure building in market structure:
**Expansion Phases:**
1. **Compression:** Field contracts, volatility decreases
2. **Tension Building:** Mathematical pressure accumulates
3. **Expansion:** Field expands rapidly with directional movement
4. **Resolution:** Field stabilizes at new equilibrium
**Trading Applications:**
- **Compression Trading:** Prepare for breakout during field contraction
- **Expansion Following:** Trade direction of field expansion
- **Reversion Trading:** Fade extreme field expansion
- **Multi-Dimensional:** Consider all field layers for confirmation
### The Hawkes Process Event Strategy
**Self-Exciting Jump Trading:**
Understanding that market shocks cluster and create follow-on opportunities:
**Jump Sequence Analysis:**
1. **Initial Jump:** First volatility jump detected
2. **Clustering Phase:** Hawkes intensity remains elevated
3. **Follow-On Opportunities:** Additional jumps more likely
4. **Decay Period:** Intensity gradually decreases
**Implementation:**
- **Jump Confirmation:** Wait for mathematical jump confirmation
- **Direction Assessment:** Use other components for direction
- **Clustering Trades:** Trade subsequent moves during high intensity
- **Decay Exit:** Exit positions as Hawkes intensity decays
### The Fractal Confluence System
**Multi-Timeframe Fractal Analysis:**
Combining fractal levels across different periods for high-probability zones:
**Confluence Zones:**
- **Double Confluence:** 2 fractal levels align
- **Triple Confluence:** 3+ fractal levels cluster
- **Mathematical Confirmation:** Tensor field supports the level
- **Information Flow:** Transfer entropy confirms direction
**Trading Protocol:**
1. **Identify Confluence:** Find 2+ fractal levels within 1 ATR
2. **Mathematical Support:** Verify tensor field alignment
3. **Signal Quality:** Wait for STRONG or ELITE signal
4. **Risk Definition:** Use fractal level for stop placement
5. **Profit Targeting:** Next major fractal confluence zone
---
## ⚠️ COMPREHENSIVE RISK MANAGEMENT
### Mathematical Position Sizing
**Mahalanobis Distance Integration:**
Position size should inversely correlate with mathematical field strength:
```
Position Size = Base Size × (Threshold / Mahalanobis Distance)
```
**Risk Scaling Matrix:**
- **Low Field Strength (<2.0):** Standard position sizing
- **Moderate Field Strength (2.0-3.0):** 75% position sizing
- **High Field Strength (3.0-4.0):** 50% position sizing
- **Extreme Field Strength (>4.0):** 25% position sizing or no trade
### Signal Quality Risk Adjustment
**Quality-Based Position Sizing:**
- **ELITE Signals:** 100% of planned position size
- **STRONG Signals:** 75% of planned position size
- **GOOD Signals:** 50% of planned position size
- **WEAK Signals:** No position or paper trading only
**Component Agreement Scaling:**
- **3/3 Components:** Full position size
- **2/3 Components:** 75% position size
- **1/3 Components:** 50% position size or skip trade
### Regime-Adaptive Risk Management
**Trending Market Risk:**
- **Wider Stops:** Allow for trend continuation
- **Trend Following:** Trade with regime direction
- **Higher Position Size:** Trend probability advantage
- **Momentum Stops:** Trail stops based on momentum indicators
**Mean-Reverting Market Risk:**
- **Tighter Stops:** Quick exits on trend continuation
- **Contrarian Positioning:** Trade against extremes
- **Smaller Position Size:** Higher reversal failure rate
- **Level-Based Stops:** Use fractal levels for stops
**Random Market Risk:**
- **Breakout Focus:** Trade only clear breakouts
- **Tight Initial Stops:** Quick exit if breakout fails
- **Reduced Frequency:** Skip marginal setups
- **Range-Based Targets:** Profit targets at range boundaries
### Volatility-Adaptive Risk Controls
**High Volatility Periods:**
- **Reduced Position Size:** Account for wider price swings
- **Wider Stops:** Avoid noise-based exits
- **Lower Frequency:** Skip marginal setups
- **Faster Exits:** Take profits more quickly
**Low Volatility Periods:**
- **Standard Position Size:** Normal risk parameters
- **Tighter Stops:** Take advantage of compressed ranges
- **Higher Frequency:** Trade more setups
- **Extended Targets:** Allow for compressed volatility expansion
### Multi-Timeframe Risk Alignment
**Higher Timeframe Trend:**
- **With Trend:** Standard or increased position size
- **Against Trend:** Reduced position size or skip
- **Neutral Trend:** Standard position size with tight management
**Risk Hierarchy:**
1. **Primary:** Current timeframe signal quality
2. **Secondary:** Higher timeframe trend alignment
3. **Tertiary:** Mathematical field strength
4. **Quaternary:** Market regime classification
---
## 📚 EDUCATIONAL VALUE AND MATHEMATICAL CONCEPTS
### Advanced Mathematical Concepts
**Tensor Analysis in Markets:**
The TMAE introduces traders to tensor analysis, a branch of mathematics typically reserved for physics and advanced engineering. Tensors provide a framework for understanding multi-dimensional market relationships that scalar and vector analysis cannot capture.
**Information Theory Applications:**
Transfer entropy implementation teaches traders about information flow in markets, a concept from information theory that quantifies directional causality between variables. This provides intuition about market microstructure and participant behavior.
**Fractal Geometry in Trading:**
The Hurst exponent calculation exposes traders to fractal geometry concepts, helping understand that markets exhibit self-similar patterns across multiple timeframes. This mathematical insight transforms how traders view market structure.
**Stochastic Process Theory:**
The Hawkes process implementation introduces concepts from stochastic process theory, specifically self-exciting point processes. This provides mathematical framework for understanding why market events cluster and exhibit memory effects.
### Learning Progressive Complexity
**Beginner Mathematical Concepts:**
- **Volatility Dimensions:** Understanding multi-dimensional analysis
- **Regime Classification:** Learning market personality types
- **Signal Democracy:** Algorithmic consensus building
- **Visual Mathematics:** Interpreting mathematical concepts visually
**Intermediate Mathematical Applications:**
- **Mahalanobis Distance:** Statistical distance in multi-dimensional space
- **Rescaled Range Analysis:** Fractal dimension measurement
- **Information Entropy:** Quantifying uncertainty and causality
- **Field Theory:** Understanding mathematical fields in market context
**Advanced Mathematical Integration:**
- **Tensor Field Dynamics:** Multi-dimensional market force analysis
- **Stochastic Self-Excitation:** Event clustering and memory effects
- **Categorical Composition:** Mathematical signal combination theory
- **Topological Market Analysis:** Understanding market shape and connectivity
### Practical Mathematical Intuition
**Developing Market Mathematics Intuition:**
The TMAE serves as a bridge between abstract mathematical concepts and practical trading applications. Traders develop intuitive understanding of:
- **How markets exhibit mathematical structure beneath apparent randomness**
- **Why multi-dimensional analysis reveals patterns invisible to single-variable approaches**
- **How information flows through markets in measurable, predictable ways**
- **Why mathematical models provide probabilistic edges rather than certainties**
---
## 🔬 IMPLEMENTATION AND OPTIMIZATION
### Getting Started Protocol
**Phase 1: Observation (Week 1)**
1. **Apply with defaults:** Use standard settings on your primary trading timeframe
2. **Study visual elements:** Learn to interpret tensor fields, portals, and streams
3. **Monitor dashboard:** Observe how metrics change with market conditions
4. **No trading:** Focus entirely on pattern recognition and understanding
**Phase 2: Pattern Recognition (Week 2-3)**
1. **Identify signal patterns:** Note what market conditions produce different signal qualities
2. **Regime correlation:** Observe how Hurst regimes affect signal performance
3. **Visual confirmation:** Learn to read tensor field expansion and portal signals
4. **Component analysis:** Understand which components drive signals in different markets
**Phase 3: Parameter Optimization (Week 4-5)**
1. **Asset-specific tuning:** Adjust parameters for your specific trading instrument
2. **Timeframe optimization:** Fine-tune for your preferred trading timeframe
3. **Sensitivity adjustment:** Balance signal frequency with quality
4. **Visual customization:** Optimize colors and intensity for your trading environment
**Phase 4: Live Implementation (Week 6+)**
1. **Paper trading:** Test signals with hypothetical trades
2. **Small position sizing:** Begin with minimal risk during learning phase
3. **Performance tracking:** Monitor actual vs. expected signal performance
4. **Continuous optimization:** Refine settings based on real performance data
### Performance Monitoring System
**Signal Quality Tracking:**
- **ELITE Signal Win Rate:** Track highest quality signals separately
- **Component Performance:** Monitor which components provide best signals
- **Regime Performance:** Analyze performance across different market regimes
- **Timeframe Analysis:** Compare performance across different session times
**Mathematical Metric Correlation:**
- **Field Strength vs. Performance:** Higher field strength should correlate with better performance
- **Component Agreement vs. Win Rate:** More component agreement should improve win rates
- **Regime Alignment vs. Success:** Trading with mathematical regime should outperform
### Continuous Optimization Process
**Monthly Review Protocol:**
1. **Performance Analysis:** Review win rates, profit factors, and maximum drawdown
2. **Parameter Assessment:** Evaluate if current settings remain optimal
3. **Market Adaptation:** Adjust for changes in market character or volatility
4. **Component Weighting:** Consider if certain components should receive more/less emphasis
**Quarterly Deep Analysis:**
1. **Mathematical Model Validation:** Verify that mathematical relationships remain valid
2. **Regime Distribution:** Analyze time spent in different market regimes
3. **Signal Evolution:** Track how signal characteristics change over time
4. **Correlation Analysis:** Monitor correlations between different mathematical components
---
## 🌟 UNIQUE INNOVATIONS AND CONTRIBUTIONS
### Revolutionary Mathematical Integration
**First-Ever Implementations:**
1. **Multi-Dimensional Volatility Tensor:** First indicator to implement true tensor analysis for market volatility
2. **Real-Time Hawkes Process:** First trading implementation of self-exciting point processes
3. **Transfer Entropy Trading Signals:** First practical application of information theory for trade generation
4. **Democratic Component Voting:** First algorithmic consensus system for signal generation
5. **Fractal-Projected Signal Quality:** First system to predict signal quality at future price levels
### Advanced Visualization Innovations
**Mathematical Visualization Breakthroughs:**
- **Tensor Field Radiation:** Visual representation of mathematical field energy
- **Dimensional Portal System:** Category theory visualization for regime transitions
- **Information Flow Streams:** Real-time visual display of market information transfer
- **Multi-Layer Fractal Grid:** Intelligent spacing and projection system
- **Regime Intensity Mapping:** Dynamic background showing mathematical regime strength
### Practical Trading Innovations
**Trading System Advances:**
- **Quality-Weighted Signal Generation:** Signals rated by mathematical confidence
- **Regime-Adaptive Strategy Selection:** Automatic strategy optimization based on market personality
- **Anti-Spam Signal Protection:** Mathematical prevention of signal clustering
- **Component Performance Tracking:** Real-time monitoring of algorithmic component success
- **Field-Strength Position Sizing:** Mathematical volatility integration for risk management
---
## ⚖️ RESPONSIBLE USAGE AND LIMITATIONS
### Mathematical Model Limitations
**Understanding Model Boundaries:**
While the TMAE implements sophisticated mathematical concepts, traders must understand fundamental limitations:
- **Markets Are Not Purely Mathematical:** Human psychology, news events, and fundamental factors create unpredictable elements
- **Past Performance Limitations:** Mathematical relationships that worked historically may not persist indefinitely
- **Model Risk:** Complex models can fail during unprecedented market conditions
- **Overfitting Potential:** Highly optimized parameters may not generalize to future market conditions
### Proper Implementation Guidelines
**Risk Management Requirements:**
- **Never Risk More Than 2% Per Trade:** Regardless of signal quality
- **Diversification Mandatory:** Don't rely solely on mathematical signals
- **Position Sizing Discipline:** Use mathematical field strength for sizing, not confidence
- **Stop Loss Non-Negotiable:** Every trade must have predefined risk parameters
**Realistic Expectations:**
- **Mathematical Edge, Not Certainty:** The indicator provides probabilistic advantages, not guaranteed outcomes
- **Learning Curve Required:** Complex mathematical concepts require time to master
- **Market Adaptation Necessary:** Parameters must evolve with changing market conditions
- **Continuous Education Important:** Understanding underlying mathematics improves application
### Ethical Trading Considerations
**Market Impact Awareness:**
- **Information Asymmetry:** Advanced mathematical analysis may provide advantages over other market participants
- **Position Size Responsibility:** Large positions based on mathematical signals can impact market structure
- **Sharing Knowledge:** Consider educational contributions to trading community
- **Fair Market Participation:** Use mathematical advantages responsibly within market framework
### Professional Development Path
**Skill Development Sequence:**
1. **Basic Mathematical Literacy:** Understand fundamental concepts before advanced application
2. **Risk Management Mastery:** Develop disciplined risk control before relying on complex signals
3. **Market Psychology Understanding:** Combine mathematical analysis with behavioral market insights
4. **Continuous Learning:** Stay updated on mathematical finance developments and market evolution
---
## 🔮 CONCLUSION
The Tensor Market Analysis Engine represents a quantum leap forward in technical analysis, successfully bridging the gap between advanced pure mathematics and practical trading applications. By integrating multi-dimensional volatility analysis, fractal market theory, and information flow dynamics, the TMAE reveals market structure invisible to conventional analysis while maintaining visual clarity and practical usability.
### Mathematical Innovation Legacy
This indicator establishes new paradigms in technical analysis:
- **Tensor analysis for market volatility understanding**
- **Stochastic self-excitation for event clustering prediction**
- **Information theory for causality-based trade generation**
- **Democratic algorithmic consensus for signal quality enhancement**
- **Mathematical field visualization for intuitive market understanding**
### Practical Trading Revolution
Beyond mathematical innovation, the TMAE transforms practical trading:
- **Quality-rated signals replace binary buy/sell decisions**
- **Regime-adaptive strategies automatically optimize for market personality**
- **Multi-dimensional risk management integrates mathematical volatility measures**
- **Visual mathematical concepts make complex analysis immediately interpretable**
- **Educational value creates lasting improvement in trading understanding**
### Future-Proof Design
The mathematical foundations ensure lasting relevance:
- **Universal mathematical principles transcend market evolution**
- **Multi-dimensional analysis adapts to new market structures**
- **Regime detection automatically adjusts to changing market personalities**
- **Component democracy allows for future algorithmic additions**
- **Mathematical visualization scales with increasing market complexity**
### Commitment to Excellence
The TMAE represents more than an indicator—it embodies a philosophy of bringing rigorous mathematical analysis to trading while maintaining practical utility and visual elegance. Every component, from the multi-dimensional tensor fields to the democratic signal generation, reflects a commitment to mathematical accuracy, trading practicality, and educational value.
### Trading with Mathematical Precision
In an era where markets grow increasingly complex and computational, the TMAE provides traders with mathematical tools previously available only to institutional quantitative research teams. Yet unlike academic mathematical models, the TMAE translates complex concepts into intuitive visual representations and practical trading signals.
By combining the mathematical rigor of tensor analysis, the statistical power of multi-dimensional volatility modeling, and the information-theoretic insights of transfer entropy, traders gain unprecedented insight into market structure and dynamics.
### Final Perspective
Markets, like nature, exhibit profound mathematical beauty beneath apparent chaos. The Tensor Market Analysis Engine serves as a mathematical lens that reveals this hidden order, transforming how traders perceive and interact with market structure.
Through mathematical precision, visual elegance, and practical utility, the TMAE empowers traders to see beyond the noise and trade with the confidence that comes from understanding the mathematical principles governing market behavior.
Trade with mathematical insight. Trade with the power of tensors. Trade with the TMAE.
*"In mathematics, you don't understand things. You just get used to them." - John von Neumann*
*With the TMAE, mathematical market understanding becomes not just possible, but intuitive.*
— Dskyz, Trade with insight. Trade with anticipation.
