Cari dalam skrip untuk "adx"

ADX-DI MTF trend indication - JD version 2Version 2 added support for MTF, to see the trend direction on the lower or higher timeframe.
As an example to see the difference, the indicator is added three times, one time for the current TF, one set at the higher and one at the lower TF.
Cudo's to Chris Moody for the MTF-switching-code!!
JD.


CM_ADX+DMI ModMashed together Chris Moody's ADX thing with his DMI thing.
So you can see trend strength + direction
green-ish = uptrend-ish//red-ish = downtrend-ish
Colors can be adjusted though.
below 10 = gray, not much going on
10 - 20 = light green/light red, could be the beginning o something
20 - 40 = bright green / bright red, something is going on
above 40 = dark green, dark red, exhaustion (default is 40, can be adjusted to whatever)

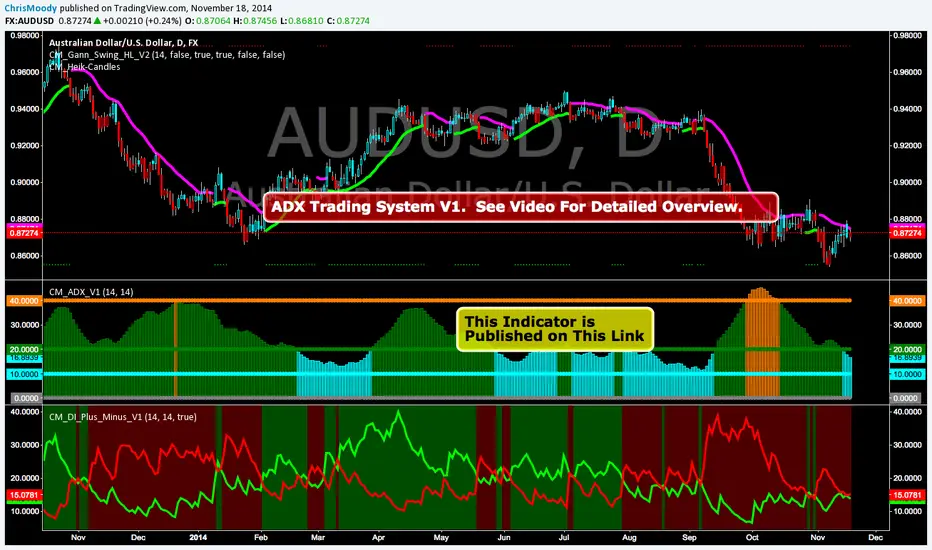
CM_ADX_V1ADX System Overview
So I Came Across Another Trading System for Only $997. However, if you purchased in the next 24hours the whole system could be Yours For Only $497.
So I decided to Code it. This is only Version 1, and I discuss in the Video What I’ve found so for, some plans for Version 2 of the indicator, and I ask for your feedback on anything you find.
Indicators used in System:
CM_DI_Plus_Minus_V1 (Indicator On Bottom).
CM_ADX_V1 (Indicator On 2nd Pane).
CM_Gann_Swing_Hi_Lo (Indicator on Price Pane). This Indicator was published before…Link Below.
CM_DI_Plus_Minus_V1
In Video I go over settings and how to customize charts.
Link To Video:
vimeopro.com
Link To Downloadable PDF Shown in Video:
d.pr
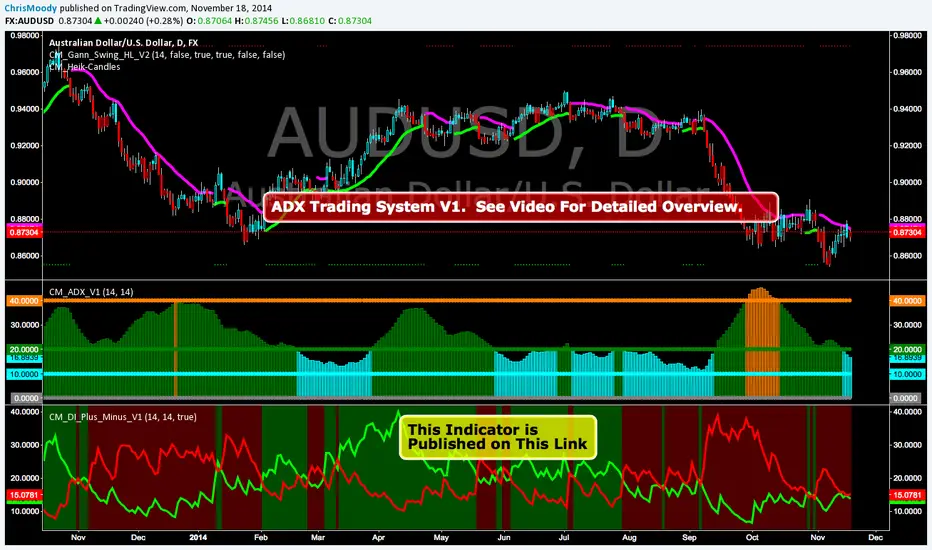
CM_DI_Plus_MinusADX System Overview
So I Came Across Another Trading System for Only $997. However, if you purchased in the next 24hours the whole system could be Yours For Only $497.
So I decided to Code it. This is only Version 1, and I discuss in the Video What I’ve found so for, some plans for Version 2 of the indicator, and I ask for your feedback on anything you find.
Indicators used in System:
CM_DI_Plus_Minus_V1 (Indicator On Bottom).
CM_ADX_V1 (Indicator On 2nd Pane).
CM_Gann_Swing_Hi_Lo (Indicator on Price Pane). This Indicator was published before…Link Below.
In Video I go over settings and how to customize charts.
Link To Video:
vimeopro.com
Link To Downloadable PDF Shown in Video:
d.pr
Directional Movement (DMI)Directional Movement indicator implemented in Pine script. Use it to customize ADX behavior.

RSI ADX Bollinger Analysis High-level purpose and design philosophy
This indicator — RSI-ADX-Bollinger Analysis — is a compact, educational market-analysis toolkit that blends momentum (RSI), trend strength (ADX), volatility structure (Bollinger Bands) and simple volumetrics to provide traders a snapshot of market condition and trade idea quality. The design philosophy is explicit and layered: use each component to answer a different question about price action (momentum, conviction, volatility, participation), then combine answers to form a more robust, explainable signal. The mashup is intended for analysis and learning, not automatic execution: it surfaces the why behind signals so traders can test, learn and apply rules with risk management.
________________________________________
What each indicator contributes (component-by-component)
RSI (Relative Strength Index) — role and behavior: RSI measures short-term momentum by comparing recent gains to recent losses. A high RSI (near or above the overbought threshold) indicates strong recent buying pressure and potential exhaustion if price is extended. A low RSI (near or below the oversold threshold) indicates strong recent selling pressure and potential exhaustion or a value area for mean-reversion. In this dashboard RSI is used as the primary momentum trigger: it helps identify whether price is locally over-extended on the buy or sell side.
ADX (Average Directional Index) — role and behavior: ADX measures trend strength independently of direction. When ADX rises above a chosen threshold (e.g., 25), it signals that the market is trending with conviction; ADX below the threshold suggests range or weak trend. Because patterns and momentum signals perform differently in trending vs. ranging markets, ADX is used here as a filter: only when ADX indicates sufficient directional strength does the system treat RSI+BB breakouts as meaningful trade candidates.
Bollinger Bands — role and behavior: Bollinger Bands (20-period basis ± N standard deviations) show volatility envelope and relative price position vs. a volatility-adjusted mean. Price outside the upper band suggests pronounced extension relative to recent volatility; price outside the lower band suggests extended weakness. A band expansion (increasing width) signals volatility breakout potential; contraction signals range-bound conditions and potential squeeze. In this dashboard, Bollinger Bands provide the volatility/structural context: RSI extremes plus price beyond the band imply a stronger, volatility-backed move.
Volume split & basic MA trend — role and behavior: Buy-like and sell-like volume (simple heuristic using close>open or closeopen) or sell-like (close1.2 for validation and compare win rate and expectancy.
4. TF alignment: Accept signals only when higher timeframe (e.g., 4h) trend agrees — compare results.
5. Parameter sensitivity: Vary RSI threshold (70/30 vs 80/20), Bollinger stddev (2 vs 2.5), and ADX threshold (25 vs 30) and measure stability of results.
These exercises teach both statistical thinking and the specific failure modes of the mashup.
________________________________________
Limitations, failure modes and caveats (explicit & teachable)
• ADX and Bollinger measures lag during fast-moving news events — signals can be late or wrong during earnings, macro shocks, or illiquid sessions.
• Volume classification by open/close is a heuristic; it does not equal TAPEDATA, footprint or signed volume. Use it as supportive evidence, not definitive proof.
• RSI can remain overbought or oversold for extended stretches in persistent trends — relying solely on RSI extremes without ADX or BB context invites large drawdowns.
• Small-cap or low-liquidity instruments yield noisy band behavior and unreliable volume ratios.
Being explicit about these limitations is a strong point in a TradingView description — it demonstrates transparency and educational intent.
________________________________________
Originality & mashup justification (text you can paste)
This script intentionally combines classical momentum (RSI), volatility envelope (Bollinger Bands) and trend-strength (ADX) because each indicator answers a different and complementary question: RSI answers is price locally extreme?, Bollinger answers is price outside normal volatility?, and ADX answers is the market moving with conviction?. Volume participation then acts as a practical check for real market involvement. This combination is not a simple “indicator mashup”; it is a designed ensemble where each element reduces the others’ failure modes and together produce a teachable, testable signal framework. The script’s purpose is educational and analytical — to show traders how to interpret the interplay of momentum, volatility, and trend strength.
________________________________________
TradingView publication guidance & compliance checklist
To satisfy TradingView rules about mashups and descriptions, include the following items in your script description (without exposing source code):
1. Purpose statement: One or two lines describing the script’s objective (educational multi-indicator market overview and idea filter).
2. Component list: Name the major modules (RSI, Bollinger Bands, ADX, volume heuristic, SMA trend checks, signal tracking) and one-sentence reason for each.
3. How they interact: A succinct non-code explanation: “RSI finds momentum extremes; Bollinger confirms volatility expansion; ADX confirms trend strength; all three must align for a BUY/SELL.”
4. Inputs: List adjustable inputs (RSI length and thresholds, BB length & stddev, ADX threshold & smoothing, volume MA, table position/size).
5. Usage instructions: Short workflow (check TF alignment → confirm participation → define stop & R:R → backtest).
6. Limitations & assumptions: Explicitly state volume is approximated, ADX has lag, and avoid promising guaranteed profits.
7. Non-promotional language: No external contact info, ads, claims of exclusivity or guaranteed outcomes.
8. Trademark clause: If you used trademark symbols, remove or provide registration proof.
9. Risk disclaimer: Add the copy-ready disclaimer below.
This matches TradingView’s request for meaningful descriptions that explain originality and inter-component reasoning.
________________________________________
Copy-ready short publication description (paste into TradingView)
Advanced RSI-ADX-Bollinger Market Overview — educational multi-indicator dashboard. This script combines RSI (momentum extremes), Bollinger Bands (volatility envelope and band expansion), ADX (trend strength), simple SMA trend bias and a basic buy/sell volume heuristic to surface high-quality idea candidates. Signals require alignment of momentum, volatility expansion and rising ADX; volume participation is displayed to support signal confidence. Inputs are configurable (RSI length/levels, BB length/stddev, ADX length/threshold, volume MA, display options). This tool is intended for analysis and learning — not for automated execution. Users should back test and apply robust risk management. Limitations: volume classification here is a heuristic (close>open), ADX and BB measures lag in fast news events, and results vary by instrument liquidity.
________________________________________
Copy-ready risk & misuse disclaimer (paste into description or help file)
This script is provided for educational and analytical purposes only and does not constitute financial or investment advice. It does not guarantee profits. Indicators are heuristics and may give false or late signals; always back test and paper-trade before using real capital. The author is not responsible for trading losses resulting from the use or misuse of this indicator. Use proper position sizing and risk controls.
________________________________________
Risk Disclaimer: This tool is provided for education and analysis only. It is not financial advice and does not guarantee returns. Users assume all risk for trades made based on this script. Back test thoroughly and use proper risk management.

Directional Movement Index (DMI) + AlertsThis is a Study with associated visual indicators and Bullish/Bearish Alerts for Directional Movement (DMI). It consists of an Average Directional Index (ADX), Plus Directional Indicator (+DI) and Minus Directional Indicator (-DI).
Published by J. Welles Wilder in 1978 for use with currencies and commodities which are typically more volatile than stocks and have stronger trends.
Development Notes
---------------------------
This indicator, and most of the descriptions below, were derived largely from the TradingView reference manual. Feedback and suggestions for improvement are more than welcome, as well are recommended Input settings and best practices for use.
tradingview.com/chart/?solution=43000502250
Strategy Description
---------------------------
ADX defines whether or not there is a trend present; +DI and -DI compliment the ADX by taking direction into account. An ADX above 25 indicates a strong trend, and a Bullish alert is subsequently triggered when +DI is above -DI and a Bearish alert when -DI is above +DI.
Note that the Bullish or Bearish crossover alert will only trigger if ADX is simultaneously above 25 during the crossover event. If ADX later rises to 25 and +DI is still greater than -DI, or -DI greater than +DI, then a delayed alert will not trigger by design.
Basic Use
---------------------------
Acceptable DMI values are up to the trader's interpretation and may change depending on the financial instrument being examined. Recommend not changing any default values without being first familiar with their purpose and impact on the indicator at large.
Confidence in price action and trend is higher when two or more indicators are in agreement -- therefore we recommend not using this indicator by itself to determine entry or exit trade opportunities.
Recommend also choosing 'Once Per Bar Close' when creating alerts.
Inputs
---------------------------
ADX Smoothing - the time period to be used in calculating the ADX which has a smoothing component (14 is the Default).
DI Length - the time period to be used in calculating the DI (14 is the Default).
Key Level - any trade with the ADX above the key level is a strong indicator that it is trending (23 to 25 is the suggested setting).
Sensitivity - an incremental variable to test whether the past n candles are in the same bullish or bearish state before triggering a delayed crossover alert (3 is the Default). Filter out some noise and reduces active alerts.
Show ADX Option - two visual styles are provided for user preference, a visible ADX line or a background overlay (green or red when ADX is above the key level, for bullish or bearish, and gray when below).
Color Candles - an option to transpose the bullish and bearish crossovers to the main candle bars. Can be turned off in the Style Tab by deselecting 'Bar Colors'. Dark blue is bullish, dark purple is bearish, and the black inner color is neutral. Note that the outer red and green border will still be distinguished by whether each individual candle is bearish or bullish during the specified timeframe.
Indicator Visuals
---------------------------
Bullish or Bearish plot based on DMI strategy (ADX and +/-DI values).
Visual cues are intended to improve analysis and decrease interpretation time during trading, as well as to aid in understanding the purpose of this study and how its inclusion can benefit a comprehensive trading strategy.
Trend Strength
---------------------------
To analyze trend strength, the focus should be on the ADX line and not the +DI or -DI lines. An ADX reading above 25 indicates a strong trend, while a reading below 20 indicates a weak or non-existent trend. A reading between those two values would be considered indeterminable. Though what is truly a strong trend or a weak trend depends on the financial instrument being examined; historical analysis can assist in determining appropriate values.
Bullish DI Cross
---------------------------
1. ADX must be over 25 (strong trend) (value is determined by the trader)
2. +DI cross above -DI
3. Set Stop Loss at the current day's low (any +DI cross-backs below -DI should be ignored)
4. Set trailing stop if ADX strengthens (i.e., signal rises)
Bearish DI Cross
---------------------------
1. ADX must be over 25 (strong trend) (value is determined by the trader)
2. -DI cross above +DI
3. Set Stop Loss at the current day's high (any -DI cross-backs below +DI should be ignored)
4. Set trailing stop if ADX strengthens (i.e., signal rises)
Disclaimer
---------------------------
This post and the script are not intended to provide any financial advice. Trade at your own risk.
No known repainting.
Version 1.1
-------------------------
- Added multi-timeframe resolution using PineCoders secure security function to eliminate repainting.
- Cleaned up option for selecting ADX view; and added a colored line as a choice, based on same bullish, bearish, or neutral colors as the background.
- Added exit crossover indicator to aid in an overall strategy development. This ability pairs better with my CHOP Zone Entry Strategy which relies on DMI Exits. Note that exit conditions don't employ the sensitivity variable. Green labels are for Bullish exits and red are for Bearish.
-- Exit condition is triggered if in an active Bullish or Bearish position and ADX drops below 25, Or if either the -DI crosses above +DI (for previously Bullish) or +DI crosses above -DI (for previously Bearish).
- Added reverse position determination. Triggers when a Bullish entry occurs on the same candle as a Bearish exit, or vice versa. Green labels are for Bullish reverses and red are for Bearish.
- Added selectable option to choose visible labels -- Bearish, Bullish, Both, Exits, Reverses, or All.
-- Note that a reverse label will only show if the opposing entry and exit labels are set to show, otherwise the reverse will revert to the appropriate entry or exit on the chart.
- Added alerts to account for new conditions.
-- Note that alerts for crossovers, exits, and reverses will only be triggered if the associated labels are selected to be shown (i.e., what you choose to see on the chart is what you will be alerted to).
Version 1.2
-------------------------
- Changed exit condition to be decided on by whether ADX is below 25 and on a +/-DI crossover. Versus being either or. The previous version had too many false triggers. This variety can now show multiple Bullish or Bearish alerts before an Exit condition too. I'm tempted to simply make this condition based on ADX, and not DI … thoughts? See lines 138 and 139.
- Updated the Background view to have deeper shades of colors dependent upon the ADX trend strength.
- Added an Oscillator view for the ADX and momentum computations to color the histogram by trend. DI lines are hidden.
-- If ADX is Bullish, then the oscillator is colored light green in an uptrend and dark green in a downtrend; if Bearish, then its light red in an uptrend and dark redin a downtrend; if adx is below key level, then it is light gray in a downtrend and dark grey in the uptrend.
- Added option to Hide ADX in case only the Directional lines are desired. This could be useful if you would like to have the ADX oscillator in one panel and +/-DI crossovers in another.
- Added a Columnar view for the ADX. DI lines are hidden. This view is really simple and compact, with the trend strength still easily understood. Colors are the same as for the oscillator -- the deeper the shade of green or red, then the higher the ADX trend strength level.
- Added a Trend Strength label.
ADX Trend Strength Trade (Y/N) Setup Types
0 to 10 = Barely Breathing N N/A
10 to 20 = Weak Trend Y Range/Pre-Breakout
20 to 30 = Potentially Starting to Trend Y Early Stage Trend
30 to 50 = Strong Trend Y Ride the Wave
50 to 75 = Very Strong Trend N Exhaustion
75 to 100 = Extremely Strong Trend N N/A
Version 1.3
-------------------------
Updated to Pine Script v5 to resolve errors from the deprecated v4 version.
This is a reissue of a previously published script that was hidden due to a v4 compatibility issue.
'https://www.tradingview.com/script/9OoEHrv5-Directional-Movement-Index-DMI-Alerts/'

Didi's Needles setup screener Didi's Needles setup screener
I basically used the screener created by QuantNomad , made some modifications and used the indicators from the setup
Indicators used:
Didi Index, ADX, Bollinger Bands, Trix and Stochastic.
Signals from each column:
Column 'Symbol'
Blue Symbol: When the Didi, ADX and BB are with buy signals
Yellow Symbol: When Didi, ADX and BB are with sell signals
Red Symbol: When ADX, BB, Trix and Stoch are with signals to close the trade
ADX' Column
ADX Kick: When the ADX has given a Kick (Top or Bottom). ADX was rising and starts to fall
Uptrend: When the ADX is up and below the Level and the DI+ is above the DI-
Uptrend Strong: When the ADX is up and above the Level and the DI+ is above the DI-
Uptrend Falling: When the ADX is below and above the Level and the DI+ is above the DI-
Downtrend: When the ADX is below the level and the DI- is above the DI+
Downtrend Strong: When the ADX is above the level and the DI- is above the DI+
Downtrend Falling: When the ADX is below the level and the DI- is above the DI+
Didi' Column
Buy Alert: When the Fast Average crosses the Median to the upside (as long as it is not a False Point) = Needle Alert
Sell Alert: When Fast Average Crosses Median Down (as long as it is not a False Point) = Needle Alert
Needle Buy: When slow average crosses the median down = Needle confirmation
Needle Sell: When slow moving average crosses the median to high = Needle confirmation
Fake Buy: When the fast moving average crosses the median and the slow moving average is above the median and rising = False Point (Sell signal or if you are positioned on the buy side, hold the buy or raise the hand)
Fake Sell: When the fast moving average crosses the median and the slow moving average is below the median and falling = False Point (Buy signal or if you are positioned on the sell side, hold the sell or raise your hand)
BB' Column
Open Rising: When the Bollinger Bands are open and the Base Mean (BB) is rising
Open Falling: When the Bollinger Bands are open and the Base Mean (BB) is falling
Parallel Rising: When the Bollinger Bands are parallel and rising
Parallel Falling: When the Bollinger Bands are Parallel and falling
Close: When the Bollinger Bands are closed
Trix Column
Bought: When the Trix is above the MA (trix)
Sold: When the Trix is below the MA (trix)
Stoch Column
Bought: When %K is above %D
Sold: When %K is below %D
--------------------------
Rastreador para o setup de Agulhadas do Didi
Eu basicamente usei o screener criado por QuantNomad , fiz algumas modificações e usei os indicadores do setup
Indicadores usado:
Didi Index, ADX, Bandas de Bollinger, Trix e Estocástico.
Sinais de cada coluna:
Coluna 'Symbol'
Symbol Azul: Quando o Didi, ADX e BB estão com sinais de compra
Symbol Amarelo: Quando o Didi, ADX e BB estão com sinais de venda
Symbol Vermelho: Quando o ADX, BB, Trix e Stoch estão com sinais para fechar a operação
Coluna 'ADX'
Kick ADX: Quando o ADX deu um Kick (Topo ou Fundo). ADX vinha subinte e começa cair
Uptrend: Quando o ADX está subinte e abaixo do Nivel e o DI+ está acima do DI-
Uptrend Strong: Quando o ADX está subinte e acima do Nivel e o DI+ está acima do DI-
Uptrend Falling: Quando o ADX está cainte e acima do Nivel e o DI+ está acima do DI-
Downtrend: Quando o ADX está subinte e abaixo do Nivel e o DI- está acima do DI+
Downtrend Strong: Quando o ADX está subinte e acima do Nivel e o DI- está acima do DI+
Downtrend Falling: Quando o ADX está cainte e acima do Nivel e o DI- está acima do DI+
Coluna 'Didi'
Buy Alert: Quando a média rapida cruza a mediana para cima (contanto que não seja um Ponto Falso) = Alerta da Agulhada
Sell Alert: Quando a média rapida cruza a mediana para baixo (contanto que náo seja um Ponto Falso) = Alerta da Agulhada
Needle Buy: Quando a média lenta cruza a mediana para baixo = Confirmação da Agulhada
Needle Sell: Quando a média lenta cruza a mediana para cima = Confirmação da Agulhada
Fake Buy: Quando a média rapida cruza a mediana paa cima e a média lenta está acima da mediana e subindo = Ponto Falso (Sinal de venda ou caso esteja posicionado na compra, segurar a compra ou aumentar a mão)
Fake Sell: Quando a média rapida cruza a mediana para baixo e a média lenta está abaixo da mediana e caindo = Ponto Falso (Sinal de compra ou caso esteja posicionado na venda, segurar a venda ou aumentar a mão)
Coluna 'BB'
Open Rising: Quando as Bandas de Bollingers estão abertas e a média base (BB) está subindo
Open Falling: Quando as Bandas de Bollingers estão abertas e a média base (BB) está caindo
Parallel Rising: Quando as Bandas de Bollingers estão Paralelas e subindo
Parallel Falling: Quando as Bandas de Bollingers estão Paralelas e caindo
Close: Quando as Bandas de Bollingers estão fechadas
Coluna 'Trix'
Bought: Quando o Trix está acima da MA (trix)
Sold: Quando o Trix está abaixo da MA (trix)
Coluna 'Stoch'
Bought: Quando %K está acima do %D
Sold: Quando o %K está abaixo do %D

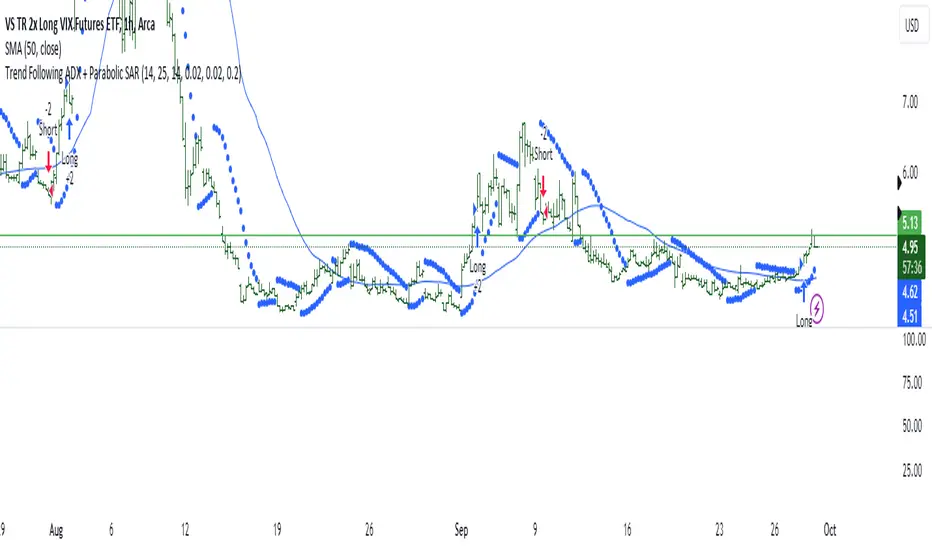
Trend Following ADX + Parabolic SAR### Strategy Description: Trend Following using **ADX** and **Parabolic SAR**
This strategy is designed to follow market trends using two popular indicators: **Average Directional Index (ADX)** and **Parabolic SAR**. The strategy attempts to enter trades when the market shows a strong trend (using ADX) and confirms the trend direction using the Parabolic SAR. Here's a breakdown:
### Key Indicators:
1. **ADX (Average Directional Index)**:
- **Purpose**: ADX measures the strength of a trend, regardless of direction.
- **Usage**: The strategy uses ADX to confirm that the market is trending. When ADX is above a certain threshold (e.g., 25), it indicates a strong trend.
- **Directional Indicators**:
- **DI+ (Directional Indicator Plus)**: Indicates upward movement strength.
- **DI- (Directional Indicator Minus)**: Indicates downward movement strength.
2. **Parabolic SAR**:
- **Purpose**: Parabolic SAR is a trend-following indicator used to identify potential reversals in the price direction.
- **Usage**: It provides specific price points above or below which the strategy confirms buy or sell signals.
### Strategy Logic:
#### **Entry Conditions**:
1. **Long Position** (Buy):
- **ADX** is above the threshold (default: 25), indicating a strong trend.
- **DI+ > DI-**, indicating the upward trend is stronger than the downward.
- The price is above the **Parabolic SAR** level, confirming the upward trend.
2. **Short Position** (Sell):
- **ADX** is above the threshold (default: 25), indicating a strong trend.
- **DI- > DI+**, indicating the downward trend is stronger than the upward.
- The price is below the **Parabolic SAR** level, confirming the downward trend.
#### **Exit Conditions**:
- Positions are closed when an opposite signal is detected.
- For example, if a long position is open and the conditions for a short position are met, the long position is closed, and a short position is opened.
### Parameters:
1. **ADX Period**: Defines the length of the period for the ADX calculation (default: 14).
2. **ADX Threshold**: The minimum value of ADX to confirm a strong trend (default: 25).
3. **Parabolic SAR Start**: The initial step for the SAR (default: 0.02).
4. **Parabolic SAR Increment**: The step increment for SAR (default: 0.02).
5. **Parabolic SAR Max**: The maximum step for SAR (default: 0.2).
### Example Trade Flow:
#### **Long Trade**:
1. ADX > 25, confirming a strong trend.
2. DI+ > DI-, indicating the market is trending upward.
3. The price is above the Parabolic SAR, confirming the upward direction.
4. **Action**: Enter a long (buy) position.
5. Exit the long position when a short signal is triggered (i.e., DI- > DI+, price below Parabolic SAR).
#### **Short Trade**:
1. ADX > 25, confirming a strong trend.
2. DI- > DI+, indicating the market is trending downward.
3. The price is below the Parabolic SAR, confirming the downward direction.
4. **Action**: Enter a short (sell) position.
5. Exit the short position when a long signal is triggered (i.e., DI+ > DI-, price above Parabolic SAR).
### Strengths of the Strategy:
- **Trend-Following**: It performs well in markets with strong trends, whether upward or downward.
- **Dual Confirmation**: The combination of ADX and Parabolic SAR reduces false signals by ensuring both trend strength and direction are considered before entering a trade.
### Weaknesses:
- **Range-Bound Markets**: This strategy may perform poorly in choppy, non-trending markets because both ADX and SAR are trend-following indicators.
- **Lagging Nature**: Since both ADX and SAR are lagging indicators, the strategy may enter trades after the trend has already started, potentially missing early profits.
### Customization:
- **ADX Threshold**: You can increase the threshold if you only want to trade in very strong trends, or lower it to capture more moderate trends.
- **SAR Parameters**: Adjusting the SAR `start`, `increment`, and `max` values will make the Parabolic SAR more or less sensitive to price changes.
### Summary:
This strategy combines the ADX and Parabolic SAR to take advantage of strong market trends. By confirming both trend strength (ADX) and trend direction (Parabolic SAR), it aims to enter high-probability trades in trending markets while minimizing false signals. However, it may struggle in sideways or non-trending markets.
For Educational purposes only !!!
Improved ADX – Responsive & Visual (manual ADX)just an ADX but more visual....
This indicator is a custom implementation of the Average Directional Index (ADX), designed to provide a responsive and visual representation of trend strength along with the DI+ and DI– lines. It uses manual calculations for the ADX and directional movement components for greater control over smoothing and responsiveness.
Key Features:
ADX Calculation:
Computes directional movement (upMove / downMove) manually.
Calculates True Range and smoothed directional movements using Wilder’s moving average (RMA).
Computes the ADX using the smoothed DX and applies additional smoothing (adx_fast) for responsiveness.
Directional Indicators (DI+ / DI–):
DI+ and DI– lines are calculated independently.
Lines are plotted on the same scale as the indicator.
Colors:
DI+ is green when above DI–, otherwise semi-transparent green.
DI– is red when above DI+, otherwise semi-transparent red.
ADX Coloring and Trend Fill:
ADX line color changes dynamically:
Green when above the trend strength threshold.
Yellow when near the threshold (0.75 × threshold).
Red when below the threshold.
Optional fill highlights strong trends between ADX and the threshold line:
Green fill for ADX above the threshold.
Red fill for ADX below the threshold.
Cross Markers:
Triangle markers are plotted on the indicator scale when ADX crosses the threshold:
Upward green triangle for ADX crossing above the threshold (strengthening trend).
Downward red triangle for ADX crossing below the threshold (weakening trend).
Live Values Label:
Displays the current ADX, DI+, and DI– values at the top of the indicator pane.
Automatically updates on the last bar.
Inputs:
len: ADX length (default 14)
smooth: Smoothing factor for adx_fast (default 5)
show_fill: Highlight strong trend area (true/false)
highlight_level: Trend strength threshold (default 25)
show_di: Show DI+ / DI– (true/false)
show_adx: Show ADX line (true/false)
Usage:
Use the ADX to gauge trend strength.
DI+ above DI– indicates bullish pressure; DI– above DI+ indicates bearish pressure.
ADX color and fill provide visual cues for trend strength and potential entry signals.
Cross markers alert when trend strength is increasing or decreasing relative to the threshold.

Trend & ADX by Gideon for Indian MarketsThis indicator is designed to help traders **identify strong trends** using the **Kalman Filter** and **ADX** (Average Directional Index). It provides **Buy/Sell signals** based on trend direction and ADX strength. I wanted to create something for Indian markets since there are not much available.
In a nut-shell:
✅ **Buy when the Kalman Filter turns green, and ADX is strong.
❌ **Sell when the Kalman Filter turns red, and ADX is strong.
📌 **Ignore signals if ADX is weak (below threshold).
📊 Use on 5-minute timeframes for intraday trading.
------------------------------------------------------------------------
1. Understanding the Indicator Components**
- **Green Line:** Indicates an **uptrend**.
- **Red Line:** Indicates a **downtrend**.
- The **line color change** signals a potential **trend reversal**.
**ADX Strength Filter**
- The **ADX (orange line)** measures trend strength.
- The **blue horizontal line** marks the **ADX threshold** (default: 20).
- A **Buy/Sell signal is only valid if ADX is above the threshold**, ensuring a strong trend.
**Buy & Sell Signals**
- **Buy Signal (Green Up Arrow)**
- Appears **one candle before** the Kalman line turns green.
- ADX must be **above the threshold** (default: 20).
- Suggests entering a **long position**.
- **Sell Signal (Red Down Arrow)**
- Appears **one candle before** the Kalman line turns red.
- ADX must be **above the threshold** (default: 20).
- Suggests entering a **short position**.
2. Best Settings for 5-Minute Timeframe**
For day trading on the **5-minute chart**, the following settings work best:
- **Kalman Filter Length:** `50`
- **Process Noise (Q):** `0.1`
- **Measurement Noise (R):** `0.01`
- **ADX Length:** `14`
- **ADX Threshold:** `20`
- **(Increase to 25-30 for more reliable signals in volatile markets)**
3. How to Trade with This Indicator**
**Entry Rules**
✅ **Buy Entry**
- Wait for a **green arrow (Buy Signal).
- Kalman Line must **turn green**.
- ADX must be **above the threshold** (strong trend confirmed).
- Enter a **long position** on the next candle.
❌ **Sell Entry**
- Wait for a **red arrow (Sell Signal).
- Kalman Line must **turn red**.
- ADX must be **above the threshold** (strong trend confirmed).
- Enter a **short position** on the next candle.
**Exit & Risk Management**
📌 **Stop Loss**:
- Place stop-loss **below the previous swing low** (for buys) or **above the previous swing high** (for sells).
📌 **Take Profit:
- Use a **Risk:Reward Ratio of 1:2 or 1:3.
- Exit when the **Kalman Filter color changes** (opposite trend signal).
📌 **Avoid Weak Trends**:
- **No trades when ADX is below the threshold** (low trend strength).
4. Additional Tips
- Works best on **liquid assets** like **Bank Nifty, Nifty 50, and large-cap stocks**.
- **Avoid ranging markets** with low ADX values (<20).
- Use alongside **volume analysis and support/resistance levels** for confirmation.
- Experiment with **ADX Threshold (increase for stronger signals, decrease for more trades).**
Best of Luck traders ! 🚀

EMA Cross + RSI + ADX - Autotrade Strategy V2Overview
A versatile trend-following strategy combining EMA 9/21 crossovers with RSI momentum filtering and optional ADX trend strength confirmation. Designed for both cryptocurrency and traditional futures/options markets with built-in stop loss management and automated position reversals.
Key Features
Multi-Market Compatibility: Works on both crypto futures (Bitcoin, Ethereum) and traditional markets (NIFTY, Bank NIFTY, S&P 500 futures, equity options)
Triple Confirmation System: EMA crossover + RSI filter + ADX strength (optional)
Automated Risk Management: 2% stop loss with wick-touch detection
Position Auto-Reversal: Opposite signals automatically close and reverse positions
Webhook Ready: Six distinct alert messages for automation (Entry Buy/Sell, Close Long/Short, SL Hit Long/Short)
Performance Metrics
NIFTY Futures (15min): 50%+ win rate with ADX filter OFF
Crypto Markets: Requires extensive backtesting before live deployment
Optimal Timeframes: 15-minute to 1-hour charts (patience required for higher timeframes)
Strategy Logic
Entry Signals:
LONG: EMA 9 crosses above EMA 21 + RSI > 55 + ADX > 20 (if enabled)
SHORT: EMA 9 crosses below EMA 21 + RSI < 45 + ADX > 20 (if enabled)
Exit Signals:
Opposite EMA crossover (auto-closes current position)
Stop loss hit at 2% from entry price (tracks candle wicks)
Technical Indicators:
Fast EMA: 9-period (short-term trend)
Slow EMA: 21-period (primary trend)
RSI: 14-period with 55/45 thresholds (momentum confirmation)
ADX: 14-period with 20 threshold (trend strength filter - optional)
Market-Specific Settings
Traditional Markets (NIFTY, Bank NIFTY, S&P Futures, Options)
Recommended Settings:
ADX Filter: Turn OFF (less choppy, cleaner trends)
Timeframe: 15-minute chart
Win Rate: 50%+ on NIFTY Futures
Why No ADX: Traditional markets have more institutional participation and smoother price action, making ADX unnecessary
Cryptocurrency Markets (BTC, ETH, Altcoins)
Recommended Settings:
ADX Filter: Turn ON (ADX > 20)
Timeframe: 15-minute to 1-hour
Extensive backtesting required before live trading
Why ADX: Crypto markets are highly volatile and prone to false breakouts; ADX filters low-quality chop
Best Practices
✅ Backtest thoroughly on your specific instrument and timeframe
✅ Use larger timeframes (1H, 4H) for higher quality signals and better risk/reward
✅ Adjust RSI thresholds based on market volatility (try 52/48 for more signals, 60/40 for fewer but stronger)
✅ Monitor ADX effectiveness - disable for traditional markets, enable for crypto
✅ Proper position sizing - adjust default_qty_value based on your capital and instrument price
✅ Paper trade first - test for 2-4 weeks before risking real capital
Risk Management
Fixed 2% stop loss per trade (adjustable)
Stop loss tracks candle wicks for accurate execution
Positions auto-reverse on opposite signals (no manual intervention needed)
0.075% commission built into backtest (adjust for your broker)
Customization Options
All parameters are adjustable via inputs:
EMA periods (default: 9/21)
RSI length and thresholds (default: 14-period, 55/45 levels)
ADX length and threshold (default: 14-period, 20 threshold)
Stop loss percentage (default: 2%)
Webhook Automation
This strategy includes six distinct alert messages for automated trading:
"Entry Buy" - Long position opened
"Entry Sell" - Short position opened
"Close Long" - Long position closed on opposite crossover
"Close Short" - Short position closed on opposite crossover
"SL Hit Long" - Long stop loss triggered
"SL Hit Short" - Short stop loss triggered
Compatible with Delta Exchange, Binance Futures, 3Commas, Alertatron, and other webhook platforms.
Important Notes
⚠️ Crypto markets require extensive backtesting - volatility patterns differ significantly from traditional markets
⚠️ Higher timeframes = better results - 15min works but 1H/4H provide cleaner signals
⚠️ ADX toggle is critical - OFF for traditional markets, ON for crypto
⚠️ Not financial advice - always conduct your own research and use proper risk management
⚠️ Past performance ≠ future results - backtest results may not reflect live trading conditions
Disclaimer
This strategy is for educational and informational purposes only. Trading futures and options involves substantial risk of loss. Always backtest thoroughly, start with paper trading, and never risk more than you can afford to lose. The author assumes no responsibility for any trading losses incurred using this strategy.

Artharjan ADXArtharjan ADX (AADX) by Rrahul Desai @Artharjan
📌 Overview
The Artharjan ADX (AADX) is an advanced implementation of the Average Directional Index (ADX) with customizable moving averages, momentum thresholds, and visually intuitive grading of bullish and bearish strength.
Unlike the standard ADX indicator that only shows trend strength, AADX adds graded bullish/bearish conditions, alerts, smoothed DI signals, histogram visualizations, and background color fills to help traders quickly interpret market conditions.
It is designed for traders who want early detection of trend strength, clean visual cues, and automated alert triggers for both bullish and bearish momentum setups.
⚙️ Key Features
🔹 Customizable Calculations
DI Length (default 13) – controls sensitivity of directional indicators.
+/- DI Smoothing – smooths DI signals with user-selected MA.
Multiple Moving Average Types – SMA, EMA, WMA, RMA, VWMA, ALMA, Hull, SWMA, SMMA, TMA.
ADX Smoothing – define how smooth/fast the ADX reacts.
🔹 Flexible Display
Toggle between line plots or histogram view.
Adjustable plot thickness.
Option to plot averages of ADX, +DI, -DI for confirmation.
Configurable background fills:
ADX above/below momentum threshold.
ADX rising/falling color shading.
Trend-grade based color intensity.
🔹 Momentum & Thresholds
Momentum Level (default 25) → defines “strong trend” zone.
Crossover Threshold (default 15) → helps detect early DI crossovers.
Color-coded histogram bars for +DI vs -DI difference:
Above/below zero.
Rising/falling momentum.
🔹 Bullish & Bearish Grading System
The indicator assigns grades from 1 to 5 for both bullish and bearish setups, based on DI and ADX conditions:
Bullish Grades
Grade 1 → Very Weak Bullish
Grade 2 → Weak Bullish
Grade 3 → Moderate Bullish
Grade 4 → Strong Bullish
Grade 5 → Very Strong Bullish
Bearish Grades
Grade 1 → Very Weak Bearish
Grade 2 → Weak Bearish
Grade 3 → Moderate Bearish
Grade 4 → Strong Bearish
Grade 5 → Very Strong Bearish
Labels are automatically plotted above bars to indicate the active grade.
🔹 Alerts
Bullish Alert → when +DI crosses above its average below the threshold OR bullish conditions are met.
Bearish Alert → when -DI crosses above its average below the threshold OR bearish conditions are met.
These alerts make it possible to automate trading signals for scalping, intraday, and swing trading.
📊 Use Cases
Trend Strength Measurement
Spot when markets shift from range-bound to trending.
Confirm the reliability of breakouts with strong ADX readings.
Bullish vs Bearish Control
Compare +DI vs -DI strength to gauge trend direction.
Identify trend reversals early with DI slope changes.
Momentum Confirmation
Use ADX rising + DI grades to validate trade entries.
Filter false breakouts with weak ADX.
Trade Grading System
Enter aggressively on Grade 4–5 signals.
Stay cautious on Grade 1–2 signals.
Automated Alerts & Screening
Combine AADX alerts with strategy rules.
Build scanners to highlight strong ADX setups across multiple stocks.
🎯 Trader’s Advantage
More powerful than standard ADX → Adds slope, grading, alerts, and visualization.
Adaptable to any style → Works for intraday scalping, swing trading, and positional analysis.
Visual clarity → Color fills, histograms, and labels simplify decision-making.
Customizable smoothing → Adjusts to fast or slow markets.
✅ Closing Note
The Artharjan ADX (AADX) transforms the traditional ADX into a complete trend and momentum analyzer. It helps traders detect, confirm, and act on directional strength with clarity and confidence.
With Thanks,
Rrahul Desai
@Artharjan

Supertrend with ADX & MTF MA Filter# **Supertrend with ADX & MTF MA Filter - Comprehensive Explanation**
---
## **1. Purpose of This Indicator**
This indicator combines three powerful technical analysis tools to create a robust trading system:
✅ **Supertrend** (Trend-following)
✅ **ADX Filter** (Trend strength confirmation)
✅ **MTF MA Filter** (Multi-timeframe trend direction confirmation)
**Primary Goals:**
✔ **Identify high-probability trend reversals** with confirmation from multiple indicators
✔ **Filter out weak trends** using ADX (Average Directional Index)
✔ **Add higher timeframe context** with MTF (Multi-TimeFrame) Moving Average
✔ **Reduce false signals** by requiring confluence between all three components
---
## **2. Core Logic & Components**
### **A. Supertrend (Base Indicator)**
- **Calculation:**
```pine
up = hl2 - (Multiplier * ATR(Periods))
dn = hl2 + (Multiplier * ATR(Periods))
```
- **Bullish trend** when price > `up` (green line)
- **Bearish trend** when price < `dn` (red line)
- **Why Supertrend?**
- Simple yet effective trend-following system
- Adapts to volatility via ATR (Average True Range)
---
### **B. ADX Filter (Trend Strength Confirmation)**
- **ADX Calculation:**
```pine
= calcADX(adxLength, adxSmoothing)
strongTrend = adxVal >= adxThreshold
```
- **ADX > Threshold (Default: 20)** = Strong trend
- **DI+ > DI-** = Bullish momentum
- **DI- > DI+** = Bearish momentum
- **Why ADX?**
- Avoids trading in choppy markets (low ADX = weak trend)
- Confirms if Supertrend signals occur in a strong trend
---
### **C. MTF MA Filter (Higher Timeframe Trend Alignment)**
- **Moving Average Calculation:**
```pine
= getMA(maSource, maLength, maType, maTF)
```
- **MA Type:** SMA, EMA, WMA, or DEMA
- **Timeframe:** Any (1m, 5m, 1H, 4H, D, W, M)
- **Trend Direction:**
- **Buy Signal:** MA must be **rising**
- **Sell Signal:** MA must be **falling**
- **Why MTF MA?**
- Aligns trades with the **higher timeframe trend**
- Reduces counter-trend entries
---
## **3. How to Use This Indicator**
### **A. Buy Conditions (All Must Be True)**
1. **Supertrend turns bullish** (price crosses above `up` line)
2. **ADX ≥ Threshold** (trend is strong)
3. **Higher timeframe MA is rising** (confirms bullish bias)
### **B. Sell Conditions (All Must Be True)**
1. **Supertrend turns bearish** (price crosses below `dn` line)
2. **ADX ≥ Threshold** (trend is strong)
3. **Higher timeframe MA is falling** (confirms bearish bias)
### **C. Recommended Settings**
| Parameter | Recommended Value | Description |
|-----------|------------------|-------------|
| **ATR Period** | 14 | Sensitivity of Supertrend |
| **Multiplier** | 1.5-3.0 | Adjust for volatility |
| **ADX Threshold** | 20-25 | Higher = stricter trend filter |
| **MA Length** | 20-50 | Smoothness of trend filter |
| **MA Timeframe** | 1H/D | Align with trading style |
---
## **4. Trading Strategies**
### **A. Trend-Following Strategy**
- **Enter:** When all 3 conditions align (Supertrend + ADX + MA)
- **Exit:** When Supertrend flips or ADX drops below threshold
### **B. Pullback Strategy**
- **Wait for:**
- Supertrend in trend direction
- ADX remains strong
- MA still aligned
- **Enter:** On pullback to Supertrend line
### **C. Multi-Timeframe Confirmation**
- **Intraday traders:** Use 4H/D MA for trend bias
- **Swing traders:** Use D/W MA for trend bias
---
## **5. Advantages Over Standard Supertrend**
✔ **Fewer false signals** (ADX filters weak trends)
✔ **Higher timeframe alignment** (avoids trading against larger trends)
✔ **Customizable MA types** (SMA, EMA, WMA, DEMA)
✔ **Works on all markets** (stocks, forex, crypto)
---
### **Final Thoughts**
This indicator is designed for traders who want **high-confidence trend signals** by combining:
🔹 **Supertrend** (entry trigger)
🔹 **ADX** (trend strength filter)
🔹 **MTF MA** (higher timeframe trend alignment)
By requiring all three components to align, it significantly improves signal quality compared to standalone Supertrend systems.
**→ Best for:** Swing trading, trend-following, and avoiding choppy markets.
RedK_Directional Index / K xDMIHere's a modern take on the famous DMI/ADX. i first wrote this on another platform few years ago, so i'm happy to be able to share it on TradingView
quick refresher: what does DMI/ADX tell us:
------------------------------------------------------
in simple terms, at the core of this indicator, there are 3 main calculations / lines: the Plus Directional Index ( +DI ) which represents how much the bulls are able to push the high of a bar compared to previous one, the Minus Directional Index ( -DI ), showing how much the bears are able to push the low of a bar from previous one, then the Average Directional index ( ADX ) line, which creates an oscillator of the +DI and -DI to represent the strength of a trend -- usually the lines will be colored accordingly (bulls = green, bears = red, and any different color for the ADX )
Similar to my version of the RSI , we take a classic concept, then use the computing and visualization "super powers" available to us today, to extend and improve on what those masters created in the past. I guess they sort of expected us to do exactly that :)
this "extended" version of DMI/ADX provides couple of highly needed features (in my opinion) -- let's explore:
trying as much as possible to avoid jargon - pls forgive me if i failed in some places.
-------------------------------------------------------------------------------------------------
1 - the big change: the ability to visualize the ADX in a way that makes some more sense.
- the original calculation restricted the ADX to oscillate below zero - i'm sure they had a good reason to build it that way in the past - but to me, it becomes super hard to interpret what the ADX line means, especially when a negative trend (the bears) take over. by removing that restriction and allowing the ADX to oscillate up or down (and we're free to do that, so the indicator shows *us* what *we need* to see), we end up with an improved representation of the trend and the trend strength.
- also the original calculation applies a moving average (default 14 bars) of a moving average (another 14 of the Directional Indexes, which represent the strength of bulls vs bears) to calculate the ADX - that makes the ADX very "removed" from the base price values - i change that, and just smooth the initial +Di / -Di then calculate the ADX from there. again, this shows me the outcome of the (relatively) immediate moves.
2 - i use weighted average WMA () in all my averaging calculations .. i believe this type of average is the best to express the importance of recent days / bars vs the ones further in the past, compared to other averaging techniques
3 - ability to make the DMI volume-weighted .. but contrary to my RSI , this is not set by default.
4 - couple of options to view the unrestricted ADX (as an area or as histogram/columns .. which i call Vertical Bars) for improved visualization
other stuff:
5 - a "step" option for the ADX .. you can set the step option to an increment of, say 5 or 10. this is in case you prefer to see the trend more in "quality" terms - so the equivalent of weak, medium, strong, v. strong...etc -- since in reality, a number like 47.7683 doesn't really mean anything specific
6 - optional "strong trend" adjustable level
Settings & usage suggestion:
-----------------------------------
i prefer to use the defaults (length = 7, smoothing = 3, ..etc) -- i believe these are more suitable to the much faster trading that we have now. you can review the comparison chart and see if this works for you, and adjust as you need.
from a "signal" standpoint, you can use the xDMI as you use the classic DMI/ADX, bulls (or bears) are in control when the corresponding DI line crosses the other going up, *AND* moving above the "strong trend" level that you can set as an extra filter (usually a value between 20 to 30), while ADX will show the quality/strength of the trend.
i suggest you also utilize this indicator with other trend / momentum confirmation methods, and additional analysis and not in isolation - as well as inspecting the prevailing / longer time frame to ensure you're acting in the direction of the broader move / trend.
the above chart includes a side-by-side comparison between our new xDMI with the classic DMI/ADX using the same settings - then we add at the bottom panel also the xDMI, but with my default (faster) settings and showing other visualization options that can be utilized - the Moving Averages on the top / price panel is just to help put the price movement into perspective in terms of trend and trend strength.
The code is open and commented - please feel free to use, share, comment & provide feedback. if you're a DMI fan, and you find this useful in your trading, i would be more than happy to hear about it
Good luck!

Responsive ADX (RADX)Introducing the new Responsive ADX (RADX), running with a (length = 9) and exactly how it differs from the standard built-in ADX you see on TradingView chart.
This indicator is still a true ADX at its core — it measures trend strength from 0 to 100 and uses the classic +DI and –DI lines to show direction — but it has been carefully "tuned" to react noticeably faster while staying smooth and usable. With the length set to 9, it is one of the most responsive versions you can run without turning into noise.
How it behaves differently from the normal (Wilder) ADX
Normal ADX is lagging, now this version gives you the same trend-strength reading 4–8 bars earlier than the built-in ADX. On a daily chart that can easily be 4–8 calendar days of earlier warning. On a 4-hour chart it’s 16–32 hours earlier. That head-start is the whole point.
The ADX line rises and falls much quicker.
When a new trend actually starts, you will often see this Fast ADX cross above 18–20 while the built-in ADX is still sleeping below 15. Conversely, when a trend dies, this version drops faster, so you’re not left holding a dead trade for an extra week.
The +DI and –DI lines are almost identical to the original, but lightly smoothed with a 5-period EMA (you can turn this off). This makes the DI crossovers cleaner and reduces whipsaws without adding meaningful lag.
The final ADX smoothing uses a lightweight Hull-style technique instead of Wilder’s very slow RMA. This is the main “secret sauce” that removes roughly half the lag while keeping the line smooth and readable.
Values are realistic and tradable.
With length 9 you will typically see:
– 0–18 = flat / chop
– 15–20 = emerging trend (background starts colouring)
– 20–50 = strong trend (most people take this as confirmation)
– above 50–60 only in very powerful moves (same as normal ADX)
The aqua / purple background only appears when both conditions are met: the correct DI is on top and Fast ADX is above your chosen “weak-to-trending” level (default 18).
This prevents the background from flashing on and off in sideways markets — exactly the same logic you liked in the original Trinity ADX, but now much earlier.
In very simple terms
Think of the normal built-in ADX as a diesel truck — reliable but slow to accelerate and slow to stop. Fast Responsive ADX with length 9 is the same truck with a turbocharger — same destination and same load capacity, but it gets up to speed twice as fast and brakes earlier when the road turns.
We would recommend people who switch to this version keep the (length 9–12) because the edge in timing is obvious on the chart.
That’s it — this is a new more responsive version, still-logical ADX!

Average Directional Index infoAverage Directional Index (ADX) is a technical indicator created by J. Welles Wilder that measures trend strength (not direction!). Values range from 0 to 100.
This indicator is a supplementary tool for assessing whether trend strategies are worthwhile, monitoring changes in trend strength and avoiding weak, choppy movements
Value Interpretation:
0-25: Weak trend or sideways market
25-50: Moderate to strong trend
50-75: Very strong trend
75-100: Extremely strong trend (rare)
Important: ADX does not indicate trend direction (up/down), only its strength!
This script indicator includes additional features:
1. ADX Plot (purple line)
Basic ADX value showing current trend strength.
2. ADX Trend Analysis (arrows)
The script compares current ADX with its 10-period moving average with ±5% tolerance:
↑ (green): ADX rising → trend strengthening
↓ (red): ADX falling → trend weakening
⮆ (gray): ADX stable → trend strength unchanged
3. Information Table
Displays current ADX value with trend arrow in the top-right corner.
Parameters to Configure
Smoothing (default: 14) - Indicator smoothing period
Lower values (e.g., 7): more sensitive, more signals
Higher values (e.g., 21): more stable, less noise
Indicator Length (default: 14) - Period for calculating directional movement (+DI/-DI)
Wilder's standard value is 14
Trend Length (default: 10) - Period for moving average to analyze ADX dynamics
Determines how quickly changes in trend strength are detected
Practical Application
✅ Strategy 1: Trend Strength Filter
1. ADX > 25 → look for positions aligned with the trend
2. ADX < 25 → avoid trend strategies, consider oscillators
✅ Strategy 2: Entries on Strengthening Trend
1. ADX crosses above 25 + arrow ↑ → trend gaining momentum
2. Combine with other indicators (e.g., EMA) for direction confirmation
✅ Strategy 3: Exhaustion Warning
1. ADX > 50 + arrow ↓ → strong trend may be exhausting
2. Consider profit protection or trailing stop

Fibonacci Retracements & Trend Following Strategy V2This Pine Script strategy generates trading signals using Fibonacci levels and trend-following indicators.
1. Strategy Summary
This strategy analyzes price movements using a combination of Fibonacci levels and trend-following indicators, providing potential trading signals. The strategy includes Fibonacci levels as well as EMA (Exponential Moving Average) and ADX (Average Directional Index) indicators.
2. Indicators and Parameters
Fibonacci Levels
Fibonacci Level 1, Level 2, Level 3, Level 4: Used as Fibonacci retracement levels. These levels are typically set at 0.236, 0.382, 0.618, and 0.786. Users can adjust these values according to their preferences.
Trend-Following Indicator
Trend Length: The period for calculating the EMA used as the trend-following indicator. For example, if set to 20, the EMA will be calculated over 20 periods.
ADX (Average Directional Index)
ADX Length: The period for calculating the ADX. ADX measures the strength of the price trend and is usually set to 14 periods.
ADX Threshold: A threshold value for the ADX. This value determines when trading signals will be activated.
3. Usage Steps
Displaying the Indicator on the Chart:
On the TradingView platform, paste the code into the Pine Editor and click the "Add to Chart" button to add it to the chart.
Analyzing the Indicators:
Fibonacci Levels: Show retracement levels of price movements. When the price reaches one of these levels, potential reversals may occur.
Trend-Following Indicator: EMAs determine the direction of the trend. Green EMA represents an uptrend, while red EMA represents a downtrend.
ADX: Measures the strength of the trend. When ADX surpasses the threshold value, it indicates a strong trend.
Trading Signals:
Long Signal: Generated when the price is above the second Fibonacci level and the trend is upward. Additionally, the ADX value must be above the set threshold.
Short Signal: Generated when the price is below the second Fibonacci level and the trend is downward. Additionally, the ADX value must be above the set threshold.
Target Prices:
Long Targets: Determines upward targets based on Fibonacci levels. These targets indicate expected prices if the price reverses from Fibonacci levels.
Short Targets: Determines downward targets based on Fibonacci levels. These targets indicate expected prices if the price reverses from Fibonacci levels.
4. Chart Displays
Trend Up (Green Line): Shows the rising EMA.
Trend Down (Red Line): Shows the falling EMA.
Fibonacci Levels (Blue Lines): Shows Fibonacci retracement levels.
Long Targets (Green Circles): Shows targets for long positions.
Short Targets (Red Circles): Shows targets for short positions.
Long Signal (Green Label): Buy signal.
Short Signal (Red Label): Sell signal.
5. Important Notes
Retracement and Target Levels: Fibonacci levels can act as potential retracement or support/resistance levels. However, they should always be used in conjunction with other technical analysis tools.
Trend and ADX: ADX is used to determine the strength of the trend. Be aware that when ADX is low, trends may be weak.
6. Example Scenarios
Example 1: If the trend is upward (green EMA) and the price is above the second Fibonacci level, you may receive a long position signal. If the ADX value is above the threshold, the signal may be stronger.
Example 2: If the trend is downward (red EMA) and the price is below the second Fibonacci level, you may receive a short position signal. If the ADX value is above the threshold, the signal may be stronger.
This updated version contains significant improvements in both technical aspects and user experience. Innovations such as ADX calculations and dynamic Fibonacci levels make the strategy more robust and flexible. The code's readability and comprehensibility have been enhanced, and errors have been corrected.
This guide will help you understand the basic operation of the strategy. It is always recommended to conduct your own research and test the strategy before using it.
GOOD LUCK. // halilvarol

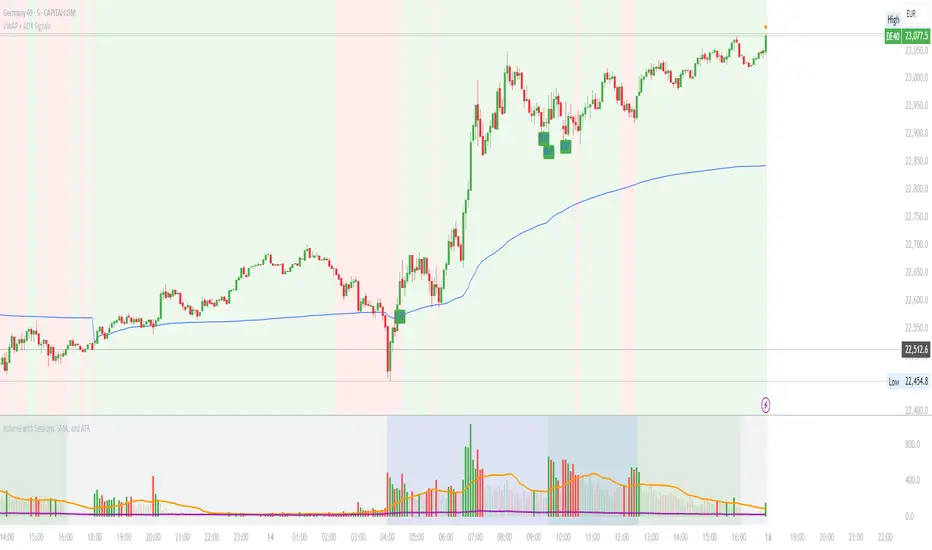
VWAP with ADX Buy/Sell Signals and 50 MA BackgroundThis Pine Script combines several technical indicators to create a comprehensive chart with buy and sell signals based on the ADX and VWAP, as well as background color changes depending on the price relative to the 50-period simple moving average (SMA). Here's a breakdown of what each part of the code does:
1. VWAP Settings
Anchor Period: You can select different periods such as "Session", "Week", "Month", etc. to define the anchor period for the VWAP.
Source: The source for VWAP is set to the typical price (hlc3).
Offset: Allows for shifting the VWAP by a specified amount.
2. ADX Settings
ADX Length: The period used to calculate the ADX.
ADX Smoothing: Used to smooth the ADX for better clarity.
ADX Threshold: Used to filter out weak trends (i.e., signals when ADX > 20).
3. ADX and VWAP Calculation
The ADX values are calculated using ta.dmi(), which returns the +DI, -DI, and ADX lines.
VWAP is calculated using ta.vwap(), based on the selected price source.
4. Buy/Sell Conditions
Buy Signal: A buy signal is generated when:
The +DI crosses above the -DI (indicating an uptrend).
The ADX is above 20 (indicating a strong trend).
The closing price is above the VWAP (indicating bullish market sentiment).
Sell Signal: A sell signal occurs when:
The -DI crosses above the +DI (indicating a downtrend).
The ADX is above 20 (indicating a strong trend).
The closing price is below the VWAP (indicating bearish market sentiment).
5. VWAP Bands
The standard deviation of the price is calculated using ta.stdev(), and the bands are plotted at multiples of the standard deviation (1, 2, and 3).
These bands are used to highlight possible overbought or oversold conditions.
6. 50-period SMA and Background Color
The script calculates a 50-period Simple Moving Average (SMA).
The background color is then changed based on whether the price is above or below the 50-period SMA. If the price is above the SMA, the background is green (bullish), and if it’s below, it’s red (bearish).
7. Plots
The script includes plots for the VWAP line, the ADX and DI lines (optional), and the upper and lower bands.
The buy and sell signals are plotted as shapes with text labels ("BUY" and "SELL") that appear below or above the price bars.
Final Notes:
Band Plots: Three levels of bands (green, olive, teal) are plotted using standard deviation multipliers (1, 2, and 3 times the standard deviation).
Background Color: The background color changes depending on whether the price is above or below the 50 SMA, giving a visual cue for bullish or bearish market conditions.
This indicator aims to offer a multi-faceted view of the market with trend-following signals (via ADX), VWAP for intraday support/resistance, and background coloring to indicate the current trend strength based on the 50 SMA.