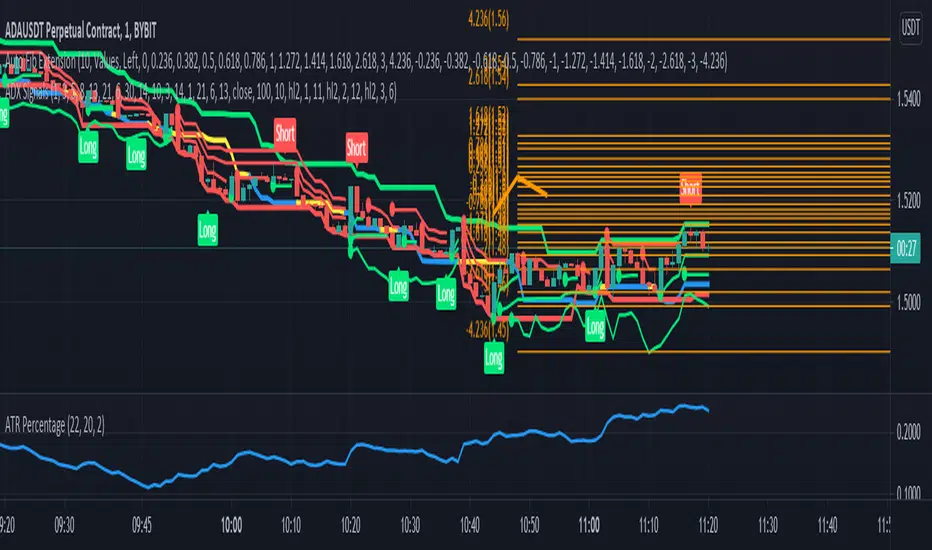
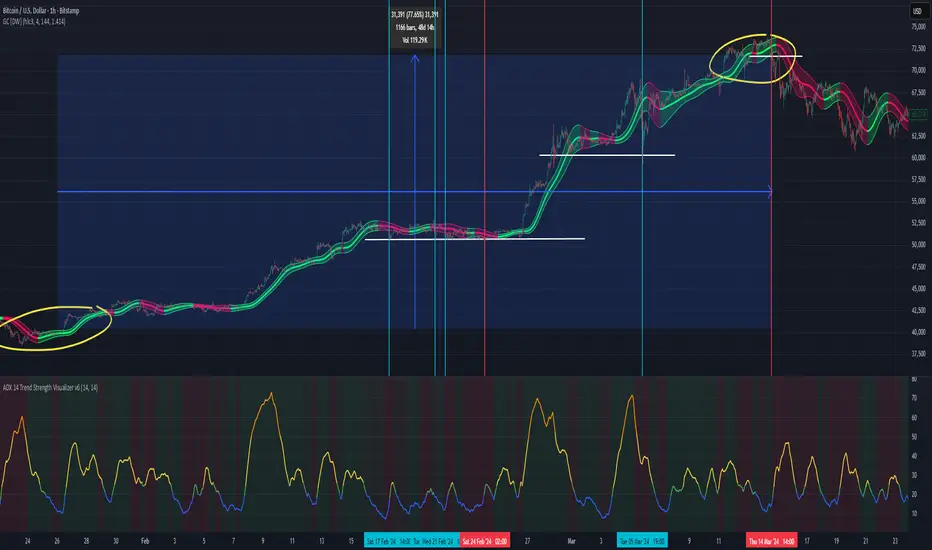
ADX SignalsThis script uses the Average Direction Index, On Balance Volume, and Exponential Moving Average, Moving Average Cross, MACD, Donchian Channels and two Parabolic SARs for stop loss, a normal one and a line one.
I tried to make the script as straightforward as possible, Buy when there is a buy signal and sell when there is a sell signal. I like using it on the smaller time-frames because I'm a scalper and I like going in and out quickly, but this indicator can be used on any timeframe and works on any instrument. The buy signal is triggered when the DI+ goes above the 30 level, the ADX is not increasing, on balance volume is at it's lowest, the price is above the lower Donchian Channel and last MACD hist bar is lower than the previous one. The sell signal is triggered when the DI- goes above the 30 level, the ADX is not increasing, on balance volume is at it's highest, the price is below the upper Donchian Channel and last MACD hist bar is upper than the previous one.
If you have any suggestions feel free to leave them in the comments below or Message me directly.
Cari dalam skrip untuk "adx"
ADX and DI with SMAThe objective of this indicator is to provide a tool to asses if the price is trending ( ADX above SMA ) or range bound ( ADX below SMA ), to decide the type of strategy to apply.
Should be used at a larger time frame than the intended operation time frame.

Hashharvest - ADX Shader v1ADX Shader overlay. Places a background overlay for ADX weak trend (>20 and <25) and places a background overlay for a string trend (>25). Will also show Positive DM and Negative DM crosses.

Moving Average ADXADX Smoothing Trend Color Change on Moving Average and ADX Cross. Use on Hourly Charts - Green UpTrend - Red DownTrend - Black Choppy No Trend

Directional Movement Index + ADX & Keylevel SupportADX and DMI oscillator with the keylevel coded in to the script, set for 23, suggested settings is 23 - 25 any trade with the ADX above the keylevel is a strong indicator that it is trending.

ADX Cloud StyleThis custom indicator visualizes the Directional Movement Index (DMI) system to help identify trend direction and intensity:
Histogram: Displays the net momentum (calculated as DI+ minus DI-). Green bars indicate that buyers are in control (bullish), while red bars indicate sellers are in control (bearish). The height of the bars represents the strength of that dominance.
Cloud (Fill): Shading between the DI+ and DI- lines. It provides a visual backdrop for the trend: green shading for an uptrend and red shading for a downtrend.
Blue Line (ADX): Measures the absolute strength of the trend, regardless of direction. A rising blue line suggests the current trend (whether up or down) is gaining strength, while a falling line suggests consolidation or a weakening trend.

ADX + ATR% Zonas (Overlay - Azul si ambos, si no Naranja)OVERLAY
ADX
ATR
Pintado de Zonas para Entradas Seguras

ADX + RSI Screener FlagsThis indicator screens for ADX under a certain threshold and RSI under a certain threshold. By default set to 13 and 40, respectively, which are key levels indicating a potential bullish reversal.

ADX Below 13 ScreenerSimple indicator made for use in Pine Screener that sets value to "1" if ADX has gone below 13 in the last 5 trading bars.

ADX Scanner with IndicatorsA screener that will allow you to enter up to 10 stocks. The goal is to see clearly in front of you what stocks are moving and the momentum leveraging the ADX and RSI. The return for the day shows the growth or loss of those moves.
ADX Scanner with IndicatorsA screener that will allow you to enter up to 10 stocks. The goal is to see clearly in front of you what stocks are moving and the momentum leveraging the ADX and RSI. The return for the day shows the growth or loss of those moves.

ADX+DMI_by_BIMashed together Chris Moody's ADX thing with his DMI thing.
So you can see trend strength + direction
green-ish = uptrend-ish//red-ish = downtrend-ish
Colors can be adjusted though.
below 10 = gray, not much going on
10 - 20 = light green/light red, could be the beginning o something
20 - 40 = bright green / bright red, something is going on
above 40 = dark green, dark red, exhaustion (default is 40, can be adjusted to whatever)

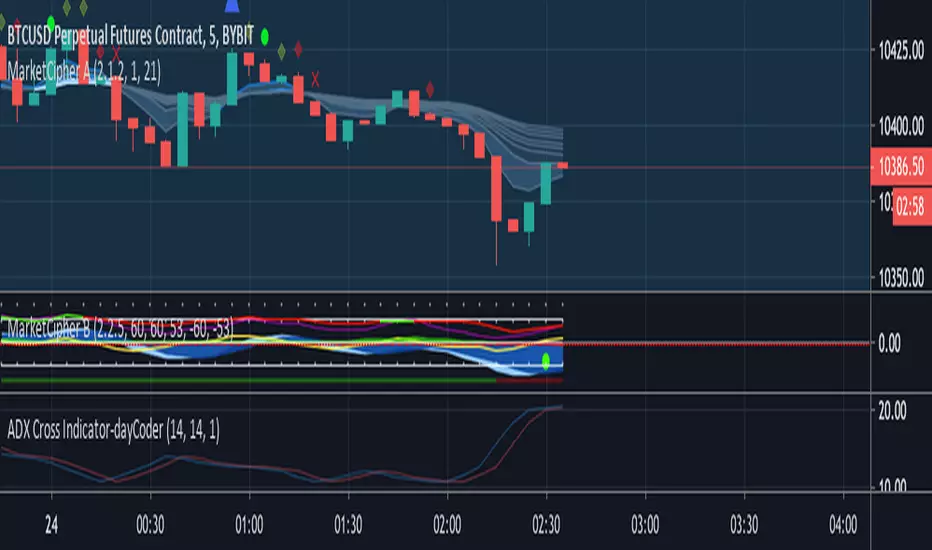
ADX Cross Indicator-dayCoderBased off of the “ADX” indicator, which indicates the strength of the current trend.

ADX and DI + CMF - Mutation [Redbeard]Hello,
this indicator was mainly made for my scalping indicator which you can find on my profile.
It displays:
- ADX and DI
- CMF
It has implemented additional functions and formulas which count the results of the lines different.
Best to use on lower Timeframe!!!!
Especially when you use it with my scalping indicator, then 1min timeframe is best!

ADX & Strength Line 23That line show me if the trend have strength.-
Aveaverage directional index plus 23 Strength Line.

