Ultimate Balance OscillatorIntroducing the Ultimate Balance Oscillator: A Powerful Trading Indicator
Built upon the renowned Rate of Change (ROC), Relative Strength Index (RSI), Commodity Channel Index (CCI), Williams Percent Range, and Average Directional Index (ADX) from TradingView, this indicator equips traders with an unparalleled understanding of market dynamics.
What sets the Ultimate Balance Oscillator apart is its meticulous approach to weighting. Each component is assigned a weight that reflects its individual significance, while carefully mitigating the influence of highly correlated signals. This strategic weighting methodology ensures an unbiased and comprehensive representation of market sentiment, eliminating dominance by any single indicator.
Key Features and Benefits:
1. Comprehensive Market Analysis: The Ultimate Balance Oscillator provides a comprehensive view of market conditions, enabling traders to discern price trends, evaluate momentum shifts, identify overbought or oversold levels, and gauge the strength of prevailing trends. This holistic perspective empowers traders to make well-informed decisions based on a thorough understanding of the market.
2. Enhanced Signal Accuracy: With its refined weighting approach, the Ultimate Balance Oscillator filters out noise and emphasizes the most relevant information. This results in heightened signal accuracy, providing traders with a distinct advantage in identifying optimal entry and exit points. Say goodbye to unreliable signals and welcome a more precise and dependable trading experience.
3. Adaptability to Various Trading Scenarios: The Ultimate Balance Oscillator transcends the constraints of specific markets or timeframes. It seamlessly adapts to diverse trading scenarios, accommodating both short-term trades and long-term investments. Traders can customize this indicator to suit their preferred trading style and effortlessly navigate ever-changing market conditions.
4. Simplicity and Ease of Use: The Ultimate Balance Oscillator simplifies trading analysis by providing a single line on the chart. Its straightforward interpretation and seamless integration into trading strategies make decision-making effortless. By observing bullish or bearish crossovers with the moving average, recognizing overbought or oversold levels, and tracking the overall trend of the oscillator, traders can make well-informed decisions with confidence.
5. Real-time Alerts: Stay ahead of the game with the Ultimate Balance Oscillator's customizable alert system. Traders can set up personalized alerts for bullish or bearish crossovers, breaches of overbought or oversold thresholds, or any specific events that align with their trading strategy. Real-time notifications enable timely action, ensuring traders never miss lucrative trading opportunities.
The Ultimate Balance Oscillator is a robust trading companion, empowering traders to make shrewd and calculated decisions. Embrace its power and elevate your trading endeavors to new heights of precision and success. Discover the potential of the Ultimate Balance Oscillator and unlock a world of trading possibilities.
Cari dalam skrip untuk "adx"

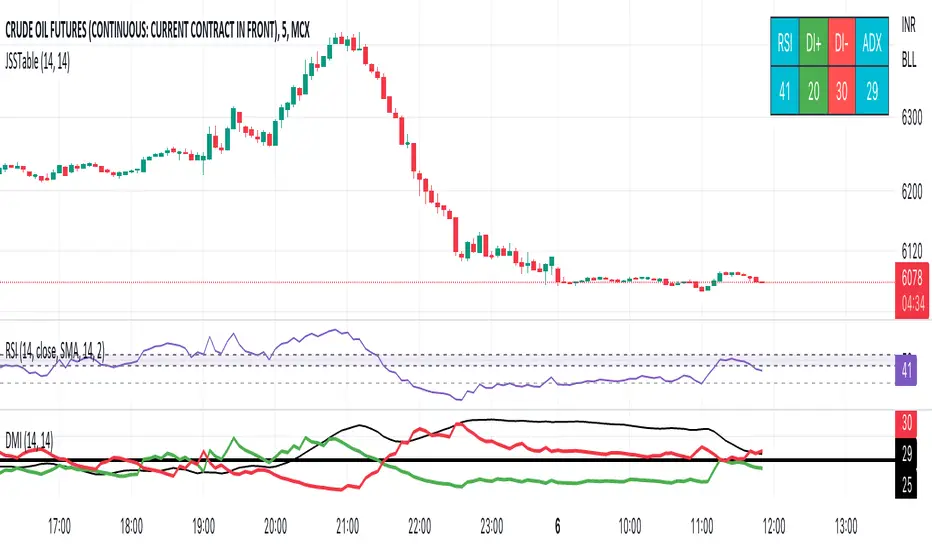
JSS Table - RSI, DI+, DI-, ADXSimple table to show the values for indicators which can be used to initiate trades:
RSI: Long above 55 // Short below 45 // Choppy between 45-55
DI+: Long above 25
DI-: Short above 25
Note when to avoid trend trades:
- If DI+ and DI- are both below 25 then market is choppy
- If RSI is between 45-55 then market is choppy
Super 8 - 30M BTCWelcome to Super 8, the ultimate automatic trading script for Pine!
This bad boy is designed to go both long and short, and it's equipped with all the tools you need to maximize your profits. Whether you're looking to take profit, set a trailing stop, or protect yourself with a stop loss, Super 8 has you covered.
But that's not all! Super 8 is also loaded with 8 powerful indicators to help you make informed decisions. We've got the EMA, ADX, SAR, MACD, VOLUME, BOLLINGER BANDS, DONCHIAN, and ATR all working together to give you the best possible trading experience.
And if you want to take it to the next level, Super 8 also has a feature that lets you use stepped entries in normal mode or incremental 1,2,3,... to improve your average price. Plus, if you're using trailing stop, you can activate the Backtest precision to use lower timeframes.
But what's in a name? Super 8 is called that because it's just that... super! It's tailored specifically for the OKX:BTCUSDT.P pair, so you know you're getting the best possible results. it's highly adjustable and can be used with any other pair. So no matter what market you're trading in, Super 8 has got you covered.
So if you want to level up your trading game, give Super 8 a try. You won't be disappointed.
Certain Risks of Live Algorithmic Trading:
Backtesting Cannot Assure Actual Results.
The relevant market might fail or behave unexpectedly.
Your broker may experience failures in its infrastructure, fail to execute your orders in a correct or timely fashion or reject your orders.
The system you use for generating trading orders, communicating those orders to your broker, and receiving queries and trading results from your broker may fail.
Time lag at various point in live trading might cause unexpected behavior.
The systems of third parties in addition to those of the provider from which we obtain various services, your broker, and the applicable securities market may fail or malfunction.

Supertrend Filtered with MA ADX,Vol & RSI,RVSItest script that combines Supertrend Filtered with MA ADX,Vol & RSI,RVSI
Moving Average Directional IndexMADX is ADX-inspired indicator with moving averages that determines strength of a trend, as well as its direction. Indicator works following:
As the value of MADX increases, so does the strength of a trend
If MADX+ ( green line - bullish MADX ) crosses above MADX- ( red line - bearish MADX ) we consider trend as bullish and vice versa..
There will be situations where MADX- and MADX+ cross multiple times in a short period of time -> that will mean that market indecision is happening and big move will most likely happen after it.
For the calculation of MADX+ and MADX- we need Moving Averages or Exponential Moving Averages with three specific sources ( high, close, low ).
Now, the calculation of each MADX will differ
=> for MADX+: Moving Average (high) / Moving Average (close)
=> for MADX-: Moving Average (close) / Moving Average (low)
Length of Moving Average is editable.

Directional Movement RibbonWhat makes this different from directional movement index?
The aim is to reduce the amount of data analysis necessary before taking action; currently using DMI requires reviewing the DM+ and DM- plots, and ADX as well as review the overall trend of each one. Also there is the final analysis to determine whether a strong trend hasn’t been established at all.
This indicator condenses the information found from the standard DMI into an intuitive colored ribbon that reveals direction and strength at a glance.
How to use it?
Review the ribbon for sentiment based on color, green being bullish and red being bearish, (if using default color scheme). The brightness of the color determines the strength of the sentiment, brightest being strongest. If no color is represented at all then it is due to weakness and/or lack of direction.
Features
All colors customizable
Toggle display of indecision areas
Adjust levels considered strong, weak trends
Which markets is this meant for?
This can be used in any market, though it’s recommended to use with liquid markets where direction and strength can be found often.
What conditions?
Recommend to utilize with key levels and most commonly utilized moving average periods such as 20, 50, 100 or 200.

SBS AlgoHello traders, I am here again with a new and improved indicator.
This indicator is based on a pivot breakout algorithm which gives buy and sell signals according to the breakout of trendline. This is an advanced version of another script. It also takes price action into consideration along with some basic indicators like MACD and ADX to give good entry signals.
NOTE: This indicator is not designed to take entries completely based on signals it gives. Please use it along with your trading strategy to add more confluence to your trading system and maximize your profits.
I hope you guys will like this one too .Enjoy 👍
In case you find any bug, please do report in comment section .Thank you.

ADXVMA iTrend [Loxx]ADXVMA iTrend is an iTrend indicator with ADXVMA smoothing. Trend is used to determine where the trend starts and ends. Adjust the period inputs accordingly to suit your backtest requirements. This is also useful for scalping lower timeframes.
What is the ADXvma - Average Directional Volatility Moving Average?
Linnsoft's ADXvma formula is a volatility-based moving average, with the volatility being determined by the value of the ADX indicator.The ADXvma has the SMA in Chande's CMO replaced with an EMA , it then uses a few more layers of EMA smoothing before the "Volatility Index" is calculated.
Included
Bar coloring
Alerts
Signals
Loxx's Expanded Source Types

Strategy Backtesting Template [MYN]A few people have been asking me to share my backtesting template. Currently I use this as my starting point for validating existing strategies and developing new ones.
Features:
Trading Date Range
Trade Direction
4 progressive take profits with target percents and percentage of position to take profit on (Thanks adolgo)
Variable percentage Stop Loss
Automatic ProfitView Alert Syntax builder for Longs and Shorts
ADX checkbox to automatically add conditional logic to your strategy

DMI Stochastic Extreme Refurbished█ CONCEPTS
DMI Stochastic Extreme was originally published by Barbara Star, PhD, in TASC magazine of January 2013.
Basically it describes an improved version of the ADX DI+/DI- indicator, created by J. Welles Wilder.
In the setup described by the author, the DMI Oscillator is used together with a stochastic oscillator of DMI.
First, the DMI Oscillator is obtained by subtracting the minus directional movement indicator value (DI-) from the plus directional movement value (DI+).
The final result is the "DMI Stochastic Extreme" indicator, in which the stochastic oscillator is calculated. Only instead of using the price value, the stochastic is obtained through the DMI value.
█ Goals
The final indicator described by Barbara is the Stochastic Oscillator of DMI.
However, to use the DMI oscillator together (as described in the magazine), it is necessary to plot it in a separate indicator, which consumes screen space.
That's why the idea of joining both the DMI oscillator and the DMI Stochastic Oscillator into one thing came up, optimizing the visualization.
Taking advantage of the fact that my hands are already dirty :), I created some fine adjustments.
█ HOW TO USE IT
Here are some examples:
1. With default params:
2. With custom DI Length of 21 (Histogram), DI Length of 13 (for Stoch Oscilator), Stoch Length of 5, and another theme.
3. Another params with less noise:
█ THANKS AND CREDITS
- Barbara Star (original creator)
- ucsgears (arrow logic)

Jurik DMX Histogram [Loxx]Jurik DMX Histogram is the ultra-smooth, low lag version of your classic DMI indicator.
What is the directional movement index?
The directional movement index (DMI) is an indicator developed by J. Welles Wilder in 1978 that identifies in which direction the price of an asset is moving. The indicator does this by comparing prior highs and lows and drawing two lines: a positive directional movement line (+DI) and a negative directional movement line (-DI). An optional third line, called the average directional index (ADX), can also be used to gauge the strength of the uptrend or downtrend.
When +DI is above -DI, there is more upward pressure than downward pressure in the price. Conversely, if -DI is above +DI, then there is more downward pressure on the price. This indicator may help traders assess the trend direction. Crossovers between the lines are also sometimes used as trade signals to buy or sell.
What is Jurik Volty used in the Juirk Filter?
One of the lesser known qualities of Juirk smoothing is that the Jurik smoothing process is adaptive. "Jurik Volty" (a sort of market volatility ) is what makes Jurik smoothing adaptive. The Jurik Volty calculation can be used as both a standalone indicator and to smooth other indicators that you wish to make adaptive.
What is the Jurik Moving Average?
Have you noticed how moving averages add some lag (delay) to your signals? ... especially when price gaps up or down in a big move, and you are waiting for your moving average to catch up? Wait no more! JMA eliminates this problem forever and gives you the best of both worlds: low lag and smooth lines.
Ideally, you would like a filtered signal to be both smooth and lag-free. Lag causes delays in your trades, and increasing lag in your indicators typically result in lower profits. In other words, late comers get what's left on the table after the feast has already begun.
What is an adaptive cycle, and what is Ehlers Autocorrelation Periodogram Algorithm?
From his Ehlers' book Cycle Analytics for Traders Advanced Technical Trading Concepts by John F. Ehlers , 2013, page 135:
"Adaptive filters can have several different meanings. For example, Perry Kaufman’s adaptive moving average ( KAMA ) and Tushar Chande’s variable index dynamic average ( VIDYA ) adapt to changes in volatility . By definition, these filters are reactive to price changes, and therefore they close the barn door after the horse is gone.The adaptive filters discussed in this chapter are the familiar Stochastic , relative strength index ( RSI ), commodity channel index ( CCI ), and band-pass filter.The key parameter in each case is the look-back period used to calculate the indicator. This look-back period is commonly a fixed value. However, since the measured cycle period is changing, it makes sense to adapt these indicators to the measured cycle period. When tradable market cycles are observed, they tend to persist for a short while.Therefore, by tuning the indicators to the measure cycle period they are optimized for current conditions and can even have predictive characteristics.
The dominant cycle period is measured using the Autocorrelation Periodogram Algorithm. That dominant cycle dynamically sets the look-back period for the indicators. I employ my own streamlined computation for the indicators that provide smoother and easier to interpret outputs than traditional methods. Further, the indicator codes have been modified to remove the effects of spectral dilation.This basically creates a whole new set of indicators for your trading arsenal."
Included
- Toggle on/off bar coloring
TUE ADX/MACD Confluence V1.0The ADX and MACD confluence can be a powerful predictor in stock movements. This script will help you find those confluences in an easy to understand visual manner.
It includes Buy and Sell signals for detected confluences, and will show colored candles to help you determine when to exit a trade. When the candles turn to white that means the detected confluence is no longer in play and you may want to consider a trailing stop loss.
The Buy and Sell signals will display on the first occurrence of each confluence.
It's important to understand that both of these are lagging indicators, but with a careful attention to your stoploss you can easily generate a positive profit factor.
This code is provided open source and you're free to use it for any purpose other than resale.

Dillon's Double VWAP StrategyThis is based on Dillon's double VWAP strategy.
I enters when the ADX is low (aka not a trending market) and it's not close to the VWAP reset. Check it out.

Multiple Indicators ScreenerA screener for multiple indicators with nice table output.
I was asked many times to update custom screener to display results in a table form. This way it looks much better.
You can play with background colors depend on values you're looking for.
In the screener, for example, I'm highlighting overbought/oversold RSI values, big ADX levels and trend of the Supertrend.
In parameters you can change settings for all indicators and change/disable tickers if 40 is too many for you.
There is only 1 function that calculates all these indicators. Potentially you can change and even add more indicators to this function.
Writing code for these kind of screener is a bit time consuming, so I even created a code generator in Python for these kind of indicators :) .
Disclaimer
Please remember that past performance may not be indicative of future results.
Due to various factors, including changing market conditions, the strategy may no longer perform as well as in historical backtesting.
This post and the script don’t provide any financial advice.

Price Adjusted ADX Trend IdentifierUsed to identify trend by applying advance decline formula directly to price action. The result is smoothed activity that incorporates trend strength so that minor pullbacks and consolidation that result from large moves do not cloud the overall trend of the chart. Also sideways action will identify the end of a trend sooner by incorporating the shrinking advance decline activity into price action.
The value is less important than the trend identification against the shown imbedded Bollinger band.
The script allows for advance decline length to be adjusted. Set at 2. Longer will be less reactive shorter will be more reactive.
I have not traded this indicator but it may be useful in identifying smoother trends. Possibly using the cross of the ADX line against the Bollinger upper/lower/mid lines.
Enjoy.
Bollinger Bands + ADX Strategy// This strategy uses Bollinger Bands to buy when the price
// crosses over the lower band and sell when it crosses down
// the upper band. It only takes trades when the ADX is
// below a certain level, and exits all trades when it's above it.

DMI With Crosses (MyNewTrade)Directional Movement Indicator:
+DI and -DI
I changed the color of the bar bars according to the crossed of +DI and -DI . It helps us to have an idea of whether the trend is continuing or not.
+DI crossover to -DI barcolor is Aqua, if not bar color is Red.
It also helps us to find the lowest and highest points of the graph according to the positions of Adx +DI and -DI .
It gives warnings at the lowest and highest points, which helps us to detect the direction of the trend.


Trending/RangingThis script is a useful tool to use to identify the current market. It includes three other indicators:
1. ATR (combined with a SMA of the ATR)
2. ADX
3. RSI
It allows you to filter for when the market is trending vs. when the market is ranging by using any of the three indicators. You can also combine them to find extremely good trends to trade, or if you're a channel trader, identify when you wouldn't want to trade. This indicator also includes a time frame setting to allow you to ZOOM OUT and explore the long term trend of the security you are trading. I highly recommend using this indicator as a filter for when you enter a trade or not depending on the system you like to trade.

RedK Trader Pressure Index (TPX v1.0) Quick Summary
---------------------
The RedK Trader Pressure Index (REDK_TPX) analyzes the changes in price bars to give the trader a clear visual insight that represents the ongoing fight between the bulls (buyers) and bears (sellers) in the market - to determine who is in control of the price action, which in turn can be helpful in a trader’s decision about how the price action may be unfolding, what type of trade and positions to take (or to close) and when is the ideal time to action.
How the TPX calculation works
---------------------------------------
The TPX uses a simple logic and that’s one of the things I like about it – there is no complex calculation or magic stuff - and the core idea makes sense to me, as well as being one of the ways I needed to analyze my price charts.
The underlying assumption is that the buyers and sellers are competing for control of the market at all time.
- if there’s more buyers than sellers in the market, and if the buyers’ (or bull) pressure is stronger (than the sellers’), they will be able pull the “price range” up – and that means that on the price chart we can expect to see an increase in value in both the “high” and the “low” of the next price bar.
- Similarly, if there’s more sellers than buyers in the market, and if the sellers’ (or bear) pressure is stronger (than the buyers’), they will be able push the “price range” down – on the price chart we can expect to see a decrease in value in both the “high” and the “low” of the next price bar.
So, we will use the change in high and low price, between 2 consecutive price bars, as a proxy for the bull and bear “pressures” – a (weighted) moving average of these “pressure” values are then calculated along with the “Net Pressure” – the final results are plotted.
The importance of the "Control Level"
-----------------------------------------------
As in similar price-action based indicators, there’s a certain threshold or “control level”, above which, the pressure becomes “dominant”
when the bull or bear pressure is above that threshold, they will dominate and control the price move – this level can be found around the 25 or 30. I have included the ability to plot and adjust that control level in the TPX’s settings – and I also show some examples in the chart above (weekly chart for MSFT)
The code is commented and the chart is annotated to explain how to “read” the TPX – and how to interpret the values on the price chart
Using the Trader Pressure Index (TPX) in trading
------------------------------------------------------------
TPX can be valuable in showing well-supported (up or down) price moves that may lead to a strong trend that we can ride (when the pressure value is above the control level) - see exampled above
TPX is also valuable in showing when there’s “lack of interest” from the buyers or the sellers (or both) – which is great in exploring chub or no-trade zones - so basically when to avoid trading.
As usual, it's always recommended to use these types of "price action insight" indicators in conjunction with other trend and momentum indicators (moving averages, MACD..etc), so the insight we gain from them can be properly placed within the broader "context" - and to receive additional confimtion signals to support the trading decision.
I will come back later to post something about how the TPX differs from my recently-posted Strength of Movement (SoM) because they wok completely differently but can be used together with great synergy – and also how the TPX compares to the classic DMI/ADX which uses a similar concept.
Please feel free to integrate in your trading – hope you find this useful - comments and feedback are always welcome

MA+ADX+DMICOINBASE:BTCUSD
BINANCE:BTCUSDT
Use long and short moving average to look for a potential price in/out. (default as 14 and 7, bases on the history experience)
ADX and DMI to prevent the small volatility and tangling MA.
Test it in 4HR, "BINANCE:BTCUSDT"
From 12/1/2017- 11/1/2020 (Mixed Bull/Bear market)
Overall Profit: 560.89%
From 1/1/2018 - 1/1/2019 (Bear market)
Overall Profit: -2.19%
From 4/1/2020 - 11/1/2020 (Bull Market)
Overall Profit: 274.74%
Any suggestion is welcome to discuss.


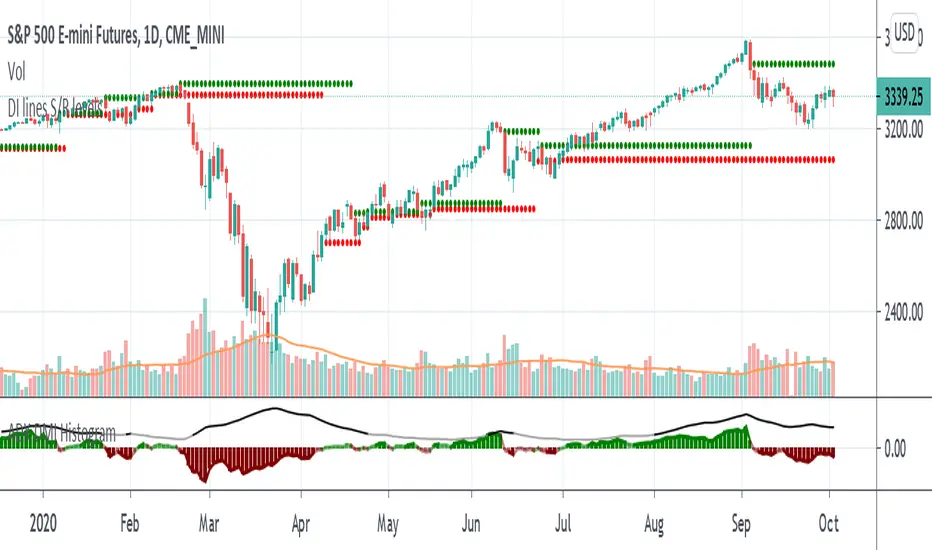
Support and Resistance levels - DMI - DI trailing stop linesThis can be used to compliment the Directional Movement Index if used as a standalone trading system. In addition to using the ADX and DI lines, a trailing stop can be used when the DI lines cross. If the plus line is above to show a buy signal, then the low of the price of when which the cross took place is used as a trailing stop. If the minus line is above to show a sell signal, then the high of the price of when which the cross took place is used as a trailing stop. This helps cut losses sooner whenever the price would end up going through these trailing stops or support/resistance levels yet the DMI system would show an upward or downward move.