Trend Strength & Direction📌 Assumptions of the "Trend Strength & Direction" Model
This model is designed to measure both trend strength and trend direction, using a modified version of the ADX (Average Directional Index) while also identifying ranging markets. Below is a detailed breakdown of all key assumptions.
1️⃣ Using ADX as the Basis for Trend Strength
Why ADX?
The ADX (Average Directional Index) is one of the most commonly used indicators for measuring trend strength, regardless of direction.
How is it calculated?
ATR (Average True Range) is used to normalize volatility.
Directional movement (+DM and -DM) is smoothed with an Exponential Moving Average (EMA) to obtain the +DI (Positive Directional Indicator) and -DI (Negative Directional Indicator).
Trend strength is derived by normalizing the absolute difference between +DI and -DI, divided by the sum of both.
🔹 Assumption: A high ADX means the trend is strong (whether bullish or bearish).
2️⃣ 50-Period Moving Average for Trend Strength
Why add a moving average?
ADX can be very volatile in the short term.
A 50-period SMA (Simple Moving Average) is used to smooth out trend strength and identify sustained trends.
🔹 Assumption: The SMA reduces false signals caused by short-term ADX spikes.
3️⃣ Identifying a Ranging Market (ADX Below 35)
How is a ranging market defined?
If the trend strength (ADX) is below 35, the market is considered "ranging".
The 35-level threshold is chosen empirically since ADX values below this level often indicate a lack of strong price direction.
When the market is ranging, the background color turns yellow.
🔹 Assumption: ADX < 35 indicates a sideways market, so the indicator colors the background yellow.
4️⃣ Determining Trend Direction Using +DI and -DI
How is direction determined?
If +DI > -DI, the trend is bullish (green).
If -DI > +DI, the trend is bearish (red).
If ADX is below 35, the market is ranging and turns yellow.
🔹 Assumption: Trend direction is determined by the relationship between +DI and -DI, not ADX values.
5️⃣ Background Color to Highlight Market Conditions
Yellow background if ADX < 35 → Ranging market.
Green background if ADX ≥ 35 and bullish.
Red background if ADX ≥ 35 and bearish.
🔹 Assumption: The background color visually differentiates trending vs. ranging phases.
6️⃣ Reference Levels for ADX
Lateral Threshold (35) → Below this, the trend is weak or ranging.
Neutral Threshold (50) → Intermediate level indicating moderate trend strength.
Strong Trend Threshold (75) → Above this, the trend is very strong and possibly overextended.
🔹 Assumption: ADX above 75 indicates a very strong trend, potentially near exhaustion.
🔹 Summary of Key Assumptions
1️⃣ ADX is the core strength metric → Strong trends when ADX > 35, weak below 35.
2️⃣ The 50-period SMA smooths out volatility → Prevents false signals.
3️⃣ Ranging markets are defined as ADX < 35 → Yellow background color.
4️⃣ Trend direction is based on +DI vs. -DI → Green = bullish, Red = bearish.
5️⃣ Background colors enhance readability → Helps distinguish different market phases.
6️⃣ ADX reference levels (35, 50, 75) indicate increasing trend strength.
Conclusion
This model combines ADX with a moving average and color-based logic to highlight trend strength, trend direction, and sideways markets. It helps traders quickly identify the best conditions for entering or exiting trades. 🚀
Cari dalam skrip untuk "adx"

Strength Measurement -HTThe Strength Measurement -HT indicator is a tool designed to measure the strength and trend of a security using the Average Directional Index (ADX) across multiple time frames. This script averages the ADX values from five different time frames to provide a comprehensive view of the trend's strength, helping traders make more informed decisions.
Key Features:
Multi-Time Frame Analysis: The indicator calculates ADX values from five different time frames (5 minutes, 15 minutes, 30 minutes, 1 hour, and 4 hours) to offer a more holistic view of the market trend.
Trend Strength Visualization: The average ADX value is plotted as a histogram, with colors indicating the trend strength and direction, making it easy to visualize and interpret.
Reference Levels: The script includes horizontal lines at ADX levels 25, 50, and 75 to signify weak, strong, and very strong trends, respectively.
How It Works
Directional Movement Calculation: The script calculates the positive and negative directional movements (DI+) and (DI-) using the true range over a specified period (default is 14 periods).
ADX Calculation: The ADX value is derived from the smoothed moving average of the absolute difference between DI+ and DI-, normalized by their sum.
Multi-Time Frame ADX: ADX values are computed for the 5-minute, 15-minute, 30-minute, 1-hour, and 4-hour time frames.
Average ADX: The script averages the ADX values from the different time frames to generate a single, comprehensive ADX value.
Trend Visualization: The average ADX value is plotted as a histogram with colors indicating:
Gray for weak trends (ADX < 25)
Green for strengthening trends (25 ≤ ADX < 50)
Dark Green for strong trends (ADX ≥ 50)
Light Red for weakening trends (ADX < 25)
Red for strong trends turning weak (ADX ≥ 25)
Usage
Trend Detection: Use the color-coded histogram to quickly identify the trend strength and direction. Green indicates a strengthening trend, while red signifies a weakening trend.
Reference Levels: Utilize the horizontal lines at ADX levels 25, 50, and 75 as reference points to gauge the trend's strength.
ADX < 25 suggests a weak trend.
ADX between 25 and 50 indicates a moderate to strong trend.
ADX > 50 points to a very strong trend.
Multi-Time Frame Insight: Leverage the averaged ADX value to gain insights from multiple time frames, helping you make more informed trading decisions based on a broader market perspective.
Feel free to explore and integrate this indicator into your trading strategy to enhance your market analysis and decision-making process. Happy trading!

Meta-LR ForecastThis indicator builds a forward-looking projection from the current bar by combining twelve time-compressed “mini forecasts.” Each forecast is a linear-regression-based outlook whose contribution is adaptively scaled by trend strength (via ADX) and normalized to each timeframe’s own volatility (via that timeframe’s ATR). The result is a 12-segment polyline that starts at the current price and extends one bar at a time into the future (1× through 12× the chart’s timeframe). Alongside the plotted path, the script computes two summary measures:
* Per-TF Bias% — a directional efficiency × R² score for each micro-forecast, expressed as a percent.
* Meta Bias% — the same score, but applied to the final, accumulated 12-step path. It summarizes how coherent and directional the combined projection is.
This tool is an indicator, not a strategy. It does not place orders. Nothing here is trade advice; it is a visual, quantitative framework to help you assess directional bias and trend context across a ladder of timeframe multiples.
The core engine fits a simple least-squares line on a normalized price series for each small forecast horizon and extrapolates one bar forward. That “trend” forecast is paired with its mirror, an “anti-trend” forecast, constructed around the current normalized price. The model then blends between these two wings according to current trend strength as measured by ADX.
ADX is transformed into a weight (w) in using an adaptive band centered on the rolling mean (μ) with width derived from the standard deviation (σ) of ADX over a configurable lookback. When ADX is deeply below the lower band, the weight approaches -1, favoring anti-trend behavior. Inside the flat band, the weight is near zero, producing neutral behavior. Clearly above the upper band, the weight approaches +1, favoring a trend-following stance. The transitions between these regions are linear so the regime shift is smooth rather than abrupt.
You can shape how quickly the model commits to either wing using two exponents. One exponent controls how aggressively positive weights lean into the trend forecast; the other controls how aggressively negative weights lean into the anti-trend forecast. Raising these exponents makes the response more gradual; lowering them makes the shift more decisive. An optional switch can force full anti-trend behavior when ADX registers a deep-low condition far below the lower tail, if you prefer a categorical stance in very flat markets.
A key design choice is volatility normalization. Every micro-forecast is computed in ATR units of its own timeframe. The script fetches that timeframe’s ATR inside each security call and converts normalized outputs back to price with that exact ATR. This avoids scaling higher-timeframe effects by the chart ATR or by square-root time approximations. Using “ATR-true” for each timeframe keeps the cross-timeframe accumulation consistent and dimensionally correct.
Bias% is defined as directional efficiency multiplied by R², expressed as a percent. Directional efficiency captures how much net progress occurred relative to the total path length; R² captures how well the path aligns with a straight line. If price meanders without net progress, efficiency drops; if the variation is well-explained by a line, R² rises. Multiplying the two penalizes choppy, low-signal paths and rewards sustained, coherent motion.
The forward path is built by converting each per-timeframe Bias% into a small ATR-sized delta, then cumulatively adding those deltas to form a 12-step projection. This produces a polyline anchored at the current close and stepping forward one bar per timeframe multiple. Segment color flips by slope, allowing a quick read of the path’s direction and inflection.
Inputs you can tune include:
* Max Regression Length. Upper bound for each micro-forecast’s regression window. Larger values smooth the trend estimate at the cost of responsiveness; smaller values react faster but can add noise.
* Price Source. The price series analyzed (for example, close or typical price).
* ADX Length. Period used for the DMI/ADX calculation.
* ATR Length (normalization). Window used for ATR; this is applied per timeframe inside each security call.
* Band Lookback (for μ, σ). Lookback used to compute the adaptive ADX band statistics. Larger values stabilize the band; smaller values react more quickly.
* Flat half-width (σ). Width of the neutral band on both sides of μ. Wider flats spend more time neutral; narrower flats switch regimes more readily.
* Tail width beyond flat (σ). Distance from the flat band edge to the extreme trend/anti-trend zone. Larger tails create a longer ramp; smaller tails reach extremes sooner.
* Polyline Width. Visual thickness of the plotted segments.
* Negative Wing Aggression (anti-trend). Exponent shaping for negative weights; higher values soften the tilt into mean reversion.
* Positive Wing Aggression (trend). Exponent shaping for positive weights; lower values make trend commitment stronger and sooner.
* Force FULL Anti-Trend at Deep-Low ADX. Optional hard switch for extremely low ADX conditions.
On the chart you will see:
* A 12-segment forward polyline starting from the current close to bar\_index + 1 … +12, with green segments for up-steps and red for down-steps.
* A small label at the latest bar showing Meta Bias% when available, or “n/a” when insufficient data exists.
Interpreting the readouts:
* Trend-following contexts are characterized by ADX above the adaptive upper band, pushing w toward +1. The blended forecast leans toward the regression extrapolation. A strongly positive Meta Bias% in this environment suggests directional alignment across the ladder of timeframes.
* Mean-reversion contexts occur when ADX is well below the lower tail, pushing w toward -1 (or forcing anti-trend if enabled). After a sharp advance, a negative Meta Bias% may indicate the model projects pullback tendencies.
* Neutral contexts occur when ADX sits inside the flat band; w is near zero, the blended forecast remains close to current price, and Meta Bias% tends to hover near zero.
These are analytical cues, not rules. Always corroborate with your broader process, including market structure, time-of-day behavior, liquidity conditions, and risk limits.
Practical usage patterns include:
* Momentum confirmation. Combine a rising Meta Bias% with higher-timeframe structure (such as higher highs and higher lows) to validate continuation setups. Treat the 12th step’s distance as a coarse sense of potential room rather than as a target.
* Fade filtering. If you prefer fading extremes, require ADX to be near or below the lower ramp before acting on counter-moves, and avoid fades when ADX is decisively above the upper band.
* Position planning. Because per-step deltas are ATR-scaled, the path’s vertical extent can be mentally mapped to typical noise for the instrument, informing stop distance choices. The script itself does not compute orders or size.
* Multi-timeframe alignment. Each step corresponds to a clean multiple of your chart timeframe, so the polyline visualizes how successively larger windows bias price, all referenced to the current bar.
House-rules and repainting disclosures:
* Indicator, not strategy. The script does not execute, manage, or suggest orders. It displays computed paths and bias scores for analysis only.
* No performance claims. Past behavior of any measure, including Meta Bias%, does not guarantee future results. There are no assurances of profitability.
* Higher-timeframe updates. Values obtained via security for higher-timeframe series can update intrabar until the higher-timeframe bar closes. The forward path and Meta Bias% may change during formation of a higher-timeframe candle. If you need confirmed higher-timeframe inputs, consider reading the prior higher-timeframe value or acting only after the higher-timeframe close.
* Data sufficiency. The model requires enough history to compute ATR, ADX statistics, and regression windows. On very young charts or illiquid symbols, parts of the readout can be unavailable until sufficient data accumulates.
* Volatility regimes. ATR normalization helps compare across timeframes, but unusual volatility regimes can make the path look deceptively flat or exaggerated. Judge the vertical scale relative to your instrument’s typical ATR.
Tuning tips:
* Stability versus responsiveness. Increase Max Regression Length to steady the micro-forecasts but accept slower response. If you lower it, consider slightly increasing Band Lookback so regime boundaries are not too jumpy.
* Regime bands. Widen the flat half-width to spend more time neutral, which can reduce over-trading tendencies in chop. Shrink the tail width if you want the model to commit to extremes sooner, at the cost of more false swings.
* Wing shaping. If anti-trend behavior feels too abrupt at low ADX, raise the negative wing exponent. If you want trend bias to kick in more decisively at high ADX, lower the positive wing exponent. Small changes have large effects.
* Forced anti-trend. Enable the deep-low option only if you explicitly want a categorical “markets are flat, fade moves” policy. Many users prefer leaving it off to keep regime decisions continuous.
Troubleshooting:
* Nothing plots or the label shows “n/a.” Ensure the chart has enough history for the ADX band statistics, ATR, and the regression windows. Exotic or illiquid symbols with missing data may starve the higher-timeframe computations. Try a more liquid market or a higher timeframe.
* Path flickers or shifts during the bar. This is expected when any higher-timeframe input is still forming. Wait for the higher-timeframe close for fully confirmed behavior, or modify the code to read prior values from the higher timeframe.
* Polyline looks too flat or too steep. Check the chart’s vertical scale and recent ATR regime. Adjust Max Regression Length, the wing exponents, or the band widths to suit the instrument.
Integration ideas for manual workflows:
* Confluence checklist. Use Meta Bias% as one of several independent checks, alongside structure, session context, and event risk. Act only when multiple cues align.
* Stop and target thinking. Because deltas are ATR-scaled at each timeframe, benchmark your proposed stops and targets against the forward steps’ magnitude. Stops that are much tighter than the prevailing ATR often sit inside normal noise.
* Session context. Consider session hours and microstructure. The same ADX value can imply different tradeability in different sessions, particularly in index futures and FX.
This indicator deliberately avoids:
* Fixed thresholds for buy or sell decisions. Markets vary and fixed numbers invite overfitting. Decide what constitutes “high enough” Meta Bias% for your market and timeframe.
* Automatic risk sizing. Proper sizing depends on account parameters, instrument specifications, and personal risk tolerance. Keep that decision in your risk plan, not in a visual bias tool.
* Claims of edge. These measures summarize path geometry and trend context; they do not ensure a tradable edge on their own.
Summary of how to think about the output:
* The script builds a 12-step forward path by stacking linear-regression micro-forecasts across increasing multiples of the chart timeframe.
* Each micro-forecast is blended between trend and anti-trend using an adaptive ADX band with separate aggression controls for positive and negative regimes.
* All computations are done in ATR-true units for each timeframe before reconversion to price, ensuring dimensional consistency when accumulating steps.
* Bias% (per-timeframe and Meta) condenses directional efficiency and trend fidelity into a compact score.
* The output is designed to serve as an analytical overlay that helps assess whether conditions look trend-friendly, fade-friendly, or neutral, while acknowledging higher-timeframe update behavior and avoiding prescriptive trade rules.
Use this tool as one component within a disciplined process that includes independent confirmation, event awareness, and robust risk management.

BB Breakout-Momentum + Reversion Strategies# BB Breakout-Momentum + Reversion Strategies
## Overview
This indicator combines two complementary Bollinger Band trading strategies that automatically adapt to market conditions. Strategy 1 capitalizes on trending markets with breakout-pullback-momentum setups, while Strategy 2 exploits mean reversion in ranging markets. Advanced filtering using ADX and BB Width ensures each strategy only fires in its optimal market environment.
---
## Strategy 1: Breakout → Pullback → Renewed Momentum (Long B / Short B)
### Best Market Conditions
- **Trending Markets**: ADX ≥ 25
- **High Volatility**: BB Width ≥ 1.0× average
- Directional price action with sustained momentum
### Entry Logic
**Long B (Bullish Breakout):**
1. **Initial Breakout**: Price breaks above upper Bollinger Band with strong momentum
2. **Controlled Pullback**: Price pulls back 1-12 bars but holds above lower band (stays in trend)
3. **Defended Zone**: Pullback creates a support zone based on swing lows (validated by multiple touches)
4. **Renewed Momentum**: Price reclaims with green candle, volume confirmation, bullish MACD
5. **Position Check**: Entry must have cushion below upper band and room to reach targets
**Short B (Bearish Breakdown):**
- Mirror logic for downtrends: breakdown below lower band, pullback stays below upper band, renewed selling pressure
### Risk Management
- **Stop Loss**: Lower of (zone floor/previous low) OR (1.5 × ATR from entry)
- **Targets**:
- T1: Entry + 0.85R (0.85 × 1.5 ATR)
- T2: Entry + 1.40R (1.40 × 1.5 ATR)
- T3: Entry + 2.50R (2.50 × 1.5 ATR)
- T4: Entry + 4.50R (4.50 × 1.5 ATR)
- Risk is calculated using ATR (ATRX = 1.5 ATR), stop uses tighter of structural level (ATRL) or ATRX
---
## Strategy 2: Bollinger Band Mean Reversion (Long R / Short R)
### Best Market Conditions
- **Ranging Markets**: ADX ≤ 20
- **Low Volatility**: BB Width ≤ 0.8× average
- Price oscillating around the mean without sustained trend
### Entry Logic
**Long R (Long Reversion):**
1. **Overextension**: Price breaks below lower Bollinger Band (2 consecutive closes)
2. **Snap Back**: Price crosses back above lower band (re-enters the range)
3. **Entry Window**: Within 2 candles of re-entry, look for:
- **Green candle** (close > open) confirming bullish strength
- Close above previous candle (close > close )
4. **Trigger**: First qualifying candle within 2-bar window executes the trade
**Short R (Short Reversion):**
1. **Overextension**: Price breaks above upper Bollinger Band (2 consecutive closes)
2. **Snap Back**: Price crosses back below upper band (re-enters the range)
3. **Entry Window**: Within 2 candles of re-entry, look for:
- **Red candle** (close < open) confirming bearish pressure
- Close below previous candle (close < close )
4. **Trigger**: First qualifying candle within 2-bar window executes the trade
### Risk Management
- **Stop Loss**: Lower of (previous high/low) OR (1.5 × ATR from entry)
- **Targets**: Same as Strategy 1 (0.85R, 1.4R, 2.5R, 4.5R based on 1.5 ATR)
- Betting on return to Bollinger Band basis (mean)
---
## Advanced Filtering System
### ADX Filter (Average Directional Index)
- **Purpose**: Measures trend strength vs choppy/ranging conditions
- **Trending**: ADX ≥ 25 → Enables Strategy 1 (Breakout)
- **Ranging**: ADX ≤ 20 → Enables Strategy 2 (Reversion)
- **Neutral**: ADX 20-25 → No signals (indecisive market)
### BB Width Filter
- **Purpose**: Confirms volatility expansion/contraction
- **Wide Bands**: Current width ≥ 1.0× 50-bar average → Trending environment
- **Narrow Bands**: Current width ≤ 0.8× 50-bar average → Ranging environment
- **Logic**: Both ADX and BB Width must agree on market state before signaling
### Combined Logic
- **Strategy 1 fires**: When BOTH ADX shows trending AND bands are wide
- **Strategy 2 fires**: When BOTH ADX shows ranging AND bands are narrow
- **Visual Display**: Table at bottom-right shows ADX value, BB Width ratio, and current market state
---
## Visual Elements
### Bollinger Bands
- **Gray line**: 20-period SMA (basis/mean)
- **Green line**: Upper band (basis + 2 standard deviations)
- **Red line**: Lower band (basis - 2 standard deviations)
### Strategy 1 Markers
- **Long B**: Green triangle below bar with "Long B" text
- **Short B**: Orange triangle above bar with "Short B" text
- **Defended Zones**: Green/red boxes showing pullback support/resistance areas
- **Targets**: Green/orange crosses showing T1-T4 and stop loss levels
### Strategy 2 Markers
- **Long R**: Blue label below bar with "Long R" text
- **Short R**: Purple label above bar with "Short R" text
- **Trade Levels**: Horizontal lines extending 50 bars forward
- Blue solid = Entry price
- Red dashed = Stop loss
- Green/Orange dotted = Targets (T1-T4)
### Market State Table
- **ADX**: Current value with color coding (green=trending, orange=ranging, gray=neutral)
- **BB Width**: Ratio vs 50-bar average (e.g., "1.15x" = 15% wider than average)
- **State**: TREND / RANGE / NEUTRAL classification
---
## Settings & Customization
### Bollinger Bands
- **BB Length**: 20 (default) - period for moving average
- **BB Std Dev**: 2.0 (default) - standard deviation multiplier
### ATR & Risk
- **ATR Length**: 14 (default) - period for Average True Range calculation
- All stop losses and targets are derived from 1.5 × ATR
### Trend/Range Filters
- **ADX Length**: 14 (default)
- **ADX Trending Threshold**: 25 (higher = stronger trend required)
- **ADX Ranging Threshold**: 20 (lower = tighter ranging condition)
- **BB Width Average Length**: 50 (period for comparing current width)
- **BB Width Trend Multiplier**: 1.0 (width must be ≥ this × average)
- **BB Width Range Multiplier**: 0.8 (width must be ≤ this × average)
- **Use ADX Filter**: Toggle on/off
- **Use BB Width Filter**: Toggle on/off
### Strategy 1 (Breakout-Momentum)
- **Breakout Lookback**: 15 bars (how far back to search for initial breakout)
- **Min Pullback Bars**: 1 (minimum consolidation period)
- **Max Pullback Bars**: 12 (maximum consolidation period)
- **Show Defended Zone**: Display support/resistance boxes
- **Show Signals**: Display Long B / Short B markers
- **Show Targets**: Display stop loss and target levels
### Strategy 2 (Reversion)
- **Show Signals**: Display Long R / Short R markers
- **Show Trade Levels**: Display entry, stop, and target lines
---
## How to Use This Indicator
### Step 1: Identify Market State
- Check the table in bottom-right corner
- **TREND**: Look for Strategy 1 signals (Long B / Short B)
- **RANGE**: Look for Strategy 2 signals (Long R / Short R)
- **NEUTRAL**: Wait for clearer conditions
### Step 2: Wait for Signal
- Signals only fire when ALL conditions are met (structural + momentum + filters + room-to-target)
- Signals are relatively rare but high-probability
### Step 3: Execute Trade
- **Entry**: Close of signal candle
- **Stop Loss**: Shown as red cross (Strategy 1) or red dashed line (Strategy 2)
- **Targets**: Scale out at T1, T2, T3, T4 or hold for maximum R:R
### Step 4: Management
- Consider moving stop to breakeven after T1
- Trail stop using swing lows/highs in Strategy 1
- Exit full position at T2-T3 in Strategy 2 (mean reversion has limited upside)
---
## Key Principles
### Why This Works
1. **Market Adaptation**: Uses right strategy for right conditions (trend vs range)
2. **Confluence**: Multiple confirmations required (structure + momentum + volatility + room)
3. **Risk-Defined**: Every trade has pre-calculated stop and targets based on ATR
4. **Probability**: Filters reduce noise and increase win rate by waiting for ideal setups
### Common Pitfalls to Avoid
- ❌ Taking signals in NEUTRAL market state (indicators disagree)
- ❌ Overriding the stop loss (it's calculated for a reason)
- ❌ Expecting signals on every swing (quality over quantity)
- ❌ Using Strategy 1 in ranging markets or Strategy 2 in trending markets
- ❌ Ignoring the room-to-target check (signal won't fire if targets are blocked)
### Complementary Analysis
This indicator works best when combined with:
- Higher timeframe trend analysis
- Key support/resistance levels
- Volume analysis
- Market structure (swing highs/lows)
- Risk management rules (position sizing, max daily loss, etc.)
---
## Technical Details
### Indicators Used
- **Bollinger Bands**: 20-period SMA ± 2 standard deviations
- **ATR**: 14-period Average True Range for volatility measurement
- **ADX**: 14-period Average Directional Index for trend strength
- **EMA**: 10 and 20-period exponential moving averages (Strategy 1 filter)
- **MACD**: 12/26/9 settings (Strategy 1 momentum confirmation)
- **Volume**: Compared to 15-bar average (Strategy 1 confirmation)
### Calculation Methodology
- **ATRL** (Structural Risk): Previous swing high/low or defended zone boundary
- **ATRX** (ATR Risk): 1.5 × 14-period ATR from entry price
- **Stop Loss**: Minimum of ATRL and ATRX (tightest protection)
- **Targets**: Always calculated from ATRX (consistent R-multiples)
- **BB Width Ratio**: Current BB width ÷ 50-period SMA of BB width
---
## Performance Notes
### Strengths
- Adapts to changing market conditions automatically
- Clear, objective entry and exit criteria
- Pre-defined risk on every trade
- Filters reduce false signals significantly
- Works across multiple timeframes and instruments
### Limitations
- Signals are infrequent (by design - quality over quantity)
- Requires patience to wait for all conditions to align
- May miss explosive moves if pullback doesn't form properly (Strategy 1)
- Ranging markets can transition to trending (Strategy 2 risk)
- Filters may delay entry in fast-moving markets
### Best Timeframes
- **Strategy 1**: 1H, 4H, Daily (needs time for proper pullback structure)
- **Strategy 2**: 15M, 30M, 1H (mean reversion works best intraday)
- Both strategies can work on any timeframe if market conditions are right
### Best Instruments
- **Liquid markets**: Major stocks, indices, forex pairs, liquid crypto
- **Sufficient volatility**: ATR should be meaningful relative to price
- **Clear trend/range cycles**: Markets that respect technical levels
---
## IMPORTANT DISCLAIMER
### Risk Warning
**TRADING INVOLVES SUBSTANTIAL RISK OF LOSS AND IS NOT SUITABLE FOR ALL INVESTORS.**
This indicator is provided for **educational and informational purposes only**. It does not constitute financial advice, investment advice, trading advice, or any other sort of advice. You should not treat any of the indicator's content as such.
### No Guarantee of Profit
Past performance is not indicative of future results. No trading strategy, including this indicator, can guarantee profits or protect against losses. The market is inherently unpredictable and all trading involves risk.
### User Responsibility
- **Do Your Own Research**: Always conduct your own analysis before making trading decisions
- **Test First**: Backtest and paper trade this strategy before risking real capital
- **Risk Management**: Never risk more than you can afford to lose
- **Position Sizing**: Use appropriate position sizes relative to your account
- **Stop Losses**: Always use stop losses and respect them
- **Market Conditions**: Understand that market conditions change and past behavior may not repeat
### No Liability
The creator of this indicator accepts no liability for any financial losses incurred through the use of this tool. All trading decisions are made at your own risk. You are solely responsible for evaluating the merits and risks associated with the use of any trading systems, signals, or content provided.
### Not Financial Advice
This indicator does not take into account your personal financial situation, investment objectives, risk tolerance, or specific needs. You should consult with a licensed financial advisor before making any investment decisions.
### Technical Limitations
- Indicators can repaint or lag in real-time
- Past signals may look different than real-time signals
- Code bugs or errors may exist despite testing
- TradingView platform limitations may affect functionality
### Market Risks
- Markets can gap, causing stops to be executed at worse prices
- Slippage and commissions can significantly impact results
- High volatility can cause unexpected losses
- Counterparty risk exists in all leveraged products
---
## Version History
- **v1.0**: Initial release combining breakout-momentum and mean reversion strategies
- Includes ADX and BB Width filtering
- ATRL/ATRX risk calculation system
- 2-candle entry window for reversion trades
---
## Credits & License
This indicator combines concepts from classical technical analysis including Bollinger Bands (John Bollinger), ATR (Welles Wilder), and ADX (Welles Wilder). The specific implementation and combination of filters is original work.
**Use at your own risk. Trade responsibly.**
---
*For questions, suggestions, or to report bugs, please comment below or contact the author.*
**Remember: The best indicator is the one between your ears. Use this tool as part of a comprehensive trading plan, not as a standalone solution.**

Average Directional Index with MACombining the Average Directional Index (ADX) with a 14-period Exponential Moving Average (EMA) can provide traders with a comprehensive approach to identify both the strength of a trend (through ADX) and the trend's direction (using EMA). Let's break down each component and then discuss how they can be combined:
Average Directional Index (ADX):
The ADX is a technical indicator that measures the strength or momentum of a trend, regardless of its direction. The ADX is derived from two other indicators:
Positive Directional Index (+DI): Measures the strength of upward price movement.
Negative Directional Index (-DI): Measures the strength of downward price movement.
14-period Exponential Moving Average (EMA):
The 14-period EMA is a trend-following indicator that gives more weight to recent price data compared to simple moving averages (SMAs). The EMA is calculated by taking the average of the last 14 closing prices, giving more importance to the most recent prices.
Combining ADX and EMA:
When combining ADX with a 14-period EMA:
ADX as a Filter:
Traders might use the ADX to filter out trades when the trend's strength is weak (e.g., ADX below 25) to avoid trading in sideways or choppy markets.
EMA for Trend Direction:
Traders can use the 14-period EMA to determine the trend direction.
A price above the 14-period EMA might indicate an uptrend, while a price below the EMA might suggest a downtrend.
Example Strategy:
Here's a simplified trading strategy combining ADX and EMA:
Trend Identification:
Buy when the price is above the 14-period EMA and the ADX indicates a strong uptrend (e.g., ADX > 25).
Sell or go short when the price is below the 14-period EMA and the ADX indicates a strong downtrend (e.g., ADX > 25).
Avoid Choppy Markets:
Avoid trading when the ADX is below a certain threshold (e.g., ADX < 25) to filter out sideways or range-bound markets.
Combining ADX and a 14-period EMA can provide traders with a balanced approach to identify both the strength and direction of a trend. However, it's essential to remember that no indicator or strategy can guarantee profits, and it's crucial to use risk management techniques and other tools to make informed trading decisions. Consider back testing this strategy on historical data and adjusting the parameters based on their trading style and risk tolerance.

RSI Bands [APIDEVs]RSI BANDS:
It is an exclusive product of ApiDevs , this indicator selectively integrates a series of highly advanced algorithms that aim to provide the trader with an effective and profitable trading system, based on a series of conditions that project the price direction with a reasonable probability.
This indicator bears the name of “RSI Bands” , this is because we have based this trading system on the “Relative Strength Index (RSI)” , the strength of this indicator is centennial and we at APIDEVs have decided to focus our efforts on the development of powerful tools based on the favorite indicators of the afternoon.
WHAT IT HAS INCORPORATED:
1. Exponential Moving Average (EMAs): The RSI Bands has, by default, a band composed of two moving averages of 10 and 55 exponential periods, which can be modified in the indicator menu.
• Possibility of changing the value of the EMAs.
• Function was enabled to change the color and transparency of the bands.
• Visual alerts SHORT (L) and LONG (L) were added when there is the crossing of the EMAS.
• Hull Moving Average (HMA) of 100 periods was also incorporated, also modifiable for those who wish to strengthen their visual analysis. (Disabled by default)
• We also add an Exponential Moving Average (EMA) of 200 periods to mark the trend. (Disabled by default).
2. A TR (Average True Range): This indicator has two main functions in the RSI Bands, the first is to mark the trend of the asset and the second is to establish a margin of safety in price volatility, that is, a maximum estimate of the setbacks without this representing a change in the direction of the price.
3. RSI (Relative Strength Index): It was visually incorporated into the RSI Bands, the graph is obtained on the right side and its purpose is to visually indicate where the price is with respect to the RSI PRO+ indicator, offering the following improvements :
• ALERT SYSTEM: THE RSI PRO+ has the ADX incorporated into its algorithm, which allows establishing a filter that will provide reliable inputs, represented by the LONG (L) and SHORT (S) signals.
• FILTER AGAINST TREND: The signals described above will be activated according to the crossing of the RSI above the 50 point, provided that the ADX agrees with the market direction.
• Possibility of deactivating this graphical representation.
4. ADX (Average Directional Index): The ADX in this indicator is intended to estimate the strength of the movement, it is present in each part of the code, either to indicate the strength of the market or to serve as a filter against trend. In the same way, we apply certain exclusive improvements for this indicator:
• It was established as default values of the ADX that the Level Range was 10 and the Level Trend 25. This significantly changes the behavior of this indicator, almost completely eliminating the zone of disinterest that was usually considered.
• A function was activated to paint the sails the color of the ADX.
5. ADX Ocillator: Yes, we developed a Wave oscillator type ADX and incorporated it into this strategy. From this indicator, which we recommend using in conjunction with the RSI Bands, we extracted the LONG (L) and SHORT (S) signals. The ADX Oscillator is the improved version of the traditional ADX as it offers the following improvements:
• Its interpretation is much simpler.
• Allows you to set entry and exit signals during the trend change and during the price path.
• It has an integrated alert system.
STRATEGY PANEL:
This panel is an exclusive creation of APIDEVs , and its purpose is to parameterize five conditionals based on the indicators that make up our RSI strategy, giving the trader an immediate vision of the status of the asset analyzed considering this strategy. That is, we decided to transfer our experience of using this indicator on a panel that will project the price trajectory visually. It has the following characteristics:
• It can be placed anywhere on the screen through the main menu of the indicator, it can even be deactivated.
• It can be resized, we designed this to adapt to all types of screens, including those of mobile phones.
• It has an upper panel called "Project" which will calculate the percentage probability that the price has to take a direction based on all the indicators incorporated into the strategy. Their values range from (+ 100%) to (-100%).
STRATEGY PANEL PARAMETERS:
1. EMAs : This panel has 2 variables:
• LONG : If the fast EMA is above the slow EMA.
• SHORT : If the fast EMA is below the slow EMA.
2. RSI : This panel has 3 variables:
• LONG : The RSI should be bullish (green) and above the 50 point.
• SHORT : The RSI should be bearish (red) and be below the 50 point.
• RANK: (Range)this condition is activated when there is no concordance with the RSI condition and its crossing.
3. ATR : This panel has 2 variables:
• LONG : When the price is above the ATR.
• SHORT : When the price is below the ATR.
4. ADX: This panel has 3 variables:
• LONG : The ADX is green. That is, the DI + is above the DI-.
• SHORT : The ADX is red. That is, the DI- is above the DI +.
• RANK : ADX is below point 10.
It also has a numerical value that indicates the value of the ADX and two texts indicating the strength of the trend:
• Trend (bullish or bearish).
• Strong trend (bullish or bearish).
5. OSC : This panel has 3 variables:
• LONG : The oscillator slopes upward and the built-in ADX is green.
• SHORT : The oscillator slopes downward and the built-in ADX is red.
• RANK : The oscillator slopes downward and the built-in ADX is green and the opposite. In short, there is no coherence in the movement of the oscillator and the projection of the ADX.

P6●智能资金概念交易系统//@version=5
indicator("P6●智能资金概念交易系统", overlay=true, max_boxes_count = 500, max_labels_count = 500)
// === 参数分类标题 ===
// --------------------------
// 1. 基础指标设置
// --------------------------
// 2. 范围过滤器 设置
// --------------------------
// 3. ADX 趋势过滤器 设置
// --------------------------
// 4. 趋势线 设置
// --------------------------
// 5. 支撑与阻力 设置
// --------------------------
// 6. PMA 设置
// --------------------------
// 7. 交易信息表格 设置
// --------------------------
// 8. 顶部规避 设置
// --------------------------
// 9. 底部规避 设置
// --------------------------
// 10. RSI 动量指标 设置
// --------------------------
// 11. 多时间框架 设置
// --------------------------
// === 显示/隐藏选项 ===
showRangeFilter = input.bool(true, title="显示 范围过滤器", group="1. 基础指标设置")
showADXFilter = input.bool(true, title="启用 ADX 趋势过滤器", group="1. 基础指标设置")
showTrendLines = input.bool(false, title="显示 趋势线", group="1. 基础指标设置")
showSupRes = input.bool(true, title="显示 支撑与阻力", group="1. 基础指标设置")
showPMA = input.bool(true, title="显示 多周期移动平均线", group="1. 基础指标设置")
showTable = input.bool(true, title="显示 交易信息表格", group="1. 基础指标设置")
showTopAvoidance = input.bool(false, title="启用 顶部规避系统", group="1. 基础指标设置")
showBottomAvoidance = input.bool(false, title="启用 底部规避系统", group="1. 基础指标设置")
showRSI = input.bool(false, title="启用 RSI 动量指标", group="1. 基础指标设置")
showMTF = input.bool(true, title="启用 多时间框架分析", group="1. 基础指标设置")
// === RSI 动量指标 设置 ===
rsiLength = input.int(14, title="RSI 周期", minval=1, group="10. RSI 动量指标 设置")
rsiOverbought = input.float(70.0, title="超买阈值", minval=50, maxval=90, step=1, group="10. RSI 动量指标 设置")
rsiOversold = input.float(30.0, title="超卖阈值", minval=10, maxval=50, step=1, group="10. RSI 动量指标 设置")
rsiNeutralUpper = input.float(60.0, title="中性区间上沿", minval=50, maxval=70, step=1, group="10. RSI 动量指标 设置")
rsiNeutralLower = input.float(40.0, title="中性区间下沿", minval=30, maxval=50, step=1, group="10. RSI 动量指标 设置")
// === 多时间框架设置 ===
mtfEnable1m = input.bool(true, title="启用 1分钟", group="11. 多时间框架 设置")
mtfEnable5m = input.bool(true, title="启用 5分钟", group="11. 多时间框架 设置")
mtfEnable15m = input.bool(true, title="启用 15分钟", group="11. 多时间框架 设置")
mtfEnable1h = input.bool(true, title="启用 1小时", group="11. 多时间框架 设置")
mtfEnable4h = input.bool(true, title="启用 4小时", group="11. 多时间框架 设置")
// === RSI 计算与状态判断 ===
rsiValue = ta.rsi(close, rsiLength)
rsiPrevious = ta.rsi(close , rsiLength)
// RSI 动量状态判断
getRSIStatus() =>
status = "动量中性"
// 动量回落条件:RSI从高位下降或处于下降趋势
fallCondition1 = rsiValue < rsiPrevious and rsiValue > rsiNeutralUpper
fallCondition2 = rsiValue >= rsiOverbought and rsiValue < rsiPrevious
fallCondition3 = rsiPrevious >= rsiOverbought and rsiValue < rsiOverbought and rsiValue < rsiPrevious
if fallCondition1 or fallCondition2 or fallCondition3
status := "动量回落"
// 动量回升条件:RSI从低位上升或处于上升趋势
riseCondition1 = rsiValue > rsiPrevious and rsiValue < rsiNeutralLower
riseCondition2 = rsiValue <= rsiOversold and rsiValue > rsiPrevious
riseCondition3 = rsiPrevious <= rsiOversold and rsiValue > rsiOversold and rsiValue > rsiPrevious
if riseCondition1 or riseCondition2 or riseCondition3
status := "动量回升"
// 动量中性条件:RSI在中性区间或无明确趋势
if rsiValue >= rsiNeutralLower and rsiValue <= rsiNeutralUpper
status := "动量中性"
status
rsiStatus = getRSIStatus()
// RSI 信号与其他指标结合
rsiSupportsBuy = rsiStatus == "动量回升" or (rsiValue <= rsiOversold and rsiValue > rsiPrevious)
rsiSupportssell = rsiStatus == "动量回落" or (rsiValue >= rsiOverbought and rsiValue < rsiPrevious)
// === 多时间框架数据获取 ===
// 简化的多时间框架趋势计算
calcSimpleTrend(src) =>
ema21 = ta.ema(src, 21)
ema50 = ta.ema(src, 50)
trend = src > ema21 and ema21 > ema50 ? 1 : src < ema21 and ema21 < ema50 ? -1 : 0
trend
// 获取各时间框架的趋势数据
trend1m = showMTF and mtfEnable1m ? request.security(syminfo.tickerid, "1", calcSimpleTrend(close)) : 0
trend5m = showMTF and mtfEnable5m ? request.security(syminfo.tickerid, "5", calcSimpleTrend(close)) : 0
trend15m = showMTF and mtfEnable15m ? request.security(syminfo.tickerid, "15", calcSimpleTrend(close)) : 0
trend1h = showMTF and mtfEnable1h ? request.security(syminfo.tickerid, "60", calcSimpleTrend(close)) : 0
trend4h = showMTF and mtfEnable4h ? request.security(syminfo.tickerid, "240", calcSimpleTrend(close)) : 0
// === 多时间框架趋势判断函数 ===
getTrendDirection(trend) =>
if trend > 0
"多头倾向"
else if trend < 0
"空头倾向"
else
"震荡"
// 获取各时间框架趋势方向
trend1mDir = getTrendDirection(trend1m)
trend5mDir = getTrendDirection(trend5m)
trend15mDir = getTrendDirection(trend15m)
trend1hDir = getTrendDirection(trend1h)
trend4hDir = getTrendDirection(trend4h)
// === 顶部规避系统 ===
ma_period_top = input.int(10, 'MA Period (Length)', group='8. 顶部规避 设置')
topThreshold = input.int(85, 'VAR顶部阈值', minval=70, maxval=95, step=1, group='8. 顶部规避 设置')
// 计算VAR指标 - 顶部(检测上涨动能)
pre_price_top = close
VAR_top = ta.sma(math.max(close-pre_price_top,0), ma_period_top) / ta.sma(math.abs(close-pre_price_top), ma_period_top) * 100
// 顶部信号 - 当上涨动能达到高位时
isTop = VAR_top > topThreshold and VAR_top <= topThreshold
// 图表显示顶部标记
plotshape(series=showTopAvoidance and isTop, title="顶", style=shape.labeldown, location=location.abovebar,
color=color.new(color.purple, 0), textcolor=color.white, size=size.normal, text="顶")
// === 底部规避系统 ===
ma_period_bottom = input.int(14, 'MA Period (Length)', group='9. 底部规避 设置')
bottomThreshold = input.int(15, 'VAR底部阈值', minval=5, maxval=30, step=1, group='9. 底部规避 设置')
// 计算VAR指标 - 底部(检测下跌动能)
pre_price_bottom = close
VAR_bottom = ta.sma(math.max(pre_price_bottom-close,0), ma_period_bottom) / ta.sma(math.abs(close-pre_price_bottom), ma_period_bottom) * 100
// 底部信号 - 当下跌动能达到高位时
isBottom = VAR_bottom > bottomThreshold and VAR_bottom <= bottomThreshold
// 图表显示底部标记
plotshape(series=showBottomAvoidance and isBottom, title="底", style=shape.labelup, location=location.belowbar,
color=color.new(color.orange, 0), textcolor=color.white, size=size.normal, text="底")
// === 范围过滤器 部分 ===
upColor = color.white
midColor = #90bff9
downColor = color.blue
src = input(defval=close, title="数据源", group="2. 范围过滤器 设置")
per = input.int(defval=100, minval=1, title="采样周期", group="2. 范围过滤器 设置")
mult = input.float(defval=3.0, minval=0.1, title="区间倍数", group="2. 范围过滤器 设置")
smoothrng(x, t, m) =>
wper = t * 2 - 1
avrng = ta.ema(math.abs(x - x ), t)
smoothrng = ta.ema(avrng, wper) * m
smoothrng
smrng = smoothrng(src, per, mult)
rngfilt(x, r) =>
rngfilt = x
rngfilt := x > nz(rngfilt ) ? x - r < nz(rngfilt ) ? nz(rngfilt ) : x - r :
x + r > nz(rngfilt ) ? nz(rngfilt ) : x + r
rngfilt
filt = rngfilt(src, smrng)
upward = 0.0
upward := filt > filt ? nz(upward ) + 1 : filt < filt ? 0 : nz(upward )
downward = 0.0
downward := filt < filt ? nz(downward ) + 1 : filt > filt ? 0 : nz(downward )
hband = filt + smrng
lband = filt - smrng
filtcolor = upward > 0 ? upColor : downward > 0 ? downColor : midColor
barcolor_ = src > filt and src > src and upward > 0 ? upColor :
src > filt and src < src and upward > 0 ? upColor :
src < filt and src < src and downward > 0 ? downColor :
src < filt and src > src and downward > 0 ? downColor : midColor
longCond = bool(na)
shortCond = bool(na)
longCond := src > filt and src > src and upward > 0 or
src > filt and src < src and upward > 0
shortCond := src < filt and src < src and downward > 0 or
src < filt and src > src and downward > 0
CondIni = 0
CondIni := longCond ? 1 : shortCond ? -1 : CondIni
// === ADX 趋势过滤器 部分 ===
adxLength = input.int(defval=14, minval=1, title="ADX 周期", group="3. ADX 趋势过滤器 设置")
adxThreshold = input.float(defval=25.0, minval=0, maxval=100, step=0.5, title="ADX 阈值", tooltip="ADX大于此值才允许交易信号", group="3. ADX 趋势过滤器 设置")
// 简化的ADX计算 - 更准确的方法
calcADX(len) =>
up = ta.change(high)
down = -ta.change(low)
plusDM = na(up) ? na : (up > down and up > 0 ? up : 0)
minusDM = na(down) ? na : (down > up and down > 0 ? down : 0)
truerange = ta.rma(ta.tr, len)
plus = fixnan(100 * ta.rma(plusDM, len) / truerange)
minus = fixnan(100 * ta.rma(minusDM, len) / truerange)
sum = plus + minus
adx = 100 * ta.rma(math.abs(plus - minus) / (sum == 0 ? 1 : sum), len)
= calcADX(adxLength)
// ADX状态判断
adxStrong = adxValue >= adxThreshold
adxTrendUp = diPlus > diMinus
adxTrendDown = diMinus > diPlus
// 修改信号生成逻辑,加入顶部和底部规避以及RSI确认
longCondition = longCond and CondIni == -1 and (not showADXFilter or adxStrong) and (not showTopAvoidance or not isTop) and (not showRSI or rsiSupportsBuy)
shortCondition = shortCond and CondIni == 1 and (not showADXFilter or adxStrong) and (not showBottomAvoidance or not isBottom) and (not showRSI or rsiSupportssell)
// === 记录买卖信号价格 ===
var float entryPrice = na
var string entryType = na
var float entryTime = na
// 当出现买入信号时记录
if longCondition
entryPrice := close
entryType := "多单"
entryTime := time
// 当出现卖出信号时记录
if shortCondition
entryPrice := close
entryType := "空单"
entryTime := time
// === 趋势颜色逻辑 ===
var trendColor = color.gray
if longCondition
trendColor := color.green
else if shortCondition
trendColor := color.red
// ADX线绘制(可选)- 已隐藏显示
adxColor = adxStrong ? (adxTrendUp ? color.green : color.red) : color.gray
// plot(showADXLine and showADXFilter ? adxValue : na, title="平均方向指数", color=adxColor, linewidth=1)
// hline(showADXLine and showADXFilter ? adxThreshold : na, title="ADX阈值线", color=color.yellow, linestyle=hline.style_dashed)
// 绘图部分 - 已隐藏线条显示,保留功能
// filtplot = plot(showRangeFilter ? filt : na, color=trendColor, linewidth=2, title="区间过滤器")
// hbandplot = plot(showRangeFilter ? hband : na, color=color.new(trendColor, 30), title="上轨线", linewidth=1)
// lbandplot = plot(showRangeFilter ? lband : na, color=color.new(trendColor, 30), title="下轨线", linewidth=1)
// barcolor(na) - 已隐藏K线颜色
plotshape(showRangeFilter and longCondition, title="买入信号", text="买", textcolor=color.white, style=shape.labelup, size=size.small, location=location.belowbar, color=color.new(color.green, 20))
plotshape(showRangeFilter and shortCondition, title="卖出信号", text="卖", textcolor=color.white, style=shape.labeldown, size=size.small, location=location.abovebar, color=color.new(color.red, 20))
// === 趋势线 部分 ===
length_tl = input.int(14, '分型回溯长度', group="4. 趋势线 设置")
mult_tl = input.float(1., '斜率系数', minval = 0, step = .1, group="4. 趋势线 设置")
calcMethod = input.string('平均真实波幅', '斜率计算方法', options = , group="4. 趋势线 设置")
backpaint = input(true, tooltip = '回溯显示:将可视元素向历史偏移,禁用后可查看实时信号。', group="4. 趋势线 设置")
upCss = input.color(color.teal, '上升趋势线颜色', group = "4. 趋势线 设置")
dnCss = input.color(color.red, '下降趋势线颜色', group = "4. 趋势线 设置")
showExt = input(true, '显示延长线', group="4. 趋势线 设置")
var upper_tl = 0.
var lower_tl = 0.
var slope_ph_tl = 0.
var slope_pl_tl = 0.
var offset_tl = backpaint ? length_tl : 0
n = bar_index
src_tl = close
ph = ta.pivothigh(length_tl, length_tl)
pl = ta.pivotlow(length_tl, length_tl)
slope = switch calcMethod
'平均真实波幅' => ta.atr(length_tl) / length_tl * mult_tl
'标准差' => ta.stdev(src_tl, length_tl) / length_tl * mult_tl
'线性回归' => math.abs(ta.sma(src_tl * n, length_tl) - ta.sma(src_tl, length_tl) * ta.sma(n, length_tl)) / ta.variance(n, length_tl) / 2 * mult_tl
slope_ph_tl := ph ? slope : slope_ph_tl
slope_pl_tl := pl ? slope : slope_pl_tl
upper_tl := ph ? ph : upper_tl - slope_ph_tl
lower_tl := pl ? pl : lower_tl + slope_pl_tl
var upos = 0
var dnos = 0
upos := ph ? 0 : close > upper_tl - slope_ph_tl * length_tl ? 1 : upos
dnos := pl ? 0 : close < lower_tl + slope_pl_tl * length_tl ? 1 : dnos
var uptl = line.new(na,na,na,na, color = upCss, style = line.style_dashed, extend = extend.right)
var dntl = line.new(na,na,na,na, color = dnCss, style = line.style_dashed, extend = extend.right)
if ph and showExt and showTrendLines
line.set_xy1(uptl, n-offset_tl, backpaint ? ph : upper_tl - slope_ph_tl * length_tl)
line.set_xy2(uptl, n-offset_tl+1, backpaint ? ph - slope : upper_tl - slope_ph_tl * (length_tl+1))
if pl and showExt and showTrendLines
line.set_xy1(dntl, n-offset_tl, backpaint ? pl : lower_tl + slope_pl_tl * length_tl)
line.set_xy2(dntl, n-offset_tl+1, backpaint ? pl + slope : lower_tl + slope_pl_tl * (length_tl+1))
plot(showTrendLines ? (backpaint ? upper_tl : upper_tl - slope_ph_tl * length_tl) : na, '上升趋势线', color = ph ? na : upCss, offset = -offset_tl)
plot(showTrendLines ? (backpaint ? lower_tl : lower_tl + slope_pl_tl * length_tl) : na, '下降趋势线', color = pl ? na : dnCss, offset = -offset_tl)
// 趋势线突破也需要ADX确认,并加入顶部和底部规避以及RSI确认
trendLineBuySignal = showTrendLines and upos > upos and (not showADXFilter or adxStrong) and (not showTopAvoidance or not isTop) and (not showRSI or rsiSupportsBuy)
trendLineSellSignal = showTrendLines and dnos > dnos and (not showADXFilter or adxStrong) and (not showBottomAvoidance or not isBottom) and (not showRSI or rsiSupportssell)
plotshape(trendLineBuySignal ? low : na, "上轨突破"
, shape.labelup
, location.absolute
, upCss
, text = "突"
, textcolor = color.white
, size = size.tiny)
plotshape(trendLineSellSignal ? high : na, "下轨突破"
, shape.labeldown
, location.absolute
, dnCss
, text = "突"
, textcolor = color.white
, size = size.tiny)
alertcondition(trendLineBuySignal, '上轨突破', '价格向上突破下趋势线')
alertcondition(trendLineSellSignal, '下轨突破', '价格向下突破上趋势线')
// === 支撑与阻力 部分 ===
g_sr = '5. 支撑与阻力'
g_c = '条件'
g_st = '样式'
t_r = 'K线确认:仅在K线收盘时生成警报(延后1根K线)。\n\n高点与低点:默认情况下,突破/回踩系统使用当前收盘价判断,选择高点与低点后将使用高低点判断条件,不再重绘,结果会不同。'
t_rv = '每当检测到潜在回踩时,指标会判断回踩事件即将发生。此输入用于设置在潜在回踩激活时,最大允许检测多少根K线。\n\n例如,出现潜在回踩标签时,该标签允许存在多少根K线以确认回踩?此功能防止回踩警报在10根K线后才触发导致不准确。'
input_lookback = input.int(defval = 20, title = '回溯区间', minval = 1, tooltip = '检测分型事件的K线数量。', group = g_sr)
input_retSince = input.int(defval = 2, title = '突破后K线数', minval = 1, tooltip = '突破后多少根K线内检测回踩。', group = g_sr)
input_retValid = input.int(defval = 2, title = '回踩检测限制', minval = 1, tooltip = t_rv, group = g_sr)
input_breakout = input.bool(defval = true, title = '显示突破', group = g_c)
input_retest = input.bool(defval = true, title = '显示回踩', group = g_c)
input_repType = input.string(defval = '开启', title = '重绘模式', options = , tooltip = t_r, group = g_c)
input_outL = input.string(defval = line.style_dotted, title = '边框样式', group = g_st, options = )
input_extend = input.string(defval = extend.none, title = '延长方向', group = g_st, options = )
input_labelType = input.string(defval = '详细', title = '标签类型', options = , group = g_st)
input_labelSize = input.string(defval = size.small, title = '标签大小', options = , group = g_st)
st_break_lb_co1 = input.color(defval = color.lime , title = '空头突破标签颜色' ,inline = 'st_break_lb_co', group = g_st)
st_break_lb_co2 = input.color(defval = color.new(color.lime,40) , title = '' ,inline = 'st_break_lb_co', group = g_st)
lg_break_lb_co1 = input.color(defval = color.red , title = '多头突破标签颜色' ,inline = 'lg_break_lb_co', group = g_st)
lg_break_lb_co2 = input.color(defval = color.new(color.red,40) , title = '' ,inline = 'lg_break_lb_co', group = g_st)
st_retest_lb_co1 = input.color(defval = color.lime , title = '空头回踩标签颜色' ,inline = 'st_retest_lb_col', group = g_st)
st_retest_lb_co2 = input.color(defval = color.new(color.lime,40) , title = '' ,inline = 'st_retest_lb_col', group = g_st)
lg_retest_lb_co1 = input.color(defval = color.red , title = '多头回踩标签颜色' ,inline = 'lg_retest_lb_co', group = g_st)
lg_retest_lb_co2 = input.color(defval = color.new(color.red,40) , title = '' ,inline = 'lg_retest_lb_co', group = g_st)
input_plColor1 = input.color(defval = color.lime, title = '支撑方框颜色', inline = 'pl_Color', group = g_st)
input_plColor2 = input.color(defval = color.new(color.lime,85), title = '', inline = 'pl_Color', group = g_st)
input_phColor1 = input.color(defval = color.red, title = '阻力方框颜色', inline = 'ph_Color', group = g_st)
input_phColor2 = input.color(defval = color.new(color.red,85), title = '', inline = 'ph_Color', group = g_st)
input_override = input.bool(defval = false, title = '自定义文字颜色', inline = '覆盖', group = g_st)
input_textColor = input.color(defval = color.white, title = '', inline = '覆盖', group = g_st)
bb = input_lookback
// 兼容label与英文选项
rTon = input_repType == '开启'
rTcc = input_repType == '关闭:K线确认'
rThv = input_repType == '关闭:高低点'
breakText = input_labelType == '简洁' ? '突' : '突破'
// 分型
rs_pl = fixnan(ta.pivotlow(low, bb, bb))
rs_ph = fixnan(ta.pivothigh(high, bb, bb))
// Box 高度
s_yLoc = low > low ? low : low
r_yLoc = high > high ? high : high
//-----------------------------------------------------------------------------
// 函数
//-----------------------------------------------------------------------------
drawBox(condition, y1, y2, color,bgcolor) =>
var box drawBox = na
if condition and showSupRes // 仅在显示开关打开时绘制
box.set_right(drawBox, bar_index - bb)
drawBox.set_extend(extend.none)
drawBox := box.new(bar_index - bb, y1, bar_index, y2, color, bgcolor = bgcolor, border_style = input_outL, extend = input_extend)
updateBox(box) =>
if barstate.isconfirmed and showSupRes
box.set_right(box, bar_index + 5)
breakLabel(y, txt_col,lb_col, style, textform) =>
if showSupRes
label.new(bar_index, y, textform, textcolor = input_override ? input_textColor : txt_col, style = style, color = lb_col, size = input_labelSize)
retestCondition(breakout, condition) =>
ta.barssince(na(breakout)) > input_retSince and condition
repaint(c1, c2, c3) => rTon ? c1 : rThv ? c2 : rTcc ? c3 : na
//-----------------------------------------------------------------------------
// 绘制与更新区间
//-----------------------------------------------------------------------------
= drawBox(ta.change(rs_pl), s_yLoc, rs_pl, input_plColor1,input_plColor2)
= drawBox(ta.change(rs_ph), rs_ph, r_yLoc, input_phColor1,input_phColor2)
sTop = box.get_top(sBox), rTop = box.get_top(rBox)
sBot = box.get_bottom(sBox), rBot = box.get_bottom(rBox)
if showSupRes
updateBox(sBox), updateBox(rBox)
//-----------------------------------------------------------------------------
// 突破事件 - 加入顶部和底部规避以及RSI确认
//-----------------------------------------------------------------------------
var bool sBreak = na
var bool rBreak = na
cu = repaint(ta.crossunder(close, box.get_bottom(sBox)), ta.crossunder(low, box.get_bottom(sBox)), ta.crossunder(close, box.get_bottom(sBox)) and barstate.isconfirmed)
co = repaint(ta.crossover(close, box.get_top(rBox)), ta.crossover(high, box.get_top(rBox)), ta.crossover(close, box.get_top(rBox)) and barstate.isconfirmed)
switch
cu and na(sBreak) and showSupRes and (not showADXFilter or adxStrong) and (not showBottomAvoidance or not isBottom) and (not showRSI or rsiSupportssell) =>
sBreak := true
if input_breakout
breakLabel(sBot, st_break_lb_co1,st_break_lb_co2, label.style_label_upper_right, breakText)
co and na(rBreak) and showSupRes and (not showADXFilter or adxStrong) and (not showTopAvoidance or not isTop) and (not showRSI or rsiSupportsBuy) =>
rBreak := true
if input_breakout
breakLabel(rTop, lg_break_lb_co1,lg_break_lb_co2, label.style_label_lower_right, breakText)
if ta.change(rs_pl) and showSupRes
if na(sBreak)
box.delete(sBox )
sBreak := na
if ta.change(rs_ph) and showSupRes
if na(rBreak)
box.delete(rBox )
rBreak := na
//-----------------------------------------------------------------------------
// 回踩事件
//-----------------------------------------------------------------------------
s1 = retestCondition(sBreak, high >= sTop and close <= sBot)
s2 = retestCondition(sBreak, high >= sTop and close >= sBot and close <= sTop)
s3 = retestCondition(sBreak, high >= sBot and high <= sTop)
s4 = retestCondition(sBreak, high >= sBot and high <= sTop and close < sBot)
r1 = retestCondition(rBreak, low <= rBot and close >= rTop)
r2 = retestCondition(rBreak, low <= rBot and close <= rTop and close >= rBot)
r3 = retestCondition(rBreak, low <= rTop and low >= rBot)
r4 = retestCondition(rBreak, low <= rTop and low >= rBot and close > rTop)
retestEvent(c1, c2, c3, c4, y1, y2, txt_col,lb_col, style, pType) =>
if input_retest and showSupRes
var bool retOccurred = na
retActive = c1 or c2 or c3 or c4
retEvent = retActive and not retActive
retValue = ta.valuewhen(retEvent, y1, 0)
if pType == 'ph' ? y2 < ta.valuewhen(retEvent, y2, 0) : y2 > ta.valuewhen(retEvent, y2, 0)
retEvent := retActive
retValue := ta.valuewhen(retEvent, y1, 0)
retSince = ta.barssince(retEvent)
var retLabel = array.new()
if retEvent
retOccurred := na
array.push(retLabel, label.new(bar_index - retSince, y2 , text = input_labelType == '简洁' ? '潜回' : '潜在回踩', color = lb_col, style = style, textcolor = input_override ? input_textColor : txt_col, size = input_labelSize))
if array.size(retLabel) == 2
label.delete(array.first(retLabel))
array.shift(retLabel)
retConditions = pType == 'ph' ? repaint(close >= retValue, high >= retValue, close >= retValue and barstate.isconfirmed) : repaint(close <= retValue, low <= retValue, close <= retValue and barstate.isconfirmed)
retValid = ta.barssince(retEvent) > 0 and ta.barssince(retEvent) <= input_retValid and retConditions and not retOccurred and (not showADXFilter or adxStrong) and (not showRSI or (pType == 'ph' ? rsiSupportsBuy : rsiSupportssell))
if retValid
label.new(bar_index - retSince, y2 , text = input_labelType == '简洁' ? '回' : '回踩', color = lb_col, style = style, textcolor = input_override ? input_textColor : txt_col, size = input_labelSize)
retOccurred := true
if retValid or ta.barssince(retEvent) > input_retValid
label.delete(array.first(retLabel))
if pType == 'ph' and ta.change(rs_ph) and retOccurred
box.set_right(rBox , bar_index - retSince)
retOccurred := na
if pType == 'pl' and ta.change(rs_pl) and retOccurred
box.set_right(sBox , bar_index - retSince)
retOccurred := na
else
= retestEvent(r1, r2, r3, r4, high, low, lg_retest_lb_co1,lg_retest_lb_co2, label.style_label_upper_left, 'ph')
= retestEvent(s1, s2, s3, s4, low, high, st_retest_lb_co1,st_retest_lb_co2, label.style_label_lower_left, 'pl')
//-----------------------------------------------------------------------------
// 警报
//-----------------------------------------------------------------------------
// 买卖信号警报条件
buySignal = showTrendLines and trendLineBuySignal
sellSignal = showTrendLines and trendLineSellSignal
// 添加买卖信号的警报条件
alertcondition(buySignal, title='买入信号', message='范围过滤器买入信号:上轨突破')
alertcondition(sellSignal, title='卖出信号', message='范围过滤器卖出信号:下轨突破')
alertcondition((showSupRes and ta.change(rs_pl)), '新支撑位')
alertcondition((showSupRes and ta.change(rs_ph)), '新阻力位')
alertcondition((showSupRes and ta.barssince(na(sBreak)) == 1), '支撑位突破')
alertcondition((showSupRes and ta.barssince(na(rBreak)) == 1), '阻力位突破')
alertcondition((showSupRes and sRetValid), '支撑位回踩')
alertcondition((showSupRes and sRetEvent), '潜在支撑回踩')
alertcondition((showSupRes and rRetValid), '阻力位回踩')
alertcondition((showSupRes and rRetEvent), '潜在阻力回踩')
AllAlerts(condition, message) =>
if condition and showSupRes
alert(message)
AllAlerts(ta.change(rs_pl), '新支撑位')
AllAlerts(ta.change(rs_ph), '新阻力位')
AllAlerts(ta.barssince(na(sBreak)) == 1, '支撑位突破')
AllAlerts(ta.barssince(na(rBreak)) == 1, '阻力位突破')
AllAlerts(sRetValid, '支撑位回踩')
AllAlerts(sRetEvent, '潜在支撑回踩')
AllAlerts(rRetValid, '阻力位回踩')
AllAlerts(rRetEvent, '潜在阻力回踩')
AllAlerts(buySignal, '买入信号:上轨突破')
AllAlerts(sellSignal, '卖出信号:下轨突破')
// === 多周期移动平均线 部分 ===
// === 公共函数 ===
strRoundValue(num) =>
strv = ''
if num >= 100000
strv := str.tostring(num/1000, '#千')
else if (num < 100000) and (num >= 100)
strv := str.tostring(num, '#')
else if (num < 100) and (num >= 1)
strv := str.tostring(num, '#.##')
else if (num < 1) and (num >= 0.01)
strv := str.tostring(num, '#.####')
else if (num < 0.01) and (num >= 0.0001)
strv := str.tostring(num, '#.######')
else if (num < 0.0001) and (num >= 0.000001)
strv := str.tostring(num, '#.########')
(strv)
defaultFunction(func, src, len, alma_offst, alma_sigma) =>
has_len = false
ma = ta.swma(close)
if func == '自适应移动平均'
ma := ta.alma(src, len, alma_offst, alma_sigma)
has_len := true
else if func == '指数移动平均'
ma := ta.ema(src, len)
has_len := true
else if func == '修正移动平均'
ma := ta.rma(src, len)
has_len := true
else if func == '简单移动平均'
ma := ta.sma(src, len)
has_len := true
else if func == '对称加权移动平均'
ma := ta.swma(src)
has_len := false
else if func == '成交量加权平均价'
ma := ta.vwap(src)
has_len := false
else if func == '成交量加权移动平均'
ma := ta.vwma(src, len)
has_len := true
else if func == '加权移动平均'
ma := ta.wma(src, len)
has_len := true
def_fn = input.string(title='默认移动平均线', defval='指数移动平均', options= , group="6. PMA 设置")
ma1_on = input.bool(inline='均线1', title='启用移动平均线1', defval=false, group="6. PMA 设置")
ma2_on = input.bool(inline='均线2', title='启用移动平均线2', defval=true, group="6. PMA 设置")
ma3_on = input.bool(inline='均线3', title='启用移动平均线3', defval=true, group="6. PMA 设置")
ma4_on = input.bool(inline='均线4', title='启用移动平均线4', defval=true, group="6. PMA 设置")
ma5_on = input.bool(inline='均线5', title='启用移动平均线5', defval=true, group="6. PMA 设置")
ma6_on = input.bool(inline='均线6', title='启用移动平均线6', defval=true, group="6. PMA 设置")
ma7_on = input.bool(inline='均线7', title='启用移动平均线7', defval=true, group="6. PMA 设置")
ma1_fn = input.string(inline='均线1', title='', defval='默认', options= , group="6. PMA 设置")
ma2_fn = input.string(inline='均线2', title='', defval='默认', options= , group="6. PMA 设置")
ma3_fn = input.string(inline='均线3', title='', defval='默认', options= , group="6. PMA 设置")
ma4_fn = input.string(inline='均线4', title='', defval='默认', options= , group="6. PMA 设置")
ma5_fn = input.string(inline='均线5', title='', defval='默认', options= , group="6. PMA 设置")
ma6_fn = input.string(inline='均线6', title='', defval='默认', options= , group="6. PMA 设置")
ma7_fn = input.string(inline='均线7', title='', defval='默认', options= , group="6. PMA 设置")
ma1_len = input.int(inline='均线1', title='', defval=12, minval=1, group="6. PMA 设置")
ma2_len = input.int(inline='均线2', title='', defval=144, minval=1, group="6. PMA 设置")
ma3_len = input.int(inline='均线3', title='', defval=169, minval=1, group="6. PMA 设置")
ma4_len = input.int(inline='均线4', title='', defval=288, minval=1, group="6. PMA 设置")
ma5_len = input.int(inline='均线5', title='', defval=338, minval=1, group="6. PMA 设置")
ma6_len = input.int(inline='均线6', title='', defval=576, minval=1, group="6. PMA 设置")
ma7_len = input.int(inline='均线7', title='', defval=676, minval=1, group="6. PMA 设置")
alma1_offst = input.float(group='均线1其他设置', inline='均线11', title='自适应偏移', defval=0.85, minval=-1, maxval=1, step=0.01)
alma1_sigma = input.float(group='均线1其他设置', inline='均线11', title=', 西格玛', defval=6, minval=0, maxval=100, step=0.01)
ma1_src = input.source(group='均线1其他设置', inline='均线12', title='数据源', defval=close)
ma1_plt_offst = input.int(group='均线1其他设置', inline='均线12', title=', 绘图偏移', defval=0, minval=-500, maxval=500)
alma2_offst = input.float(group='均线2其他设置', inline='均线21', title='自适应偏移', defval=0.85, minval=-1, maxval=1, step=0.01)
alma2_sigma = input.float(group='均线2其他设置', inline='均线21', title='西格玛', defval=6, minval=0, maxval=100, step=0.01)
ma2_src = input.source(group='均线2其他设置', inline='均线22', title='数据源', defval=close)
ma2_plt_offst = input.int(group='均线2其他设置', inline='均线22', title='绘图偏移', defval=0, minval=-500, maxval=500)
alma3_offst = input.float(group='均线3其他设置', inline='均线31', title='自适应偏移', defval=0.85, minval=-1, maxval=1, step=0.01)
alma3_sigma = input.float(group='均线3其他设置', inline='均线31', title='西格玛', defval=6, minval=0, maxval=100, step=0.01)
ma3_src = input.source(group='均线3其他设置', inline='均线32', title='数据源', defval=close)
ma3_plt_offst = input.int(group='均线3其他设置', inline='均线32', title='绘图偏移', defval=0, minval=-500, maxval=500)
alma4_offst = input.float(group='均线4其他设置', inline='均线41', title='自适应偏移', defval=0.85, minval=-1, maxval=1, step=0.01)
alma4_sigma = input.float(group='均线4其他设置', inline='均线41', title='西格玛', defval=6, minval=0, maxval=100, step=0.01)
ma4_src = input.source(group='均线4其他设置', inline='均线42', title='数据源', defval=close)
ma4_plt_offst = input.int(group='均线4其他设置', inline='均线42', title='绘图偏移', defval=0, minval=-500, maxval=500)
alma5_offst = input.float(group='均线5其他设置', inline='均线51', title='自适应偏移', defval=0.85, minval=-1, maxval=1, step=0.01)
alma5_sigma = input.float(group='均线5其他设置', inline='均线51', title='西格玛', defval=6, minval=0, maxval=100, step=0.01)
ma5_src = input.source(group='均线5其他设置', inline='均线52', title='数据源', defval=close)
ma5_plt_offst = input.int(group='均线5其他设置', inline='均线52', title='绘图偏移', defval=0, minval=-500, maxval=500)
alma6_offst = input.float(group='均线6其他设置', inline='均线61', title='自适应偏移', defval=0.85, minval=-1, maxval=1, step=0.01)
alma6_sigma = input.float(group='均线6其他设置', inline='均线61', title='西格玛', defval=6, minval=0, maxval=100, step=0.01)
ma6_src = input.source(group='均线6其他设置', inline='均线62', title='数据源', defval=close)
ma6_plt_offst = input.int(group='均线6其他设置', inline='均线62', title='绘图偏移', defval=0, minval=-500, maxval=500)
alma7_offst = input.float(group='均线7其他设置', inline='均线71', title='自适应偏移', defval=0.85, minval=-1, maxval=1, step=0.01)
alma7_sigma = input.float(group='均线7其他设置', inline='均线71', title='西格玛', defval=6, minval=0, maxval=100, step=0.01)
ma7_src = input.source(group='均线7其他设置', inline='均线72', title='数据源', defval=close)
ma7_plt_offst = input.int(group='均线7其他设置', inline='均线72', title='绘图偏移', defval=0, minval=-500, maxval=500)
fill_12_on = input.bool(title='启用均线1-2填充', defval=false, group="6. PMA 设置")
fill_23_on = input.bool(title='启用均线2-3填充', defval=true, group="6. PMA 设置")
fill_34_on = input.bool(title='启用均线3-4填充', defval=false, group="6. PMA 设置")
fill_45_on = input.bool(title='启用均线4-5填充', defval=true, group="6. PMA 设置")
fill_56_on = input.bool(title='启用均线5-6填充', defval=false, group="6. PMA 设置")
fill_67_on = input.bool(title='启用均线6-7填充', defval=true, group="6. PMA 设置")
// === 计算移动平均线 ===
= defaultFunction(def_fn, ma1_src, ma1_len, alma1_offst, alma1_sigma)
= defaultFunction(def_fn, ma2_src, ma2_len, alma2_offst, alma2_sigma)
= defaultFunction(def_fn, ma3_src, ma3_len, alma3_offst, alma3_sigma)
= defaultFunction(def_fn, ma4_src, ma4_len, alma4_offst, alma4_sigma)
= defaultFunction(def_fn, ma5_src, ma5_len, alma5_offst, alma5_sigma)
= defaultFunction(def_fn, ma6_src, ma6_len, alma6_offst, alma6_sigma)
= defaultFunction(def_fn, ma7_src, ma7_len, alma7_offst, alma7_sigma)
// === 均线类型切换 ===
if ma1_fn != '默认'
if ma1_fn == '自适应移动平均'
ma1 := ta.alma(ma1_src, ma1_len, alma1_offst, alma1_sigma)
ma1_has_len := true
else if ma1_fn == '指数移动平均'
ma1 := ta.ema(ma1_src, ma1_len)
ma1_has_len := true
else if ma1_fn == '修正移动平均'
ma1 := ta.rma(ma1_src, ma1_len)
ma1_has_len := true
else if ma1_fn == '简单移动平均'
ma1 := ta.sma(ma1_src, ma1_len)
ma1_has_len := true
else if ma1_fn == '对称加权移动平均'
ma1 := ta.swma(ma1_src)
ma1_has_len := false
else if ma1_fn == '成交量加权平均价'
ma1 := ta.vwap(ma1_src)
ma1_has_len := false
else if ma1_fn == '成交量加权移动平均'
ma1 := ta.vwma(ma1_src, ma1_len)
ma1_has_len := true
else if ma1_fn == '加权移动平均'
ma1 := ta.wma(ma1_src, ma1_len)
ma1_has_len := true
if ma2_fn != '默认'
if ma2_fn == '自适应移动平均'
ma2 := ta.alma(ma2_src, ma2_len, alma2_offst, alma2_sigma)
ma2_has_len := true
else if ma2_fn == '指数移动平均'
ma2 := ta.ema(ma2_src, ma2_len)
ma2_has_len := true
else if ma2_fn == '修正移动平均'
ma2 := ta.rma(ma2_src, ma2_len)
ma2_has_len := true
else if ma2_fn == '简单移动平均'
ma2 := ta.sma(ma2_src, ma2_len)
ma2_has_len := true
else if ma2_fn == '对称加权移动平均'
ma2 := ta.swma(ma2_src)
ma2_has_len := false
else if ma2_fn == '成交量加权平均价'
ma2 := ta.vwap(ma2_src)
ma2_has_len := false
else if ma2_fn == '成交量加权移动平均'
ma2 := ta.vwma(ma2_src, ma2_len)
ma2_has_len := true
else if ma2_fn == '加权移动平均'
ma2 := ta.wma(ma2_src, ma2_len)
ma2_has_len := true
if ma3_fn != '默认'
if ma3_fn == '自适应移动平均'
ma3 := ta.alma(ma3_src, ma3_len, alma3_offst, alma3_sigma)
ma3_has_len := true
else if ma3_fn == '指数移动平均'
ma3 := ta.ema(ma3_src, ma3_len)
ma3_has_len := true
else if ma3_fn == '修正移动平均'
ma3 := ta.rma(ma3_src, ma3_len)
ma3_has_len := true
else if ma3_fn == '简单移动平均'
ma3 := ta.sma(ma3_src, ma3_len)
ma3_has_len := true
else if ma3_fn == '对称加权移动平均'
ma3 := ta.swma(ma3_src)
ma3_has_len := false
else if ma3_fn == '成交量加权平均价'
ma3 := ta.vwap(ma3_src)
ma3_has_len := false
else if ma3_fn == '成交量加权移动平均'
ma3 := ta.vwma(ma3_src, ma3_len)
ma3_has_len := true
else if ma3_fn == '加权移动平均'
ma3 := ta.wma(ma3_src, ma3_len)
ma3_has_len := true
if ma4_fn != '默认'
if ma4_fn == '自适应移动平均'
ma4 := ta.alma(ma4_src, ma4_len, alma4_offst, alma4_sigma)
ma4_has_len := true
else if ma4_fn == '指数移动平均'
ma4 := ta.ema(ma4_src, ma4_len)
ma4_has_len := true
else if ma4_fn == '修正移动平均'
ma4 := ta.rma(ma4_src, ma4_len)
ma4_has_len := true
else if ma4_fn == '简单移动平均'
ma4 := ta.sma(ma4_src, ma4_len)
ma4_has_len := true
else if ma4_fn == '对称加权移动平均'
ma4 := ta.swma(ma4_src)
ma4_has_len := false
else if ma4_fn == '成交量加权平均价'
ma4 := ta.vwap(ma4_src)
ma4_has_len := false
else if ma4_fn == '成交量加权移动平均'
ma4 := ta.vwma(ma4_src, ma4_len)
ma4_has_len := true
else if ma4_fn == '加权移动平均'
ma4 := ta.wma(ma4_src, ma4_len)
ma4_has_len := true
if ma5_fn != '默认'
if ma5_fn == '自适应移动平均'
ma5 := ta.alma(ma5_src, ma5_len, alma5_offst, alma5_sigma)
ma5_has_len := true
else if ma5_fn == '指数移动平均'
ma5 := ta.ema(ma5_src, ma5_len)
ma5_has_len := true
else if ma5_fn == '修正移动平均'
ma5 := ta.rma(ma5_src, ma5_len)
ma5_has_len := true
else if ma5_fn == '简单移动平均'
ma5 := ta.sma(ma5_src, ma5_len)
ma5_has_len := true
else if ma5_fn == '对称加权移动平均'
ma5 := ta.swma(ma5_src)
ma5_has_len := false
else if ma5_fn == '成交量加权平均价'
ma5 := ta.vwap(ma5_src)
ma5_has_len := false
else if ma5_fn == '成交量加权移动平均'
ma5 := ta.vwma(ma5_src, ma5_len)
ma5_has_len := true
else if ma5_fn == '加权移动平均'
ma5 := ta.wma(ma5_src, ma5_len)
ma5_has_len := true
if ma6_fn != '默认'
if ma6_fn == '自适应移动平均'
ma6 := ta.alma(ma6_src, ma6_len, alma6_offst, alma6_sigma)
ma6_has_len := true
else if ma6_fn == '指数移动平均'
ma6 := ta.ema(ma6_src, ma6_len)
ma6_has_len := true
else if ma6_fn == '修正移动平均'
ma6 := ta.rma(ma6_src, ma6_len)
ma6_has_len := true
else if ma6_fn == '简单移动平均'
ma6 := ta.sma(ma6_src, ma6_len)
ma6_has_len := true
else if ma6_fn == '对称加权移动平均'
ma6 := ta.swma(ma6_src)
ma6_has_len := false
else if ma6_fn == '成交量加权平均价'
ma6 := ta.vwap(ma6_src)
ma6_has_len := false
else if ma6_fn == '成交量加权移动平均'
ma6 := ta.vwma(ma6_src, ma6_len)
ma6_has_len := true
else if ma6_fn == '加权移动平均'
ma6 := ta.wma(ma6_src, ma6_len)
ma6_has_len := true
if ma7_fn != '默认'
if ma7_fn == '自适应移动平均'
ma7 := ta.alma(ma7_src, ma7_len, alma7_offst, alma7_sigma)
ma7_has_len := true
else if ma7_fn == '指数移动平均'
ma7 := ta.ema(ma7_src, ma7_len)
ma7_has_len := true
else if ma7_fn == '修正移动平均'
ma7 := ta.rma(ma7_src, ma7_len)
ma7_has_len := true
else if ma7_fn == '简单移动平均'
ma7 := ta.sma(ma7_src, ma7_len)
ma7_has_len := true
else if ma7_fn == '对称加权移动平均'
ma7 := ta.swma(ma7_src)
ma7_has_len := false
else if ma7_fn == '成交量加权平均价'
ma7 := ta.vwap(ma7_src)
ma7_has_len := false
else if ma7_fn == '成交量加权移动平均'
ma7 := ta.vwma(ma7_src, ma7_len)
ma7_has_len := true
else if ma7_fn == '加权移动平均'
ma7 := ta.wma(ma7_src, ma7_len)
ma7_has_len := true
// === 均线颜色 ===
ma1_clr = color.new(color.fuchsia, 0)
ma2_clr = color.new(color.aqua, 0)
ma3_clr = color.new(color.yellow, 0)
ma4_clr = color.new(color.blue, 0)
ma5_clr = color.new(color.orange, 0)
ma6_clr = color.new(color.green, 0)
ma7_clr = color.new(color.red, 0)
// === 均线全局绘图 ===
p1 = plot(series=showPMA and ma1_on ? ma1 : na, title="均线1", color=ma1_clr, trackprice=false, offset=ma1_plt_offst, linewidth=2)
p2 = plot(series=showPMA and ma2_on ? ma2 : na, title="均线2", color=ma2_clr, trackprice=false, offset=ma2_plt_offst, linewidth=2)
p3 = plot(series=showPMA and ma3_on ? ma3 : na, title="均线3", color=ma3_clr, trackprice=false, offset=ma3_plt_offst, linewidth=2)
p4 = plot(series=showPMA and ma4_on ? ma4 : na, title="均线4", color=ma4_clr, trackprice=false, offset=ma4_plt_offst, linewidth=2)
p5 = plot(series=showPMA and ma5_on ? ma5 : na, title="均线5", color=ma5_clr, trackprice=false, offset=ma5_plt_offst, linewidth=2)
p6 = plot(series=showPMA and ma6_on ? ma6 : na, title="均线6", color=ma6_clr, trackprice=false, offset=ma6_plt_offst, linewidth=2)
p7 = plot(series=showPMA and ma7_on ? ma7 : na, title="均线7", color=ma7_clr, trackprice=false, offset=ma7_plt_offst, linewidth=2)
// === 多周期移动平均线 填充渲染 ===
fill(p1, p2, color=showPMA and ma1_on and ma2_on and fill_12_on ? color.new(color.purple, 70) : na, title="均线1-2填充")
fill(p2, p3, color=showPMA and ma2_on and ma3_on and fill_23_on ? color.new(color.blue, 70) : na, title="均线2-3填充")
fill(p3, p4, color=showPMA and ma3_on and ma4_on and fill_34_on ? color.new(color.teal, 70) : na, title="均线3-4填充")
fill(p4, p5, color=showPMA and ma4_on and ma5_on and fill_45_on ? color.new(color.green, 70) : na, title="均线4-5填充")
fill(p5, p6, color=showPMA and ma5_on and ma6_on and fill_56_on ? color.new(color.yellow, 70) : na, title="均线5-6填充")
fill(p6, p7, color=showPMA and ma6_on and ma7_on and fill_67_on ? color.new(color.orange, 70) : na, title="均线6-7填充")
// === 交易信息表格 部分 ===
// 表格参数设置 - 修改默认大小为中等
tablePos = input.string("右上角", title="表格位置", options= , group="7. 交易信息表格 设置")
tableSize = input.string("中等", title="表格大小", options= , group="7. 交易信息表格 设置")
showTargets = input.bool(true, title="显示止盈目标", group="7. 交易信息表格 设置")
showRatio = input.bool(true, title="显示盈亏比", group="7. 交易信息表格 设置")
// 辅助函数
getTablePosition() =>
switch tablePos
"右上角" => position.top_right
"右下角" => position.bottom_right
"左上角" => position.top_left
"左下角" => position.bottom_left
getTableSize() =>
switch tableSize
"小" => size.small
"中等" => size.normal
"大" => size.large
formatPrice(price) =>
if na(price)
"N/A"
else
str.tostring(price, "#.####")
calcStopLossPercentage(entryPrice, stopLoss, entryType) =>
if na(entryPrice) or na(stopLoss) or na(entryType)
""
else
pct = 0.0
if entryType == "多单"
pct := (stopLoss - entryPrice) / entryPrice * 100
else if entryType == "空单"
pct := (entryPrice - stopLoss) / entryPrice * 100
" (" + str.tostring(pct, "#.##") + "%)"
calcTakeProfitPercentage(entryPrice, takeProfit, entryType) =>
if na(entryPrice) or na(takeProfit) or na(entryType)
""
else
pct = 0.0
if entryType == "多单"
pct := (takeProfit - entryPrice) / entryPrice * 100
else if entryType == "空单"
pct := (entryPrice - takeProfit) / entryPrice * 100
" (+" + str.tostring(pct, "#.##") + "%)"
calcUnrealizedPnL(entryPrice, currentPrice, entryType) =>
if na(entryPrice) or na(currentPrice) or na(entryType)
""
else
priceDiff = currentPrice - entryPrice
pct = (currentPrice - entryPrice) / entryPrice * 100
if entryType == "多单"
if pct > 0
" (" + formatPrice(priceDiff) + ", +" + str.tostring(pct, "#.##") + "%)"
else
" (" + formatPrice(priceDiff) + ", " + str.tostring(pct, "#.##") + "%)"
else if entryType == "空单"
// 对于空单,价差符号相反
if pct < 0
" (" + formatPrice(-priceDiff) + ", +" + str.tostring(-pct, "#.##") + "%)"
else
" (" + formatPrice(-priceDiff) + ", " + str.tostring(-pct, "#.##") + "%)"
else
""
// RSI状态颜色函数
getRSIStatusColor() =>
switch rsiStatus
"动量回升" => // 绿色
"动量回落" => // 红色
"动量中性" => // 黄色
=> // 默认灰色
// 多时间框架趋势颜色函数
getTrendColor(trendDirection) =>
switch trendDirection
"多头倾向" => // 绿色
"空头倾向" => // 红色
"震荡" => // 黄色
=> // 默认灰色
// === 蓝紫科幻风格表格 ===
// 创建蓝紫色主题的表格
var infoTable = table.new(getTablePosition(), columns=2, rows=26,
bgcolor=color.new(#0f0a1a, 5),
border_width=3,
border_color=color.new(#6633ff, 40),
frame_width=2,
frame_color=color.new(#9966ff, 30))
if showTable and barstate.islast
// 确定止盈止损位
var float stopLoss = na
var float takeProfit1 = na
var float takeProfit2 = na
if not na(entryType)
if entryType == "多单"
stopLoss := na(sBot) ? entryPrice * 0.98 : sBot
takeProfit1 := na(rTop) ? entryPrice * 1.02 : rTop
takeProfit2 := entryPrice * 1.05
else if entryType == "空单"
stopLoss := na(rTop) ? entryPrice * 1.02 : rTop
takeProfit1 := na(sBot) ? entryPrice * 0.98 : sBot
takeProfit2 := entryPrice * 0.95
// 计算盈亏比
riskRewardRatio = na(entryPrice) or na(stopLoss) or na(takeProfit1) ? na :
math.abs(takeProfit1 - entryPrice) / math.abs(entryPrice - stopLoss)
riskRewardStr = na(riskRewardRatio) ? "N/A" : "1:" + str.tostring(riskRewardRatio, "#.##")
rowIndex = 0
// === 作者联系信息行 - 最顶部,大字体 ===
table.cell(infoTable, 0, rowIndex, "合作联系作者", text_color=color.new(#ffcc99, 0),
text_size=size.normal, bgcolor=color.new(#1a1a0d, 0))
table.cell(infoTable, 1, rowIndex, "qq2390107445", text_color=color.new(#66ff99, 0),
text_size=size.normal, bgcolor=color.new(#0d2619, 0))
rowIndex += 1
// === 表格标题行 - 蓝紫主题 ===
table.cell(infoTable, 0, rowIndex, "⚡ P6●智能资金概念交易系统", text_color=color.new(#ccccff, 0),
text_size=getTableSize(), bgcolor=color.new(#1a0d33, 0))
table.cell(infoTable, 1, rowIndex, "『" + syminfo.ticker + "』", text_color=color.new(#9966ff, 0),
text_size=size.normal, bgcolor=color.new(#1a0d33, 0))
rowIndex += 1
// === 当前价格与浮盈浮亏行 - 蓝紫主题 ===
unrealizedPnL = calcUnrealizedPnL(entryPrice, close, entryType)
// 浮盈浮亏颜色逻辑
pnlColor = color.new(#ccccff, 0)
pnlBgColor = color.new(#0d0d1a, 0)
if not na(entryPrice)
if entryType == "多单"
if close > entryPrice
pnlColor := color.new(#66ff99, 0)
pnlBgColor := color.new(#0d2619, 0)
else
pnlColor := color.new(#ff6699, 0)
pnlBgColor := color.new(#260d19, 0)
else if entryType == "空单"
if close < entryPrice
pnlColor := color.new(#66ff99, 0)
pnlBgColor := color.new(#0d2619, 0)
else
pnlColor := color.new(#ff6699, 0)
pnlBgColor := color.new(#260d19, 0)
table.cell(infoTable, 0, rowIndex, "当前价格", text_color=color.new(#b3b3ff, 0),
text_size=getTableSize(), bgcolor=color.new(#0d0d1a, 0))
table.cell(infoTable, 1, rowIndex, formatPrice(close) + unrealizedPnL,
text_color=pnlColor,
text_size=getTableSize(), bgcolor=pnlBgColor)
rowIndex += 1
// === 趋势状态与进场价格行 - 蓝紫主题 ===
trendStatus = na(entryType) ? "待机中" : entryType == "多单" ? "多头执行" : "空头执行"
trendIcon = entryType == "多单" ? " ▲" : entryType == "空单" ? " ▼" : " ●"
trendBgColor = entryType == "多单" ? color.new(#1a4d1a, 0) :
entryType == "空单" ? color.new(#4d1a1a, 0) :
color.new(#1a1a4d, 0)
trendTextColor = entryType == "多单" ? color.new(#66ff99, 0) :
entryType == "空单" ? color.new(#ff6699, 0) :
color.new(#9999ff, 0)
table.cell(infoTable, 0, rowIndex, "交易状态", text_color=color.new(#b3b3ff, 0),
text_size=getTableSize(), bgcolor=color.new(#0d0d1a, 0))
table.cell(infoTable, 1, rowIndex, trendStatus + trendIcon, text_color=trendTextColor,
text_size=getTableSize(), bgcolor=trendBgColor)
rowIndex += 1
// === 进场价格行 - 蓝紫主题 ===
table.cell(infoTable, 0, rowIndex, "进场价位", text_color=color.new(#b3b3ff, 0),
text_size=getTableSize(), bgcolor=color.new(#0d0d1a, 0))
table.cell(infoTable, 1, rowIndex, formatPrice(entryPrice),
text_color=color.new(#ffcc99, 0),
text_size=getTableSize(), bgcolor=color.new(#1a1a0d, 0))
rowIndex += 1
// === 多时间框架分析 - 独立行显示 ===
if showMTF
// 多时间框架标题行
table.cell(infoTable, 0, rowIndex, "━━ 多时间框架趋势 ━━", text_color=color.new(#ccccff, 0),
text_size=getTableSize(), bgcolor=color.new(#1a0d33, 0))
table.cell(infoTable, 1, rowIndex, "━━━━━━━━━━━━━━━━━━━━", text_color=color.new(#6633ff, 0),
text_size=getTableSize(), bgcolor=color.new(#1a0d33, 0))
rowIndex += 1
// 1分钟趋势
if mtfEnable1m
= getTrendColor(trend1mDir)
trend1mIcon = trend1mDir == "多头倾向" ? " ▲" : trend1mDir == "空头倾向" ? " ▼" : " ●"
table.cell(infoTable, 0, rowIndex, "1分钟", text_color=color.new(#b3b3ff, 0),
text_size=getTableSize(), bgcolor=color.new(#0d0d1a, 0))
table.cell(infoTable, 1, rowIndex, trend1mDir + trend1mIcon, text_color=trend1mTextColor,
text_size=getTableSize(), bgcolor=trend1mBgColor)
rowIndex += 1
// 5分钟趋势
if mtfEnable5m
= getTrendColor(trend5mDir)
trend5mIcon = trend5mDir == "多头倾向" ? " ▲" : trend5mDir == "空头倾向" ? " ▼" : " ●"
table.cell(infoTable, 0, rowIndex, "5分钟", text_color=color.new(#b3b3ff, 0),
text_size=getTableSize(), bgcolor=color.new(#0d0d1a, 0))
table.cell(infoTable, 1, rowIndex, trend5mDir + trend5mIcon, text_color=trend5mTextColor,
text_size=getTableSize(), bgcolor=trend5mBgColor)
rowIndex += 1
// 15分钟趋势
if mtfEnable15m
= getTrendColor(trend15mDir)
trend15mIcon = trend15mDir == "多头倾向" ? " ▲" : trend15mDir == "空头倾向" ? " ▼" : " ●"
table.cell(infoTable, 0, rowIndex, "15分钟", text_color=color.new(#b3b3ff, 0),
text_size=getTableSize(), bgcolor=color.new(#0d0d1a, 0))
table.cell(infoTable, 1, rowIndex, trend15mDir + trend15mIcon, text_color=trend15mTextColor,
text_size=getTableSize(), bgcolor=trend15mBgColor)
rowIndex += 1
// 1小时趋势
if mtfEnable1h
= getTrendColor(trend1hDir)
trend1hIcon = trend1hDir == "多头倾向" ? " ▲" : trend1hDir == "空头倾向" ? " ▼" : " ●"
table.cell(infoTable, 0, rowIndex, "1小时", text_color=color.new(#b3b3ff, 0),
text_size=getTableSize(), bgcolor=color.new(#0d0d1a, 0))
table.cell(infoTable, 1, rowIndex, trend1hDir + trend1hIcon, text_color=trend1hTextColor,
text_size=getTableSize(), bgcolor=trend1hBgColor)
rowIndex += 1
// 4小时趋势
if mtfEnable4h
= getTrendColor(trend4hDir)
trend4hIcon = trend4hDir == "多头倾向" ? " ▲" : trend4hDir == "空头倾向" ? " ▼" : " ●"
table.cell(infoTable, 0, rowIndex, "4小时", text_color=color.new(#b3b3ff, 0),
text_size=getTableSize(), bgcolor=color.new(#0d0d1a, 0))
table.cell(infoTable, 1, rowIndex, trend4hDir + trend4hIcon, text_color=trend4hTextColor,
text_size=getTableSize(), bgcolor=trend4hBgColor)
rowIndex += 1
// === RSI 动量状态行 - 蓝紫主题 ===
rsiTextColor = color.new(#ccccff, 0)
rsiBgColor = color.new(#0d0d1a, 0)
if rsiStatus == "动量回升"
rsiTextColor := color.new(#66ff99, 0)
rsiBgColor := color.new(#0d2619, 0)
else if rsiStatus == "动量回落"
rsiTextColor := color.new(#ff6699, 0)
rsiBgColor := color.new(#260d19, 0)
else
rsiTextColor := color.new(#ffcc99, 0)
rsiBgColor := color.new(#1a1a0d, 0)
rsiIcon = rsiStatus == "动量回升" ? " ▲" : rsiStatus == "动量回落" ? " ▼" : " ●"
rsiDisplayText = rsiStatus + rsiIcon + " (" + str.tostring(rsiValue, "#.#") + ")"
table.cell(infoTable, 0, rowIndex, "RSI动量", text_color=color.new(#b3b3ff, 0),
text_size=getTableSize(), bgcolor=color.new(#0d0d1a, 0))
table.cell(infoTable, 1, rowIndex, rsiDisplayText, text_color=rsiTextColor,
text_size=getTableSize(), bgcolor=rsiBgColor)
rowIndex += 1
// === 风险管理分割线 ===
table.cell(infoTable, 0, rowIndex, "━━ 风险管理 ━━", text_color=color.new(#ccccff, 0),
text_size=getTableSize(), bgcolor=color.new(#1a0d33, 0))
table.cell(infoTable, 1, rowIndex, "━━━━━━━━━━━━━━━━━━━━", text_color=color.new(#6633ff, 0),
text_size=getTableSize(), bgcolor=color.new(#1a0d33, 0))
rowIndex += 1
// === 止损行 - 蓝紫主题 ===
slPct = calcStopLossPercentage(entryPrice, stopLoss, entryType)
table.cell(infoTable, 0, rowIndex, "止损价位", text_color=color.new(#b3b3ff, 0),
text_size=getTableSize(), bgcolor=color.new(#0d0d1a, 0))
table.cell(infoTable, 1, rowIndex, formatPrice(stopLoss) + slPct,
text_color=color.new(#ff6699, 0),
text_size=getTableSize(), bgcolor=color.new(#330d1a, 0))
rowIndex += 1
// 止盈目标行
if showTargets
// === 目标位1 - 蓝紫主题 ===
tp1Pct = calcTakeProfitPercentage(entryPrice, takeProfit1, entryType)
tp1Reached = na(takeProfit1) ? false :
(entryType == "多单" ? high >= takeProfit1 : low <= takeProfit1)
tp1Icon = tp1Reached ? " ✓" : ""
tp1Color = tp1Reached ? color.new(#66ff99, 0) : color.new(#99ccff, 0)
tp1BgColor = tp1Reached ? color.new(#0d2619, 0) : color.new(#0d1a26, 0)
table.cell(infoTable, 0, rowIndex, "止盈目标1", text_color=color.new(#b3b3ff, 0),
text_size=getTableSize(), bgcolor=color.new(#0d0d1a, 0))
table.cell(infoTable, 1, rowIndex, formatPrice(takeProfit1) + tp1Pct + tp1Icon,
text_color=tp1Color,
text_size=getTableSize(), bgcolor=tp1BgColor)
rowIndex += 1
// === 目标2 - 蓝紫主题 ===
tp2Pct = calcTakeProfitPercentage(entryPrice, takeProfit2, entryType)
tp2Reached = na(takeProfit2) ? false :
(entryType == "多单" ? high >= takeProfit2 : low <= takeProfit2)
tp2Icon = tp2Reached ? " ✓" : ""
tp2Color = tp2Reached ? color.new(#66ff99, 0) : color.new(#cc99ff, 0)
tp2BgColor = tp2Reached ? color.new(#0d2619, 0) : color.new(#1a0d26, 0)
table.cell(infoTable, 0, rowIndex, "止盈目标2", text_color=color.new(#b3b3ff, 0),
text_size=getTableSize(), bgcolor=color.new(#0d0d1a, 0))
table.cell(infoTable, 1, rowIndex, formatPrice(takeProfit2) + tp2Pct + tp2Icon,
text_color=tp2Color,
text_size=getTableSize(), bgcolor=tp2BgColor)
rowIndex += 1
// === 盈亏比行 - 蓝紫主题 ===
if showRatio
rrColor = color.new(#9999ff, 0)
rrBgColor = color.new(#0d0d1a, 0)
if not na(riskRewardRatio)
if riskRewardRatio >= 2
rrColor := color.new(#66ff99, 0)
rrBgColor := color.new(#0d2619, 0)
else if riskRewardRatio >= 1
rrColor := color.new(#ffcc99, 0)
rrBgColor := color.new(#1a1a0d, 0)
else
rrColor := color.new(#ff9966, 0)
rrBgColor := color.new(#1a1a0d, 0)
table.cell(infoTable, 0, rowIndex, "盈亏比例", text_color=color.new(#b3b3ff, 0),
text_size=getTableSize(), bgcolor=color.new(#0d0d1a, 0))
table.cell(infoTable, 1, rowIndex, riskRewardStr,
text_color=rrColor,
text_size=getTableSize(), bgcolor=rrBgColor)
rowIndex += 1
// === 免责声明行 - 蓝紫主题 ===
table.cell(infoTable, 0, rowIndex, "⚠ 风险提示", text_color=color.new(#9999ff, 0),
text_size=size.small, bgcolor=color.new(#0d0d1a, 0))
table.cell(infoTable, 1, rowIndex, "仅供参考,不构成投资建议,盈亏自负",
text_color=color.new(#9999ff, 0),
text_size=size.small, bgcolor=color.new(#1a1a4d, 0))

Trend Catch STFR - whipsaw Reduced### Summary of the Setup
This trading system combines **SuperTrend** (a trend-following indicator based on ATR for dynamic support/resistance), **Range Filter** (a smoothed median of the last 100 candles to identify price position relative to a baseline), and filters using **VIX Proxy** (a volatility measure: (14-period ATR / 14-period SMA of Close) × 100) and **ADX** (Average Directional Index for trend strength). It's designed for trend trading with volatility safeguards.
- **Entries**: Triggered only in "tradeable" markets (VIX Proxy ≥ 15 OR ADX ≥ 20) when SuperTrend aligns with direction (green for long, red for short), price crosses the Range Filter median accordingly, and you're not already in that position.
- **Exits**: Purely price-based—exit when SuperTrend flips or price crosses back over the Range Filter median. No forced exits from low volatility/trend.
- **No Trade Zone**: Blocks new entries if both VIX Proxy < 15 AND ADX < 20, but doesn't affect open positions.
- **Overall Goal**: Enter trends with confirmed strength/volatility, ride them via price action, and avoid ranging/choppy markets for new trades.
This creates a filtered trend-following strategy that prioritizes quality entries while letting winners run.
### Advantages
- **Reduces Noise in Entries**: The VIX Proxy and ADX filters ensure trades only in volatile or strongly trending conditions, avoiding low-momentum periods that often lead to false signals.
- **Lets Winners Run**: Exits based solely on price reversal (SuperTrend or Range Filter) allow positions to stay open during temporary lulls in volatility/trend, potentially capturing longer moves.
- **Simple and Balanced**: Combines trend (SuperTrend/ADX), range (Filter), and volatility (VIX Proxy) without overcomplicating—easy to backtest and adapt to assets like stocks, forex, or crypto.
- **Adaptable to Markets**: The "OR" logic for VIX/ADX provides flexibility (e.g., enters volatile sideways markets if ADX is low, or steady trends if VIX is low).
- **Risk Control**: Implicitly limits exposure by blocking entries in calm markets, which can preserve capital during uncertainty.
### Disadvantages
- **Whipsaws in Choppy Markets**: As you noted, SuperTrend can flip frequently in ranging conditions, leading to quick entries/exits and small losses, especially if the Range Filter isn't smoothing enough noise.
- **Missed Opportunities**: Strict filters (e.g., requiring VIX ≥ 15 or ADX ≥ 20) might skip early-stage trends or low-volatility grinds, reducing trade frequency and potential profits in quiet bull/bear markets.
- **Lagging Exits**: Relying only on price flips means you might hold losing trades longer if volatility drops without a clear reversal, increasing drawdowns.
- **Parameter Sensitivity**: Values like VIX 15, ADX 20, or Range Filter's 100-candle lookback need tuning per asset/timeframe; poor choices could amplify whipsaws or over-filter.
- **No Built-in Risk Management**: Lacks explicit stops/targets, so it relies on user-added rules (e.g., ATR-based stops), which could lead to oversized losses if not implemented.
### How to Use It
This system can be implemented in platforms like TradingView (via Pine Script), Python (e.g., with TA-Lib or Pandas), or MT4/5. Here's a step-by-step guide, assuming TradingView for simplicity—adapt as needed. (If coding in Python, use libraries like pandas_ta for indicators.)
1. **Set Up Indicators**:
- Add SuperTrend (default: ATR period 10, multiplier 3—adjust as suggested in prior tweaks).
- Create Range Filter: Use a 100-period SMA of (high + low)/2, smoothed (e.g., via EMA if desired).
- Calculate VIX Proxy: Custom script for (ATR(14) / SMA(close, 14)) * 100.
- Add ADX (period 14, standard).
2. **Define Rules in Code/Script**:
- **Long Entry**: If SuperTrend direction < 0 (green), close > RangeFilterMedian, (VIX Proxy ≥ 15 OR ADX ≥ 20), and not already long—buy on bar close.
- **Short Entry**: If SuperTrend direction > 0 (red), close < RangeFilterMedian, (VIX Proxy ≥ 15 OR ADX ≥ 20), and not already short—sell short.
- **Exit Long**: If in long and (SuperTrend > 0 OR close < RangeFilterMedian)—sell.
- **Exit Short**: If in short and (SuperTrend < 0 OR close > RangeFilterMedian)—cover.
- Monitor No Trade Zone visually (e.g., plot yellow background when VIX < 15 AND ADX < 20).
3. **Backtest and Optimize**:
- Use historical data on your asset (e.g., SPY on 1H chart).
- Test metrics: Win rate, profit factor, max drawdown. Adjust thresholds (e.g., ADX to 25) to reduce whipsaws.
- Forward-test on demo account to validate.
4. **Live Trading**:
- Apply to a chart, set alerts for entries/exits.
- Add risk rules: Position size 1-2% of capital, stop-loss at SuperTrend line.
- Monitor manually or automate via bots—avoid overtrading; use on trending assets.
For the adjustments I suggested earlier (e.g., ADX 25, 2-bar confirmation), integrate them into entries only—test one at a time to isolate improvements. If whipsaws persist, combine 2-3 tweaks.

Ultimate Scalping Tool[BullByte]Overview
The Ultimate Scalping Tool is an open-source TradingView indicator built for scalpers and short-term traders released under the Mozilla Public License 2.0. It uses a custom Quantum Flux Candle (QFC) oscillator to combine multiple market forces into one visual signal. In plain terms, the script reads momentum, trend strength, volatility, and volume together and plots a special “candlestick” each bar (the QFC) that reflects the overall market bias. This unified view makes it easier to spot entries and exits: the tool labels signals as Strong Buy/Sell, Pullback (a brief retracement in a trend), Early Entry, or Exit Warning . It also provides color-coded alerts and a small dashboard of metrics. In practice, traders see green/red oscillator bars and symbols on the chart when conditions align, helping them scalp or trend-follow without reading multiple separate indicators.
Core Components
Quantum Flux Candle (QFC) Construction
The QFC is the heart of the indicator. Rather than using raw price, it creates a candlestick-like bar from the underlying oscillator values. Each QFC bar has an “open,” “high/low,” and “close” derived from calculated momentum and volatility inputs for that period . In effect, this turns the oscillator into intuitive candle patterns so traders can recognize momentum shifts visually. (For comparison, note that Heikin-Ashi candles “have a smoother look because take an average of the movement”. The QFC instead represents exact oscillator readings, so it reflects true momentum changes without hiding price action.) Colors of QFC bars change dynamically (e.g. green for bullish momentum, red for bearish) to highlight shifts. This is the first open-source QFC oscillator that dynamically weights four non-correlated indicators with moving thresholds, which makes it a unique indicator on its own.
Oscillator Normalization & Adaptive Weights
The script normalizes its oscillator to a fixed scale (for example, a 0–100 range much like the RSI) so that various inputs can be compared fairly. It then applies adaptive weighting: the relative influence of trend, momentum, volatility or volume signals is automatically adjusted based on current market conditions. For instance, in very volatile markets the script might weight volatility more heavily, or in a strong trend it might give extra weight to trend direction. Normalizing data and adjusting weights helps keep the QFC sensitive but stable (normalization ensures all inputs fit a common scale).
Trend/Momentum/Volume/Volatility Fusion
Unlike a typical single-factor oscillator, the QFC oscillator fuses four aspects at once. It may compute, for example, a trend indicator (such as an ADX or moving average slope), a momentum measure (like RSI or Rate-of-Change), a volume-based pressure (similar to MFI/OBV), and a volatility measure (like ATR) . These different values are combined into one composite oscillator. This “multi-dimensional” approach follows best practices of using non-correlated indicators (trend, momentum, volume, volatility) for confirmation. By encoding all these signals in one line, a high QFC reading means that trend, momentum, and volume are all aligned, whereas a neutral reading might mean mixed conditions. This gives traders a comprehensive picture of market strength.
Signal Classification
The script interprets the QFC oscillator to label trades. For example:
• Strong Buy/Sell : Triggered when the oscillator crosses a high-confidence threshold (e.g. breaks clearly above zero with strong slope), indicating a well-confirmed move. This is like seeing a big green/red QFC candle aligned with the trend.
• Pullbacks : Identified when the trend is up but momentum dips briefly. A Pullback Buy appears if the overall trend is bullish but the oscillator has a short retracement – a typical buying opportunity in an uptrend. (A pullback is “a brief decline or pause in a generally upward price trend”.)
• Early Buy/Sell : Marks an initial swing in the oscillator suggesting a possible new trend, before it is fully confirmed. It’s a hint of momentum building (an early-warning signal), not as strong as the confirmed “Strong” signal.
• Exit Warnings : Issued when momentum peaks or reverses. For instance, if the QFC bars reach a high and start turning red/green opposite, the indicator warns that the move may be ending. In other words, a Momentum Peak is the point of maximum strength after which weakness may follow.
These categories correspond to typical trading concepts: Pullback (temporary reversal in an uptrend), Early Buy (an initial bullish cross), Strong Buy (confirmed bullish momentum), and Momentum Peak (peak oscillator value suggesting exhaustion).
Filters (DI Reversal, Dynamic Thresholds, HTF EMA/ADX)
Extra filters help avoid bad trades. A DI Reversal filter uses the +DI/–DI lines (from the ADX system) to require that the trend direction confirms the signal . For example, it might ignore a buy signal if the +DI is still below –DI. Dynamic Thresholds adjust signal levels on-the-fly: rather than fixed “overbought” lines, they move with volatility so signals happen under appropriate market stress. An optional High-Timeframe EMA or ADX filter adds a check against a larger timeframe trend: for instance, only taking a trade if price is above the weekly EMA or if weekly ADX shows a strong trend. (Notably, the ADX is “a technical indicator used by traders to determine the strength of a price trend”, so requiring a high-timeframe ADX avoids trading against the bigger trend.)
Dashboard Metrics & Color Logic
The Dashboard in the Ultimate Scalping Tool (UST) serves as a centralized information hub, providing traders with real-time insights into market conditions, trend strength, momentum, volume pressure, and trade signals. It is highly customizable, allowing users to adjust its appearance and content based on their preferences.
1. Dashboard Layout & Customization
Short vs. Extended Mode : Users can toggle between a compact view (9 rows) and an extended view (13 rows) via the `Short Dashboard` input.
Text Size Options : The dashboard supports three text sizes— Tiny, Small, and Normal —adjustable via the `Dashboard Text Size` input.
Positioning : The dashboard is positioned in the top-right corner by default but can be moved if modified in the script.
2. Key Metrics Displayed
The dashboard presents critical trading metrics in a structured table format:
Trend (TF) : Indicates the current trend direction (Strong Bullish, Moderate Bullish, Sideways, Moderate Bearish, Strong Bearish) based on normalized trend strength (normTrend) .
Momentum (TF) : Displays momentum status (Strong Bullish/Bearish or Neutral) derived from the oscillator's position relative to dynamic thresholds.
Volume (CMF) : Shows buying/selling pressure levels (Very High Buying, High Selling, Neutral, etc.) based on the Chaikin Money Flow (CMF) indicator.
Basic & Advanced Signals:
Basic Signal : Provides simple trade signals (Strong Buy, Strong Sell, Pullback Buy, Pullback Sell, No Trade).
Advanced Signal : Offers nuanced signals (Early Buy/Sell, Momentum Peak, Weakening Momentum, etc.) with color-coded alerts.
RSI : Displays the Relative Strength Index (RSI) value, colored based on overbought (>70), oversold (<30), or neutral conditions.
HTF Filter : Indicates the higher timeframe trend status (Bullish, Bearish, Neutral) when using the Leading HTF Filter.
VWAP : Shows the V olume-Weighted Average Price and whether the current price is above (bullish) or below (bearish) it.
ADX : Displays the Average Directional Index (ADX) value, with color highlighting whether it is rising (green) or falling (red).
Market Mode : Shows the selected market type (Crypto, Stocks, Options, Forex, Custom).
Regime : Indicates volatility conditions (High, Low, Moderate) based on the **ATR ratio**.
3. Filters Status Panel
A secondary panel displays the status of active filters, helping traders quickly assess which conditions are influencing signals:
- DI Reversal Filter: On/Off (confirms reversals before generating signals).
- Dynamic Thresholds: On/Off (adjusts buy/sell thresholds based on volatility).
- Adaptive Weighting: On/Off (auto-adjusts oscillator weights for trend/momentum/volatility).
- Early Signal: On/Off (enables early momentum-based signals).
- Leading HTF Filter: On/Off (applies higher timeframe trend confirmation).
4. Visual Enhancements
Color-Coded Cells : Each metric is color-coded (green for bullish, red for bearish, gray for neutral) for quick interpretation.
Dynamic Background : The dashboard background adapts to market conditions (bullish/bearish/neutral) based on ADX and DI trends.
Customizable Reference Lines : Users can enable/disable fixed reference lines for the oscillator.
How It(QFC) Differs from Traditional Indicators
Quantum Flux Candle (QFC) Versus Heikin-Ashi
Heikin-Ashi candles smooth price by averaging (HA’s open/close use averages) so they show trend clearly but hide true price (the current HA bar’s close is not the real price). QFC candles are different: they are oscillator values, not price averages . A Heikin-Ashi chart “has a smoother look because it is essentially taking an average of the movement”, which can cause lag. The QFC instead shows the raw combined momentum each bar, allowing faster recognition of shifts. In short, HA is a smoothed price chart; QFC is a momentum-based chart.
Versus Standard Oscillators
Common oscillators like RSI or MACD use fixed formulas on price (or price+volume). For example, RSI “compares gains and losses and normalizes this value on a scale from 0 to 100”, reflecting pure price momentum. MFI is similar but adds volume. These indicators each show one dimension: momentum or volume. The Ultimate Scalping Tool’s QFC goes further by integrating trend strength and volatility too. In practice, this means a move that looks strong on RSI might be downplayed by low volume or weak trend in QFC. As one source notes, using multiple non-correlated indicators (trend, momentum, volume, volatility) provides a more complete market picture. The QFC’s multi-factor fusion is unique – it is effectively a multi-dimensional oscillator rather than a traditional single-input one.
Signal Style
Traditional oscillators often use crossovers (RSI crossing 50) or fixed zones (MACD above zero) for signals. The Ultimate Scalping Tool’s signals are custom-classified: it explicitly labels pullbacks, early entries, and strong moves. These terms go beyond a typical indicator’s generic “buy”/“sell.” In other words, it packages a strategy around the oscillator, which traders can backtest or observe without reading code.
Key Term Definitions
• Pullback : A short-term dip or consolidation in an uptrend. In this script, a Pullback Buy appears when price is generally rising but shows a brief retracement. (As defined by Investopedia, a pullback is “a brief decline or pause in a generally upward price trend”.)
• Early Buy/Sell : An initial or tentative entry signal. It means the oscillator first starts turning positive (or negative) before a full trend has developed. It’s an early indication that a trend might be starting.
• Strong Buy/Sell : A confident entry signal when multiple conditions align. This label is used when momentum is already strong and confirmed by trend/volume filters, offering a higher-probability trade.
• Momentum Peak : The point where bullish (or bearish) momentum reaches its maximum before weakening. When the oscillator value stops rising (or falling) and begins to reverse, the script flags it as a peak – signaling that the current move could be overextended.
What is the Flux MA?
The Flux MA (Moving Average) is an Exponential Moving Average (EMA) applied to a normalized oscillator, referred to as FM . Its purpose is to smooth out the fluctuations of the oscillator, providing a clearer picture of the underlying trend direction and strength. Think of it as a dynamic baseline that the oscillator moves above or below, helping you determine whether the market is trending bullish or bearish.
How it’s calculated (Flux MA):
1.The oscillator is normalized (scaled to a range, typically between 0 and 1, using a default scale factor of 100.0).
2.An EMA is applied to this normalized value (FM) over a user-defined period (default is 10 periods).
3.The result is rescaled back to the oscillator’s original range for plotting.
Why it matters : The Flux MA acts like a support or resistance level for the oscillator, making it easier to spot trend shifts.
Color of the Flux Candle
The Quantum Flux Candle visualizes the normalized oscillator (FM) as candlesticks, with colors that indicate specific market conditions based on the relationship between the FM and the Flux MA. Here’s what each color means:
• Green : The FM is above the Flux MA, signaling bullish momentum. This suggests the market is trending upward.
• Red : The FM is below the Flux MA, signaling bearish momentum. This suggests the market is trending downward.
• Yellow : Indicates strong buy conditions (e.g., a "Strong Buy" signal combined with a positive trend). This is a high-confidence signal to go long.
• Purple : Indicates strong sell conditions (e.g., a "Strong Sell" signal combined with a negative trend). This is a high-confidence signal to go short.
The candle mode shows the oscillator’s open, high, low, and close values for each period, similar to price candlesticks, but it’s the color that provides the quick visual cue for trading decisions.
How to Trade the Flux MA with Respect to the Candle
Trading with the Flux MA and Quantum Flux Candle involves using the MA as a trend indicator and the candle colors as entry and exit signals. Here’s a step-by-step guide:
1. Identify the Trend Direction
• Bullish Trend : The Flux Candle is green and positioned above the Flux MA. This indicates upward momentum.
• Bearish Trend : The Flux Candle is red and positioned below the Flux MA. This indicates downward momentum.
The Flux MA serves as the reference line—candles above it suggest buying pressure, while candles below it suggest selling pressure.
2. Interpret Candle Colors for Trade Signals
• Green Candle : General bullish momentum. Consider entering or holding a long position.
• Red Candle : General bearish momentum. Consider entering or holding a short position.
• Yellow Candle : A strong buy signal. This is an ideal time to enter a long trade.
• Purple Candle : A strong sell signal. This is an ideal time to enter a short trade.
3. Enter Trades Based on Crossovers and Colors
• Long Entry : Enter a buy position when the Flux Candle turns green and crosses above the Flux MA. If it turns yellow, this is an even stronger signal to go long.
• Short Entry : Enter a sell position when the Flux Candle turns red and crosses below the Flux MA. If it turns purple, this is an even stronger signal to go short.
4. Exit Trades
• Exit Long : Close your buy position when the Flux Candle turns red or crosses below the Flux MA, indicating the bullish trend may be reversing.
• Exit Short : Close your sell position when the Flux Candle turns green or crosses above the Flux MA, indicating the bearish trend may be reversing.
•You might also exit a long trade if the candle changes from yellow to green (weakening strong buy signal) or a short trade from purple to red (weakening strong sell signal).
5. Use Additional Confirmation
To avoid false signals, combine the Flux MA and candle signals with other indicators or dashboard metrics (e.g., trend strength, momentum, or volume pressure). For example:
•A yellow candle with a " Strong Bullish " trend and high buying volume is a robust long signal.
•A red candle with a " Moderate Bearish " trend and neutral momentum might need more confirmation before shorting.
Practical Example
Imagine you’re scalping a cryptocurrency:
• Long Trade : The Flux Candle turns yellow and is above the Flux MA, with the dashboard showing "Strong Buy" and high buying volume. You enter a long position. You exit when the candle turns red and dips below the Flux MA.
• Short Trade : The Flux Candle turns purple and crosses below the Flux MA, with a "Strong Sell" signal on the dashboard. You enter a short position. You exit when the candle turns green and crosses above the Flux MA.
Market Presets and Adaptation
This indicator is designed to work on any market with candlestick price data (stocks, crypto, forex, indices, etc.). To handle different behavior, it provides presets for major asset classes. Selecting a “Stocks,” “Crypto,” “Forex,” or “Options” preset automatically loads a set of parameter values optimized for that market . For example, a crypto preset might use a shorter lookback or higher sensitivity to account for crypto’s high volatility, while a stocks preset might use slightly longer smoothing since stocks often trend more slowly. In practice, this means the same core QFC logic applies across markets, but the thresholds and smoothing adjust so signals remain relevant for each asset type.
Usage Guidelines
• Recommended Timeframes : Optimized for 1 minute to 15 minute intraday charts. Can also be used on higher timeframes for short term swings.
• Market Types : Select “Crypto,” “Stocks,” “Forex,” or “Options” to auto tune periods, thresholds and weights. Use “Custom” to manually adjust all inputs.
• Interpreting Signals : Always confirm a signal by checking that trend, volume, and VWAP agree on the dashboard. A green “Strong Buy” arrow with green trend, green volume, and price > VWAP is highest probability.
• Adjusting Sensitivity : To reduce false signals in fast markets, enable DI Reversal Confirmation and Dynamic Thresholds. For more frequent entries in trending environments, enable Early Entry Trigger.
• Risk Management : This tool does not plot stop loss or take profit levels. Users should define their own risk parameters based on support/resistance or volatility bands.
Background Shading
To give you an at-a-glance sense of market regime without reading numbers, the indicator automatically tints the chart background in three modes—neutral, bullish and bearish—with two levels of intensity (light vs. dark):
Neutral (Gray)
When ADX is below 20 the market is considered “no trend” or too weak to trade. The background fills with a light gray (high transparency) so you know to sit on your hands.
Bullish (Green)
As soon as ADX rises above 20 and +DI exceeds –DI, the background turns a semi-transparent green, signaling an emerging uptrend. When ADX climbs above 30 (strong trend), the green becomes more opaque—reminding you that trend-following signals (Strong Buy, Pullback) carry extra weight.
Bearish (Red)
Similarly, if –DI exceeds +DI with ADX >20, you get a light red tint for a developing downtrend, and a darker, more solid red once ADX surpasses 30.
By dynamically varying both hue (green vs. red vs. gray) and opacity (light vs. dark), the background instantly communicates trend strength and direction—so you always know whether to favor breakout-style entries (in a strong trend) or stay flat during choppy, low-ADX conditions.
The setup shown in the above chart snapshot is BTCUSD 15 min chart : Binance for reference.
Disclaimer
No indicator guarantees profits. Backtest or paper trade this tool to understand its behavior in your market. Always use proper position sizing and stop loss orders.
Good luck!
- BullByte

Trend Following Bundle [ActiveQuants]The Trend Following Bundle indicator is a comprehensive toolkit designed to equip traders with a suite of essential technical analysis tools focused on identifying , confirming , and capitalizing on market trends . By bundling popular indicators like Moving Averages , MACD , Supertrend , ADX , ATR , OBV , and the Choppiness Index into a single script, it streamlines chart analysis and enhances strategy development.
This bundle operates on the principle that combining signals from multiple, complementary indicators provides a more robust view of market trends than relying on a single tool. It integrates:
Trend Direction: Moving Averages, Supertrend.
Momentum: MACD.
Trend Strength: ADX.
Volume Pressure: On Balance Volume (OBV).
Volatility: Average True Range (ATR).
Market Condition Filter: Choppiness Index (Trend vs. Range).
By allowing users to selectively enable, customize, and view these indicators (potentially across different timeframes), the bundle facilitates nuanced and layered trend analysis.
█ KEY FEATURES
All-in-One Convenience: Access multiple core trend-following indicators within a single TradingView script slot.
Modular Design: Easily toggle each individual indicator (MAs, MACD, Supertrend, etc.) On or Off via the settings menu to customize your chart view.
Extensive Customization: Fine-tune parameters (lengths, sources, MA types, colors, etc.) for every included indicator to match your trading style and the specific asset.
Multi-Timeframe (MTF) Capability: Configure each indicator component to analyze data from a different timeframe than the chart's, allowing for higher-level trend context.
Integrated Alerts: Pre-built alert conditions for key events like Moving Average crossovers , MACD signals , Supertrend flips , and Choppiness Index threshold crosses . Easily set up alerts through TradingView's alert system.
When configuring your alerts in TradingView, pay close attention to the trigger option:
- Setting it to " Only Once " will trigger the alert the first time the condition is met, which might happen during an unclosed bar (intra-bar). This alert instance will then cease.
- Setting it to " Once Per Bar Close " will trigger the alert only after a bar closes if the condition was met on that finalized bar. This ensures signals are based on confirmed data and allows the alert to potentially trigger again on subsequent closing bars if the condition persists or reoccurs. Use this option for signals based on confirmed, closed-bar data.
MA Smoothing & Bands (Optional): Apply secondary smoothing or Bollinger Bands directly to the Fast and Slow Moving Averages for advanced analysis.
█ USER INPUTS
Fast MA:
On/Off: Enables/Disables the Fast Moving Average plot and related smoothing/bands.
Type: Selects the primary calculation type (SMA, EMA, SMMA (RMA), WMA, VWMA). Default: EMA.
Source: Input data for the MA calculation (e.g., close, open, hl2). Default: close.
Length: Lookback period for the primary MA calculation. Default: 9.
Color: Sets the color of the primary Fast MA line. Default: Yellow.
Line Width: Sets the thickness of the primary Fast MA line. Default: 2.
Smoothing Type: Selects secondary smoothing type applied to the primary MA (e.g., None, SMA, EMA) or adds Bollinger Bands (SMA + Bollinger Bands). Default: None.
Smoothing Length: Lookback period for the secondary smoothing MA or the basis MA for Bollinger Bands. Relevant only if Smoothing Type is not " None ". Default: 10.
BB StdDev: Standard deviation multiplier for Bollinger Bands. Relevant only if Smoothing Type is " SMA + Bollinger Bands ". Default: 2.0.
Timeframe: Sets a specific timeframe for the MA calculation. Default: Chart.
Wait TF Close: If a timeframe is set, waits for that timeframe's bar to close before plotting, preventing repainting. Default: true.
Slow MA:
On/Off: Enables/Disables the Slow Moving Average plot and related smoothing/bands.
Type: Selects the primary calculation type (SMA, EMA, SMMA (RMA), WMA, VWMA). Default: EMA.
Source: Input data for the MA calculation (e.g., close, open, hl2). Default: close.
Length: Lookback period for the primary MA calculation. Default: 9.
Color: Sets the color of the primary Slow MA line. Default: Yellow.
Line Width: Sets the thickness of the primary Slow MA line. Default: 2.
Smoothing Type: Selects secondary smoothing type applied to the primary MA (e.g., None, SMA, EMA) or adds Bollinger Bands (SMA + Bollinger Bands). Default: None.
Smoothing Length: Lookback period for the secondary smoothing MA or the basis MA for Bollinger Bands. Relevant only if Smoothing Type is not " None ". Default: 10.
BB StdDev: Standard deviation multiplier for Bollinger Bands. Relevant only if Smoothing Type is " SMA + Bollinger Bands ". Default: 2.0.
Timeframe: Sets a specific timeframe for the MA calculation. Default: Chart.
Wait TF Close: If a timeframe is set, waits for that timeframe's bar to close before plotting, preventing repainting. Default: true.
MACD:
On/Off: Enables/Disables the MACD plots (MACD line, Signal line, Histogram).
Fast Length: Lookback period for the fast MA in MACD calculation. Default: 12.
Slow Length: Lookback period for the slow MA in MACD calculation. Default: 26.
Source: Input data for the MACD MAs. Default: close.
Signal Smoothing: Lookback period for the Signal Line MA. Default: 9.
Oscillator MA Type: Calculation type for Fast and Slow MAs (SMA, EMA). Default: EMA.
Signal Line MA Type: Calculation type for Signal Line MA (SMA, EMA). Default: EMA.
MACD Color: Color of the MACD line. Default: #2962FF.
MACD Signal Color: Color of the Signal line. Default: #FF6D00.
Timeframe: Sets a specific timeframe for the MACD calculation. Default: Chart.
Wait TF Close: If a timeframe is set, waits for that timeframe's bar to close. Default: true.
On Balance Volume (OBV):
On/Off: Enables/Disables the OBV plot and its related MAs/Bands.
Type (MA Smoothing): Selects MA type for smoothing OBV (None, SMA, EMA, etc.) or SMA + Bollinger Bands. Default: None.
Length (MA Smoothing): Lookback period for the OBV smoothing MA. Default: 14.
BB StdDev: Standard deviation multiplier for Bollinger Bands if selected. Default: 2.0.
Color: Color of the main OBV line. Default: #2962FF.
Timeframe: Sets a specific timeframe for the OBV calculation. Default: Chart.
Wait TF Close: If a timeframe is set, waits for that timeframe's bar to close. Default: true.
ADX:
On/Off: Enables/Disables the ADX plot.
ADX Smoothing: Lookback period for the ADX smoothing component. Default: 14.
DI Length: Lookback period for the Directional Movement (+DI/-DI) calculation. Default: 14.
Color: Color of the ADX line. Default: Red.
Timeframe: Sets a specific timeframe for the ADX calculation. Default: Chart.
Wait TF Close: If a timeframe is set, waits for that timeframe's bar to close. Default: true.
ATR:
On/Off: Enables/Disables the ATR plot.
Length: Lookback period for the ATR calculation. Default: 14.
Smoothing: Selects the calculation type for ATR (SMMA (RMA), SMA, EMA, WMA). Default: SMMA (RMA).
Color: Color of the ATR line. Default: #B71C1C.
Timeframe: Sets a specific timeframe for the ATR calculation. Default: Chart.
Wait TF Close: If a timeframe is set, waits for that timeframe's bar to close. Default: true.
Supertrend:
On/Off: Enables/Disables the Supertrend plot and background fill.
ATR Length: Lookback period for the ATR calculation within Supertrend. Default: 10.
Factor: Multiplier for the ATR value used to calculate the Supertrend bands. Default: 3.0.
Up Trend Color: Color for the Supertrend line and background during an uptrend. Default: Green.
Down Trend Color: Color for the Supertrend line and background during a downtrend. Default: Red.
Timeframe: Sets a specific timeframe for the Supertrend calculation. Default: Chart.
Wait TF Close: If a timeframe is set, waits for that timeframe's bar to close. Default: true.
Choppiness Index:
On/Off: Enables/Disables the Choppiness Index plot and bands.
Length: Lookback period for the Choppiness Index calculation. Default: 14.
Offset: Shifts the plot left or right. Default: 0.
Color: Color of the Choppiness Index line. Default: #2962FF.
Timeframe: Sets a specific timeframe for the CI calculation. Default: Chart.
Wait TF Close: If a timeframe is set, waits for that timeframe's bar to close. Default: true.
█ STRATEGY EXAMPLES
The following strategy examples are provided for illustrative and educational purposes only to demonstrate how indicators within this bundle could be combined. They do not constitute financial advice or trading recommendations. Always conduct your own thorough research and backtesting before implementing any trading strategy.
Here are a few ways the indicators in this bundle can be combined:
1. MA Crossover with Multi-Factor Confirmation
Goal: Enter trends early with confirmation from momentum and trend strength, while filtering out choppy conditions.
Setup: Enable Fast MA (e.g., 9 EMA), Slow MA (e.g., 50 EMA), MACD, ADX, and Choppiness Index.
Entry (Long):
- Price > Slow MA (Establishes broader uptrend context).
- Fast MA crosses above Slow MA OR Price crosses above Fast MA.
- MACD Histogram > 0 (Confirms bullish momentum).
- ADX > 20 or 25 (Indicates sufficient trend strength).
- Choppiness Index < 61.8 (Filters out excessively choppy markets).
Entry (Short): Reverse logic (except for ADX and Choppiness Index).
Management: Consider using the Supertrend or an ATR multiple for stop-loss placement.
Image showing a chart with 2:1 long and short trades, highlighting a candle disqualified for a long entry due to ADX below 20.
2. Supertrend Breakout Strategy
Goal: Use Supertrend for primary signals and stops, confirming with volume and trend strength.
Setup: Enable Supertrend, Slow MA, ADX, and OBV.
Entry (Long):
- Supertrend line turns green and price closes above it.
- Price > Slow MA (Optional filter for alignment with larger trend).
- ADX is rising or above 20 (Confirms trending conditions).
- OBV is generally rising or breaks a recent resistance level (Confirms volume supporting the move).
Entry (Short): Reverse logic (except for ADX and OBV).
Management: Initial stop-loss placed just below the green Supertrend line (for longs) or above the red line (for shorts). Trail stop as Supertrend moves.
Image showing a chart with a 2:1 long trade, one candle disqualified for a short entry, and another disqualified for a long entry.
3. Trend Continuation Pullbacks
Goal: Enter established trends during pullbacks to value areas defined by MAs or Supertrend.
Setup: Enable Slow MA, Fast MA (or Supertrend), MACD, and ADX.
Entry (Long):
- Price is consistently above the Slow MA (Strong uptrend established).
- ADX > 25 (Confirms strong trend).
- Price pulls back towards the Fast MA or the green Supertrend line.
- MACD Histogram was decreasing during the pullback but turns positive again OR MACD line crosses above Signal line near the MA/Supertrend level (Indicates momentum resuming).
Entry (Short): Reverse logic (except for ADX) during a confirmed downtrend.
Management: Stop-loss below the recent swing low or the Slow MA/Supertrend level.
Image showing a chart with 2:1 long and short trades, where price pulls back to the fast MA and the MACD histogram changes color, indicating shifts in momentum during the pullbacks.
█ CONCLUSION
The Trend Following Bundle offers a powerful and flexible solution for traders focused on trend-based strategies. By consolidating essential indicators into one script with deep customization, multi-timeframe analysis, and built-in alerts, it simplifies the analytical workflow and allows for the development of robust, multi-conditional trading systems. Whether used for confirming entries, identifying trend strength, managing risk, or filtering market conditions, this bundle provides a versatile foundation for technical analysis.
█ IMPORTANT NOTES
⚠ Parameter Tuning: Indicator settings (lengths, factors, thresholds) are not one-size-fits-all. Adjust them based on the asset being traded, its typical volatility, and the timeframe you are analyzing for optimal performance. Backtesting is crucial .
⚠ Multi-Timeframe Use: Using the Timeframe input allows for powerful analysis but be mindful of potential lag, especially if Wait TF Close is disabled. Signals based on higher timeframes will update only when that higher timeframe bar closes (if Wait TF Close is enabled).
⚠ Confirmation is Key: While the bundle provides many tools, avoid relying on a single indicator's signal. Use combinations to build confluence and increase the probability of successful trades.
⚠ Chart Clarity: With many indicators available, only enable those relevant to your current strategy to avoid overwhelming your chart. Use the On/Off toggles frequently.
⚠ Confirmed Bars Only: Like most TradingView indicators, signals and plots are finalized on the close of the bar. Be cautious acting on intra-bar signals which may change before the bar closes.
█ RISK DISCLAIMER
Trading involves substantial risk of loss and is not suitable for every investor. The Trend Following Bundle indicator provides technical analysis tools for educational and informational purposes only; it does not constitute financial advice or a recommendation to buy or sell any asset. Indicator signals identify potential patterns based on historical data but do not guarantee future price movements or profitability. Always conduct your own thorough analysis, use multiple sources of information, and implement robust risk management practices before making any trading decisions. Past performance is not indicative of future results.
📊 Happy trading! 🚀

Relative Directional Index (RDI)🔍 Overview
The Relative Directional Index (RDI) is a hybrid tool that fuses the Average Directional and the Relative Strength Indices (ADX and RSI) into a single, highly visual interface. While the former captures trend strength, the latter reveals momentum shifts and potential exhaustion. Together, they can confirm trend structure, anticipate reversals, and sharpen the timing entries and exits.
📌 Why Combine ADX with RSI?
Most indicators focus on either trend-following (like ADX) or momentum detection (like RSI)—but rarely both. Each comes with trade-offs:
- ADX alone confirms trend strength but ignores momentum.
- RSI alone signals overbought/oversold, but lacks trend context.
The RDI resolves this by integrating both, offering:
- Smarter filters for trend entries
- Early warnings of momentum breakdowns
- More confident signal validation
🧠 Design Note: Fibonacci Harmony
All default values—5, 13, 21—are Fibonacci numbers. This is intentional, as these values reflect the natural rhythm of market cycles, and promote harmonic calibration between price action and indicator logic.
🔥 Key Features
✅ ADX Histogram
- Green bars = trend gaining strength
- Red bars = trend weakening
- Adjustable transparency for visual tuning
✅ ADX Line (Orange)
- Measures trend strength over time
- Rising = accelerating trend
- Falling = trend may be fading
✅ RSI Line (Lemon Yellow)
- Captures momentum surges and slowdowns
- Above 50 = bullish control
- Below 50 = bearish pressure
✅ Trend Strength Squares
- Bright green = strong uptrend
- Bright red = strong downtrend
- Faded colors = range-bound or indecisive
✅ ADX/RSI Crossover Markers
- Yellow square = RSI crosses above ADX → momentum building
- Orange square = ADX crosses above RSI → trend still dominant
✅ Customizable Reference Lines
- Yellow (50) = strong trend threshold
- Red (30) = weak trend zone
- Green (70) = overextended, potential exhaustion
_______________________________________________________
🎯 How to Trade with the RDI
The RDI helps traders identify momentum-supported trends, catch early reversals, and avoid false signals during consolidation.
✅ Trend Confirmation Entries
🔼 Bullish → Enter long on pullbacks or resistance breakouts
- ADX rising above 30
- RSI above 50
- Green trend square visible
🔽 Bearish → Enter short on breakdowns or failed retests
- ADX rising
- RSI below 50
- Red trend square visible
🧯 Exit if RSI crosses back against trend direction or ADX flattens
🚨 Reversal Setups Using Divergence
📈 Bullish Divergence → Long entry after confirmation (e.g. engulfing bar, volume spike)
- Price prints lower low
- RSI prints higher low
- Green triangle
📉 Bearish Divergence → Short entry on breakdown
- Price prints higher high
- RSI prints lower high
- Red triangle
Tip: Stronger if ADX is declining (fading trend strength)
🔂 Breakout Detection via Cross Markers
- Yellow square = RSI > ADX → breakout brewing
- Orange square = ADX > RSI → trend continuation likely
⏸️ Avoid Choppy Markets
- RSI between 45–55
- Faded trend squares
- Flat ADX below 20–30
🧠 Pro Tips
- Combine RDI with VWAPs, moving averages and/or pitchforks
- Watch for alignment between trend and momentum
- Use divergence markers as confirmation, not stand-alone triggers
_______________________________________________________
⚠️ Hidden Divergence (Optional)
The RDI includes optional hidden divergence detection. These signals suggest trend continuation but are off by default. Use with discretion—best in established trends, not sideways markets.
🙈 Hidden Bullish
- Price prints higher low
- RSI prints lower low
🙈 Hidden Bearish
- Price prints lower high
- RSI prints higher high

Smart Trend Lines [The_lurker]"Smart Trend Lines" هو مؤشر متقدم مصمم لرسم خطوط الاتجاه الديناميكية تلقائيًا على الرسم البياني، مع القدرة على اكتشاف الكسور (Breakouts) بدقة باستخدام فلاتر تحليلية مثل ADX، RSI، والحجم. يوفر المؤشر ثلاثة أنواع من خطوط الاتجاه – رئيسية (Main)، متوسطة (Mid)، وقصيرة (Short) – لتلبية احتياجات المتداولين على مختلف الأطر الزمنية، سواء كانوا يركزون على الاتجاهات طويلة الأمد أو قصيرة الأمد.
كيف يعمل :
1- رسم خطوط الاتجاه:
يستخدم المؤشر نقاط الـ Pivot Highs و Pivot Lows لتحديد خطوط الاتجاه الصاعدة والهابطة تلقائيًا.
يتم رسم ثلاثة مستويات لخطوط الاتجاه بناءً على أطوال زمنية قابلة للتخصيص:
Main Trend Lines: لتحليل الاتجاهات طويلة الأمد (افتراضي: 50 شمعة).
Mid Trend Lines: للاتجاهات متوسطة المدى (افتراضي: 21 شمعة).
Short Trend Lines: للاتجاهات قصيرة المدى (افتراضي: 9 شموع).
2- اكتشاف الكسور:
يتم اكتشاف كسر خط الاتجاه عندما يتجاوز السعر (إغلاق، أعلى، أدنى - حسب اختيار المستخدم) الخط.
يتم وضع تسمية (Label) عند نقطة الكسر تحمل معلومات مختصرة عن الشروط المتحققة (مثل الحجم، ADX، RSI).
3- فلاتر التحقق:
ADX: يتحقق من قوة الاتجاه (الحد الأدنى قابل للتعديل، افتراضي: 20).
RSI: يستخدم لتصفية الكسور في مناطق التشبع الشرائي أو البيعي (حدود عليا وسفلى قابلة للتخصيص).
Volume: يقارن الحجم الحالي بالمتوسط المتحرك للحجم للتأكد من قوة الحركة.
4- التنبيهات:
يوفر تنبيهًا موحدًا عند حدوث أي كسر (شراء أو بيع) لجميع أنواع الخطوط، مع إطلاق التنبيه فقط عند شمعة الكسر.
المميزات الرئيسية
خطوط اتجاه متعددة المستويات:
ثلاثة أطوال مختلفة (رئيسية، متوسطة، قصيرة) مع إمكانية إظهارها أو إخفائها بشكل مستقل، مما يتيح المرونة للمتداولين.
تخصيص كامل:
تعديل أطوال خطوط الاتجاه (عدد الشموع).
اختيار الألوان والأنماط (متصل، متقطع، منقط) لكل نوع من الخطوط.
تحديد حجم التسميات (Tiny, Small, Normal, Large, Huge).
اختيار نوع السعر المستخدم لفحص الكسر (Close, High, Low).
فلاتر ذكية:
استخدام ADX لتأكيد قوة الاتجاه.
فلتر RSI لتجنب الإشارات في المناطق المشبعة.
مقارنة الحجم لضمان أهمية الكسر.
تسميات تفاعلية:
تظهر التسميات عند الكسر مع رموز مختصرة (V للحجم، A لـ ADX، R لـ RSI) لتوضيح الشروط المتحققة.
حجم التسميات قابل للتخصيص لتحسين الرؤية.
تنبيهات دقيقة:
تنبيه واحد موحد لجميع الكسور (شراء أو بيع) يُطلق فقط عند شمعة الكسر، مما يقلل من الإزعاج ويزيد من الكفاءة.
عرض الخطوط السابقة:
خيار اختياري لعرض خطوط الاتجاه الرئيسية السابقة لتحليل تاريخي أعمق.
الفوائد
سهولة الاستخدام: يرسم خطوط الاتجاه تلقائيًا دون الحاجة إلى رسم يدوي.
دقة عالية: الفلاتر المتعددة (ADX، RSI، Volume) تقلل من الإشارات الخاطئة وتعزز موثوقية الكسور.
مرونة كبيرة: مناسب لجميع أنواع المتداولين (Scalpers، Swing Traders، Long-term Investors) بفضل الخطوط متعددة الأطوال.
واجهة مرئية واضحة: ألوان وأنماط قابلة للتخصيص تجعل الرسم البياني سهل القراءة.
%% نصائح الاستخدام
للمتداولين قصيري الأمد: ركز على خطوط "Short" واضبط الفلاتر لتكون أكثر حساسية (مثل تقليل عتبة ADX).
للتحليل طويل الأمد: استخدم خطوط "Main" مع إعدادات افتراضية أو أطول لالتقاط الاتجاهات الكبيرة.
قم بتفعيل التنبيهات للحصول على إشعارات فورية عند حدوث كسر مؤكد.
%% الإعدادات
Main/Mid/Short Trend Line Length: اضبط طول كل خط بناءً على استراتيجيتك.
Color & Style: اختر ألوانًا وأنماطًا تناسب تفضيلاتك البصرية.
Break Check Price: حدد نوع السعر المستخدم للكسر (افتراضي: Close).
Label Size: اختر حجم التسميات حسب احتياجاتك.
Filters: فعّل أو عطّل الفلاتر وضبط العتبات (ADX، RSI، Volume) لتتناسب مع السوق.
إخلاء المسؤولية
لا يُقصد بالمعلومات والمنشورات أن تكون، أو تشكل، أي نصيحة مالية أو استثمارية أو تجارية أو أنواع أخرى من النصائح أو التوصيات المقدمة أو المعتمدة من TradingView.
"Smart Trend Lines" is an advanced indicator for drawing dynamic trend lines, with the ability to detect breakouts (breakouts) using analytical filters such as ADX, RSI, etc. It provides three types of light lines - main (main), intermediate (intermediate), and short (short) - for the General Pipeline Network Company on various time frames, whether they are set on long-term or precious trends.
How it works:
1- Drawing lines for lines:
Uses the Pivot Highs and Pivot Lows indicator points for guide lines and automatic guide lines.
Three levels of guide lines are drawn along the air lines for customization:
Main trend lines: for analyzing long-term trends (default: 50 candles).
Intermediate trend lines: for medium-term trends (default: 21 candles).
Short trend lines: for short-term trends (default: 9 candles).
2- Fracture detection:
A fault is detected when the price (close, high, low - according to the user's choice) crosses the line.
A label is placed at the break point with brief information about the conditions met (such as volume, ADX, RSI).
3- Validation filters:
ADX: Checks the strength of the fault (simple limit, default: 20).
Relative Strength Index (RSI): Used to filter out fractures in the northern or eastern regions (customizable upper limits).
Volume: Compares the current volume to the moving average of the volume by the strength of the impact.
4- Alerts:
Provides a unified alert when any break (buy or sell) occurs for all types of lines, with the alert being triggered only when the break occurs.
Key features
Multiple trend lines for levels:
Three different lengths (main, medium, short) with the possibility of showing or hiding them independently, allowing traders.
Full translation:
Modify the length of the lines (number of candles).
Choose colors and styles (solid, dashed, dotted) for each type of line.
Select label size (small, small, normal, large, huge).
Select user type to check the breakout (close, high, low).
Smart filters:
Use ADX to confirm the strength of the error.
RSI filter abbreviated in environmental factors.
Compare volume and use of the breakout.
Interactive labels:
Scale labels on the breakout with special symbols (V for volume, A for ADX, R for RSI) to indicate the conditions met.
Customizable label size to customize the search.
Precise alerts:
A single unified alert for all breakouts (buy or sell) is triggered only on the breakout, choosing from celebration to protest for that.
View previous lines:
Option to select previous major lines to analyze their history.
Benefits
Ease of use: Draws freehand lines without the need to draw by hand.
High-precision: Optical filters (ADX, RSI, Volume) are effective from the effective impact and enhance the confidence of the breakouts.
Multiple options: Suitable for all types of traders (scalpers, swing traders, long-term investors) thanks to Malaysia Airlines 24/7.
Visual interface: Colors and patterns can be plotted for easy-to-read charting.
%% Tips for use
For short-term traders: Focus on the "short" lines and adjust the filters to be more visible (e.g. reduce the ADX bar).
For long-term analysis: Use the "main" lines with default or partial settings for key points.
Enable notifications for breakouts on instant notifications when absolutely necessary.
%%Except
Main/Intermediate/Short Trend Line Length: Adjust the length of each line to guide you.
Color and Style: Choose colors and styles to suit your visual preferences.
Verify Price Breakout: Select the type of price used for the breakout (default: Close).
Label Size: Choose the size of the labels as desired.
Filters: Enable or disable filters and adjust thresholds (ADX, RSI, Volume) to suit the market.
Disclaimer
The information and posts are not intended to be, or constitute, any financial, investment, trading or other types of preparation or execution of tasks or endorsed by TradingView.
Triple Standard Deviation==日本語説明も併記 // Japanese discription is following ==
■ Momentum Indicator (Triple Indication of Standard Deviation Volatilities)
■ Effective assets: All
■Example of utilization
1) Assume that a trend is generated at the timing when the yellow area chart (26) rises
2) Confirm the candlestick and if the price jumps out of the Bollinger band ± 1 σ, the trend toward that direction
3) If the closing price is confirmed within ± 1σ of the Bollinger band, close the position
■ Detailed explanation
Three standard deviation volatilities with different parameters are displayed at the same time. As represented by convergence divergence of Bollinger, it has a characteristic that it rises in the trend generation period and falls during the trend convergence period.
It develops color in a rising phase so that trend generation is easy to recognize, and fades in a falling phase.
Daily use is basic, but you can use it with the same parameters for other time feet.
The basic parameter (26) is displayed in yellow area for the most visibility.
The long-term parameter (52) is indicated by a yellow dot as an auxiliary element for judging the rising margin of the basic line.
The short-term parameter (13) is displayed as a line as an auxiliary element for recognizing the peak out of the basic line in advance.
In some cases, by changing short term (13) to super long term (100) you can recognize the major market price level once in several years.
Three periods The phrase "all lines" goes from "low position" to "rising together" is considered the strongest trend.
On the other hand, in the case where the short-term line rises backwards as the longer-term line goes down, it tends to end up with short-lived trends and failure to form trends.
If the trend speed is constant as a standard feature of calculating the standard deviation, the standard deviation may decrease even during trend continuation. Therefore, it is desirable to make a comprehensive judgment by comparing the shape of candlestick with the longer-term line.
Please note that there is no way to judge whether the trend suggested by this index rises or falls from this index, so it is necessary to confirm the main chart. (It is preferable to display parabolic or Bollinger band)
■ Remarks
It is an index created assuming that it is used as Triple STD-ADX in combination with Triple Smoothed ADX(to be posted later).
■ About Triple STD-ADX
Triple Standard Deviation "and" Triple Smoothed ADX "are superimposed and displayed as" Screen (without scale) "to function as" Triple STD - ADX ".
The method of utilization is the same as Triple Standard Deviation and Triple Smoothed ADX, but by simultaneously displaying two momentum indicators with different calculation approaches with multiple parameters, we aim to mutually complement the cognitive power of trends.
STD (13, 26, 52, 100, 200) and ADX (7, 14, 26, 52, 100) correspond to reaction rates respectively.
By choosing different reaction rates you can expect to further increase reliability.
You can estimate the reliability of the trend most reliably in a situation where all six signals in total rise from low to high.
■Sample: STD-ADX Trade Signal
========================================================
■ モメンタム指標(標準偏差ボラティリティの3連表示)
■ 有効アセット:すべて
■ 活用の一例
1)黄色のエリアチャート(26)が上昇したタイミングでトレンド発生を想定
2)ローソク足を確認し、ボリンジャーバンド±1σの外に価格が飛び出している場合はその方向へのトレンドと認識
3)ボリンジャーバンド±1σ以内で終値が確定した場合にはポジションクローズ
■ 詳細説明
パラメーターの異なる3つの標準偏差ボラティリティを同時に表示します。ボリンジャーの収束発散に代表されるように、トレンド発生期に上昇しトレンド収束期に低下する特性を持ちます。
トレンド発生を認識しやすいように上昇局面で発色し、下降局面で退色します。
活用は日足が基本ですが、他の時間足に対しても同一パラメーターで使用することができます。
基本パラメーター(26)は最も視認しやすいように黄色のエリア表示にしています。
長期パラメーター(52)は基本線の上昇余力を判断するための補助要素として黄色の丸点で表示しています。
短期パラメーター(13)は基本線のピークアウトを先行して認識するための補助要素としてラインで表示にしています。
場合によって、短期(13)を超長期(100)に変更することで数年に一度のレベルの大相場が認識できます。
3期間「全てのライン」が「低い位置」から「揃って上昇」する局面を最も強いトレンドと考えます。
一方、より長期のラインが低下する中、より短期のラインが逆行して上昇するケースでは、短命のトレンドやトレンド形成失敗に終わることが多くなります。
標準偏差の計算上の特徴としてトレンドの速度が一定の場合にトレンド継続中も標準偏差が低下することがあります。そのため、ローソク足の形状とより長期のラインを見比べて総合的に判断することが望ましいです。
なお、本指標が示唆するトレンドが上昇か下降かは本指標からは判断する術はないため、必ずメインチャートを確認する必要があります。(パラボリックやボリンジャーバンドを表示すると好適)
■備考
追って掲載するTriple Smoothed ADXと併用して、Triple STD-ADXとして使用することを想定して作成した指標です。
■Triple STD-ADXについて
「Triple Standard Deviation」と「Triple Smoothed ADX」を一方を「スクリーン(スケールなし)」として重ねて表示させることで「Triple STD-ADX」として機能します。
活用方法はTriple Standard DeviationやTriple Smoothed ADXと同じですが、算出アプローチの異なる2つのモメンタム指標を複数パラメーターで同時に表示させることで、トレンドの認識力を相互に補完する狙いがあります。
反応速度はそれぞれSTD(13,26,52,100,200)とADX(7,14,26,52,100)がほぼ対応します。
異なる反応速度を選択することで信頼度をさらに高めることを期待できます。
合計6本のシグナル全てが低い位置から揃って上昇する局面でトレンドの信頼性を最も高く見積もることができます。

Consolidation Zones Volume Delta | Flux ChartsGENERAL OVERVIEW:
The Consolidation Zones Volume Delta | Flux Charts indicator is designed to identify and visualize consolidation zones on the chart. Rather than only outlining areas of sideways price movement, the indicator analyzes volume activity occurring inside each consolidation zone. This is done by aggregating lower-timeframe volume data into the higher-timeframe consolidation range, allowing users to see how buying and selling activity evolves while price remains in a range.
What is the theory behind the indicator?:
The indicator is built around three core analytical concepts that guide how consolidation zones are detected and evaluated.
1. Consolidation as a structural phase
Periods of consolidation are characterized by reduced directional movement and compressed price ranges. During these phases, price action often alternates within a defined high–low boundary, creating a structure that can be objectively measured and tracked over time.
2. Volume behavior inside consolidation
While price may appear balanced within a consolidation range, volume activity inside that range can vary. The indicator evaluates volume contributions occurring within the vertical boundaries of the consolidation zone by using lower-timeframe data and weighting each candle’s volume based on its overlap with the zone. This produces an internal volume delta profile that reflects how buying and selling volume accumulates throughout the consolidation.
Delta behavior inside a zone may show:
Persistent dominance of buying or selling volume
Alternating shifts between buyers and sellers
Periods of relatively balanced participation
3. Markets consolidate in multiple ways, one detection method is not enough
Markets do not consolidate in a single, uniform way. To account for this, the indicator includes three distinct consolidation detection methods. Each method is calculated objectively, does not repaint, and targets a different type of sideways or low-expansion price behavior:
Candle Compression
ADX Low Trend Strength
Visual Range Boundaries
CONSOLIDATION ZONES VOLUME DELTA FEATURES:
The Consolidation Zones Volume Delta indicator includes 4 main features:
Consolidation Zones
Volume Delta
Standard Deviation Bands
Alerts
CONSOLIDATION ZONES:
🔹What is a Consolidation Zone?
A consolidation zone is a defined price range where market movement becomes compressed and price remains contained within clear upper and lower boundaries for a sustained period of time. During this phase, price does not establish a strong directional trend and instead oscillates within a relatively narrow range.
🔹Consolidation Zone Detection
The indicator automatically detects consolidation zones using three independent, rule-based methods. Each method evaluates a different market condition and can be selected individually depending on how you want consolidation to be defined. Regardless of the method used, all zones are calculated objectively and finalized once confirmed.
◇ Candles (Candle Compression)
The Candles method identifies consolidation by detecting periods of candle compression and reduced range expansion. A candle is considered part of a consolidation sequence when:
The candle body is small relative to its total range
The candle’s high–low range is smaller than the short-term Average True Range (ATR)
ATR is calculated using a 4-period average true range and is used as a volatility reference. If consecutive candles continue to meet these compression conditions, the indicator increments an internal count.
Under the Consolidation Candles section in the settings, you’ll find two controls.
Min. Consolidation Candles setting
This defines how many consecutive compressed candles are required before a consolidation zone is confirmed. Candle compression is determined using candle structure and short-term ATR, ensuring that only periods of reduced range expansion are counted. Once the minimum threshold is reached, the indicator creates a consolidation zone using the highest high and lowest low formed during the compressed sequence.
Mark Consolidation Candles
When enabled, the indicator highlights candles that meet the compression criteria, making it easy to visually identify which candles contributed to the formation of the consolidation zone.
◇ ADX (Low Trend Strength)
The ADX method identifies consolidation based on weak or declining trend strength rather than candle structure. This method uses the Average Directional Index (ADX) to determine when directional movement is reduced.
ADX is calculated using directional movement values that are smoothed over time. When ADX remains below a user-defined threshold, price is treated as being in a low-trend market. While this condition persists, the indicator tracks the highest high and lowest low formed during the low-trend period.
Under the ADX Settings section in the settings, you’ll find the following controls.
ADX Length
Defines the lookback period used to calculate directional movement for ADX.
ADX Smoothing
Controls the smoothing applied to the ADX calculation.
ADX Threshold
Sets the level below which ADX must remain for the market to be considered consolidating.
Consolidation Strength
Defines how many consecutive candles’ ADX must stay below the threshold before a consolidation zone is confirmed. Once this requirement is met, the indicator creates a consolidation zone using the accumulated high and low from the low-trend window.
Mark Candles Below Threshold
When enabled, the indicator highlights candles where ADX remains below the threshold.
◇ Visual Range
The Visual Range method identifies consolidation by detecting clearly defined horizontal price ranges where price remains contained for a sustained period of time. The indicator continuously tracks the rolling highest high and lowest low across recent candles. When price remains inside the same high–low boundaries without breaking above or below the range, an internal counter advances.
Under the Visual Range section in the settings, you’ll find the following control.
Min. Candles in Range
Defines how many consecutive candles must remain fully contained within the same high–low range before a consolidation zone is confirmed. Once this requirement is met, the indicator creates a consolidation zone using the established range boundaries.
🔹Consolidation Zone Settings
◇ Invalidation Method
Users can choose how Consolidation Zones are invalidated, selecting between Close Break or Wick Break.
Close Break: A Consolidation Zone is invalidated when a candle closes above/below the zone.
Wick Break: A Consolidation Zone is invalidated when a candle’s wick goes above/below the zone.
◇ Merge Overlapping Zones
When enabled, overlapping Consolidation Zones are automatically combined into one unified zone.
◇ Show Last
This setting determines how many Consolidation Zones are displayed on your chart. For example, setting this to 5 will display the 5 most recent zones.
VOLUME DELTA:
Delta Volume visualizes how buying and selling volume accumulates inside each consolidation zone. Instead of using the full candle volume, the indicator isolates only the volume that occurs within the vertical boundaries of the zone. This allows you to see whether bullish or bearish volume is dominating while price remains range-bound. The visualization updates in real time while the zone is active and reflects cumulative participation rather than individual candles.
🔹How Volume Delta is Calculated
Delta Volume is calculated using lower-timeframe data and applied to the higher-timeframe consolidation zone.
Each candle’s volume is split into bullish or bearish volume based on candle direction.
Lower-timeframe candles are pulled using the selected delta timeframe.
For each lower-timeframe candle, only the portion of volume that vertically overlaps the consolidation zone is counted.
Volume is weighted by the amount of overlap between the candle’s range and the zone’s range.
Bullish and bearish volume are accumulated over time to form a running, cumulative delta profile for the zone.
🔹Volume Delta Settings
◇ Enable
Turns the Delta Volume visualization on or off. Consolidation zones continue to plot when disabled.
◇ Show Delta %
Displays the percentage breakdown of bullish versus bearish volume inside the consolidation zone. Percentages are derived from cumulative volume totals.
◇ 3D Visual
When enabled, the delta blocks are extended diagonally using a depth offset derived from the instrument’s daily ATR. This creates visible side faces and top faces for the delta blocks, simulating depth without altering any calculations. The 3D effect is purely visual. It does not change how volume is calculated, weighted, or accumulated.
Users can control the intensity of the 3D effect choosing a value between 1 and 5. Increasing this value increases:
The horizontal offset of the delta blocks
The vertical depth projection applied to the volume faces
Higher values produce a more pronounced 3D appearance by pushing the delta visualization further away from the consolidation box. Lower values keep the visualization flatter and closer to the box boundaries. The depth scaling is normalized using ATR, so the effect adapts proportionally to the instrument’s volatility.
◇ Volume Delta Display Style
Controls how bullish and bearish volume are displayed inside the Consolidation Zone:
Horizontal: Volume is split top-to-bottom within the zone
Vertical: Volume is split left-to-right across the zone
◇ Timeframe
Defines the lower timeframe used for Volume Delta calculations. When a timeframe is selected, the indicator pulls lower-timeframe price and volume data and maps it into the higher-timeframe consolidation zone. Each lower-timeframe candle is evaluated individually. Only the portion of its volume that vertically overlaps the consolidation zone is included, and that volume is weighted based on the candle’s overlap with the zone’s price range. If the Timeframe field is left empty, the indicator defaults to using the chart’s current timeframe for delta calculations.
Using a lower timeframe increases the granularity of the delta calculation, allowing volume changes inside the zone to be measured more precisely. Using a higher timeframe produces a smoother, less granular delta profile.
Please Note: Delta rendering is automatically limited to available lower-timeframe data to prevent incomplete or distorted visuals when historical lower-timeframe volume is unavailable due to TradingView data limits.
STANDARD DEVIATION BANDS:
Standard Deviation Bands project measured price distance away from a confirmed consolidation zone using the size of that zone as the reference unit. Rather than calculating volatility from historical price dispersion, the bands are derived directly from the height of the consolidation range itself. Each band represents a fixed multiple of the consolidation zone’s height and is plotted symmetrically above and below the zone.
🔹How the bands are calculated
Once a consolidation zone is finalized, the indicator calculates the zone height as:
Zone Height = Zone High − Zone Low
This value becomes the base measurement for all deviation calculations. For each enabled band:
Upper bands are placed above the consolidation zone’s high
Lower bands are placed below the consolidation zone’s low
The distance of each band from the zone is calculated by multiplying the zone height by the selected band multiplier. These band levels are fixed relative to the consolidation zone and do not recalculate based on future price movement.
🔹Standard Deviation Band Settings
◇ Band 1
Enables the first deviation band above and below the consolidation zone. The Band 1 multiplier defines how far the band is placed from the zone in terms of zone height. For example, a multiplier of 1 plots the band one full zone height above and below the consolidation range.
◇ Band 2
Enables a second deviation band at a greater distance from the consolidation zone. Band 2 uses its own multiplier and is calculated independently of Band 1, allowing multiple expansion levels to be displayed simultaneously.
◇ Fill Bands
When enabled, the area between the consolidation zone and each deviation band is filled with a semi-transparent color. Upper fills apply to bands above the zone, and lower fills apply to bands below the zone. Fills are static and tied directly to the consolidation zone boundaries.
◇ Color Customization
Each deviation band has independent color controls for:
Upper band lines and fills
Lower band lines and fills
This allows users to visually distinguish between bullish and bearish extensions as well as between multiple deviation levels.
ALERTS:
Users can create alerts for the following:
New Consolidation Zone Formed
Consolidation Zone Break
UNIQUENESS:
This indicator combines multiple consolidation detection methods with lower-timeframe volume delta analysis inside each consolidation zone. It visualizes bullish and bearish volume using weighted overlap logic and optional 3D rendering for improved clarity. Users can choose how volume is displayed, apply structure-based deviation bands, and enable alerts for new zones and zone breaks. All features are rule-based, configurable, and designed to work together within a single framework.

Regime EngineRegime Engine
Overview
Regime Engine is a market regime detection system that classifies price action into bullish, bearish, or neutral states using weighted exponential moving average analysis. Once the regime is identified, the indicator generates buy and sell signals based on Donchian channel breakouts, filtered by ADX trend strength and RSI momentum conditions.
The Money Line
The core of regime detection is the Money Line, a weighted combination of two exponential moving averages. By default, the short EMA (8 periods) receives 60% weight while the long EMA (24 periods) receives 40% weight. This weighting allows the Money Line to be more responsive than a simple long-period average while remaining smoother than a short-period average alone.
The Money Line changes color based on the current regime: green for bullish, red for bearish, and yellow for neutral. This provides immediate visual feedback about the market state.
Regime Classification
The indicator determines market regime by comparing the relative positions of the short and long EMAs while also considering RSI levels to avoid classifying overbought or oversold conditions as trend states.
Bullish regime is identified when the short EMA is above the long EMA and RSI is not in overbought territory. This combination suggests upward momentum that is not yet exhausted.
Bearish regime is identified when the short EMA is below the long EMA and RSI is not in oversold territory. This indicates downward momentum with room to continue.
Neutral regime applies when the EMAs are close together or RSI conditions prevent trend classification. The indicator provides two optional methods for enhanced neutral detection.
Neutral Zone Detection
Markets often transition through periods where trend direction is unclear. The indicator offers two complementary methods for detecting these neutral zones.
The slope method examines the rate of change of the Money Line relative to ATR. When the Money Line is moving slowly (slope below a tolerance threshold), the market is classified as neutral regardless of EMA positioning.
The EMA distance method calculates the percentage distance between the short and long EMAs. When they are within a specified percentage of each other, the EMAs are considered too close to reliably indicate direction.
Either or both methods can be enabled, and if either triggers, the regime is classified as neutral.
Donchian Channel Signals
Buy and sell signals are generated when price interacts with the Donchian channel boundaries. The Donchian channel plots the highest high and lowest low over a lookback period (default 20 bars), offset by one bar to prevent repainting.
Buy signals trigger when price touches or breaks below the lower Donchian band, indicating a potential support level. Sell signals trigger when price touches or breaks above the upper Donchian band, indicating potential resistance.
An optional setting requires the close to confirm the break rather than just the wick, providing more conservative signal generation.
ADX Trend Strength Filter
The Average Directional Index filters signals to ensure they occur during trending conditions. When enabled, signals only fire if ADX exceeds the threshold (default 24), confirming that the market has sufficient directional momentum for breakout trades to succeed.
The indicator uses Wilder's original smoothing method for ADX calculation, providing the traditional interpretation of trend strength values.
RSI Momentum Filter
RSI provides additional signal filtering to ensure entries occur at favorable momentum levels. Buy signals require RSI to be at or below the oversold threshold (default 30), indicating potential exhaustion of selling pressure. Sell signals require RSI to be at or above the overbought threshold (default 70), suggesting exhaustion of buying pressure.
These filters can be disabled for traders who prefer unfiltered Donchian breakout signals.
BBWP Volatility Monitoring
Bollinger Band Width Percentile measures current volatility relative to its historical range. The indicator calculates BB width and ranks it against the specified lookback period (default 252 bars, approximately one trading year).
BBWP above 70% indicates elevated volatility, which may signal trend acceleration or potential reversals. BBWP below 30% indicates compressed volatility, often preceding significant moves. The information panel displays the current BBWP reading with color coding to highlight these conditions.
Signal Cooldown
To prevent signal clustering during extended breakout periods, a configurable cooldown prevents new signals of the same type for a specified number of bars after each signal. This ensures each signal represents a distinct trading opportunity.
Visual Components
The Donchian channel can display shaded bands between the upper and lower boundaries. The shading color reflects the current regime: green for bullish, magenta for bearish, and blue for neutral. This provides at-a-glance context for where price is trading within its recent range.
An ADX strength bar at the bottom of the chart uses color coding: white for weak trend (ADX below 15), orange for ranging (ADX 15-24), and blue for trending (ADX above 24). This matches the trend strength display in the information panel.
Price labels appear at signal locations showing the signal type and entry price. Labels are automatically cleaned up after reaching a configurable history limit to maintain chart performance.
Signal candles are highlighted in blue, making it easy to identify exactly which bars generated signals when reviewing historical performance.
Information Panel
A compact table displays key metrics: current regime bias, trend strength classification, BBWP volatility reading, RSI level, and ADX value. Each metric is color-coded to highlight favorable or unfavorable conditions.
The panel can be positioned at any corner or middle edge of the chart. An alternative label-based display anchored to the chart is also available for those who prefer that format.
Trend Persistence Option
By default, the regime is recalculated on every bar. An optional persistence mode changes this behavior so that the regime only changes on EMA crossovers. This reduces regime flipping during choppy conditions but may delay regime recognition during gradual trend changes.
How to Use
Monitor the Money Line color and information panel for current regime. In bullish regimes, focus on buy signals at the lower Donchian band as potential pullback entries. In bearish regimes, focus on sell signals at the upper band as potential short entries or exit points.
Use the ADX strength indicator to gauge signal reliability. Signals during trending conditions (blue ADX bar) have historically higher success rates than signals during ranging conditions (orange bar) or weak trends (white bar).
Watch BBWP for volatility context. Low BBWP readings suggest a significant move may be developing, while high readings indicate the current move may be overextended.
The combination of regime awareness, Donchian breakout signals, and ADX/RSI filtering provides a structured approach to identifying trading opportunities across different market conditions.
Settings Guidance
The default settings work well for cryptocurrency and forex markets on intraday timeframes. For stocks or longer timeframes, consider increasing the EMA periods and Donchian lookback. The ADX threshold can be adjusted based on the typical ADX range for the traded instrument.
The RSI filter levels can be relaxed (higher oversold, lower overbought) for more signals or tightened for higher-quality but less frequent signals. The cooldown period should be adjusted based on timeframe, with shorter timeframes typically requiring longer cooldown periods.

Chimera [theUltimator5]In myth, the chimera is an “impossible” hybrid—lion, goat, and serpent fused into one—striking to look at and formidable in presence. The word has come to mean a beautiful, improbable union of parts that shouldn’t work together, yet do.
Chimera is a dual-mode market context tool that blends a multi-input oscillator with classic ADX/DI trend strength, plus optional multi-timeframe “gap-line” tracking. Use it to visualize regime (trend vs. range), momentum swings around an adaptive midline, and higher timeframe (HTF) reference levels that auto-terminate on touch/cross.
Modes
1) Oscillator view
A smoothed composite of five common inputs—RSI, MACD (oscillator), Bollinger position, Stochastic, and an ATR/DI-weighted bias. Each is normalized to a comparable 0–100 style scale, averaged, and plotted as a candle-style oscillator (short vs. long smoothing, wickless for clarity). A dynamic midline with standard-deviation bands frames neutral → bearish/bullish zones. Colors ramp from neutral to your chosen Oversold/Overbought endpoints; consolidation can override to white.
Here is a description of the (5) signals used to calculate the sentiment oscillator:
RSI (14): Measures recent momentum by comparing average gains vs. losses. High = strength after advances; low = weakness after declines. (Z-score normalized to 0–100.)
MACD oscillator (12/26/9): Uses the difference between MACD and its signal (histogram) to gauge momentum shifts. Positive = bullish tilt; negative = bearish. (Z-score normalized.)
Bollinger Bands position (20, 2): Locates price within the bands (0–100 from lower → upper). Near upper suggests strength/expansion; near lower suggests weakness/contraction. (Then normalized.)
Stochastic (14, 3, 3): Shows where the close sits within the recent high-low range, smoothed via %D. Higher values = closes near highs; lower = near lows. (Scaled 0–100.)
ATR/DI composite (14): Volatility-weighted directional bias: (+DI − −DI) amplified by ATR as a % of price and its relative average. Positive = bullish pressure with volatility; negative = bearish. (Rank/scale normalized.)
All five are normalized and averaged into one composite, then smoothed (short/long) and compared to an adaptive midline with bands.
2) ADX view
Shows ADX, +DI, –DI with user-defined High Threshold. Transparency and color shift with regime. When ADX is strong, a directional “fire/ice” gradient fills the area between ADX and the high threshold, biased toward the dominant DI; when ADX is weak, a soft white fade highlights low-trend conditions.
HTF gap-line tracking (optional; both modes)
Detects “gap-like” reference levels after weak-trend consolidation flips into a sudden DI jump.
Anchors a line at the event bar’s open and auto-terminates upon first touch/cross (tick-size tolerance).
Auto-selects up to three higher timeframes suited to your chart resolution and prints non-overlapping lines with labels like 1H / 4H / 1D. Lower-priority duplicates are suppressed to reduce clutter.
Confirmation / repaint notes
Signals and lines finalize on bar close of the relevant timeframe.
HTF elements update only on the HTF bar close. During a forming bar they may appear transiently.
Line removal finalizes after the bar that produced the touch/cross closes.
Visual cues & effects
Oscillator candles: Open/High = long smoothing; Low/Close = short smoothing (no wicks).
Adaptive bands: Midline ± StdDev Multiplier × stdev of the blended series.
Consolidation tint: Optional white backdrop/candles when the consolidation condition is true (balance + low ADX).
Breakout VFX (optional): With strong DI/ADX and Bollinger breaks, renders a subtle “fire” flare above upper-band thrusts or “ice” shelf below lower-band thrusts.
Inputs (high-level)
Visual Style: Oscillator or ADX.
General (Oscillator): Lookback Period, Short/Long Smoothing, Standard Deviation Multiplier.
Color (Oscillator): Oversold/Overbought colors for gradient endpoints.
Plot (Oscillator): Show Candles, Show Slow MA Line, Show Individual Component (RSI/MACD/BB/Stoch/ATR).
Table (Oscillator): Show Information Table & position (compact dashboard of component values + status).
ADX / Gaps / VFX (both modes): ADX High Threshold, Highlight Backgrounds, Show Gap Labels, Visual Overlay Effects, and color choices for current-TF & HTF lines.
HTF selection: Automatic ladder (3 tiers) based on your chart timeframe.
Alerts (built-in)
Buy Signal – Primary: Oscillator exits oversold.
Sell Signal – Primary: Oscillator exits overbought.
Gap Fill Line Created (Any TF)
Gap Fill Line Terminated (Any TF)
ADX Crossed ABOVE/BELOW Low Threshold
ADX Crossed ABOVE/BELOW High Threshold
Consolidation Started
Alerts evaluate on the close of the relevant timeframe.
How to read it (quick guide)
Pick your lens: Oscillator for blended momentum around an adaptive midline; ADX for trend strength and DI skew.
Watch extremes & mean re-entries (Oscillator): Approaches to the top/bottom band show persistent momentum; returns toward the midline show normalization.
Check regime (ADX): Below Low = low-trend; above High = strong trend, with “fire/ice” bias toward +DI/–DI.
Track gap lines: Fresh labels mark new reference levels; lines auto-remove on first interaction. HTF lines add context but finalize only on HTF close.
The uniqueness from this indicator comes from multiple areas:
1. A unique multi-timeframe algorithm detects gap fill zones and plots them on the chart.
2. Visual effects for both visual modes were hand crafted to provide a visually stunning and intuitive interface.
3. The algorithm to determine sentiment uses a unique blend of weight and sensitivity adjustment to create a plot with elastic upper and lower bounds based off historical volatility and price action.

Market Zone Analyzer[BullByte]Understanding the Market Zone Analyzer
---
1. Purpose of the Indicator
The Market Zone Analyzer is a Pine Script™ (version 6) indicator designed to streamline market analysis on TradingView. Rather than scanning multiple separate tools, it unifies four core dimensions—trend strength, momentum, price action, and market activity—into a single, consolidated view. By doing so, it helps traders:
• Save time by avoiding manual cross-referencing of disparate signals.
• Reduce decision-making errors that can arise from juggling multiple indicators.
• Gain a clear, reliable read on whether the market is in a bullish, bearish, or sideways phase, so they can more confidently decide to enter, exit, or hold a position.
---
2. Why a Trader Should Use It
• Unified View: Combines all essential market dimensions into one easy-to-read score and dashboard, eliminating the need to piece together signals manually.
• Adaptability: Automatically adjusts its internal weighting for trend, momentum, and price action based on current volatility. Whether markets are choppy or calm, the indicator remains relevant.
• Ease of Interpretation: Outputs a simple “BULLISH,” “BEARISH,” or “SIDEWAYS” label, supplemented by an intuitive on-chart dashboard and an oscillator plot that visually highlights market direction.
• Reliability Features: Built-in smoothing of the net score and hysteresis logic (requiring consecutive confirmations before flips) minimize false signals during noisy or range-bound phases.
---
3. Why These Specific Indicators?
This script relies on a curated set of well-established technical tools, each chosen for its particular strength in measuring one of the four core dimensions:
1. Trend Strength:
• ADX/DMI (Average Directional Index / Directional Movement Index): Measures how strong a trend is, and whether the +DI line is above the –DI line (bullish) or vice versa (bearish).
• Moving Average Slope (Fast MA vs. Slow MA): Compares a shorter-period SMA to a longer-period SMA; if the fast MA sits above the slow MA, it confirms an uptrend, and vice versa for a downtrend.
• Ichimoku Cloud Differential (Senkou A vs. Senkou B): Provides a forward-looking view of trend direction; Senkou A above Senkou B signals bullishness, and the opposite signals bearishness.
2. Momentum:
• Relative Strength Index (RSI): Identifies overbought (above its dynamically calculated upper bound) or oversold (below its lower bound) conditions; changes in RSI often precede price reversals.
• Stochastic %K: Highlights shifts in short-term momentum by comparing closing price to the recent high/low range; values above its upper band signal bullish momentum, below its lower band signal bearish momentum.
• MACD Histogram: Measures the difference between the MACD line and its signal line; a positive histogram indicates upward momentum, a negative histogram indicates downward momentum.
3. Price Action:
• Highest High / Lowest Low (HH/LL) Range: Over a defined lookback period, this captures breakout or breakdown levels. A closing price near the recent highs (with a positive MA slope) yields a bullish score, and near the lows (with a negative MA slope) yields a bearish score.
• Heikin-Ashi Doji Detection: Uses Heikin-Ashi candles to identify indecision or continuation patterns. A small Heikin-Ashi body (doji) relative to recent volatility is scored as neutral; a larger body in the direction of the MA slope is scored bullish or bearish.
• Candle Range Measurement: Compares each candle’s high-low range against its own dynamic band (average range ± standard deviation). Large candles aligning with the prevailing trend score bullish or bearish accordingly; unusually small candles can indicate exhaustion or consolidation.
4. Market Activity:
• Bollinger Bands Width (BBW): Measures the distance between BB upper and lower bands; wide bands indicate high volatility, narrow bands indicate low volatility.
• Average True Range (ATR): Quantifies average price movement (volatility). A sudden spike in ATR suggests a volatile environment, while a contraction suggests calm.
• Keltner Channels Width (KCW): Similar to BBW but uses ATR around an EMA. Provides a second layer of volatility context, confirming or contrasting BBW readings.
• Volume (with Moving Average): Compares current volume to its moving average ± standard deviation. High volume validates strong moves; low volume signals potential lack of conviction.
By combining these tools, the indicator captures trend direction, momentum strength, price-action nuances, and overall market energy, yielding a more balanced and comprehensive assessment than any single tool alone.
---
4. What Makes This Indicator Stand Out
• Multi-Dimensional Analysis: Rather than relying on a lone oscillator or moving average crossover, it simultaneously evaluates trend, momentum, price action, and activity.
• Dynamic Weighting: The relative importance of trend, momentum, and price action adjusts automatically based on real-time volatility (Market Activity State). For example, in highly volatile conditions, trend and momentum signals carry more weight; in calm markets, price action signals are prioritized.
• Stability Mechanisms:
• Smoothing: The net score is passed through a short moving average, filtering out noise, especially on lower timeframes.
• Hysteresis: Both Market Activity State and the final bullish/bearish/sideways zone require two consecutive confirmations before flipping, reducing whipsaw.
• Visual Interpretation: A fully customizable on-chart dashboard displays each sub-indicator’s value, regime, score, and comment, all color-coded. The oscillator plot changes color to reflect the current market zone (green for bullish, red for bearish, gray for sideways) and shows horizontal threshold lines at +2, 0, and –2.
---
5. Recommended Timeframes
• Short-Term (5 min, 15 min): Day traders and scalpers can benefit from rapid signals, but should enable smoothing (and possibly disable hysteresis) to reduce false whipsaws.
• Medium-Term (1 h, 4 h): Swing traders find a balance between responsiveness and reliability. Less smoothing is required here, and the default parameters (e.g., ADX length = 14, RSI length = 14) perform well.
• Long-Term (Daily, Weekly): Position traders tracking major trends can disable smoothing for immediate raw readings, since higher-timeframe noise is minimal. Adjust lookback lengths (e.g., increase adxLength, rsiLength) if desired for slower signals.
Tip: If you keep smoothing off, stick to timeframes of 1 h or higher to avoid excessive signal “chatter.”
---
6. How Scoring Works
A. Individual Indicator Scores
Each sub-indicator is assigned one of three discrete scores:
• +1 if it indicates a bullish condition (e.g., RSI above its dynamically calculated upper bound).
• 0 if it is neutral (e.g., RSI between upper and lower bounds).
• –1 if it indicates a bearish condition (e.g., RSI below its dynamically calculated lower bound).
Examples of individual score assignments:
• ADX/DMI:
• +1 if ADX ≥ adxThreshold and +DI > –DI (strong bullish trend)
• –1 if ADX ≥ adxThreshold and –DI > +DI (strong bearish trend)
• 0 if ADX < adxThreshold (trend strength below threshold)
• RSI:
• +1 if RSI > RSI_upperBound
• –1 if RSI < RSI_lowerBound
• 0 otherwise
• ATR (as part of Market Activity):
• +1 if ATR > (ATR_MA + stdev(ATR))
• –1 if ATR < (ATR_MA – stdev(ATR))
• 0 otherwise
Each of the four main categories shares this same +1/0/–1 logic across their sub-components.
B. Category Scores
Once each sub-indicator reports +1, 0, or –1, these are summed within their categories as follows:
• Trend Score = (ADX score) + (MA slope score) + (Ichimoku differential score)
• Momentum Score = (RSI score) + (Stochastic %K score) + (MACD histogram score)
• Price Action Score = (Highest-High/Lowest-Low score) + (Heikin-Ashi doji score) + (Candle range score)
• Market Activity Raw Score = (BBW score) + (ATR score) + (KC width score) + (Volume score)
Each category’s summed value can range between –3 and +3 (for Trend, Momentum, and Price Action), and between –4 and +4 for Market Activity raw.
C. Market Activity State and Dynamic Weight Adjustments
Rather than contributing directly to the netScore like the other three categories, Market Activity determines how much weight to assign to Trend, Momentum, and Price Action:
1. Compute Market Activity Raw Score by summing BBW, ATR, KCW, and Volume individual scores (each +1/0/–1).
2. Bucket into High, Medium, or Low Activity:
• High if raw Score ≥ 2 (volatile market).
• Low if raw Score ≤ –2 (calm market).
• Medium otherwise.
3. Apply Hysteresis (if enabled): The state only flips after two consecutive bars register the same high/low/medium label.
4. Set Category Weights:
• High Activity: Trend = 50 %, Momentum = 35 %, Price Action = 15 %.
• Low Activity: Trend = 25 %, Momentum = 20 %, Price Action = 55 %.
• Medium Activity: Use the trader’s base weight inputs (e.g., Trend = 40 %, Momentum = 30 %, Price Action = 30 % by default).
D. Calculating the Net Score
5. Normalize Base Weights (so that the sum of Trend + Momentum + Price Action always equals 100 %).
6. Determine Current Weights based on the Market Activity State (High/Medium/Low).
7. Compute Each Category’s Contribution: Multiply (categoryScore) × (currentWeight).
8. Sum Contributions to get the raw netScore (a floating-point value that can exceed ±3 when scores are strong).
9. Smooth the netScore over two bars (if smoothing is enabled) to reduce noise.
10. Apply Hysteresis to the Final Zone:
• If the smoothed netScore ≥ +2, the bar is classified as “Bullish.”
• If the smoothed netScore ≤ –2, the bar is classified as “Bearish.”
• Otherwise, it is “Sideways.”
• To prevent rapid flips, the script requires two consecutive bars in the new zone before officially changing the displayed zone (if hysteresis is on).
E. Thresholds for Zone Classification
• BULLISH: netScore ≥ +2
• BEARISH: netScore ≤ –2
• SIDEWAYS: –2 < netScore < +2
---
7. Role of Volatility (Market Activity State) in Scoring
Volatility acts as a dynamic switch that shifts which category carries the most influence:
1. High Activity (Volatile):
• Detected when at least two sub-scores out of BBW, ATR, KCW, and Volume equal +1.
• The script sets Trend weight = 50 % and Momentum weight = 35 %. Price Action weight is minimized at 15 %.
• Rationale: In volatile markets, strong trending moves and momentum surges dominate, so those signals are more reliable than nuanced candle patterns.
2. Low Activity (Calm):
• Detected when at least two sub-scores out of BBW, ATR, KCW, and Volume equal –1.
• The script sets Price Action weight = 55 %, Trend = 25 %, and Momentum = 20 %.
• Rationale: In quiet, sideways markets, subtle price-action signals (breakouts, doji patterns, small-range candles) are often the best early indicators of a new move.
3. Medium Activity (Balanced):
• Raw Score between –1 and +1 from the four volatility metrics.
• Uses whatever base weights the trader has specified (e.g., Trend = 40 %, Momentum = 30 %, Price Action = 30 %).
Because volatility can fluctuate rapidly, the script employs hysteresis on Market Activity State: a new High or Low state must occur on two consecutive bars before weights actually shift. This avoids constant back-and-forth weight changes and provides more stability.
---
8. Scoring Example (Hypothetical Scenario)
• Symbol: Bitcoin on a 1-hour chart.
• Market Activity: Raw volatility sub-scores show BBW (+1), ATR (+1), KCW (0), Volume (+1) → Total raw Score = +3 → High Activity.
• Weights Selected: Trend = 50 %, Momentum = 35 %, Price Action = 15 %.
• Trend Signals:
• ADX strong and +DI > –DI → +1
• Fast MA above Slow MA → +1
• Ichimoku Senkou A > Senkou B → +1
→ Trend Score = +3
• Momentum Signals:
• RSI above upper bound → +1
• MACD histogram positive → +1
• Stochastic %K within neutral zone → 0
→ Momentum Score = +2
• Price Action Signals:
• Highest High/Lowest Low check yields 0 (close not near extremes)
• Heikin-Ashi doji reading is neutral → 0
• Candle range slightly above upper bound but trend is strong, so → +1
→ Price Action Score = +1
• Compute Net Score (before smoothing):
• Trend contribution = 3 × 0.50 = 1.50
• Momentum contribution = 2 × 0.35 = 0.70
• Price Action contribution = 1 × 0.15 = 0.15
• Raw netScore = 1.50 + 0.70 + 0.15 = 2.35
• Since 2.35 ≥ +2 and hysteresis is met, the final zone is “Bullish.”
Although the netScore lands at 2.35 (Bullish), smoothing might bring it slightly below 2.00 on the first bar (e.g., 1.90), in which case the script would wait for a second consecutive reading above +2 before officially classifying the zone as Bullish (if hysteresis is enabled).
---
9. Correlation Between Categories
The four categories—Trend Strength, Momentum, Price Action, and Market Activity—often reinforce or offset one another. The script takes advantage of these natural correlations:
• Bullish Alignment: If ADX is strong and pointed upward, fast MA is above slow MA, and Ichimoku is positive, that usually coincides with RSI climbing above its upper bound and the MACD histogram turning positive. In such cases, both Trend and Momentum categories generate +1 or +2. Because the Market Activity State is likely High (given the accompanying volatility), Trend and Momentum weights are at their peak, so the netScore quickly crosses into Bullish territory.
• Sideways/Consolidation: During a low-volatility, sideways phase, ADX may fall below its threshold, MAs may flatten, and RSI might hover in the neutral band. However, subtle price-action signals (like a small breakout candle or a Heikin-Ashi candle with a slight bias) can still produce a +1 in the Price Action category. If Market Activity is Low, Price Action’s weight (55 %) can carry enough influence—even if Trend and Momentum are neutral—to push the netScore out of “Sideways” into a mild bullish or bearish bias.
• Opposing Signals: When Trend is bullish but Momentum turns negative (for example, price continues up but RSI rolls over), the two scores can partially cancel. Market Activity may remain Medium, in which case the netScore lingers near zero (Sideways). The trader can then wait for either a clearer momentum shift or a fresh price-action breakout before committing.
By dynamically recognizing these correlations and adjusting weights, the indicator ensures that:
• When Trend and Momentum align (and volatility supports it), the netScore leaps strongly into Bullish or Bearish.
• When Trend is neutral but Price Action shows an early move in a low-volatility environment, Price Action’s extra weight in the Low Activity State can still produce actionable signals.
---
10. Market Activity State & Its Role (Detailed)
The Market Activity State is not a direct category score—it is an overarching context setter for how heavily to trust Trend, Momentum, or Price Action. Here’s how it is derived and applied:
1. Calculate Four Volatility Sub-Scores:
• BBW: Compare the current band width to its own moving average ± standard deviation. If BBW > (BBW_MA + stdev), assign +1 (high volatility); if BBW < (BBW_MA × 0.5), assign –1 (low volatility); else 0.
• ATR: Compare ATR to its moving average ± standard deviation. A spike above the upper threshold is +1; a contraction below the lower threshold is –1; otherwise 0.
• KCW: Same logic as ATR but around the KCW mean.
• Volume: Compare current volume to its volume MA ± standard deviation. Above the upper threshold is +1; below the lower threshold is –1; else 0.
2. Sum Sub-Scores → Raw Market Activity Score: Range between –4 and +4.
3. Assign Market Activity State:
• High Activity: Raw Score ≥ +2 (at least two volatility metrics are strongly spiking).
• Low Activity: Raw Score ≤ –2 (at least two metrics signal unusually low volatility or thin volume).
• Medium Activity: Raw Score is between –1 and +1 inclusive.
4. Hysteresis for Stability:
• If hysteresis is enabled, a new state only takes hold after two consecutive bars confirm the same High, Medium, or Low label.
• This prevents the Market Activity State from bouncing around when volatility is on the fence.
5. Set Category Weights Based on Activity State:
• High Activity: Trend = 50 %, Momentum = 35 %, Price Action = 15 %.
• Low Activity: Trend = 25 %, Momentum = 20 %, Price Action = 55 %.
• Medium Activity: Use trader’s base weights (e.g., Trend = 40 %, Momentum = 30 %, Price Action = 30 %).
6. Impact on netScore: Because category scores (–3 to +3) multiply by these weights, High Activity amplifies the effect of strong Trend and Momentum scores; Low Activity amplifies the effect of Price Action.
7. Market Context Tooltip: The dashboard includes a tooltip summarizing the current state—e.g., “High activity, trend and momentum prioritized,” “Low activity, price action prioritized,” or “Balanced market, all categories considered.”
---
11. Category Weights: Base vs. Dynamic
Traders begin by specifying base weights for Trend Strength, Momentum, and Price Action that sum to 100 %. These apply only when volatility is in the Medium band. Once volatility shifts:
• High Volatility Overrides:
• Trend jumps from its base (e.g., 40 %) to 50 %.
• Momentum jumps from its base (e.g., 30 %) to 35 %.
• Price Action is reduced to 15 %.
Example: If base weights were Trend = 40 %, Momentum = 30 %, Price Action = 30 %, then in High Activity they become 50/35/15. A Trend score of +3 now contributes 3 × 0.50 = +1.50 to netScore; a Momentum +2 contributes 2 × 0.35 = +0.70. In total, Trend + Momentum can easily push netScore above the +2 threshold on its own.
• Low Volatility Overrides:
• Price Action leaps from its base (30 %) to 55 %.
• Trend falls to 25 %, Momentum falls to 20 %.
Why? When markets are quiet, subtle candle breakouts, doji patterns, and small-range expansions tend to foreshadow the next swing more effectively than raw trend readings. A Price Action score of +3 in this state contributes 3 × 0.55 = +1.65, which can carry the netScore toward +2—even if Trend and Momentum are neutral or only mildly positive.
Because these weight shifts happen only after two consecutive bars confirm a High or Low state (if hysteresis is on), the indicator avoids constantly flipping its emphasis during borderline volatility phases.
---
12. Dominant Category Explained
Within the dashboard, a label such as “Trend Dominant,” “Momentum Dominant,” or “Price Action Dominant” appears when one category’s absolute weighted contribution to netScore is the largest. Concretely:
• Compute each category’s weighted contribution = (raw category score) × (current weight).
• Compare the absolute values of those three contributions.
• The category with the highest absolute value is flagged as Dominant for that bar.
Why It Matters:
• Momentum Dominant: Indicates that the combined force of RSI, Stochastic, and MACD (after weighting) is pushing netScore farther than either Trend or Price Action. In practice, it means that short-term sentiment and speed of change are the primary drivers right now, so traders should watch for continued momentum signals before committing to a trade.
• Trend Dominant: Means ADX, MA slope, and Ichimoku (once weighted) outweigh the other categories. This suggests a strong directional move is in place; trend-following entries or confirming pullbacks are likely to succeed.
• Price Action Dominant: Occurs when breakout/breakdown patterns, Heikin-Ashi candle readings, and range expansions (after weighting) are the most influential. This often happens in calmer markets, where subtle shifts in candle structure can foreshadow bigger moves.
By explicitly calling out which category is carrying the most weight at any moment, the dashboard gives traders immediate insight into why the netScore is tilting toward bullish, bearish, or sideways.
---
13. Oscillator Plot: How to Read It
The “Net Score” oscillator sits below the dashboard and visually displays the smoothed netScore as a line graph. Key features:
1. Value Range: In normal conditions it oscillates roughly between –3 and +3, but extreme confluences can push it outside that range.
2. Horizontal Threshold Lines:
• +2 Line (Bullish threshold)
• 0 Line (Neutral midline)
• –2 Line (Bearish threshold)
3. Zone Coloring:
• Green Background (Bullish Zone): When netScore ≥ +2.
• Red Background (Bearish Zone): When netScore ≤ –2.
• Gray Background (Sideways Zone): When –2 < netScore < +2.
4. Dynamic Line Color:
• The plotted netScore line itself is colored green in a Bullish Zone, red in a Bearish Zone, or gray in a Sideways Zone, creating an immediate visual cue.
Interpretation Tips:
• Crossing Above +2: Signals a strong enough combined trend/momentum/price-action reading to classify as Bullish. Many traders wait for a clear crossing plus a confirmation candle before entering a long position.
• Crossing Below –2: Indicates a strong Bearish signal. Traders may consider short or exit strategies.
• Rising Slope, Even Below +2: If netScore climbs steadily from neutral toward +2, it demonstrates building bullish momentum.
• Divergence: If price makes a higher high but the oscillator fails to reach a new high, it can warn of weakening momentum and a potential reversal.
---
14. Comments and Their Necessity
Every sub-indicator (ADX, MA slope, Ichimoku, RSI, Stochastic, MACD, HH/LL, Heikin-Ashi, Candle Range, BBW, ATR, KCW, Volume) generates a short comment that appears in the detailed dashboard. Examples:
• “Strong bullish trend” or “Strong bearish trend” for ADX/DMI
• “Fast MA above slow MA” or “Fast MA below slow MA” for MA slope
• “RSI above dynamic threshold” or “RSI below dynamic threshold” for RSI
• “MACD histogram positive” or “MACD histogram negative” for MACD Hist
• “Price near highs” or “Price near lows” for HH/LL checks
• “Bullish Heikin Ashi” or “Bearish Heikin Ashi” for HA Doji scoring
• “Large range, trend confirmed” or “Small range, trend contradicted” for Candle Range
Additionally, the top-row comment for each category is:
• Trend: “Highly Bullish,” “Highly Bearish,” or “Neutral Trend.”
• Momentum: “Strong Momentum,” “Weak Momentum,” or “Neutral Momentum.”
• Price Action: “Bullish Action,” “Bearish Action,” or “Neutral Action.”
• Market Activity: “Volatile Market,” “Calm Market,” or “Stable Market.”
Reasons for These Comments:
• Transparency: Shows exactly how each sub-indicator contributed to its category score.
• Education: Helps traders learn why a category is labeled bullish, bearish, or neutral, building intuition over time.
• Customization: If, for example, the RSI comment says “RSI neutral” despite an impending trend shift, a trader might choose to adjust RSI length or thresholds.
In the detailed dashboard, hovering over each comment cell also reveals a tooltip with additional context (e.g., “Fast MA above slow MA” or “Senkou A above Senkou B”), helping traders understand the precise rule behind that +1, 0, or –1 assignment.
---
15. Real-Life Example (Consolidated)
• Instrument & Timeframe: Bitcoin (BTCUSD), 1-hour chart.
• Current Market Activity: BBW and ATR both spike (+1 each), KCW is moderately high (+1), but volume is only neutral (0) → Raw Market Activity Score = +2 → State = High Activity (after two bars, if hysteresis is on).
• Category Weights Applied: Trend = 50 %, Momentum = 35 %, Price Action = 15 %.
• Trend Sub-Scores:
1. ADX = 25 (above threshold 20) with +DI > –DI → +1.
2. Fast MA (20-period) sits above Slow MA (50-period) → +1.
3. Ichimoku: Senkou A > Senkou B → +1.
→ Trend Score = +3.
• Momentum Sub-Scores:
4. RSI = 75 (above its moving average +1 stdev) → +1.
5. MACD histogram = +0.15 → +1.
6. Stochastic %K = 50 (mid-range) → 0.
→ Momentum Score = +2.
• Price Action Sub-Scores:
7. Price is not within 1 % of the 20-period high/low and slope = positive → 0.
8. Heikin-Ashi body is slightly larger than stdev over last 5 bars with haClose > haOpen → +1.
9. Candle range is just above its dynamic upper bound but trend is already captured, so → +1.
→ Price Action Score = +2.
• Calculate netScore (before smoothing):
• Trend contribution = 3 × 0.50 = 1.50
• Momentum contribution = 2 × 0.35 = 0.70
• Price Action contribution = 2 × 0.15 = 0.30
• Raw netScore = 1.50 + 0.70 + 0.30 = 2.50 → Immediately classified as Bullish.
• Oscillator & Dashboard Output:
• The oscillator line crosses above +2 and turns green.
• Dashboard displays:
• Trend Regime “BULLISH,” Trend Score = 3, Comment = “Highly Bullish.”
• Momentum Regime “BULLISH,” Momentum Score = 2, Comment = “Strong Momentum.”
• Price Action Regime “BULLISH,” Price Action Score = 2, Comment = “Bullish Action.”
• Market Activity State “High,” Comment = “Volatile Market.”
• Weights: Trend 50 %, Momentum 35 %, Price Action 15 %.
• Dominant Category: Trend (because 1.50 > 0.70 > 0.30).
• Overall Score: 2.50, posCount = (three +1s in Trend) + (two +1s in Momentum) + (two +1s in Price Action) = 7 bullish signals, negCount = 0.
• Final Zone = “BULLISH.”
• The trader sees that both Trend and Momentum are reinforcing each other under high volatility. They might wait one more candle for confirmation but already have strong evidence to consider a long.
---
• .
---
Disclaimer
This indicator is strictly a technical analysis tool and does not constitute financial advice. All trading involves risk, including potential loss of capital. Past performance is not indicative of future results. Traders should:
• Always backtest the “Market Zone Analyzer ” on their chosen symbols and timeframes before committing real capital.
• Combine this tool with sound risk management, position sizing, and, if possible, fundamental analysis.
• Understand that no indicator is foolproof; always be prepared for unexpected market moves.
Goodluck
-BullByte!
---

[blackcat] L2 Hann Ehanced DMILevel: 2
Background
Among the many indicators, it can be said that DMI is the only "super turning" indicator. This indicator can alone send out risk warning signals when extreme market conditions occur in the stock market, helping us to solve some problems.
If we can operate according to the instructions of DMI, firstly, we can avoid the mistake of buying stocks at the head. Secondly, in the process of falling fear of the market, we can follow the direction signal sent by DMI and catch every time on the way down. Opportunity to rebound to unwind.
If you look at the diagram of the DMI, you will think it is very complicated, because there are four lines in its diagram, and they are intertwined, and it is difficult to distinguish the complex signals in it. But don't worry about its complex structure, we will fully dissect this indicator.
Function
These four lines are: PDI, MDI, ADX and ADXR. The scale of the table is from 0-100, which means from very weak to very strong. The PDI curve and MDI curve on some software are called +DI curve and -DI curve , all have the same meaning.
PDI: Represents the position of multiple parties in the market.
In market movements, the higher the PDI, the stronger the current market. On the contrary, it is a weak market. The A-share market is easy to go to extremes. Therefore, we can see that in the past A-share market, the PDI sometimes fell to near zero, and at this time, it often indicated that a rebound and uptrend was about to start.
MDI: Represents the position of the bears in the market.
In the market movement, the higher the MDI goes, the weaker the current market is, and vice versa, it is a strong market. Before a big bull market comes, we can see the MDI drop to a position close to zero, and at this time, the bears in the market have no power to fight back.
The relationship between PDI and MDI:
In the operation of the market, PDI and MDI are intertwined with each other. If the PDI is above the MDI, the market at this time is a strong market. The MDI is above the PDI, which is a bear market. The closer the distance between the two, the market is in a stalemate of consolidation. On the contrary, the further apart the two lines are, the more obvious the unilateral nature of the market is, whether it is a bull market or a bear market. The so-called unilateral market means that there is no midway adjustment when it rises, and there is no rebound correction when it falls.
ADX: Fast steering pullback.
The difference between ADX and other analysis indicators is that whether it is rising or falling, as long as there is a unilateral market, it runs upwards, not like other indicators, the strong market runs upwards and the weak market runs downwards.
The thread is almost entwined with PDI and MDI in general market movement, which makes no sense at this time. However, once the market breaks out of the market and starts to go to extremes, whether the market is rising or falling, ADX will start to run upwards. At this time, ADX has a clear meaning, because DMI has begun to issue early warning of impending turn!
ADXR: slow pull back.
This line is matched to ADX and is a moving average of ADX values. When ADX goes up, ADXR goes up with it, just slower.
When a round of rapid decline ends, it usually needs to be corrected by a rebound, and ADX will take the lead in turning up. Once it crosses with ADXR, it is regarded as an effective breakthrough.
Numerical division. I set an input threshold for HEDMI, and users can set the optimal threshold to buy and sell according to different TFs.
When PDI crosses the threshold, no matter how strong the bull market is, we must beware of risks from happening at any time.
In order to distinguish more clearly, I slightly modified the formula of the system, and when this happens, the indicator will issue a green warning label, so as to avoid risks in time.
Comprehensive use of four lines:
If the four lines in the steering indicator DMI are intertwined below 50, it usually means that the market is in a state of mild consolidation at this time. The DMI indicator at this time is useless because it does not generate a strong pullback force. Don't worry about an unexpected turnaround in the market. As for the consolidation, it's not a turnaround, it's a breakout.
When PDI and MDI gradually separate, at this time, ADX and ADXR will also rise. At this time, the DIM that is usually messy like twine will be clearly separated. When rising, PDI rises along with ADX and ADXR, while MDI sinks weakly. On the contrary, when the market starts to fall, MDI will rise along with ADX and ADXR, and PDI will sink helplessly. At this time, the DMI will be like a "tiger's mouth", gradually opening its bloody mouth. The bigger the opening, the more lethal the bite.
Here comes a tactic, or technical trend, called double hooves, that is, PDI and MDI split, ADX and ADXR upward to produce golden forks, PDI and MDI are like the double front hooves of a horse, ADX and ADXR The golden fork is like the rear hooves of a steed ready to take off, and this trend of the four lines is like the four legs of a steed that is about to run.
If you think it is too complicated to look at DMI like this, then I can tell you the easiest way to judge, that is, just look at the PDI line. When the PDI line falls below 10, boldly buy the dip, because it is a dip, so you need to calculate the rebound At this time, combined with the golden section theory I often talk about, you can easily find the selling point by making the golden section of the downward trend for the previous trend.
This kind of bottom-hunting method uses the golden section theory, and basically there will be no losses. Remember that one thing is not to be greedy and strictly enforce discipline. This is bottom-hunting, and advancing with both hooves is chasing up. The two styles are different, and the operation styles are different. You also need to explore more in actual combat. Any kind of trick, if you practice it proficiently, it is a unique trick.
Remark
Hanning Window Enhanced DMI
Free and Open Source Indicator

bitradercrossEl indicador bitradercross, es un indicador basado en el Índice Medio de Movimiento Direccional ( ADX ) es una herramienta de análisis técnico usada para medir la fuerza de la tendencia. El indicador direccional positivo ( DI ) y el indicador direccional negativo ( -DI ) acompañan a la línea ADX . realzando la dirección de la tendencia.
Usados en conjunto forman un sistema de trading que es capaz de determinar tanto la dirección como la fuerza de la tendencia. El indicador consiste en tres líneas: la propia ADX (línea azul), una línea DI (línea verde), y una línea -DI (línea roja). El DI mide la fuerza de la tendencia alcista, mientras que el -DI mide la intensidad del movimiento bajista. La línea ADX muestra la fuerza de la tendencia en general creciendo tanto en las tendencias alcistas como bajistas.
Cuando el DI está por encima del -DI , se dice que los alcistas tienen el dominio direccional. De forma alternativa, cuando el -DI es más alto que el DI , el dominio direccional pertenece a los bajistas.
Es importante entender que el ADX (línea azul) muestra solo la fuerza de la tendencia y no la dirección de la tendencia. La dirección de la tendencia puede en cambio determinarse mirando al DI y el -DI (líneas roja y verde).
¿Cómo usarlo en el trading?
Operar con la tendencia reduce los riesgos e incrementa los beneficios potenciales. Es por esto que muchos traders prefieren consultar la fuerza de la tendencia con ayuda del ADX antes de invertir su dinero. Hay dos formas principales de usar el indicador:
El Cruce de DI
Cuando las líneas direccionales del positivo y negativo se cruzan, normalmente significa que la tendencia está cambiando. Esta información puede usarse para determinar puntos de entrada óptimos. Para los inversores que utilicen este sistema de trading, las señales son las siguientes:
(Compra) cuando el DI cruce el -DI , es mas efectivo, mas fuerte cuando toca o cruza la linea amarilla solida en el nivel de 27 y la tendencia general sea alcista.
El disparo se da en la linea de 20 punteada.
(Venta) cuando el -DI cruce el DI , es mas efectivo, más fuerte cuando toca o cruza la linea amarilla solida en el nivel de 27 y la tendencia sea bajista general sea bajista.
Valor de Fuerza Tendencia ADX
0-20 Tendencia Ausente o Débil
21-26 Disparo
27-50 Tendencia Fuerte
50-75 Tendencia muy Fuerte
75-100 Tendencia Extremadamente Fuerte
El bitradercross es un indicador de análisis técnico verdaderamente único, que combinado con otros indicadores, puede convertirse en la estrategia de trading definitiva en manos de un trader.
Recomendado para scalping en temporalidad de 5 min
swing day 1hora. Esta configurado para una operacion optima.
Acompañelo con el indicador bitraderScalper.
Con mucho cariño Bitrader4.0
_________________________________
The bitradercross indicator, is an indicator based on the Mean Directional Movement Index ( ADX ) is a technical analysis tool used to measure the strength of the trend. The positive directional indicator ( DI ) and the negative directional indicator ( -DI ) accompany the ADX line. enhancing the direction of the trend.
Used together they form a trading system that is able to determine both the direction and strength of the trend. The indicator consists of three lines: the ADX itself (blue line), a DI line (green line), and a -DI line (red line). The DI measures the strength of the uptrend, while the -DI measures the intensity of the bearish movement. The ADX line shows the strength of the overall trend growing in both bullish and bearish trends.
When the DI is above the -DI , it is said that the bulls have the directional domain. Alternatively, when the -DI is higher than the DI , the directional domain belongs to the bears.
It is important to understand that the ADX (blue line) shows only the strength of the trend and not the direction of the trend. The direction of the trend can instead be determined by looking at the DI and the -DI (red and green lines).
How to use it in trading?
Operating with the trend reduces the risks and increases the potential benefits. This is why many traders prefer to consult the strength of the trend with the help of the ADX before investing their money. There are two main ways to use the indicator:
1) The Cross of DI
When the directional lines of the positive and negative intersect, it usually means that the trend is changing. This information can be used to determine optimal entry points. For investors who use this trading system, the signals are the following:
(Buy) when the DI crosses the -DI , it is more effective, stronger when it touches or crosses the solid yellow line at the level of 27 and the general trend is bullish .
The shot is given in the line of 20 dashed.
(Sale) when the -DI crosses the DI , it is more effective, stronger when it touches or crosses the solid yellow line at the level of 27 and the general bearish trend is bearish .
Strength Value ADX Trend
0-20 Absent or Weak Trend
21-26 Shot
27-50 Strong Trend
50-75 Very Strong Trend
75-100 Extremely Strong Trend
The bitradercross is a truly unique indicator of technical analysis , which combined with other indicators, can become the definitive trading strategy in the hands of a trader.
Recommended for scalping 5-minute and 1 hour.
It is configured for an optimal operation.
Accompany it with the bitraderScalper indicator.
With love Bitrader4.0

Advanced DMI [NexusSignals]Overview
The Advanced DMI is a enhanced version of the classic Directional Movement Index (DMI) and Average Directional Index (ADX) indicator, designed to provide traders with deeper insights into trend strength, direction, and momentum. It combines visual plots, a customizable data table, and multiple alert conditions to help identify bullish/bearish trends, consolidations, and potential reversals. This indicator is ideal for trend-following strategies, scalping, or swing trading across various timeframes and assets.
Key enhancements include:
A trend strength metric that quantifies bullish/bearish dominance.
A dynamic table displaying real-time and historical DMI/ADX values, with color-coded signals and buy/sell pressure percentages.
Visual fills and arrows for quick trend interpretation.
Built-in alerts for key crossovers, threshold breaches, and consolidation phases.
The indicator calculates and display:
+DI (Plus Directional Indicator): Measures upward price movement strength.
-DI (Minus Directional Indicator): Measures downward price movement strength.
ADX: Gauges overall trend strength (higher values indicate stronger trends).
Trend Strength: A normalized score computed as ((+DI - -DI) / (+DI + -DI)) * ADX, ranging from negative (bearish) to positive (bullish). This helps quantify trend bias.
Buy/Sell %: Candle body analysis showing the percentage of buyer (close above low) vs. seller (high above close) control in the current bar.
Plots include:
Strength Histogram : Color-coded columns (green for bullish, red for bearish) to visualize trend intensity.
ADX Line : White line showing trend strength, with arrows indicating rising/falling.
+DI and -DI Lines: Green (+DI) and red (-DI) lines with conditional fills above the 15 threshold for strong trends.
Horizontal threshold lines at 15 (consolidation threshold) and 25 (strong trend threshold).
The table (optional) summarizes data for the current candle, previous candle, and two candles ago, including arrows for directional changes and color highlights for quick scans.
Inputs
General Settings:
DMI Length (default: 14): Period for +DI/-DI calculation.
ADX Smoothing (default: 14): Smoothing period for ADX.
ADX Consolidation Threshold (default: 15): Below this, suggests sideways market.
ADX Stronger Trend Threshold (default: 25): Above this, indicates a robust trend.
Threshold for Strong Bullish/Bearish DMI Strength (defaults: 10 / -10): Levels for strength alerts.
Table Settings:
Show Table? (default: true): Toggle the data table on/off.
Table Text Color, Header Color, Text Size, Position: Customize appearance and placement (e.g., middle_right).
How It Works
Interpretation
Bullish Signals: +DI > -DI, rising +DI (↑ arrow), Strength > 0 (green histogram), Buy% > Sell%. Look for ADX > 25 for confirmed uptrends.
Bearish Signals: -DI > +DI, rising -DI (↑ arrow), Strength < 0 (red histogram), Sell% > Buy%. ADX rising above thresholds strengthens the downtrend.
Consolidation: Both +DI and -DI < 20, ADX ≤ 15 (blue fill possible). Use this to avoid choppy markets.
Crossovers: +DI crossing above -DI suggests bullish reversal; opposite for bearish.
Fills: Areas above 15 highlight dominant trends (green for bullish, maroon for bearish).
Combine with price action or other indicators like RSI for better accuracy. Works on any timeframe, but test on historical data for your strategy.
Alerts
The indicator includes 12 built-in alert conditions for automation:
Strength crossing above/below 0 or bullish/bearish thresholds.
+DI/-DI crossovers (bullish/bearish).
ADX crossing above strong threshold.
+DI/-DI crossing above 25 or below 15.
Consolidation detection (low ADX with flat DI lines).
Set up alerts in TradingView by selecting the condition from the dropdown.
Usage Tips
Enable the table for quick multi-candle analysis without scrolling the chart.
Customize colors and positions to fit your workspace.
Backtest on your favorite assets (e.g., stocks, forex, crypto) to optimize thresholds.
For faster loading on large datasets, the script is optimized to update the table only on the last bar.
This indicator is provided by NexusSignals for educational and trading purposes. Always use risk management and verify signals. Feedback welcome!

Swing Trade TarayıcıSwing Trade Scanner (v6) User Guide
1. Purpose:
This TradingView indicator (written in Pine Script v6) is designed to help identify swing trading opportunities. It calculates an overall trend strength and direction score by combining multiple technical analyses for up to 20 financial assets (stocks, cryptocurrencies, forex, etc.) that you specify. It presents the results in a customizable table, allowing you to quickly scan the market.
2. Analyses Used and Their Roles:
By default, the indicator uses the following 4 main technical analyses:
EMA Crossover (Default: 9/21): Used to capture short-term trend direction and potential momentum shifts. When the fast EMA (9) crosses above the slow EMA (21), it's considered a bullish signal; when it crosses below, it's a bearish signal. It's often one of the main entry/exit triggers.
RSI (Relative Strength Index - Default: 14): Measures the speed of price movements to identify overbought (OB) and oversold (OS) conditions. Reversals from the OB zone can signal potential downturns, while reversals from the OS zone can signal potential upturns. It also provides insight into the strength of the momentum.
MACD (Moving Average Convergence Divergence - Default: 12, 26, 9): A trend-following momentum indicator. The relationship between the MACD line and the signal line (crossovers) and the state of the histogram (position relative to the zero line) are used to confirm momentum shifts and trend strength.
ADX/DI (Average Directional Index - Default: 14, 14): Measures the strength (ADX) and direction (+DI/-DI lines) of a trend. Its main role is to filter signals from other indicators. A trend is considered to exist if the ADX is above a certain threshold (e.g., 25). +DI above -DI indicates an uptrend, and the reverse indicates a downtrend.
3. Scoring System:
The indicator calculates an individual score for each analysis and then combines these scores using weights you define to create a final Trend Score:
Individual Scores: Each analysis (EMA, RSI, MACD, ADX/DI) generates a decimal score between -1.0 (Strong Negative/Bearish) and +1.0 (Strong Positive/Bullish) based on its own rules. For example, RSI might score +1.0 if oversold, -1.0 if overbought, and 0.0 if neutral. MACD and ADX/DI scores can also take intermediate values reflecting both direction and strength (e.g., ±1.0, ±0.6, ±0.3, 0.0).
Weighting: In the settings, you can assign a weight (between 0.0 and 1.0) to each analysis, determining how much it influences the final score. For instance, you might give EMA crossover a higher weight and use RSI with a lower weight.
Total Score: The individual scores of the active analyses are multiplied by their assigned weights and summed up. This total is then divided by the sum of the weights of the active analyses to obtain a final, normalized Trend Score between -1.0 and +1.0. This score represents the combined view of all analyses.
4. Trend Determination:
The calculated final Trend Score is classified into an overall TREND status based on threshold values you set in the settings:
S.UP (Strong Up): Score > Strong Up Threshold (Default: 0.70)
UP: Up Threshold < Score <= Strong Up Threshold (Default: 0.35 < Score <= 0.70)
NEUTRAL: Down Threshold <= Score <= Up Threshold (Default: -0.35 <= Score <= 0.35)
DOWN: Strong Down Threshold <= Score < Down Threshold (Default: -0.70 <= Score < -0.35)
S.DOWN (Strong Down): Score < Strong Down Threshold (Default: -0.70)
This classification allows you to see at a glance which assets have strong trend potential.
5. Table Structure and Meanings:
The indicator displays the results in a table with the following columns:
TICKER: The symbol of the analyzed asset (abbreviated).
TREND: The overall trend status determined by the total score (S.UP, UP, NEUTRAL, DOWN, S.DOWN). The background color of this column also reflects this overall trend (Dark Green, Green, Gray, Red, Dark Red).
SCORE: The calculated weighted total score (between -1.00 and +1.00, with two decimal places). The background color of this column also reflects the overall trend.
EMA: Shows the result of only the EMA 9/21 analysis.
▲: EMA(9) > EMA(21) (Green Background)
▼: EMA(9) < EMA(21) (Red Background)
N: Neutral (Gray Background)
-: Analysis disabled or no data (Pale Gray Background)
RSI: Shows the result of only the RSI analysis.
OS: Oversold (RSI < 30) (Green Background)
M+: Mid Positive (30 <= RSI < 45) (Light Green/Lime Background)
N: Neutral (45 <= RSI <= 55) (Gray Background)
M-: Mid Negative (55 < RSI <= 70) (Orange Background)
OB: Overbought (RSI > 70) (Red Background)
-: Analysis disabled or no data (Pale Gray Background)
MACD: Shows the result of only the MACD analysis.
S+: Strong Positive (MACD > Signal AND Histogram > 0) (Green Background)
M+: Mid Positive (MACD > Signal BUT Histogram < 0) (Light Green/Lime Background)
N: Neutral (Other cases) (Gray Background)
M-: Mid Negative (MACD < Signal BUT Histogram > 0) (Orange Background)
S-: Strong Negative (MACD < Signal AND Histogram < 0) (Red Background)
-: Analysis disabled or no data (Pale Gray Background)
ADX/DI: Shows the result of only the ADX/DI analysis.
S+: Strong Uptrend (ADX > 40 AND +DI > -DI) (Green Background)
M+: Mid Uptrend (25 < ADX <= 40 AND +DI > -DI) (Light Green/Lime Background)
W: Weak Trend (ADX <= 25) (Gray Background)
M-: Mid Downtrend (25 < ADX <= 40 AND -DI > +DI) (Orange Background)
S-: Strong Downtrend (ADX > 40 AND -DI > +DI) (Red Background)
-: Analysis disabled or no data (Pale Gray Background)
6. Settings (Inputs):
You can customize the indicator's behavior using the following settings:
General Settings:
Analysis Timeframe: Select the timeframe for the scans (Leave blank to use the chart timeframe).
Auto Adjust Parameters and Weights: If checked, predefined parameters and weights based on the selected timeframe (1h, 4h, 1D, 1W) are used. If unchecked, or if an unsupported timeframe is selected, the manual settings below apply.
Strong/Normal Up/Down Thresholds: Adjust the score thresholds used to determine the TREND column.
Analysis Settings (Separate Group for Each Analysis):
Enable ... Analysis: Check to include the respective analysis in the score.
... Weight (Manual): If auto-adjust is off, set the weight of this analysis in the total score.
... Period/Level (Manual): If auto-adjust is off, adjust the parameters (period, level, etc.) of the respective indicator.
Symbols (1-10):
Checkbox: Check to include the respective symbol in the scan.
Text Box: Enter the symbol of the asset you want to analyze (e.g., "NASDAQ:AAPL", "BINANCE:BTCUSDT").
Table Settings:
Table Position: Choose where the table appears on the chart.
Cell Width: Adjust the width of the table cells.
Text Size: Select the general size of the text in the table (individual analysis columns are usually shown one size smaller).
7. How to Use:
Add the indicator to your TradingView chart.
Enter the indicator settings.
In the Symbols section, enter the symbols of the assets you want to analyze and check the boxes next to them.
In the General Settings section, select your desired Analysis Timeframe.
Decide whether the Auto Adjust Parameters and Weights option should be checked. If not, adjust the manual parameters and weights for each indicator in the Analysis Settings section according to your strategy.
Examine the table:
The TREND and SCORE columns give you a general overview. Focus on strong signals (S.UP, S.DOWN) or states that have just crossed thresholds (UP, DOWN).
The EMA, RSI, MACD, ADX/DI columns allow you to see in detail which analyses influenced the overall score. You can track confirming or conflicting signals here.
Combine these scan results with other rules of your swing trading strategy (support/resistance, patterns, risk management, etc.) to make trading decisions.
8. Important Notes:
This indicator does not constitute financial advice. It is merely a tool that combines technical analysis tools to help you scan the market.
The default parameters and weights in the indicator settings are for general use. For best results, it is strongly recommended that you optimize these settings by backtesting them on historical data according to your own strategy, the assets you trade, and market conditions.
No technical indicator or system generates 100% accurate signals. Always apply risk management principles and do not trade with money you cannot afford to lose.
I hope this guide helps you use the indicator effectively!

Aj's DikFat Adjusted ADXRAj's DikFat Adjusted ADXR
This indicator is designed to plot the Average Directional Index (ADX) and Average Directional Movement Rating (ADXR) on the chart. The ADX and ADXR are both used to measure the strength of a trend in the market. The script allows you to customize several parameters, including the ADX Length and the Moving Average Method used for smoothing the directional movement indicators.
Key Features:
- ADX Length : Defines the number of periods over which the ADX is calculated. This value can be adjusted by the user to suit different trading styles and timeframes.
- Moving Average Method : Choose between several smoothing methods, including Simple Moving Average (SMA), Exponential Moving Average (EMA), Wilder's Moving Average, Weighted Moving Average (WMA), Hull Moving Average (HMA), or a Super Smooth Moving Average.
- Directional Indicators : The script calculates the +DI and -DI, which represent the positive and negative directional indicators respectively. These are then used to calculate the ADX.
- ADXR : The ADXR is calculated as the average of the current ADX value and the ADX value from 14 periods ago, providing a more smoothed representation of the trend strength.
How Traders Use ADX and ADXR:
- ADX : A rising ADX indicates an increasing trend strength, while a falling ADX suggests a weakening trend. A value above 25 is often considered an indication of a strong trend.
- ADXR : This indicator smooths the ADX over time, helping traders identify persistent trends. The ADXR can help filter out noise and provide a clearer picture of the trend's health.
Please note that this script and its indicators are designed to be used as tools for analysis, not as guarantees of market outcomes. Adjustments to the moving average method or ADX length can change the behavior of the indicators based on market conditions.
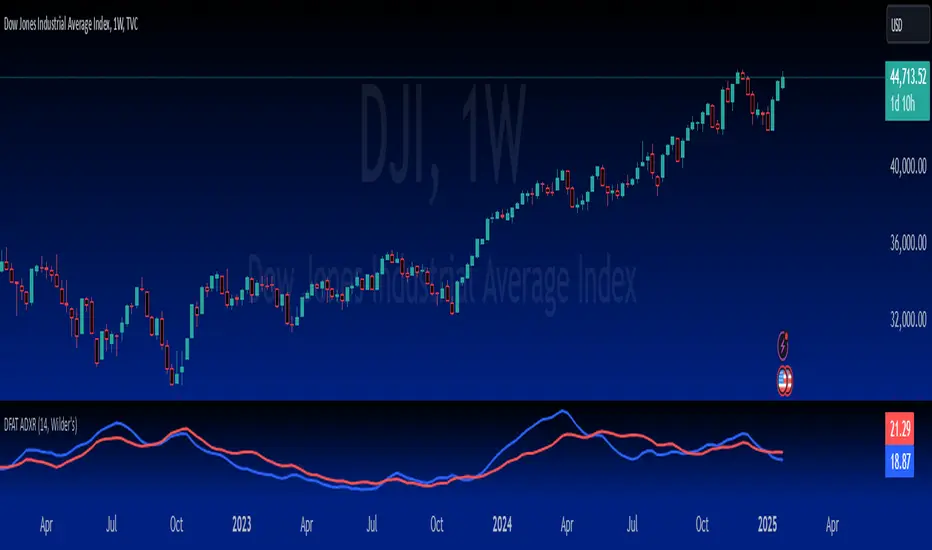
Market Movement IdentifierOverview : Market Movement Identifier (MMI) uses DMI (Directional Movement Index) Indicator's logic and enhance its capabilities and visualisation. It shows 3 type of overlays over chart - black, green and red which signifies current market trend.
What is DMI ? :
The Directional Movement Index (DMI) is a technical analysis indicator used to assess the strength and direction of a trend in the price of an asset. Developed by J. Welles Wilder, the DMI is part of a broader category of indicators known as oscillators. The DMI comprises three lines: Positive Directional Indicator (+DI), Negative Directional Indicator (-DI), and the Average Directional Index (ADX).
Here's a brief overview of each component:
1. Positive Directional Indicator (+DI): Measures the strength of upward price movement. It is calculated based on the difference between the current high and the previous high.
2. Negative Directional Indicator (-DI): Measures the strength of downward price movement. It is calculated based on the difference between the previous low and the current low.
3. Average Directional Index (ADX): Represents the overall strength of the price movement, regardless of direction. It is a smoothed average of the +DI and -DI values. A rising ADX indicates a strengthening trend, while a falling ADX suggests a weakening trend.
Traders use the DMI to identify potential trends, assess their strength, and determine whether a trend is gaining or losing momentum. The crossover of +DI and -DI can signal potential changes in the trend direction. Additionally, the ADX helps traders gauge the overall strength of the trend. Please note DMI is freely available to use, you must try that before paying for MMI.
What is MMI and how is it different from DMI ? :
Frankly, It is not. If you know how to use DMI and play around with its variables and settings to get the perfect desired result then you are good anyway. But if you want a little bit extra visualisation and accuracy then MMI indicator is for you.
The MMI Indicator which we have built over DMI uses :
1. Unique variables and settings - Instead of using default variable values, we have modified them a bit for aligning it perfectly with our desired result.
2. New variables - We have added few new variables which act as threshold values.Calculations are being done using these variables to find out bool conditions true or false.
3. Background Colours - Using the bool conditions we show 3 different background colours on chart, which helps user in differentiating type of market trend.
How does MMI work? :
Let's break down the key components and logic behind this indicator:
1. DMI (Directional Movement Index) Calculation: The code calculates the DMI using the Wilder's smoothing method. It uses the true range (trur) and calculates the positive directional movement (plusDM) and negative directional movement (minusDM). The smoothed values of these are then used to compute the Plus Directional Indicator (plus) and Minus Directional Indicator (minus).
2. ADX (Average Directional Index) Calculation: The ADX is computed using the smoothed Plus and Minus Directional Indicators. The ADX is a trend strength indicator, and in this script, it is smoothed using the lensig parameter.
3. Setting Thresholds for ADX: tlow and thigh are user-defined thresholds for the ADX. If the ADX is within these thresholds, it proceeds to further conditions. This helps filter out noise and focus on significant trends.
4. Determining Market Movement: Based on the conditions of the Plus and Minus Directional Indicators, the script assigns a color to currentColor. If Plus is greater than Minus, it assigns a green color; otherwise, it assigns a red color. This suggests whether the market movement is bullish or bearish.
Setting Background Color: Finally, the background color of the chart is set to currentColor. This provides a visual representation of the market movement identified by the script.
Comparison with DMI Indicator:
This script can be considered an improvement or modification of the DMI (Directional Movement Index) indicator. It incorporates user-defined thresholds for the ADX and assigns background colors to chart to indicate market direction. The idea is to make it more visually intuitive and customizable for traders. The flexibility of adjusting parameters allows traders to fine-tune the sensitivity of the indicator to different market conditions.
Why it is worth paying for:
As mentioned earlier this indicator is built over freely available DMI indicator. The modifications which we have done with variables and visualization of DMI indicator makes it worth.
The indicator may be considered valuable for traders who appreciate a visual representation of market movements based on ADX. Normal DMI doesn't prvoide that, it displays three lines at bottom of chart like RSI. Neither does it provides alert or a visual that a threshold has been crossed. That's why to help traders see all conditions and trend status on background of chart itself we have created MMI which has
1. The customization options and visual clarity could enhance decision-making for those who prefer a more tailored approach.
2. Traders willing to pay for this indicator may find it useful in complementing their existing analysis and strategy, especially if they prioritize ADX-related insights in their trading decisions.
How to use MMI ?
Refer this snapshot for understand content below -
So the three overlays signifies something. As explained earlier the overlays are displayed checking if adx is > or < a threshold value and checking +di > or < -di. Also the interpretations is just a probability not a confirmation. To be sure, always follow price action.
Black overlay - No trading zone. This means market might be in consolidation range, no strong trend right now or the trend is so strong that it can reverse any time. So it's better not to trade in black zones.
Red overlay - Probable Bearish Trend. This means market might be in good trend and favourable direction might be in bearish or short side.
Green overlay - Probable Bullish Trend. This means market might be in good trend and favourable direction might in bullish or long side.
Preferred Timeframe : - Although as its a mathematical calculation based indicator which works on DMI's logic, the modifications which we have done on it works best in 5 minute timeframe.
Remember these visualisations of colors is based on mathematical calculations, they dont mean full 100% confirmation that market will go in said direction. It's just a probability and traders can use their research and price action to take best decision.
IMPORTANT : This indicator tells you these overlays and results based on mathematical calculations which you can check in DMI indicator logic. As Stock markets are dynamic in nature, no indicator is a magic indicator which will give you 100% accurate results on one click. You still have to use price action for best results.
DISCLAIMER : This indicator isn't a get rich quick scheme, neither it can provide 100% accurate results. It is meant to be used as an aid to Price Action Trading and proper risk management.
