volume cryptosmart v2Visual Components: The 3 Layers of Information
To understand the indicator, you must see it as three layers of information superimposed on a single panel.
Layer 1: The Background Color (The "Tide" or Market Regime)
The background color of the entire panel tells you the general market condition, using an ADX/DMI filter:
Green Background: ADX is above 23 (there is a trend) and DI+ is above DI-. Regime: Bullish Trend.
Red Background: ADX is above 23 (there is a trend) and DI- is above DI+. Regime: Bearish Trend.
Black Background: ADX is below 23. Regime: Range or Consolidation.
Layer 2: The Threshold Lines (The Filters)
There are two key horizontal lines that act as filters:
"Dead Zone" Line (Dotted Blue): This is your noise filter line. It is based on the ATR. Any momentum impulse that is weaker (lower) than this line is considered irrelevant noise.
"Explosion" Line (Brown): This line is based on Bollinger Bands. It measures "normal" volatility. When a histogram impulse breaks above this line, it means the acceleration is statistically large and could be a range breakout.
Layer 3: The Histogram (The "Wave" or Acceleration)
The histogram bars (trendUp and trendDown) do not measure price or volume. They measure the acceleration of momentum (specifically, the difference between today's MACD and yesterday's MACD, multiplied by sensitivity).
The Brain: The Histogram's Color Logic
This is where the true intelligence of your indicator lies. The color of each histogram bar is decided by following a series of 4 strict rules, designed to show only high-quality signals.
Rule 1: GRAY (Dead Zone)
If the impulse (trendUp or trendDown) is weaker than the "Dead Zone" line...
Then it is painted GRAY.
Meaning: The momentum is too weak to be considered. It is noise.
Rule 2: GREEN / RED (Trend Impulse)
If the impulse exceeds the Dead Zone (Gray)...
AND the panel background is Green (bullish trend) or Red (bearish trend)...
Then the histogram is painted GREEN (for trendUp) or RED (for trendDown).
Meaning: It is a valid momentum impulse that is in favor of the main trend. These are trend continuation signals.
Rule 3: BLUE (Range Breakout)
If the impulse exceeds the Dead Zone (Gray)...
AND the panel background is Black (range-bound market)...
BUT the impulse is so strong that it breaks above the "Explosion Line" (Brown)...
Then the histogram is painted BLUE.
Meaning: This is a range breakout signal. The price is exploding from a consolidation.
Rule 4: WHITE ("Chop" or Noise)
If the impulse exceeds the Dead Zone (Gray)...
BUT it does not meet the requirements of Rule 2 (no trend) or Rule 3 (not a breakout)...
Then it is painted WHITE.
Meaning: It is a momentum impulse without a clear trend and without the strength of a breakout. It is usually "noise" or market chop and should be ignored.
The Final Confirmation: The Volume Filter
In addition to the 4 rules above, you have added a final layer of conviction:
If a signal is Green, Red, or Blue (Rules 2 or 3) and occurs with high volume (volume > 20-period MA)...
...it is painted with an intense and transparent color (High Conviction).
If it occurs with low volume...
...it is painted with a light and opaque color (Low Conviction).
How to Use: Signal Summary
Background Color Histogram Color Shade Meaning
Green Green Intense (High Vol) Strong Buy Signal (Bullish impulse with trend and volume)
Red Red Intense (High Vol) Strong Sell Signal (Bearish impulse with trend and volume)
Black Blue Intense (High Vol) Breakout Signal (The range is breaking with force)
Any White or Gray - Ignore. Noise, chop, or "dead zone".
Green/Red Green/Red Light (Low Vol) Trend signal, but with low conviction. Proceed with caution.
Cari dalam skrip untuk "adx"

volume cryptosmart v2Visual Components: The 3 Layers of Information
To understand the indicator, you must see it as three layers of information superimposed on a single panel.
Layer 1: The Background Color (The "Tide" or Market Regime)
The background color of the entire panel tells you the general market condition, using an ADX/DMI filter:
Green Background: ADX is above 23 (there is a trend) and DI+ is above DI-. Regime: Bullish Trend.
Red Background: ADX is above 23 (there is a trend) and DI- is above DI+. Regime: Bearish Trend.
Black Background: ADX is below 23. Regime: Range or Consolidation.
Layer 2: The Threshold Lines (The Filters)
There are two key horizontal lines that act as filters:
"Dead Zone" Line (Dotted Blue): This is your noise filter line. It is based on the ATR. Any momentum impulse that is weaker (lower) than this line is considered irrelevant noise.
"Explosion" Line (Brown): This line is based on Bollinger Bands. It measures "normal" volatility. When a histogram impulse breaks above this line, it means the acceleration is statistically large and could be a range breakout.
Layer 3: The Histogram (The "Wave" or Acceleration)
The histogram bars (trendUp and trendDown) do not measure price or volume. They measure the acceleration of momentum (specifically, the difference between today's MACD and yesterday's MACD, multiplied by sensitivity).
The Brain: The Histogram's Color Logic
This is where the true intelligence of your indicator lies. The color of each histogram bar is decided by following a series of 4 strict rules, designed to show only high-quality signals.
Rule 1: GRAY (Dead Zone)
If the impulse (trendUp or trendDown) is weaker than the "Dead Zone" line...
Then it is painted GRAY.
Meaning: The momentum is too weak to be considered. It is noise.
Rule 2: GREEN / RED (Trend Impulse)
If the impulse exceeds the Dead Zone (Gray)...
AND the panel background is Green (bullish trend) or Red (bearish trend)...
Then the histogram is painted GREEN (for trendUp) or RED (for trendDown).
Meaning: It is a valid momentum impulse that is in favor of the main trend. These are trend continuation signals.
Rule 3: BLUE (Range Breakout)
If the impulse exceeds the Dead Zone (Gray)...
AND the panel background is Black (range-bound market)...
BUT the impulse is so strong that it breaks above the "Explosion Line" (Brown)...
Then the histogram is painted BLUE.
Meaning: This is a range breakout signal. The price is exploding from a consolidation.
Rule 4: WHITE ("Chop" or Noise)
If the impulse exceeds the Dead Zone (Gray)...
BUT it does not meet the requirements of Rule 2 (no trend) or Rule 3 (not a breakout)...
Then it is painted WHITE.
Meaning: It is a momentum impulse without a clear trend and without the strength of a breakout. It is usually "noise" or market chop and should be ignored.
The Final Confirmation: The Volume Filter
In addition to the 4 rules above, you have added a final layer of conviction:
If a signal is Green, Red, or Blue (Rules 2 or 3) and occurs with high volume (volume > 20-period MA)...
...it is painted with an intense and transparent color (High Conviction).
If it occurs with low volume...
...it is painted with a light and opaque color (Low Conviction).
How to Use: Signal Summary
Background Color Histogram Color Shade Meaning
Green Green Intense (High Vol) Strong Buy Signal (Bullish impulse with trend and volume)
Red Red Intense (High Vol) Strong Sell Signal (Bearish impulse with trend and volume)
Black Blue Intense (High Vol) Breakout Signal (The range is breaking with force)
Any White or Gray - Ignore. Noise, chop, or "dead zone".
Green/Red Green/Red Light (Low Vol) Trend signal, but with low conviction. Proceed with caution.

Indicator Overview主力籌碼預判買賣力道 (JUMBO)Pro+ 2.0主力預判買賣力道 Pro+ 是一個先進的多維度交易分析系統,專為台灣股市投資者設計。本指標整合了趨勢、成交量、動量、價格位置和波動率五大維度,通過加權評分系統生成綜合的「Power指標」,精準預判主力資金動向。
🔧 核心技術架構
1. 多維度評分系統
趨勢維度 (30%):雙EMA系統 + MACD + ADX趨勢強度
成交量維度 (25%):OBV能量潮 + 成交量比率分析
動量維度 (20%):RSI + MFI資金流量指標
價格位置維度 (20%):VWAP + 布林通道位置分析
波動率維度 (5%):ATR波動率調整
2. 多重確認機制
趨勢確認:EMA金叉/死叉 + 超級趨勢方向
成交量確認:成交量脈衝檢測 + OBV趨勢確認
動量確認:RSI超買超賣 + MFI資金流向
位置確認:布林通道位置 + VWAP相對位置
📊 主要功能特色
訊號系統
主力佈局訊號 🟥
趨勢多頭確認 + Power > 35
成交量放大 + 動量指標多頭
RSI未超買 + 價格突破基準
主力出貨訊號 🟩
趨勢空頭確認 + Power < -35
成交量異常 + 動量指標空頭
RSI未超賣 + 價格跌破基準
Power交叉訊號 🟠🔵
黃金交叉:Power線向上穿越Power MA線
死亡交叉:Power線向下穿越Power MA線
視覺化系統
台灣股市顏色標準:紅色上漲/多頭,綠色下跌/空頭
多層級K線著色:強力訊號→普通訊號→偏多偏空→盤整
智能資訊面板:實時顯示8大關鍵指標狀態
⚙️ 參數設定說明
主要參數
EMA週期:13/55(短期/長期)
Power閾值:35(靈敏度調整)
成交量濾波:1.2倍(異常成交量檢測)
超級趨勢:10週期/3倍數(趨勢過濾)
進階參數
布林通道:20週期/2倍標準差
波動率設定:14週期ATR
動量指標:14週期RSI/MFI
🎯 交易應用策略
進場時機
強力買入:🔥標記 + Power黃金交叉
常規買入:紅色向上箭頭 + Power > 35
確認買入:多重條件同時滿足
出場時機
強力賣出:💧標記 + Power死亡交叉
常規賣出:綠色向下箭頭 + Power < -35
風險控制:趨勢反轉 + 動量減弱
風險管理
止損設定:ATR波動率參考
倉位控制:Power數值強度分級
訊號過濾:ADX趨勢強度確認
📈 指標優勢
高準確率:多重條件過濾,減少假訊號
及時性:領先指標預判主力動向
完整性:涵蓋技術分析主要維度
用戶友好:直觀的視覺化設計
自定義:參數可調適應不同交易風格
🎯 Indicator Overview
Main Force Prediction Buying/Selling Strength Pro+ is an advanced multi-dimensional trading analysis system specifically designed for Taiwan stock market investors. This indicator integrates five key dimensions: trend, volume, momentum, price position, and volatility, generating a comprehensive "Power Indicator" through a weighted scoring system to accurately predict institutional fund movements.
🔧 Core Technical Architecture
1. Multi-Dimensional Scoring System
Trend Dimension (30%): Dual EMA system + MACD + ADX trend strength
Volume Dimension (25%): OBV accumulation + Volume ratio analysis
Momentum Dimension (20%): RSI + MFI money flow index
Price Position Dimension (20%): VWAP + Bollinger Bands position analysis
Volatility Dimension (5%): ATR volatility adjustment
2. Multi-Confirmation Mechanism
Trend Confirmation: EMA golden/death cross + SuperTrend direction
Volume Confirmation: Volume spike detection + OBV trend confirmation
Momentum Confirmation: RSI overbought/oversold + MFI money flow
Position Confirmation: Bollinger Bands position + VWAP relative position
📊 Key Features
Signal System
Institutional Accumulation Signals 🟥
Bullish trend confirmation + Power > 35
Volume expansion + Momentum indicators bullish
RSI not overbought + Price breakthrough baseline
Institutional Distribution Signals 🟩
Bearish trend confirmation + Power < -35
Abnormal volume + Momentum indicators bearish
RSI not oversold + Price breakdown below baseline
Power Cross Signals 🟠🔵
Golden Cross: Power line crosses above Power MA line
Death Cross: Power line crosses below Power MA line
Visualization System
Taiwan Market Color Standard: Red for uptrend/bullish, Green for downtrend/bearish
Multi-level Candlestick Coloring: Strong signals → Regular signals → Bias signals → Consolidation
Smart Info Panel: Real-time display of 8 key indicator statuses
⚙️ Parameter Settings
Main Parameters
EMA Periods: 13/55 (Short-term/Long-term)
Power Threshold: 35 (Sensitivity adjustment)
Volume Filter: 1.2x (Abnormal volume detection)
SuperTrend: 10 period/3 multiplier (Trend filtering)
Advanced Parameters
Bollinger Bands: 20 period/2 standard deviations
Volatility Settings: 14 period ATR
Momentum Indicators: 14 period RSI/MFI
🎯 Trading Application Strategies
Entry Timing
Strong Buy: 🔥 Mark + Power Golden Cross
Regular Buy: Red upward arrow + Power > 35
Confirmed Buy: Multiple conditions simultaneously met
Exit Timing
Strong Sell: 💧 Mark + Power Death Cross
Regular Sell: Green downward arrow + Power < -35
Risk Control: Trend reversal + Momentum weakening
Risk Management
Stop Loss Setting: ATR volatility reference
Position Sizing: Power value strength grading
Signal Filtering: ADX trend strength confirmation
📈 Indicator Advantages
High Accuracy: Multiple condition filtering reduces false signals
Timeliness: Leading indicators predict institutional movements
Completeness: Covers main dimensions of technical analysis
User-Friendly: Intuitive visualization design
Customizable: Adjustable parameters adapt to different trading styles
🔍 Professional Usage Tips
Trend Confirmation: Use in conjunction with major trend direction
Volume Validation: Ensure volume confirms price movements
Risk Management: Always use appropriate position sizing
Timeframe Analysis: Apply across multiple timeframes for confirmation
Market Context: Consider overall market conditions and sector rotation
版本: Pro+ 2.0
適用市場: 台股、亞股、全球股市
最佳時間框架: 日線、4小時線、1小時線
開發者: JUMBO Trading System
更新日期: 2025版本

KD-NewAutoTrade for Future Trading - Heikin Ashi candles The KD-NewAutoTrade strategy is a dynamic trend-following indicator designed for scalping and swing trading across crypto, forex, and index futures. It combines the precision of EMA crossovers, RSI momentum, and ADX trend strength to deliver clear Buy/Sell signals with high reliability.
🔹 Core Logic
EMA Fast & Slow Crossover – Identifies short-term and long-term trend shifts.
RSI Confirmation – Filters out false signals by requiring RSI to cross custom Buy/Sell thresholds.
ADX Filter – Ensures trades only trigger when market trend strength exceeds your chosen ADX minimum.
🔹 Key Features
Visual Buy/Sell triangles directly on the chart.
Customizable inputs for EMA, RSI, and ADX lengths.
Works efficiently on all timeframes and all markets (Crypto, Indices, Stocks, Commodities).
Optional background highlights for active trade zones.
Alert conditions for both BUY and SELL setups – ready to use in automated strategies or alert bots.
🔹 Recommended Usage
Use Heikin Ashi candles
Works best on 1M - 5M timeframes.
Combine with volume or higher-timeframe trend confirmation for stronger signals.

Bifurcation Point Adaptive (Auto Oscillator ML)Bifurcation Point Adaptive - Auto Oscillator ML
Overview
Bifurcation Point Adaptive (🧬 BPA-ML) represents a paradigm shift in divergence-based trading systems. Rather than relying on static oscillator settings that quickly become obsolete as market dynamics shift, BPA-ML employs multi-armed bandit machine learning algorithms to continuously discover and adapt to the optimal oscillator configuration for your specific instrument and timeframe. This self-learning core is enhanced by a Cognitive Analytical Engine (CAE) that provides market-state intelligence, filtering out low-probability setups before they reach your chart.
The result is a system that doesn't just detect divergences - it understands context, learns from outcomes, and evolves with the market.
What Sets This Apart: Technical Comparison
The TradingView community has many excellent divergence indicators and several claiming "machine learning" capabilities. However, a detailed technical analysis reveals that BPA-ML operates at a fundamentally different level of sophistication.
Machine Learning: Real vs Marketing
Most indicators labeled "ML" or "AI" on TradingView use one of three approaches:
K-Nearest Neighbors (KNN): These indicators find similar historical patterns and assume current price will behave similarly. This is pattern matching, not learning. The system doesn't improve over time or adapt based on outcomes - it simply searches historical data for matches.
Clustering (K-Means): These indicators group volatility or market states into categories (high/medium/low). This is statistical classification, not machine learning. The clusters are recalculated but don't learn which classifications produce better results.
Gaussian Process Regression (GPR): These indicators use kernel weighting to create responsive moving averages. This is advanced curve fitting, not learning. The system doesn't evaluate outcomes or adjust strategy.
BPA-ML's Approach: True Reinforcement Learning
BPA-ML implements multi-armed bandit algorithms - a proven reinforcement learning technique used in clinical trials, A/B testing, and recommendation systems. This is fundamentally different:
Exploration vs Exploitation: The system actively balances trying new configurations (exploration) against using proven winners (exploitation). KNN and clustering don't do this - they simply process current data against historical patterns.
Reward-Based Learning: Every configuration is scored based on actual forward returns, normalized by volatility and clipped to prevent outlier dominance. The system receives a bonus when signals prove profitable. This creates a feedback loop where the indicator literally learns what works for your specific instrument and timeframe.
Four Proven Algorithms: UCB1 (Upper Confidence Bound), Thompson Sampling (Bayesian), Epsilon-Greedy, and Gradient-based learning. Each has different exploration characteristics backed by peer-reviewed research. You're not getting marketing buzzwords - you're getting battle-tested algorithms from academic computer science.
Continuous Adaptation: The learning never stops. As market microstructure evolves, the bandit discovers new optimal configurations. Other "adaptive" indicators recalculate but don't improve - they use the same logic on new data. BPA-ML fundamentally changes which logic it uses based on what's working.
The Configuration Grid: 40 Arms vs Fixed Settings
Traditional divergence indicators use a single oscillator with fixed parameters - typically RSI with length 14. More advanced systems might let you choose between RSI, Stochastic, or CCI, but you're still picking one manually.
BPA-ML maintains a grid of 40 candidate configurations:
- 5 oscillator families (RSI, Stochastic, CCI, MFI, Williams %R)
- 4 length parameters (short, medium, medium-long, long)
- 2 smoothing settings (fast, slow)
The bandit evaluates all 40 continuously and automatically selects the optimal one. When market microstructure changes - say, from trending crypto to ranging forex - the system discovers this and switches configurations without your intervention.
Why This Matters: Markets exhibit different characteristics. Bitcoin on 5-minute charts might favor fast Stochastic (high sensitivity to quick moves), while EUR/USD on 4-hour charts might favor smoothed RSI (filtering noise in steady trends). Manual optimization is guesswork. The bandit discovers these nuances mathematically.
Cognitive Analytical Engine: Beyond Simple Filters
Many divergence indicators include basic filters - perhaps checking if RSI is overbought/oversold or if volume increased. These are single-metric gates that treat all market states the same.
BPA-ML's CAE synthesizes five intelligence layers into a comprehensive market-state assessment:
Trend Conviction Score (TCS): Combines ADX normalization, multi-timeframe EMA alignment, and structural persistence. This isn't just "is ADX above 25?" - it's a weighted composite that captures trending vs ranging regimes with nuance. The threshold itself is adaptive via mini-bandit if enabled.
Directional Momentum Alignment (DMA): ATR-normalized EMA spread creates a regime-aware momentum indicator. The same price move reads differently in high vs low volatility environments. Most indicators ignore this context.
Exhaustion Modeling: Aggregates volume spikes, pin bar formations, extended runs without pullback, and extreme oscillator readings into a unified probability of climax. This multi-factor approach catches exhaustion signals that single metrics miss. High exhaustion can override trend filters - allowing reversal trades at genuine turning points that basic filters would block.
Adversarial Validation: Before approving a bullish signal, the engine quantifies both the bull case AND the bear case. If the opposing case dominates by a threshold, the signal is blocked. This is game-theory applied to trading - most indicators don't check if you're fighting obvious strength in the opposite direction.
Confidence Scoring: Every signal receives a 0-1 quality score blending all CAE components plus divergence strength. You can size positions by confidence - a concept absent in most divergence indicators that treat all signals identically.
Adaptive Parameters: Mini-Bandits
Even the filtering thresholds themselves learn. Most indicators have you set pivot lookback periods, minimum divergence strength, and trend filter strictness manually. These are instrument-specific - what works for one asset fails on another.
BPA-ML's mini-bandits optimize:
- Pivot lookback strictness (balance between catching small structures vs requiring major swings)
- Minimum slope change threshold (filter weak divergences vs allow early entries)
- TCS threshold for trend filtering (how strict counter-trend blocking should be)
These learn the same way the oscillator bandit does - via reward scoring and outcome evaluation. The entire system personalizes to your trading context.
Visual Intelligence: Five Presentation Modes
Most indicators offer basic customization - perhaps choosing colors or line thickness. BPA-ML includes five distinct visual modes, each designed for specific use cases:
Quantum Mode: Renders signals as probability clouds where opacity encodes confidence. High-confidence signals are bold and opaque; low-confidence signals are faint and translucent. This visually guides position sizing in a way that static markers cannot. No other divergence indicator I've found uses confidence-based visual encoding.
Holographic Mode: Multi-layer gradient bands create depth perception showing signal quality zones. Excellent for teaching and presentations.
Cyberpunk Mode: Neon centerlines with particle glow trails. High-contrast for immersive dark-theme trading.
Standard Mode: Professional dashed lines and zones. Clean, presentation-ready.
Minimal Mode: Maximum performance for backtesting and low-powered devices.
The visual system isn't cosmetic - it's part of the decision support infrastructure.
Dashboard: Real-Time Intelligence
Many indicators include dashboards showing current indicator values or basic statistics. BPA-ML's dashboard is a comprehensive control center:
Oscillator Section: Shows which configuration is currently selected, why it's selected (pull statistics, reward scores), and learning progression (warmup, learning, active).
CAE Section: Real-time TCS, DMA, Exhaustion, Adversarial cases, and Confidence scores with visual indicators (emoji-coded states, bar graphs, trend arrows).
Bandit Performance: Algorithm selection, mode (Switch vs Blend), arm distribution, differentiation metrics, learning diagnostics.
State Metrics Grid (Large mode): Normalized readings for trend alignment, momentum, volatility, volume flow, Bollinger position, ROC, directional movement, oscillator bias - all synthesized into a composite market state.
This level of transparency is rare. Most "black box" indicators hide their decision logic. BPA-ML shows you exactly why it's making decisions in real-time, enabling informed discretionary overrides.
Repainting: Complete Transparency
Many divergence indicators don't clearly disclose repainting behavior. BPA-ML offers three explicit timing modes:
Realtime: Shows developing signals on current bar. Repaints by design - this is a preview mode for learning, not for trading.
Confirmed: Signals lock at bar close. Zero repainting. Recommended for live trading.
Pivot Validated: Waits for full pivot confirmation (5+ bar delay). Highest purity, zero repainting, ideal for backtesting divergence quality.
You choose the mode based on your priority - speed vs certainty. The transparency empowers rather than obscures.
Educational Value: Learning Platform
Most indicators are tools - you use them, but you don't learn from them. BPA-ML is designed as a learning platform:
Advisory Mode: Signals always appear, but blocked signals receive warning annotations explaining why CAE would have filtered them. You see the decision logic in action without missing learning opportunities.
Dashboard Transparency: Real-time display of all metrics shows exactly how market state influences decisions.
Comprehensive Documentation: In-indicator tooltips, extensive publishing statement, and user guides explain not just what to click, but why the algorithms work and how to apply them strategically.
Algorithm Comparisons: By trying different bandit algorithms (UCB1 vs Thompson vs Epsilon vs Gradient), you learn the differences between exploration strategies - knowledge applicable beyond trading.
This isn't just a signal generator - it's an educational tool that teaches machine learning concepts, market intelligence interpretation, and systematic decision-making.
What This System Is NOT
To be completely transparent about positioning:
Not a Prediction System: BPA-ML doesn't predict future prices. It identifies structural divergences, assesses current market state, and learns which oscillator configurations historically correlated with better forward returns. The learning is retrospective optimization, not fortune telling.
Not Fully Automated: This is a decision support tool, not a push-button profit machine. You still need to execute trades, manage risk, and apply discretionary judgment. The confidence scores guide position sizing, but you determine final risk allocation.
Not Beginner-Friendly: The sophistication comes with complexity. This system requires understanding of divergence trading, basic machine learning concepts, and market state interpretation. It's designed for intermediate to advanced traders willing to invest time in learning the system.
Not Magic: Even with optimal configurations and intelligent filtering, markets are probabilistic. Losing trades are inevitable. The system improves your probability distribution - it doesn't eliminate risk or guarantee profits.
The Fundamental Difference
Here's the core distinction:
Traditional Divergence Indicators: Detect patterns and hope they work.
"ML" Indicators (KNN/Clustering): Detect patterns and compare to historical similarities.
BPA-ML: Detects patterns, evaluates outcomes, learns which detection methods work best for this specific context, understands market state before suggesting trades, and continuously improves without manual intervention.
The difference isn't incremental - it's architectural. This is trading system infrastructure with embedded intelligence, not just a pattern detector with filters.
Who This Is For
BPA-ML is ideal for traders who:
- Value systematic approaches over discretionary guessing
- Appreciate transparency in decision logic
- Are willing to let systems learn over 200+ bars before judging performance
- Trade liquid instruments on 5-minute to daily timeframes
- Want to learn machine learning concepts through practical application
- Seek professional-grade tools without institutional price tags
It's not ideal for:
- Absolute beginners needing simple plug-and-play systems
- 1-minute scalpers (noise dominates at very low timeframes)
- Traders of illiquid instruments (insufficient data for learning)
- Those seeking magic solutions without understanding methodology
- Impatient optimizers wanting instant perfection
What Makes This Original
The innovation in BPA-ML lies in three interconnected breakthroughs that work synergistically:
1. Multi-Armed Bandit Oscillator Selection
Traditional divergence indicators require manual optimization - you choose RSI with a length of 14, or Stochastic with specific settings, and hope they work. BPA-ML eliminates this guesswork through machine learning. The system maintains a grid of 40 candidate oscillator configurations spanning five oscillator families (RSI, Stochastic, CCI, MFI, Williams %R), four length parameters, and two smoothing settings. Using proven bandit algorithms (UCB1, Thompson Sampling, Epsilon-Greedy, or Gradient-based learning), the system continuously evaluates which configuration produces the best forward returns and automatically switches to the winning arm. This isn't random testing - it's intelligent exploration with exploitation, balancing the discovery of new opportunities against leveraging proven configurations.
2. Cognitive Analytical Engine (CAE)
Divergences occur constantly, but most fail. The CAE solves this by computing a comprehensive market intelligence layer:
Trend Conviction Score (TCS): Synthesizes ADX normalization, multi-timeframe EMA alignment, and structural persistence into a single 0-1 metric that quantifies how strongly the market is trending. When TCS exceeds your threshold, the system knows to avoid counter-trend trades unless other factors override.
Directional Momentum Alignment (DMA): Measures the spread between fast and slow EMAs, normalized by ATR. This creates a regime-aware momentum indicator that adjusts its interpretation based on current volatility.
Exhaustion Modeling: Aggregates volume spikes, pin bar formations, extended runs above/below EMAs, and extreme RSI readings into a probability that the current move is reaching climax. High exhaustion can override trend filters, allowing reversal trades at genuine turning points.
Adversarial Validation: Before approving a bullish signal, the engine quantifies both the bull case (proximity to support EMAs, oversold conditions, volume confirmation) and the bear case (distance to resistance, overbought conditions). If the opposing case dominates by your threshold, the signal is blocked or flagged with a warning.
Confidence Scoring: Every signal receives a 0-1 confidence score blending TCS, momentum magnitude, pullback quality, market state metrics, divergence strength, and adversarial advantage. You can gate signals on minimum confidence, ensuring only high-probability setups reach your attention.
3. Adaptive Parameter Mini-Bandits
Beyond the oscillator itself, BPA-ML uses additional bandit systems to optimize:
- Pivot lookback strictness
- Minimum slope change threshold
- TCS threshold for trend filtering
These parameters are often instrument-specific. The adaptive bandits learn these nuances automatically.
Why These Components Work Together
Each layer serves a specific purpose in the signal generation hierarchy:
Layer 1 - Oscillator Selection: The bandit ensures you're always using the oscillator configuration best suited to current market microstructure.
Layer 2 - Divergence Detection: With the optimal oscillator selected, the engine scans for structural divergences using confirmed pivots.
Layer 3 - CAE Filtering: Raw divergences are validated against market intelligence.
Layer 4 - Spacing & Timing: Quality signals need proper spacing to avoid over-trading.
This isn't a random collection of indicators. It's a decision pipeline where each stage refines signal quality, and the machine learning ensures the entire system stays calibrated to your specific trading context.
Core Components - Deep Dive
Divergence Engine
The foundation is a dual-mode divergence detector:
Regular Divergence: Price makes a higher high while oscillator makes a lower high (bearish), or price makes a lower low while oscillator makes a higher low (bullish). These signal potential reversals.
Hidden Divergence: Price makes a lower high while oscillator makes a higher high (bullish continuation), or price makes a higher low while oscillator makes a lower low (bearish continuation). These signal trend strength.
Pivots are confirmed using symmetric lookback periods. Divergence strength is quantified via slope separation between price and oscillator.
Signal Timing Modes
Realtime (live preview): Shows potential signals on current bar. Repaints by design. Use for learning only.
Confirmed (1-bar delay): Signals lock at bar close. No repainting. Recommended for live trading.
Pivot Validated: Waits for full pivot confirmation (5+ bar delay). Highest purity, best for backtesting.
Multi-Armed Bandit Algorithms
UCB1: Optimism under uncertainty. Excellent balance for most use cases.
Thompson Sampling: Bayesian approach with smooth exploration. Great for long-term adaptation.
Epsilon-Greedy: Simple exploitation with random exploration. Easy to understand.
Gradient-based: Lightweight weight adjustment based on rewards. Fast and efficient.
Bandit Operating Modes
Switch Mode: Uses top-ranked arm directly. Maximum amplitude, crisp signals.
Blend Mode: Softmax mixture with dominant-arm preservation. Ensemble stability while maintaining amplitude for overbought/oversold crossings.
How to Use This Indicator
Initial Setup
1. Apply BPA-ML to your chart
2. Select visual mode (Minimal/Standard/Holographic/Cyberpunk/Quantum)
3. Choose signal timing - "Confirmed (1-bar delay)" for live trading
4. Set Oscillator Type to "Auto (ML)" and enable it
5. Select bandit algorithm - UCB1 recommended
6. Choose Blend mode with temperature 0.4-0.5
CAE Configuration
Start with "Advisory" mode to learn the system. Signals appear with warnings if CAE would have blocked them.
Switch to "Filtering" mode when comfortable - CAE actively blocks low-quality signals.
Enable the three primary filters:
- Strong Trend Filter
- Adversarial Validation
- Confidence Gating
Parameter Guidance by Trading Style
Scalping (1-5 minute charts):
- Algorithm: Thompson or UCB1
- Mode: Blend (temp 0.3-0.4)
- Horizon: 8-12 bars
- Min Confidence: 0.30-0.40
- TCS Threshold: 0.70-0.80
- Spacing: 8-12 any, 16-24 same-side
Day Trading (15min-1H charts):
- Algorithm: UCB1
- Mode: Blend (temp 0.4-0.6)
- Horizon: 12-24 bars
- Min Confidence: 0.35-0.45
- TCS Threshold: 0.80-0.85
- Spacing: 12-20 any, 20-30 same-side
Swing Trading (4H-Daily charts):
- Algorithm: UCB1 or Thompson
- Mode: Blend (temp 0.6-1.0) or Switch
- Horizon: 20-40 bars
- Min Confidence: 0.40-0.55
- TCS Threshold: 0.85-0.95
- Spacing: 20-40 any, 30-60 same-side
Signal Interpretation
Bullish Signals: Green markers below price. Enter long when detected.
Bearish Signals: Red markers above price. Enter short when detected.
Blocked Signals: Orange X markers show filtered signals (Advisory mode).
Confidence Rings: Single ring at 50%+ confidence, double at 70%+. Use for position sizing.
Dashboard Metrics
Oscillator Section: Shows active type, value, state, and parameters.
Cognitive Engine:
- TCS: 0.80+ indicates strong trend
- DMA: Momentum direction and strength
- Exhaustion: 0.75+ warns of reversal
- Bull/Bear Case: Adversarial scoring
- Differential: Net directional advantage
Bandit Performance: Shows algorithm, mode, selected configuration, and learning diagnostics.
Visual Zones
- Bullish Zone: Blue/cyan tint - favorable for longs
- Bearish Zone: Red/magenta tint - favorable for shorts
- Exhaustion Zone: Yellow warning - reduce sizing
Visual Mode Selection
Minimal: Clean triangles, maximum performance
Standard: Dashed lines with zones, professional presentation
Holographic: Gradient bands, excellent for teaching
Cyberpunk: Neon glow trails, high contrast
Quantum: Probability cloud with confidence-based opacity
Calculation Methodology
Oscillator Computation
For each bandit arm: calculate base oscillator, apply smoothing, normalize to 0-100.
Switch mode: use top arm directly.
Blend mode: softmax mixture blended with dominant arm (70/30) to preserve amplitude.
Divergence Detection
1. Identify price and oscillator pivots using symmetric periods
2. Store recent pivots with bar indices
3. Scan for slope disagreements within lookback range
4. Require minimum slope separation
5. Classify as regular or hidden divergence
6. Compute strength score
CAE Metrics
TCS: 0.35×ADX + 0.35×structural + 0.30×alignment
DMA: (EMA21 - EMA55) / ATR14
Exhaustion: Aggregates volume, divergence, RSI extremes, pins, extended runs
Confidence: 0.30×TCS + 0.25×|DMA| + 0.20×pullback + 0.15×state + 0.10×divergence + adversarial
Bandit Rewards
Every horizon period: compute log return normalized by ATR, clip to ±0.5, bonus if signal was positive. Update arm statistics per algorithm.
Ideal Market Conditions
Best Performance:
- Liquid instruments with clear structure
- Trending markets with consolidations
- 5-minute to daily timeframes
- Consistent volume and participation
Learning Requirements:
- Minimum 200 bars for warmup
- Ideally 500-1000 bars for full confidence
- Performance improves as bandit accumulates data
Challenging Conditions:
- Extremely low liquidity
- Very low timeframes (1-minute or below)
- Extended sideways consolidation
- Fundamentally-driven gap markets
Dashboard Interpretation Guide
TCS:
- 0.00-0.50: Weak trend, reversals viable
- 0.50-0.75: Moderate trend, mixed approach
- 0.75-0.85: Strong trend, favor continuation
- 0.85-1.00: Very strong trend, counter-trend high risk
DMA:
- -2.0 to -1.0: Strong bearish
- -0.5 to 0.5: Neutral
- 1.0 to 2.0: Strong bullish
Exhaustion:
- 0.00-0.50: Fresh move
- 0.50-0.75: Mature, watch for reversals
- 0.75-0.85: High exhaustion
- 0.85-1.00: Critical, reversal imminent
Confidence:
- 0.00-0.30: Low quality
- 0.30-0.50: Moderate quality
- 0.50-0.70: High quality
- 0.70-1.00: Premium quality
Common Questions
Why no signals?
- Blend mode: lower temperature to 0.3-0.5
- Loosen OB/OS to 65/35
- Lower min confidence to 0.35
- Reduce spacing requirements
- Use Confirmed instead of Pivot Validated
Why frequent oscillator switching?
- Normal during warmup (first 200+ bars)
- After warmup: may indicate regime shifting market
- Lower temperature in Blend mode
- Reduce learning rate or epsilon
Blend vs Switch?
Use Switch for backtesting and maximum exploitation.
Use Blend for live trading with temperature 0.3-0.5 for stability.
Recalibration frequency?
Never needed. System continuously adapts via bandit learning and weight decay.
Risk Management Integration
Position Sizing:
- 0.30-0.50 confidence: 0.5-1.0% risk
- 0.50-0.70 confidence: 1.0-1.5% risk
- 0.70+ confidence: 1.5-2.0% risk (maximum)
Stop Placement:
- Reversals: beyond divergence pivot plus 1.0-1.5×ATR
- Continuations: beyond recent swing opposite direction
Targets:
- Primary: 2-3×ATR from entry
- Scale at interim levels
- Trail after 1.5×ATR in profit
Important Disclaimers
BPA-ML is an advanced technical analysis tool for identifying high-probability divergence patterns and assessing market state. It is not a complete trading system. Machine learning components adapt to historical patterns, which does not guarantee future performance. Proper risk management, position sizing, and additional confirmation methods are essential. No indicator eliminates losing trades.
Backtesting results may differ from live performance due to execution factors and dynamic bandit learning. Always validate on demo before committing real capital. CAE filtering reduces but does not eliminate false signals. Market conditions change rapidly. Use appropriate stops and never risk excessive capital on any single trade.
— Dskyz, Trade with insight. Trade with anticipation.

RSI Trendline Pro - Multi Confirmation
Overview
RSI Trendline Pro is an advanced Pine Script indicator that automatically draws trendlines on the RSI (Relative Strength Index) to detect support and resistance breakouts. It generates high-quality trading signals through a multi-confirmation system.
Key Features
Auto Trendlines: Detects pivot points on RSI to create intelligent support and resistance lines
Multi-Confirmation System: Combines Volume, Stochastic RSI, ADX, and Divergence filters to reduce false signals
RSI Divergence Detection: Automatically identifies bullish/bearish divergences between price and RSI
Live Dashboard: Displays RSI value, active trendlines, ADX strength, and last signal info on a visual panel
Smart Breakout Detection: Identifies trendline breaks and generates LONG/SHORT signals
How to Use
Add to TradingView: Paste code into Pine Editor and add to chart
Configure Parameters:
RSI Length: RSI period (default: 14)
Pivot Strength: Trendline sensitivity (lower = more lines)
Filters: Enable/disable Volume, Divergence, Stoch RSI, and ADX confirmations
Follow Signals:
LONG (Green): When RSI breaks resistance upward
SHORT (Red): When RSI breaks support downward
Divergence: "D" markers indicate potential trend reversals
Alert Setup
Script offers 4 alert types:
LONG Breakout: Resistance break
SHORT Breakout: Support break
Bullish/Bearish Divergence: Divergence detection
Any Signal: Combined alert for all signals
Best Practices
Prioritize high-volume breakouts (Volume Filter enabled)
Trends are stronger when ADX > 25
Confirm divergence signals with price action
Trade when 2-3 confirmations align

QUANTUM MOMENTUMOverview
Quantum Momentum is a sophisticated technical analysis tool designed to help traders identify relative strength between assets through advanced momentum comparison. This cyberpunk-themed indicator visualizes momentum dynamics between your current trading symbol and any comparison asset of your choice, making it ideal for pairs trading, crypto correlation analysis, and multi-asset portfolio management.
Key Features
📊 Multi-Asset Momentum Comparison
Dual Symbol Analysis: Compare momentum between your chart symbol and any other tradable asset
Real-Time Tracking: Monitor relative momentum strength as market conditions evolve
Difference Visualization: Clear histogram display showing which asset has stronger momentum
🎯 Multiple Momentum Calculation Methods
Choose from four different momentum calculation types:
ROC (Rate of Change): Traditional percentage-based momentum measurement
RSI (Relative Strength Index): Oscillator-based momentum from 0-100 range
Percent Change: Simple percentage change over the lookback period
Raw Change: Absolute price change in native currency units
📈 Advanced Trend Filtering System
Enable optional trend filters to align momentum signals with prevailing market direction:
SMA (Simple Moving Average): Classic trend identification
EMA (Exponential Moving Average): Responsive trend detection
Price Action: Identifies trends through higher highs/lows or lower highs/lows patterns
ADX (Average Directional Index): Measures trend strength with customizable threshold
🎨 Futuristic Cyberpunk Design
Neon Color Scheme: Eye-catching cyan, magenta, and matrix green color palette
Glowing Visual Effects: Enhanced visibility with luminescent plot lines
Dynamic Background Shading: Subtle trend state visualization
Real-Time Data Table: Sleek information panel displaying current momentum values and trend status
How It Works
The indicator calculates momentum for both your current chart symbol and a comparison symbol (default: BTC/USDT) using your selected method and lookback period. The difference between these momentum values reveals which asset is exhibiting stronger momentum at any given time.
Positive Difference (Green): Your chart symbol has stronger momentum than the comparison asset
Negative Difference (Pink/Red): The comparison asset has stronger momentum than your chart symbol
When the trend filter is enabled, the indicator will only display signals that align with the detected market trend, helping filter out counter-trend noise.
Settings Guide
Symbol Settings
Compare Symbol: Choose any tradable asset to compare against (e.g., major indices, cryptocurrencies, forex pairs)
Momentum Settings
Momentum Length: Lookback period for momentum calculations (default: 14 bars)
Momentum Type: Select your preferred momentum calculation method
Display Options
Toggle visibility of current symbol momentum line
Toggle visibility of comparison symbol momentum line
Toggle visibility of momentum difference histogram
Optional zero line reference
Trend Filter Settings
Use Trend Filter: Enable/disable trend-based signal filtering
Trend Method: Choose from SMA, EMA, Price Action, or ADX
Trend Length: Period for trend calculations (default: 50)
ADX Threshold: Minimum ADX value to confirm trend strength (default: 25)
Best Use Cases
✅ Pairs Trading: Identify divergences in momentum between correlated assets
✅ Crypto Market Analysis: Compare altcoin momentum against Bitcoin or Ethereum
✅ Stock Market Rotation: Track sector or index relative strength
✅ Forex Strength Analysis: Monitor currency pair momentum relationships
✅ Multi-Timeframe Confirmation: Use alongside other indicators for confluence
✅ Mean Reversion Strategies: Spot extreme momentum divergences for potential reversals
Visual Indicators
⚡ Cyan Line: Your chart symbol's momentum
⚡ Magenta Line: Comparison symbol's momentum
📊 Green/Pink Histogram: Momentum difference (positive = green, negative = pink)
▲ Green Triangle: Bullish trend detected (when filter enabled)
▼ Red Triangle: Bearish trend detected (when filter enabled)
◈ Yellow Diamond: Neutral/sideways trend (when filter enabled)
Pro Tips
💡 Look for crossovers between the momentum lines as potential trade signals
💡 Combine with volume analysis for stronger confirmation
💡 Use momentum divergence (price making new highs/lows while momentum doesn't) for reversal signals
💡 Enable trend filter during ranging markets to reduce false signals
💡 Experiment with different momentum types to find what works best for your trading style
Technical Requirements
TradingView Pine Script Version: v6
Chart Type: Works on all chart types
Indicator Placement: Separate pane (overlay=false)
Data Requirements: Needs access to comparison symbol data

ICT Turtle SoupICT Turtle Soup identifies classic “failed breakout” reversals after liquidity sweeps of recent highs/lows, then augments the setup with volume validation, market structure context, Kill Zone (session) filters, Order Blocks (OB), Fair Value Gaps (FVG), OTE (61.8–78.6%) zones, and optional risk targets (SL/TP 1:1, 1:2, 1:3). A compact dashboard summarizes current context (recent high/low, lookbacks, active session, structure state, mitigation counts).
What the Script Does
⦁ Detects Turtle Soup events: Price breaks a prior swing extreme and then quickly reverses back inside the range.
⦁ Grades signal quality: Factors include reversal speed, volume confirmation, breakout magnitude, and consecutive patterns.
⦁ Overlays market context: Trend/range classification (ADX / MA / ATR Bands / Combined), Kill Zones (Asian/London/NY), and time-of-day filters.
⦁ Marks IMB / mitigation zones: Draws Order Blocks and Fair Value Gaps, with optional live mitigation tracking and fading/removal on mitigation.
⦁ Shows OTE zones (61.8–78.6%) after confirmed reversals to highlight potential pullback entries.
⦁ Plots risk management guides: Optional SL buffer below/above reversal wick and TP bands at 1:1, 1:2, 1:3 R multiples.
⦁ Emits alerts on bullish/bearish Turtle Soup confirmations.
How It Works (Conceptual)
1. Liquidity Sweep & Breakout Check
⦁ Looks back over user-defined windows (single or multiple lookbacks: short/medium/long) to find the most recent swing high/low.
⦁ Flags a breakout when price pierces that swing (above for bearish, below for bullish).
⦁ Optional breakout bar volume check requires volume > avg(volume, N) × multiplier.
⦁ Optional swing age check requires the broken swing to be at least X bars old.
2. Reversal Confirmation
⦁ Within N bars after the sweep, validates a mean-reversion close back inside the prior range with a minimum wick/body ratio to confirm rejection.
⦁ Quality Score adds points for:
⦁ Speed: reversal within fast_reversal_bars;
⦁ Volume: breakout and/or reversal volume spike;
⦁ Series: previous consecutive signals;
⦁ Magnitude: sufficient sweep distance.
⦁ Optional high-quality filter only shows signals meeting a minimum score.
3. Context Filters (Optional)
⦁ Sessions/Kill Zones: Only allow signals in selected sessions (Asian/London/NY) with fully custom HHMM inputs.
⦁ Time Window: Restrict to specific hours (e.g., 08–12).
⦁ Market Structure: Classify Trending vs. Ranging (via ADX, MA separation/slope, ATR bands, or Combined). You can allow signals in trends, ranges, or both.
4. Smart Confluence Layers
⦁ Order Blocks: Finds likely OBs with structural validation (e.g., bearish up-candle prior to down move), imbalance score (body/range × volume factor), and extend-until-touched with mitigation % tracking.
⦁ Fair Value Gaps: Detects valid 3-bar gaps (bull/bear) with size threshold, supports touch / 50% / full mitigation logic, and can fade or remove after mitigation.
⦁ OTE Zones: After a reversal, projects the 61.8–78.6% retracement box from the actual swing range; offset scales to timeframe to avoid clutter.
5. Risk & Display
⦁ SL/TP guides: Optional wick-buffered SL and 1:1/1:2/1:3 TPs.
⦁ Dashboard: Recent high/low, active lookbacks, current session, structure label, and live counts of mitigated OBs/FVGs.
Signals & Visuals
⦁ Bullish Turtle Soup: Triangle up + label (🐢S/M/L/D + star rating).
⦁ Bearish Turtle Soup: Triangle down + label (🐢S/M/L/D + star rating).
⦁ Labels can show: quality stars, FAST/SLOW reversal, reversal & breakout volume tags, previous consecutive count, and last move %.
⦁ Lines/Boxes: OBs, FVGs, OTE zones, SL/TP bands, and optional breakout magnitude line.
Inputs (Key Groups)
⦁ Turtle Soup: Lookbacks (single or S/M/L), reversal bars, wick ratio, magnitude line, reversal speed, volume confirmation (multiplier/length), consecutive tracking.
⦁ Order Blocks: Show/validate structure, lookback, extend-until-touched, mitigation % threshold, colors.
⦁ Fair Value Gaps: Show, min size %, colors, mitigation mode (Touch/50%/Full), optional remove-on-mitigation.
⦁ Kill Zones/Sessions: Enable Asian/London/NY with custom HHMM, colors.
⦁ OTE: Show OTE (61.8–78.6%), color, timeframe-adaptive offsets.
⦁ Signal Filters: Filter by session, time window, market structure method (ADX/MA/ATR/Combined), thresholds (ADX, MA periods, ATR multiplier), trending/ranging allowances, structure label & offset.
⦁ SL/TP: SL buffer %, TP 1:1/1:2/1:3 toggles & colors.
⦁ Breakout Validation: Require breakout-bar volume, min swing age, volume label toggles.
⦁ Alerts: Enable/disable.
⦁ Dashboard: Position, text size, colors, border.
How to Use
1. Markets & Timeframes: Works on FX, crypto, indices, and futures. Start with M5–H1 for intraday and H1–H4 for swing; refine lookbacks per instrument volatility.
2. Core Flow:
⦁ Enable multiple lookbacks for robustness on mixed volatility.
⦁ Turn on validate_swing_significance to avoid micro sweeps.
⦁ Use validate_breakout_volume + use_volume_confirmation to filter weak pokes.
3. Context Choice:
⦁ In ranging environments, allow both sides; in trends, consider counter-trend only at HTF OB/FVG/OTE confluence.
⦁ Narrow to London/NY for higher activity if desired.
4. Entries/Stops/Targets:
⦁ Entry on confirmed label close or at OTE pullback post-signal.
⦁ SL: below/above reversal wick + sl_buffer%.
⦁ TP: scale at 1:1/1:2/1:3 or manage via OB/FVG/structure breaks.
5. Confluence: Prefer Turtle Soup that aligns with OB/FVG zones and Combined structure method for added reliability.
Alerts
⦁ “Bullish Turtle Soup detected” and “Bearish Turtle Soup detected” fire on confirmation.
⦁ Set to Once Per Bar (as coded) or adjust in the alert dialog per your workflow.
Notes & Tips
⦁ Multiple lookbacks (S/M/L) help capture both shallow and deep liquidity sweeps.
⦁ Use market structure label with offset to keep it readable on the right of price.
⦁ Mitigation tracking visually communicates when OB/FVG confluence is no longer valid.
⦁ Dashboard = fast situational awareness; keep it on during live trading.
Limitations & Disclaimer
⦁ This tool is educational and not financial advice. No profitability or win-rate is implied. Markets carry risk; manage position size and test thoroughly.
⦁ Signal quality depends on market regime, spreads, news, and data quality. Backtests/forward-tests may differ.
⦁ Visual objects are capped for performance; old items may auto-clean to keep charts responsive.

AnchorPulse RWAP Universal ScalperWhat it is
AnchorPulse Scalper is an intraday indicator that reads price in real time through three ideas working together.
A live pivot engine that detects the current micro leg.
An Anchored Range Weighted Average Price that starts at each new leg or session.
An adaptive rhythm score that communicates a simple bias: Buy, Sell, or Wait.
The goal is clarity. You get one anchor line, soft bands that show stretch, discrete Buy and Sell marks, and a plain-language dashboard that says Trend, Phase, Bias, Momentum, Volatility, Stretch, ETA to next turn, and Regime. No external dependencies and no lookahead. It is designed for standard chart types on one to five minute timeframes across liquid symbols such as major FX, index futures, large cap stocks, and mainstream crypto pairs.
What makes it original
Most scalpers either track a fixed moving average or draw from a session VWAP. AnchorPulse does neither. The anchor resets at every new micro leg detected by a real time pivot engine that measures distance in units of ATR rather than in fixed points. This produces a responsive anchor that updates only when the market proves a leg has turned. On top of that, the rhythm timer keeps an average of how long legs usually last, so the indicator can treat the start and the end of a leg differently. Early in a leg it favors continuation signals. Late in a leg it watches for mean reversion. This mix of an ATR-based leg detector, a leg-anchored RWAP, and a rhythm aware bias is the core originality.
Plain explanation of the calculations
Pivot engine. While price travels up, the script tracks the highest high reached since the last pivot. If price pulls back from that extreme by at least a user defined fraction of ATR, the leg flips down. The reverse applies to down legs. The distance threshold is adaptive because ATR changes with volatility. A short cooldown in bars can prevent double flips on violent bars.
Anchored Range Weighted Average Price. From the first bar of each new leg the script accumulates a weighted average of the typical price, where the weight is the true range of each bar. The anchor can also reset at the start of a session and can ignore the very first session bar to avoid overweighting the open gap.
Progress and phase. The script measures how far price traveled from the last pivot relative to the reversal threshold. That is progress. At the same time it maintains an exponential average of leg duration in bars. The current leg age divided by that average is the age ratio. An age ratio below an adaptive early threshold means Early. Above an adaptive late threshold means Late. The thresholds drift with recent variability in leg length so they match the rhythm of the market.
Wick pressure and intrabar skew. Lower wick minus upper wick, normalized by ATR and smoothed, acts as tape pressure. The sign of close minus open, smoothed, is intrabar skew. They are combined into a compact momentum read.
Bands and stretch. The script computes the deviation of typical price from the anchor and builds soft bands around the anchor. Standard deviation is capped by a multiple of mean absolute error to avoid inflated bands just after a pivot.
Regime filter. You may optionally gate continuation entries when the higher timeframe EMA disagrees, or gate reversals when ADX shows strong trend.
Adaptive edge score. Progress and momentum are turned into percentile scores using a normal CDF of their rolling z scores. This yields a familiar zero to one hundred scale that is easier to read than raw values. Early in an up leg adds a small bonus to long bias. Early in a down leg adds a small bonus to short bias.
Gap cap. Signals are rejected if price is too far from the anchor. The cap is expressed as a fraction of price, which scales across symbols.
What you see on the chart
One white anchor line. Two transparent bands. Subtle green or orange background when a bias is active. Buy marks below bars and Sell marks above bars. Small triangles at pivots. Bar tint softly aligned with momentum. A compact table in the corner that tells you the state in plain language. On alert, a single JSON line can be sent to your alert channel with ticker, timeframe, trend, phase, bias, edge score, stretch, ETA in bars, and regime note.
How to use it in practice
Choose a liquid symbol and a one to five minute timeframe.
Keep the mode on Hybrid until you learn the personality of the market. If you notice long directional pushes, try Continuation mode. If you see frequent fades near the end of legs, try Reversal mode.
Read the table. Trend shows Up or Down according to the current leg. Phase shows Early, Mid, or Late from the rhythm timer. Bias shows Buy, Sell, or Wait once the signal rules and the gap cap are satisfied. Momentum reads Strong Up, Neutral, or Strong Down from wick pressure and skew. Volatility shows Calm, Average, or Wild relative to an ATR baseline. Stretch vs anchor prints the distance between close and the anchor as a percent of price. ETA shows how many bars remain to the average leg length if such a read is meaningful. Regime reflects the optional gate: None, HTF Up, HTF Down, Strong, or Soft.
Focus on the anchor. Continuation longs are stronger when price holds above the anchor in the first part of an up leg with positive momentum and adequate progress. Continuation shorts are the mirror case below the anchor. Reversal longs are stronger when a down leg is late, price crosses the anchor, and momentum flips positive. Reversal shorts are the mirror case in late up legs.
Respect the gap cap. When price is stretched far away from the anchor, skip signals and wait for re-alignment or a fresh leg.
Keep the chart clean. The script is designed to work on its own. If you add other tools, make sure they do not paint multiple backgrounds or heavy drawings that obscure the anchor and the bands.
Inputs explained with practical defaults
The script ships with sensible defaults and all inputs provide tooltips inside the indicator. The description here is included so traders who do not read code can still understand how to tune it.
Signal mode. Continuation uses early leg logic. Reversal uses late leg logic at anchor crosses. Hybrid allows both and lets the edge score decide.
ATR length and Pivot reversal in ATR. These govern flips. Shorter ATR and smaller reversal multiples yield faster turns and more signals. Longer and larger do the opposite. A middle ground such as ATR 50 with reversal 0.75 often reads well across liquid markets.
Rhythm smoothing length and Freeze bars after flip. The first sets how quickly the average leg length adapts. The second prevents double flips on wide bars. Values around 20 and 1 to 3 bars work well for most symbols.
Session hours, Session reset, and Skip first session bar. These are optional. Day sessions in equities can benefit from a reset and from skipping the first bar so the anchor is not dragged by the open gap. Round the session to your venue.
Wick pressure length and Intrabar skew length. They control how quickly the micro momentum reacts. Values between 6 and 12 for wick pressure and 4 to 10 for skew are common.
Early and Late thresholds and the Adaptive option. If you turn adaptation on, the thresholds drift with leg variability. The adaptiveness setting controls the strength of that drift.
Minimum progress and Maximum stretch vs anchor. The first ensures that continuation signals only occur once the leg moved a minimum distance from the last pivot. The second prevents chasing far from the anchor. As a rule, raise minimum progress when the market chops and reduce it on trend days. Keep stretch around one to two percent for many symbols, then adjust by product.
Regime filter. Higher timeframe EMA supports trend alignment. ADX supports a simple read on the strength of trend. Use one at a time or none, depending on your preference.
Adaptive scoring lookback. The percentile logic needs a modest window. Values near one hundred twenty bars tend to give stable ranks without lagging too much.
Band settings. Band length and width control the look of the soft channel around the anchor. The cap versus mean absolute error is there to keep the bands realistic just after flips.
Visual controls. Pick labels, triangles, or circles, and choose to mark only state changes if you prefer a very clean chart.
Why the dashboard uses plain language
Many traders prefer to reason in simple terms rather than in raw values. The table abstracts the math into natural categories such as Early versus Late, Calm versus Wild, or Strong Up versus Strong Down. The only numeric reads are Stretch and Edge score because these help in threshold decisions. Stretch is a percent of price so it scales across markets. Edge is a normalized score from zero to one hundred that reflects the combined progress, momentum, and phase. The table is intended to be the only element you need to glance at during a fast session once you learn the anchor and the band cues.
Design choices and integrity
No repaint. The script uses bar closes and standard Pine semantics with lookahead off in security calls. There are no offset tricks that move plotted values after the fact.
One background painter. Background tint is created by a single call to avoid vertical stripes.
Reset logic is explicit. The anchor resets at a pivot or at session start if that option is enabled. This is written to be transparent so you know why the anchor restarted.
Conservative defaults. Out of the box, the script is not tuned to over trade. It communicates bias rather than forcing entries.
Clean chart guidance. The tool is meant to be used on standard bars or candles. It is not intended for synthetic chart types such as Heikin Ashi, Renko, Kagi, Point and Figure, or Range for the purpose of signal generation.
How to read a few common situations
Breakout with strong follow through. Trend reads Up. Phase reads Early. Momentum reads Strong Up. Stretch sits inside the band. Bias shows Buy. This is the typical continuation long.
Extended push into exhaustion. Trend reads Up. Phase reads Late. Momentum cools. Stretch prints a high positive percent of price. Bias flips to Wait, sometimes to Sell after an anchor cross. This is the potential reversal short.
Mean reverting chop. Trend flips often. Phase hangs around Mid. Momentum flips sign frequently. Stretch hovers near zero. Bias often prints Wait. In this case you let the market speak and only act when the leg matures or when stretch spikes away from the anchor.
Trend day with strength. ADX filter reads Strong. Continuation is allowed. Reversal attempts are blocked. Bias favors the dominant direction.
Session open. If you selected a session reset and chose to skip the first bar, the anchor starts at the second bar and the first prints do not dominate the anchor.
Limits and realistic expectations
This indicator measures leg structure and micro pressure to suggest a bias. It is not a self-contained trading system. It does not size positions, pick stops, or set take profits. It does not promise accuracy or profits. In violent markets the pivot detector can flip and then flip back. Cooldown reduces this effect but cannot remove it. During news and illiquid hours the anchor can move very quickly. Wide slippage and spread can make any intraday approach impractical. These are standard realities of intraday trading and they also apply here.
Suggested workflows
Discretionary scalper. Keep the chart clean. Use the table to decide whether to engage, then work entries at the anchor or inside the band. Focus on position risk and a predefined stop level independent of the script.
Session specialist. If you trade a venue with strong sessions such as US equities or major FX sessions, enable the session reset. Many traders find the tool shines in the first two hours and the last hour of an active session.
Multi timeframe monitor. Keep AnchorPulse on one to five minutes and a simple higher timeframe EMA on a separate chart. If you prefer a single chart, switch the regime filter to HTF Trend and let the indicator handle it.
Alert driven workflow. Create alerts on Buy or Sell. The payload contains the essential context so you can log and review. Use the payload fields to build a small notebook of cases you like to take.
Why it is published as protected
The script contains original logic that relies on a compact set of calculations not commonly seen together. Publishing as protected keeps the logic intact while still giving the community full access through the Public Library.
Frequently asked questions
Does it repaint
No. The pivot flips on confirmed bars using ATR distance. The anchor, bands, and dashboard read from that state and do not shift after the bar closes.
What settings should I change first
Try the reversal distance in ATR and the minimum progress. These two govern how active or selective the tool becomes. If you see too many flips, raise the ATR multiple or the freeze bars. If you want faster action, lower them slightly.
What is a reasonable stretch cap
One to two percent of price is a useful starting point for many symbols. Thin products may need a larger cap. Extremely liquid products can often work with a smaller cap.
Should I use the regime filter
On days with persistent trend, the higher timeframe EMA filter or the ADX filter can help keep you with the flow. On rotational days, consider turning the filter off to allow more two sided action.
Can I use it on higher timeframes
The logic works on any timeframe, but the design and defaults target one to five minutes. If you go higher, adjust the ATR length, reversal distance, and rank lookback accordingly.
Can I combine it with volume
Yes. A simple volume filter that marks above average volume near the anchor can help you time entries. Keep the chart readable.
Risk notice and user responsibility
This indicator is a tool for research and education. It does not give investment advice, trade recommendations, or any guarantee of outcomes. All trading carries risk including the loss of capital. Past performance is not a reliable guide to future results. You are solely responsible for your trading decisions, for verifying that the indicator behaves as you expect on your data and platform settings, and for selecting appropriate risk controls such as position sizing, stops, and loss limits.
Summary
AnchorPulse Scalper is a concise way to read the market’s current leg, its anchor, and its rhythm. The pivot engine tells you direction. The leg-anchored RWAP shows where value sits for this micro move. The adaptive score simplifies momentum and progress into a familiar scale. The dashboard translates complex calculations into the plain words that scalpers actually use. If you prefer simple signals, enable alerts and let them flow into your log. If you prefer context, watch the anchor and bands as the leg evolves and let the rhythm guide your timing. Use it respectfully on a clean chart, stay realistic, and keep your own rules for risk.

EquiSense AI Signals🇸🇦 العربي
المتنبئ الذكي المتوازن (AI v7)
وصف قصير:
مؤشر تجميعي ذكي يوازن بين الاتجاه والزخم والحجم والتذبذب وأنماط الشموع، ويحوّلها إلى نظام نقاط ونجوم يولّد إشارات شراء/بيع مؤكَّدة بتقاطع MACD. بعد الإشارة، يعرض أهدافًا ذكية (TP1/TP2/TP3) ووقف خسارة مبنيَّيْن على ATR مع رسومات مستقبلية ولوحة معلومات لإدارة الصفقة.
الإعدادات (Inputs)
الحد الأدنى للنقاط (min_score): افتراضي 6.0 — كلما ارتفع قلّت الإشارات وزادت جودتها.
الحد الأدنى للنجوم (min_stars): افتراضي 2 — فلتر لقوة الإشارة.
عدد الشموع المستقبلية (future_bars): افتراضي 15 — مدى رسم الأهداف والوقف للأمام.
استخدام الأهداف الذكية (use_ai_targets): تفعيل/إيقاف مضاعِف الذكاء الاصطناعي للأهداف والوقف.
كيف يعمل؟
يحسب المؤشر buy_score/sell_score من مجموعة عوامل: EMA8/21/50/200، RSI + متوسطه، MACD + Histogram، Stochastic، ADX/DMI، VWAP، الحجم، MTF 15m، ROC/المومنتَم، Heikin Ashi، وأنماط (ابتلاع/مطرقة/شهاب).
يحوّل الدرجات إلى نجوم (⭐⭐ إلى ⭐⭐⭐⭐⭐) حسب القوة.
تولّد الإشارة فقط إذا توفّر: درجة ≥ الحد + نجوم ≥ الحد + تقاطع MACD (صعودًا للشراء، هبوطًا للبيع).
عند الإشارة يبدأ سيناريو صفقة واحدة فقط حتى تنتهي (TP3 أو SL).
الأهداف والوقف (ذكاء اصطناعي)
تُشتق من ATR ثم تُعدَّل عبر مضاعِف AI مبني على: ATR%، الزخم (ROC)، الحجم مقابل متوسطه، قوة الاتجاه (ADX)، وعدد النجوم.
تقريبيًا:
TP1 ≈ 1.5×ATR × AI
TP2 ≈ 2.5×ATR × AI
TP3 ≈ 4.0×ATR × AI
SL ≈ 1.0×ATR ÷ AI
ماذا سترى على الشارت؟
علامات “شراء/بيع”، نجوم قرب الإشارة، خط دخول (أزرق)، وقف (أحمر منقّط)، TP1/TP2 (أخضر)، TP3 (ذهبي) مع صناديق مناطق للأهداف وخط ربط نحو الهدف النهائي.
وسم AI يعرض نسبة المضاعِف والنجوم بصريًا.
لوحة معلومات تعرض الحالة، القوة، AI%، السعر، الدرجات، وأثناء الصفقة: الدخول، TP1/TP2/TP3، والربح اللحظي.
التنبيهات (Alerts)
شرطان جاهزان: شراء وبيع عند تحقق الإشارة.
أضِف تنبيه: Right click → Add alert → اختر المؤشر → الشرط المطلوب.
أفضل الممارسات
استخدم الإطار المناسب للأصل:
سكالبينغ 5–15m: min_score 8 وmin_stars 3–4.
تأرجحي H1–H4: min_score 7 وmin_stars 3.
يومي/أسهم: min_score 6–7 وmin_stars 2–3.
فضّل التداول مع EMA200 واتجاه MTF 15m.
خفّض المخاطرة وقت الأخبار العالية.
التزم بإدارة مخاطر ثابتة (مثلاً 1% لكل صفقة).
حدود مهمة
الأفضل انتظار إغلاق الشمعة لتأكيد التقاطعات وتجنّب تغيّرها.
صفقة واحدة في المرة بفضل حالة in_trade.
يستخدم request.security مع lookahead_off لإطار 15m؛ التزم بالتقييم عند الإغلاق.
أسئلة شائعة
هل يستخدم منفردًا؟ نعم، لكن مع مناطق سعرية/ترند وخطة مخاطر يصبح أقوى.
لماذا تختلف الأهداف؟ لأن مضاعِف AI يكيّف TP/SL مع ظروف السوق.
إخلاء مسؤولية
هذه أداة تحليلية تعليمية وليست نصيحة استثمارية. اختبر الإعدادات تاريخيًا والتزم بالمخاطرة المناسبة.
ملاحظة للمبرمجين
Pine Script v6، متغيرات var لحفظ الحالة، تنظيف الرسومات على الشمعة الأخيرة، مع حدود مرتفعة للرسوم لتجنّب الأخطاء.
🇬🇧 English
Balanced Smart Predictor (AI v7)
Short description:
A smart, ensemble-style indicator that blends trend, momentum, volume, volatility, and candle patterns into a score & star system that produces Buy/Sell signals confirmed by MACD crosses. After a signal, it projects smart targets (TP1/TP2/TP3) and a stop-loss derived from ATR, with forward drawings and a control panel for trade management.
Inputs
Minimum Score (min_score): default 6.0 — higher = fewer but stronger signals.
Minimum Stars (min_stars): default 2 — extra filter for strength.
Future Bars (future_bars): default 15 — how far targets/SL are drawn ahead.
Use AI Targets (use_ai_targets): toggle the AI multiplier for TP/SL.
How it works
Computes buy_score/sell_score from: EMA8/21/50/200, RSI & its MA, MACD & Histogram, Stochastic, ADX/DMI, VWAP, Volume, 15m MTF tilt, ROC/Momentum, Heikin Ashi, and candle patterns (engulfing/hammer/shooting star).
Converts scores into Stars (⭐⭐ to ⭐⭐⭐⭐⭐) via tiered thresholds.
Signals fire only when: Score ≥ minimum + Stars ≥ minimum + MACD cross (up = Buy, down = Sell).
On a signal, one active trade is managed until TP3 or SL is reached.
Targets & Stop (AI-driven)
Targets and SL are ATR-based, then adjusted by an AI multiplier derived from: ATR%, momentum (ROC), relative volume, trend strength (ADX), and star rating.
Approximate formulas:
TP1 ≈ 1.5×ATR × AI
TP2 ≈ 2.5×ATR × AI
TP3 ≈ 4.0×ATR × AI
SL ≈ 1.0×ATR ÷ AI
What you’ll see on chart
“Buy/Sell” markers with small Star labels, an Entry line (blue), SL (red dotted), TP1/TP2 (green), TP3 (gold) with shaded target boxes and a guide line towards the final target.
A central AI badge showing the multiplier % and star rating.
A top-right Panel showing status, strength, AI%, price, scores, and during trades: entry, TP1/TP2/TP3, and live P/L.
Alerts
Two ready-made conditions: Buy and Sell when the respective signal triggers.
Add alert: Right click → Add alert → choose the indicator → select condition.
Best practices
Match timeframe to instrument:
Scalping 5–15m: min_score 8, min_stars 3–4.
Swing H1–H4: min_score 7, min_stars 3.
Daily/Equities: min_score 6–7, min_stars 2–3.
Prefer trades with EMA200 and 15m MTF trend alignment.
De-risk around major news.
Use fixed risk per trade (e.g., 1%).
Important notes
Prefer bar close confirmation to avoid mid-bar MACD flips.
Single trade at a time via the in_trade state.
15m MTF uses request.security with lookahead_off; evaluate at close for consistency.
FAQ
Use it standalone? You can, but it’s stronger when combined with S/R zones/trendlines and solid risk management.
Why do targets vary? The AI multiplier adapts TP/SL to current market conditions.
Disclaimer
This is an analytical/educational tool, not financial advice. Always backtest and use appropriate risk management.
Developer note
Built in Pine Script v6, uses var for trade state, clears drawings on the last bar to keep the chart tidy, and raises drawing limits to avoid runtime errors.

Continuation Suite v1 — 5m/15mContinuation Suite v1 — 5m/15m (Non-Repainting, S/R + Trend Continuation)
What it does
Continuation Suite v1 is a practical intraday toolkit that combines non-repainting trend-continuation signals with auto-built Support/Resistance (S/R) from confirmed pivots. It’s designed for fast, liquid names on 5m charts with an optional 15m higher-timeframe (HTF) overlay. You get: stacked-EMA bias, disciplined pullback+reclaim entries, optional volume/volatility gates, a “Strong” signal tier, solid S/R lines or zones, and a compact dashboard for fast reads.
⸻
Why traders use it
• Clear bias using fast/mid/slow EMA stacking.
• Actionable entries that require a pullback, a reclaim, and (optionally) a minor break of prior extremes.
• Signal quality gates (volume vs SMA, ATR%, ADX/DI alignment, EMA spacing, slope).
• Non-repainting logic when “Confirm on Close” = ON. Intrabar previews show what’s forming, but confirmed signals only print on bar close.
• S/R that matters: confirmed-pivot lines or ATR-sized zones, optional HTF overlay, and auto de-dup to avoid clutter.
⸻
Signal construction (no magic, just rules)
Bullish continuation (base):
1. Trend: EMA fast > EMA mid > EMA slow
2. Pullback: price pulls into the stack (lowest low or close vs EMA fast/mid over a lookback)
3. Reclaim: close > EMA fast and close > open
4. Break filter (optional): current bar takes out the prior bar’s high
5. Filters: volume > SMA (if enabled) and ATR% ≤ max (if enabled)
6. Cooldown: a minimum bar gap between signals
Bearish continuation (base): mirror of the above.
Strong signals: base conditions plus ADX ≥ threshold, DI alignment (DI+>DI- for longs; DI->DI+ for shorts), minimum EMA-spacing %, and minimum fast-EMA slope.
Reference stops:
• Longs: lowest low over the pullback lookback
• Shorts: highest high over the pullback lookback
Alerts are included for: Bullish Continuation, Bearish Continuation, STRONG Bullish, STRONG Bearish.
⸻
S/R engine (current TF + optional HTF)
• Builds S/R from confirmed pivots only (left/right bars).
• Choose Lines (midlines) or Zones (ATR-sized).
• Zones merge when a new pivot lands near an existing zone’s mid (ATR-scaled epsilon).
• Touches counter tracks significance; you can require a minimum to draw.
• HTF overlay (default 15m) draws separate lines/zones with tiny TF tags on the right.
• De-dup option hides current-TF zones that sit too close to HTF zones (ATR-scaled), reducing overlap.
• Freeze on Close (optional) keeps arrays stable intrabar; snapshots show levels immediately as bars open.
⸻
Presets
• Auto: Detects QQQ-like tickers (QQQ, QLD, QID) or SoFi; else defaults to Custom.
• QQQ: Tighter ATR% and EMA settings geared to index-ETF behavior.
• SoFi: Wider ATR allowances and longer mid/slow for single-name behavior.
• Custom: Expose all key inputs to tune for your product.
⸻
Dashboard (top-right)
• Preset in use
• Bias (Bullish CONT / Bearish CONT / Neutral)
• Strong (Yes/No)
• Volatility (ATR% bucket)
• Trend (ADX bucket)
• HTF timeframe tag
• Volume (bucket or “off”)
• Signals mode (Close-Confirmed vs Intrabar)
⸻
Inputs you’ll actually adjust
Trend/Signals
• Fast/Mid/Slow EMA lengths
• Pullback lookback, Min bars between signals
• Volume filter (vol > SMA N)
• ATR% max filter (cap excessive volatility)
• Require break of prior bar’s high/low
• “Strong” gates: min EMA slope, min EMA spacing %, ADX length & threshold
Support/Resistance
• Lines vs Zones
• Pivot left/right bars
• Extend left/right (bars)
• Max pivots kept (current & HTF)
• Zone width (× ATR), Merge epsilon (× ATR), Min gap (× ATR)
• Min touches, Max zones per side near price
• De-dup current TF vs HTF (× ATR)
Repainting control
• Confirm on Close: when ON, signals/SR finalize on bar close (non-repainting)
• Freeze on Close: freeze S/R intrabar with snapshot updates
• Show previews: translucent intrabar labels for what’s forming
⸻
How to use it (straightforward)
1. Load on 5-minute chart (baseline). Keep Confirm on Close ON if you hate repainting.
2. Use Bias + Strong + S/R context. If a long prints into HTF resistance, you have information.
3. Manage risk off the reference stop (pullback extreme). If ATR% reads “Great,” widen expectations; if “Poor,” size down or pass.
4. Alerts: wire the four alert types to your workflow.
⸻
Notes and constraints
• Designed for liquid symbols. Thin books and synthetic “volume” will degrade the volume gate.
• S/R is pivot-based. On very choppy tape, touch counts help. Increase min touches or switch to Lines to declutter.
• If your chart timeframe isn’t 5m, behavior changes because lengths are in bars, not minutes. Tune lengths accordingly.
⸻
Disclaimers
This is a research tool. No signals are guaranteed. Markets change, outliers happen, slippage is real. Nothing here is financial advice—use your own judgment and risk management.
⸻
Author: DaddyScruff
License: MPL-2.0 (Mozilla Public License 2.0)

MNQ TopStep 50K | Ultra Quality v3.0MNQ TopStep 50K | Ultra Quality v3.0 - Publish Summary
📊 Overview
A professional-grade trading indicator designed specifically for MNQ futures traders using TopStep funded accounts. Combines 7 technical confirmations with 5 advanced safety filters to deliver high-quality trade signals while managing drawdown risk.
🎯 Key Features
Core Signal System
7-Point Confirmation: VWAP, EMA crossovers, 15-min HTF trend, MACD, RSI, ADX, and Volume
Signal Grading: Each signal is rated A+ through D based on 7 quality factors
Quality Threshold: Adjustable minimum grade requirement (A+, A, B, C, D)
Advanced Safety Filters (Customizable)
Mean Reversion Filter - Prevents chasing extended moves beyond VWAP bands
ATR Spike Filter - Avoids trading during extreme volatility events
EMA Spacing Filter - Ensures proper trend separation (optional)
Momentum Filter - Requires consecutive directional bars (optional)
Multi-Timeframe Confirmation - Aligns with 15-min trend (optional)
TopStep Risk Management
Real-time drawdown tracking
Position sizing calculator based on remaining cushion
Daily loss limit monitoring
Consecutive loss protection
Max trades per day limiter
Visual Components
VWAP with 1σ, 2σ, 3σ bands
EMA 9/21 with cloud fill
15-min EMA 50 for HTF trend
Comprehensive metrics dashboard
Risk management panel
Filter status panel
Detailed trade labels with entry, stops, and targets
⚙️ Default Settings (Balanced for Regular Signals)
Technical Indicators
Fast EMA: 9 | Slow EMA: 21 | HTF EMA: 50 (15-min)
MACD: 10/22/9
RSI: 14 period | Thresholds: 52 (buy) / 48 (sell)
ADX: 14 period | Minimum: 20
ATR: 14 period | Stop: 2x | TP1: 2x | TP2: 3x
Volume: 1.2x average required
Session Settings
Default: 9:30 AM - 11:30 AM ET (adjustable)
Avoids first 15 minutes after market open
Customizable trading hours
Safety Filters (Default Configuration)
✅ Mean Reversion: Enabled (2.5σ max from VWAP)
✅ ATR Spike: Enabled (2.0x threshold)
❌ EMA Spacing: Disabled (can enable for quality)
❌ Momentum: Disabled (can enable for quality)
❌ MTF Confirmation: Disabled (can enable for quality)
Risk Controls
Minimum Signal Quality: C (adjustable to A+ for fewer/better signals)
Min Bars Between Signals: 10
Max Trades Per Day: 5
Stop After Consecutive Losses: 2
📈 Expected Performance
With Default Settings:
Signals per week: 10-15 trades
Estimated win rate: 55-60%
Risk-Reward: 1:2 (TP1) and 1:3 (TP2)
With Aggressive Settings (Min Quality = D, All Filters Off):
Signals per week: 20-25 trades
Estimated win rate: 50-55%
With Conservative Settings (Min Quality = A, All Filters On):
Signals per week: 3-5 trades
Estimated win rate: 65-70%
🚀 How to Use
Basic Setup:
Add indicator to MNQ 5-minute chart
Adjust TopStep account settings in inputs
Set your risk per trade percentage (default: 0.5%)
Configure trading session hours
Set minimum signal quality (Start with C for balanced results)
Signal Interpretation:
Green Triangle (BUY): Long signal - all confirmations aligned
Red Triangle (SELL): Short signal - all confirmations aligned
Label Details: Shows entry, stop loss, take profit levels, position size, and signal grade
Signal Grade: A+ = Elite (6-7 points) | A = Strong (5) | B = Good (4) | C = Fair (3)
Dashboard Monitoring:
Top Right: Technical metrics and market conditions
Top Left: Filter status (which filters are passing/blocking)
Bottom Right: TopStep risk metrics and position sizing
⚡ Customization Tips
For More Signals:
Lower "Minimum Signal Quality" to D
Decrease ADX threshold to 18-20
Lower RSI thresholds to 50/50
Reduce Volume multiplier to 1.1x
Disable additional filters
For Higher Quality (Fewer Signals):
Raise "Minimum Signal Quality" to A or A+
Increase ADX threshold to 25-30
Enable all 5 advanced filters
Tighten VWAP distance to 2.0σ
Increase momentum requirement to 3-4 bars
For TopStep Compliance:
Adjust "Max Total Drawdown" and "Daily Loss Limit" to match your account
Update "Already Used Drawdown" daily
Monitor the Risk Panel for cushion remaining
Use recommended contract sizing
🛡️ Risk Disclaimer
IMPORTANT: This indicator is for educational and informational purposes only.
Past performance does not guarantee future results
All trading involves substantial risk of loss
Use proper risk management and position sizing
Test thoroughly in paper trading before live use
The indicator does not guarantee profitable trades
Adjust settings based on your risk tolerance and trading style
Always comply with your broker's and TopStep's rules

MNQ TopStep 50K | Ultra Quality v3.0MNQ TopStep 50K | Ultra Quality v3.0 - Publish Summary📊 OverviewA professional-grade trading indicator designed specifically for MNQ futures traders using TopStep funded accounts. Combines 7 technical confirmations with 5 advanced safety filters to deliver high-quality trade signals while managing drawdown risk.🎯 Key FeaturesCore Signal System
7-Point Confirmation: VWAP, EMA crossovers, 15-min HTF trend, MACD, RSI, ADX, and Volume
Signal Grading: Each signal is rated A+ through D based on 7 quality factors
Quality Threshold: Adjustable minimum grade requirement (A+, A, B, C, D)
Advanced Safety Filters (Customizable)
Mean Reversion Filter - Prevents chasing extended moves beyond VWAP bands
ATR Spike Filter - Avoids trading during extreme volatility events
EMA Spacing Filter - Ensures proper trend separation (optional)
Momentum Filter - Requires consecutive directional bars (optional)
Multi-Timeframe Confirmation - Aligns with 15-min trend (optional)
TopStep Risk Management
Real-time drawdown tracking
Position sizing calculator based on remaining cushion
Daily loss limit monitoring
Consecutive loss protection
Max trades per day limiter
Visual Components
VWAP with 1σ, 2σ, 3σ bands
EMA 9/21 with cloud fill
15-min EMA 50 for HTF trend
Comprehensive metrics dashboard
Risk management panel
Filter status panel
Detailed trade labels with entry, stops, and targets
⚙️ Default Settings (Balanced for Regular Signals)Technical Indicators
Fast EMA: 9 | Slow EMA: 21 | HTF EMA: 50 (15-min)
MACD: 10/22/9
RSI: 14 period | Thresholds: 52 (buy) / 48 (sell)
ADX: 14 period | Minimum: 20
ATR: 14 period | Stop: 2x | TP1: 2x | TP2: 3x
Volume: 1.2x average required
Session Settings
Default: 9:30 AM - 11:30 AM ET (adjustable)
Avoids first 15 minutes after market open
Customizable trading hours
Safety Filters (Default Configuration)
✅ Mean Reversion: Enabled (2.5σ max from VWAP)
✅ ATR Spike: Enabled (2.0x threshold)
❌ EMA Spacing: Disabled (can enable for quality)
❌ Momentum: Disabled (can enable for quality)
❌ MTF Confirmation: Disabled (can enable for quality)
Risk Controls
Minimum Signal Quality: C (adjustable to A+ for fewer/better signals)
Min Bars Between Signals: 10
Max Trades Per Day: 5
Stop After Consecutive Losses: 2
📈 Expected PerformanceWith Default Settings:
Signals per week: 10-15 trades
Estimated win rate: 55-60%
Risk-Reward: 1:2 (TP1) and 1:3 (TP2)
With Aggressive Settings (Min Quality = D, All Filters Off):
Signals per week: 20-25 trades
Estimated win rate: 50-55%
With Conservative Settings (Min Quality = A, All Filters On):
Signals per week: 3-5 trades
Estimated win rate: 65-70%
🚀 How to UseBasic Setup:
Add indicator to MNQ 5-minute chart
Adjust TopStep account settings in inputs
Set your risk per trade percentage (default: 0.5%)
Configure trading session hours
Set minimum signal quality (Start with C for balanced results)
Signal Interpretation:
Green Triangle (BUY): Long signal - all confirmations aligned
Red Triangle (SELL): Short signal - all confirmations aligned
Label Details: Shows entry, stop loss, take profit levels, position size, and signal grade
Signal Grade: A+ = Elite (6-7 points) | A = Strong (5) | B = Good (4) | C = Fair (3)
Dashboard Monitoring:
Top Right: Technical metrics and market conditions
Top Left: Filter status (which filters are passing/blocking)
Bottom Right: TopStep risk metrics and position sizing
⚡ Customization TipsFor More Signals:
Lower "Minimum Signal Quality" to D
Decrease ADX threshold to 18-20
Lower RSI thresholds to 50/50
Reduce Volume multiplier to 1.1x
Disable additional filters
For Higher Quality (Fewer Signals):
Raise "Minimum Signal Quality" to A or A+
Increase ADX threshold to 25-30
Enable all 5 advanced filters
Tighten VWAP distance to 2.0σ
Increase momentum requirement to 3-4 bars
For TopStep Compliance:
Adjust "Max Total Drawdown" and "Daily Loss Limit" to match your account
Update "Already Used Drawdown" daily
Monitor the Risk Panel for cushion remaining
Use recommended contract sizing
🛡️ Risk DisclaimerIMPORTANT: This indicator is for educational and informational purposes only.
Past performance does not guarantee future results
All trading involves substantial risk of loss
Use proper risk management and position sizing
Test thoroughly in paper trading before live use
The indicator does not guarantee profitable trades
Adjust settings based on your risk tolerance and trading style
Always comply with your broker's and TopStep's rules

MNQ Morning Indicator | Clean SignalsMNQ Morning Trading Indicator Summary
What It Does
This is a TradingView indicator designed for day trading MNQ (Micro Nasdaq-100 futures) during morning sessions. It generates BUY and SELL signals only when multiple technical conditions align, helping traders identify high-probability trade setups.
Core Strategy
BUY Signal Requirements (All must be true):
✅ Price above VWAP (volume-weighted average price)
✅ Fast EMA (9) above Slow EMA (21) - uptrend confirmation
✅ Price above 15-minute 50 EMA - higher timeframe confirmation
✅ MACD histogram positive - momentum confirmation
✅ RSI above 55 - strength confirmation
✅ ADX above 25 - trending market (not choppy)
✅ Volume 1.5x above average - strong participation
SELL Signal (opposite conditions)
Key Features
🎯 Risk Management
Stop Loss: 2× ATR (Average True Range)
Take Profit 1: 2× ATR (1:2 risk-reward)
Take Profit 2: 3× ATR (1:3 risk-reward)
Dollar values: Calculates P&L based on MNQ's $2/point value
⏰ Session Filter
Default: 9:30 AM - 11:30 AM ET (customizable)
Safety feature: Avoids first 15 minutes (high volatility period)
Won't generate signals outside trading hours
🛡️ Signal Quality
Rates each signal: 🔥 STRONG, ⚡ MEDIUM, or ⚠️ WEAK
Requires minimum 15 bars between signals (prevents overtrading)
📊 Visual Dashboard
Shows real-time metrics:
ATR values
ADX (trend strength)
RSI (momentum)
Market condition (TREND/CHOP)
Session status
Volume status
Signal cooldown timer
Visual Elements
📈 VWAP with standard deviation bands (1σ, 2σ, 3σ)
📉 Multiple EMAs with trend-based coloring
🟢/🔴 Buy/Sell arrows on chart
📋 Detailed trade labels showing entry, SL, TPs, and risk-reward ratios
🎨 Background highlighting for market conditions
Safety Features
Cooldown period between signals
Session restrictions (no trading outside set hours)
First 15-minute avoidance (post-open volatility)
Multi-confirmation requirement (all 7 conditions must align)
Trend filter (ADX minimum to avoid choppy markets)
Best For
Day traders focused on morning sessions
MNQ futures traders
Traders who prefer systematic, rule-based entries
Those wanting pre-calculated risk management levels
Customization
All parameters are adjustable:
EMA periods
MACD settings
RSI thresholds
ADX minimum
ATR multipliers
Session times
Visual preferences
This indicator is designed to be conservative — it waits for strong confirmation before signaling, which means fewer but potentially higher-quality trades.

Nick2k Trend Tracker MT botNick2k Trend Tracker MT bot
Type: Indicator (signals + PineConnector alerts for EAs)
Markets: Designed for XAUUSD (gold), adaptable to other symbols
Timeframes: Optimized for M5/M15
---
What it does
Nick2k Trend Tracker MT bot identifies trend flips using a percentile-normalized SMA slope with hysteresis, then applies a multi-layer filter suite to avoid false signals in low-quality conditions.
It can optionally auto-manage trades via PineConnector:
Send open orders with SL/TP (ATR- or pip-based)
Breakeven activation
Dual trailing stops (pip-based or ATR-based)
Staged partial closes (up to 3 levels)
The indicator also:
Highlights chop zones in the background
Provides diagnostic labels showing which filters passed/failed
Lets you disable all alerts with one checkbox (visual testing mode)
---
Core logic (simplified)
Trend Engine: SMA slope normalized by a rolling percentile; flips with hysteresis at +0.1/–0.1.
Filters: optional checks for slope strength, ADX, narrow range ratio, ATR squeeze, higher-timeframe slope.
Sessions: entry/management can be gated to London, NY, Tokyo, Sydney sessions and weekdays.
Chop highlight: background shading when ranges/low-volatility are detected for consecutive bars.
---
Visuals
Colored SMA line (gradient by slope)
BUY/SELL labels at valid flip bars
Chop background (yellow overlay)
Filter score/diagnostic label (optional)
---
Alerts & PineConnector integration
Open orders: sent at valid BUY/SELL flips with embedded SL/TP + BE/trailing if enabled
Partial closes: 3 configurable milestones (ATR or pip based, % or fixed lots)
Master toggle: switch all alerts ON/OFF instantly
Alerts are formatted in PineConnector EA syntax for compatibility with MetaTrader auto-trading.
---
Inputs (organized by group)
SMA & Theme (length, colors)
Auto Trading (license, symbol, lots, master toggle)
SL/TP Target Type (prices vs pips)
ATR SL/TP (length, multipliers, rounding)
Breakeven (trigger/offset)
Pip Trailing (trigger/dist/step)
ATR Trailing (TF, period, multiplier, trigger)
Partial Closes (mode, lots or %)
Time Filters (sessions, weekdays)
Filters (Slope, ADX, NRR, ATR squeeze, HTF confirm)
Chop Zone Highlight (on/off, hold bars, color)
---
Why this script is unique (and closed-source)
This is not a simple moving-average crossover. It combines several custom-built methods that are rarely seen in public scripts:
Normalized SMA slope with hysteresis: avoids whipsaws, adapts to volatility regimes.
Multi-filter confirmation: ADX, NRR, ATR squeeze, HTF slope — stacked to improve quality.
Chop detection with persistence: custom counter/hold logic to highlight ranging markets.
Integrated trade management: PineConnector-ready messages with SL/TP, breakeven, dual trailing stops, staged partial closes.
EA-compatible syntax: formatted exactly for PineConnector EAs, including safety toggles.
This represents a full trading framework designed for semi-automated gold scalping, not just a “signal indicator.”
The source is protected to prevent clones and preserve development effort invested in unique logic and PineConnector integration.
---
Recommended starting settings (XAUUSD M5/M15)
Pip size: 0.10
Slope threshold: 0.20 (M5), 0.16–0.20 (M15)
ADX min: 18–22
NRR floor: 2.0–2.4
ATR ratio: 0.65–0.75
ATR SL/TP: SL = 1.5×ATR, TP = 2.5×ATR
Sessions: London & NY
---
Limitations & disclaimer
Not financial advice. Test on demo before live trading.
Performance depends on broker symbols, spread, and volatility regime.
Auto-trading requires PineConnector EA set up correctly.
---
Changelog
v1.0 – Initial release (trend engine, filters, sessions, chop highlight, PineConnector alerts, BE/trailing, partial closes, diagnostics)

Chhatrapati Indicator by TradeNitiX (Nitin Hajare)⚔️ Chhatrapati Indicator by TradeNitiX
A precision-driven trading system built to capture strong trends and avoid market noise. It blends range filtering, momentum checks, and volatility-based risk control for clean, confident entries and exits.
🔍 Core Strategy Components
1. Range Filter – Trend Detection
2. RSI – Momentum Confirmation
3. ADX – Trend Strength Filter
4. ATR – Volatility-Based Risk Management
💎 Highlights – Chhatrapati Indicator
✔ Display Profit/Loss values above each candle
✅ Clear Buy/Sell Signals – No guesswork, just precision entries and exits
📊 High Accuracy – Filters out false signals using multi-layer confirmation
⚡ Beginner-Friendly – Simple logic, powerful results for all skill levels
🔥 Multi-Market Compatibility – Works seamlessly on Forex, crypto, indices, stocks
🎯 Volatility-Based Risk Control – ATR-driven SL/TP for realistic, dynamic targets
🧠 Smart Trend Detection – Combines range filtering with ADX for strong setups
💡 Live Trade Demos – Real-time examples to build trader confidence
📈 Momentum + Strength Filters – RSI + ADX combo avoids weak or choppy trades
🛡️ Risk-Reward Focused – Built-in 3:1 RR logic for disciplined growth
🚀 Tested & Trusted – Proven results across multiple market conditions
⚙️ Key Advantages of Chhatrapati Indicator
✅ Noise-Free Trend Detection – Filters weak moves, locks onto strong trends
📊 RSI + ADX Confirmation – Only trades with real momentum and strength
🎯 ATR-Based Risk Control – Smart SL/TP placement, adapts to volatility
⏱️ Multi-Timeframe Ready – Works for scalping, swing, and intraday setups
👁️ Visual Clarity – Clean signals, SL/TP zones, and trend markers
🎯 Ideal Users
✔ Trend Followers – Ride strong moves with confidence
✔ Swing Traders – Target medium-term setups with solid RR
✔ Scalpers – Quick, precise entries with minimal noise
✔ Algo Traders – Use alerts for automated execution

Copeland Dynamic Dominance Matrix System | GForgeCopeland Dynamic Dominance Matrix System | GForge - v1
---
📊 COMPREHENSIVE SYSTEM OVERVIEW
The GForge Dynamic BB% TrendSync System represents a revolutionary approach to algorithmic portfolio management, combining cutting-edge statistical analysis, momentum detection, and regime identification into a unified framework. This system processes up to 39 different cryptocurrency assets simultaneously, using advanced mathematical models to determine optimal capital allocation across dynamic market conditions.
Core Innovation: Multi-Dimensional Analysis
Unlike traditional single-asset indicators, this system operates on multiple analytical dimensions:
Momentum Analysis: Dual Bollinger Band Modified Deviation (DBBMD) calculations
Relative Strength: Comprehensive dominance matrix with head-to-head comparisons
Fundamental Screening: Alpha and Beta statistical filtering
Market Regime Detection: Five-component statistical testing framework
Portfolio Optimization: Dynamic weighting and allocation algorithms
Risk Management: Multi-layered protection and regime-based positioning
---
🔧 DETAILED COMPONENT BREAKDOWN
1. Dynamic Bollinger Band % Modified Deviation Engine (DBBMD)
The foundation of this system is an advanced oscillator that combines two independent Bollinger Band systems with asymmetric parameters to create unique momentum readings.
Technical Implementation:
[
// BB System 1: Fast-reacting with extended standard deviation
primary_bb1_ma_len = 40 // Shorter MA for responsiveness
primary_bb1_sd_len = 65 // Longer SD for stability
primary_bb1_mult = 1.0 // Standard deviation multiplier
// BB System 2: Complementary asymmetric design
primary_bb2_ma_len = 8 // Longer MA for trend following
primary_bb2_sd_len = 66 // Shorter SD for volatility sensitivity
primary_bb2_mult = 1.7 // Wider bands for reduced noise
Key Features:
Asymmetric Design: The intentional mismatch between MA and Standard Deviation periods creates unique oscillation characteristics that traditional Bollinger Bands cannot achieve
Percentage Scale: All readings are normalized to 0-100% scale for consistent interpretation across assets
Multiple Combination Modes:
BB1 Only: Fast/reactive system
BB2 Only: Smooth/stable system
Average: Balanced blend (recommended)
Both Required: Conservative (both must agree)
Either One: Aggressive (either can trigger)
Mean Deviation Filter: Additional volatility-based layer that measures the standard deviation of the DBBMD% itself, creating dynamic trigger bands
Signal Generation Logic:
// Primary thresholds
primary_long_threshold = 71 // DBBMD% level for bullish signals
primary_short_threshold = 33 // DBBMD% level for bearish signals
// Mean Deviation creates dynamic bands around these thresholds
upper_md_band = combined_bb + (md_mult * bb_std)
lower_md_band = combined_bb - (md_mult * bb_std)
// Signal triggers when DBBMD crosses these dynamic bands
long_signal = lower_md_band > long_threshold
short_signal = upper_md_band < short_threshold
For more information on this BB% indicator, find it here:
2. Revolutionary Dominance Matrix System
This is the system's most sophisticated innovation - a comprehensive framework that compares every asset against every other asset to determine relative strength hierarchies.
Mathematical Foundation:
The system constructs a mathematical matrix where each cell represents whether asset i dominates asset j:
// Core dominance matrix (39x39 for maximum assets)
var matrix dominance_matrix = matrix.new(39, 39, 0)
// For each qualifying asset pair (i,j):
for i = 0 to active_count - 1
for j = 0 to active_count - 1
if i != j
// Calculate price ratio BB% TrendSync for asset_i/asset_j
ratio_array = calculate_price_ratios(asset_i, asset_j)
ratio_dbbmd = calculate_dbbmd(ratio_array)
// Asset i dominates j if ratio is in uptrend
if ratio_dbbmd_state == 1
matrix.set(dominance_matrix, i, j, 1)
Copeland Scoring Algorithm:
Each asset receives a dominance score calculated as:
Dominance Score = Total Wins - Total Losses
// Calculate net dominance for each asset
for i = 0 to active_count - 1
wins = 0
losses = 0
for j = 0 to active_count - 1
if i != j
if matrix.get(dominance_matrix, i, j) == 1
wins += 1
else
losses += 1
copeland_score = wins - losses
array.set(dominance_scores, i, copeland_score)
Head-to-Head Analysis Process:
Ratio Construction: For each asset pair, calculate price_asset_A / price_asset_B
DBBMD Application: Apply the same DBBMD analysis to these ratios
Trend Determination: If ratio DBBMD shows uptrend, Asset A dominates Asset B
Matrix Population: Store dominance relationships in mathematical matrix
Score Calculation: Sum wins minus losses for final ranking
This creates a tournament-style ranking where each asset's strength is measured against all others, not just against a benchmark.
3. Advanced Alpha & Beta Filtering System
The system incorporates fundamental analysis through Capital Asset Pricing Model (CAPM) calculations to filter assets based on risk-adjusted performance.
Alpha Calculation (Excess Return Analysis):
// CAPM Alpha calculation
f_calc_alpha(asset_prices, benchmark_prices, alpha_length, beta_length, risk_free_rate) =>
// Calculate asset and benchmark returns
asset_returns = calculate_returns(asset_prices, alpha_length)
benchmark_returns = calculate_returns(benchmark_prices, alpha_length)
// Get beta for expected return calculation
beta = f_calc_beta(asset_prices, benchmark_prices, beta_length)
// Average returns over period
avg_asset_return = array_average(asset_returns) * 100
avg_benchmark_return = array_average(benchmark_returns) * 100
// Expected return using CAPM: E(R) = Beta * Market_Return + Risk_Free_Rate
expected_return = beta * avg_benchmark_return + risk_free_rate
// Alpha = Actual Return - Expected Return
alpha = avg_asset_return - expected_return
Beta Calculation (Volatility Relationship):
// Beta measures how much an asset moves relative to benchmark
f_calc_beta(asset_prices, benchmark_prices, length) =>
// Calculate return series for both assets
asset_returns =
benchmark_returns =
// Populate return arrays
for i = 0 to length - 1
asset_return = (current_price - previous_price) / previous_price
benchmark_return = (current_bench - previous_bench) / previous_bench
// Calculate covariance and variance
covariance = calculate_covariance(asset_returns, benchmark_returns)
benchmark_variance = calculate_variance(benchmark_returns)
// Beta = Covariance(Asset, Market) / Variance(Market)
beta = covariance / benchmark_variance
Filtering Applications:
Alpha Filter: Only includes assets with alpha above specified threshold (e.g., >0.5% monthly excess return)
Beta Filter: Screens for desired volatility characteristics (e.g., beta >1.0 for aggressive assets)
Combined Screening: Both filters must pass for asset qualification
Dynamic Thresholds: User-configurable parameters for different market conditions
4. Intelligent Tie-Breaking Resolution System
When multiple assets have identical dominance scores, the system employs sophisticated methods to determine final rankings.
Standard Tie-Breaking Hierarchy:
// Primary tie-breaking logic
if score_i == score_j // Tied dominance scores
// Level 1: Compare Beta values (higher beta wins)
beta_i = array.get(beta_values, i)
beta_j = array.get(beta_values, j)
if beta_j > beta_i
swap_positions(i, j)
else if beta_j == beta_i
// Level 2: Compare Alpha values (higher alpha wins)
alpha_i = array.get(alpha_values, i)
alpha_j = array.get(alpha_values, j)
if alpha_j > alpha_i
swap_positions(i, j)
Advanced Tie-Breaking (Head-to-Head Analysis):
For the top 3 performers, an enhanced tie-breaking mechanism analyzes direct head-to-head price ratio performance:
// Advanced tie-breaker for top performers
f_advanced_tiebreaker(asset1_idx, asset2_idx, lookback_period) =>
// Calculate price ratio over lookback period
ratio_history =
for k = 0 to lookback_period - 1
price_ratio = price_asset1 / price_asset2
array.push(ratio_history, price_ratio)
// Apply simplified trend analysis to ratio
current_ratio = array.get(ratio_history, 0)
average_ratio = calculate_average(ratio_history)
// Asset 1 wins if current ratio > average (trending up)
if current_ratio > average_ratio
return 1 // Asset 1 dominates
else
return -1 // Asset 2 dominates
5. Five-Component Aggregate Market Regime Filter
This sophisticated framework combines multiple statistical tests to determine whether market conditions favor trending strategies or require defensive positioning.
Component 1: Augmented Dickey-Fuller (ADF) Test
Tests for unit root presence to distinguish between trending and mean-reverting price series.
// Simplified ADF implementation
calculate_adf_statistic(price_series, lookback) =>
// Calculate first differences
differences =
for i = 0 to lookback - 2
diff = price_series - price_series
array.push(differences, diff)
// Statistical analysis of differences
mean_diff = calculate_mean(differences)
std_diff = calculate_standard_deviation(differences)
// ADF statistic approximation
adf_stat = mean_diff / std_diff
// Compare against threshold for trend determination
is_trending = adf_stat <= adf_threshold
Component 2: Directional Movement Index (DMI)
Classic Wilder indicator measuring trend strength through directional movement analysis.
// DMI calculation for trend strength
calculate_dmi_signal(high_data, low_data, close_data, period) =>
// Calculate directional movements
plus_dm_sum = 0.0
minus_dm_sum = 0.0
true_range_sum = 0.0
for i = 1 to period
// Directional movements
up_move = high_data - high_data
down_move = low_data - low_data
// Accumulate positive/negative movements
if up_move > down_move and up_move > 0
plus_dm_sum += up_move
if down_move > up_move and down_move > 0
minus_dm_sum += down_move
// True range calculation
true_range_sum += calculate_true_range(i)
// Calculate directional indicators
di_plus = 100 * plus_dm_sum / true_range_sum
di_minus = 100 * minus_dm_sum / true_range_sum
// ADX calculation
dx = 100 * math.abs(di_plus - di_minus) / (di_plus + di_minus)
adx = dx // Simplified for demonstration
// Trending if ADX above threshold
is_trending = adx > dmi_threshold
Component 3: KPSS Stationarity Test
Complementary test to ADF that examines stationarity around trend components.
// KPSS test implementation
calculate_kpss_statistic(price_series, lookback, significance_level) =>
// Calculate mean and variance
series_mean = calculate_mean(price_series, lookback)
series_variance = calculate_variance(price_series, lookback)
// Cumulative sum of deviations
cumulative_sum = 0.0
cumsum_squared_sum = 0.0
for i = 0 to lookback - 1
deviation = price_series - series_mean
cumulative_sum += deviation
cumsum_squared_sum += math.pow(cumulative_sum, 2)
// KPSS statistic
kpss_stat = cumsum_squared_sum / (lookback * lookback * series_variance)
// Compare against critical values
critical_value = significance_level == 0.01 ? 0.739 :
significance_level == 0.05 ? 0.463 : 0.347
is_trending = kpss_stat >= critical_value
Component 4: Choppiness Index
Measures market directionality using fractal dimension analysis of price movement.
// Choppiness Index calculation
calculate_choppiness(price_data, period) =>
// Find highest and lowest over period
highest = price_data
lowest = price_data
true_range_sum = 0.0
for i = 0 to period - 1
if price_data > highest
highest := price_data
if price_data < lowest
lowest := price_data
// Accumulate true range
if i > 0
true_range = calculate_true_range(price_data, i)
true_range_sum += true_range
// Choppiness calculation
range_high_low = highest - lowest
choppiness = 100 * math.log10(true_range_sum / range_high_low) / math.log10(period)
// Trending if choppiness below threshold (typically 61.8)
is_trending = choppiness < 61.8
Component 5: Hilbert Transform Analysis
Phase-based cycle detection and trend identification using mathematical signal processing.
// Hilbert Transform trend detection
calculate_hilbert_signal(price_data, smoothing_period, filter_period) =>
// Smooth the price data
smoothed_price = calculate_moving_average(price_data, smoothing_period)
// Calculate instantaneous phase components
// Simplified implementation for demonstration
instant_phase = smoothed_price
delayed_phase = calculate_moving_average(price_data, filter_period)
// Compare instantaneous vs delayed signals
phase_difference = instant_phase - delayed_phase
// Trending if instantaneous leads delayed
is_trending = phase_difference > 0
Aggregate Regime Determination:
// Combine all five components
regime_calculation() =>
trending_count = 0
total_components = 0
// Test each enabled component
if enable_adf and adf_signal == 1
trending_count += 1
if enable_adf
total_components += 1
// Repeat for all five components...
// Calculate trending proportion
trending_proportion = trending_count / total_components
// Market is trending if proportion above threshold
regime_allows_trading = trending_proportion >= regime_threshold
The system only allows asset positions when the specified percentage of components indicate trending conditions. During choppy or mean-reverting periods, the system automatically positions in USD to preserve capital.
6. Dynamic Portfolio Weighting Framework
Six sophisticated allocation methodologies provide flexibility for different market conditions and risk preferences.
Weighting Method Implementations:
1. Equal Weight Distribution:
// Simple equal allocation
if weighting_mode == "Equal Weight"
weight_per_asset = 1.0 / selection_count
for i = 0 to selection_count - 1
array.push(weights, weight_per_asset)
2. Linear Dominance Scaling:
// Linear scaling based on dominance scores
if weighting_mode == "Linear Dominance"
// Normalize scores to 0-1 range
min_score = array.min(dominance_scores)
max_score = array.max(dominance_scores)
score_range = max_score - min_score
total_weight = 0.0
for i = 0 to selection_count - 1
score = array.get(dominance_scores, i)
normalized = (score - min_score) / score_range
weight = 1.0 + normalized * concentration_factor
array.push(weights, weight)
total_weight += weight
// Normalize to sum to 1.0
for i = 0 to selection_count - 1
current_weight = array.get(weights, i)
array.set(weights, i, current_weight / total_weight)
3. Conviction Score (Exponential):
// Exponential scaling for high conviction
if weighting_mode == "Conviction Score"
// Combine dominance score with DBBMD strength
conviction_scores =
for i = 0 to selection_count - 1
dominance = array.get(dominance_scores, i)
dbbmd_strength = array.get(dbbmd_values, i)
conviction = dominance + (dbbmd_strength - 50) / 25
array.push(conviction_scores, conviction)
// Exponential weighting
total_weight = 0.0
for i = 0 to selection_count - 1
conviction = array.get(conviction_scores, i)
normalized = normalize_score(conviction)
weight = math.pow(1 + normalized, concentration_factor)
array.push(weights, weight)
total_weight += weight
// Final normalization
normalize_weights(weights, total_weight)
Advanced Features:
Minimum Position Constraint: Prevents dust allocations below specified threshold
Concentration Factor: Adjustable parameter controlling weight distribution aggressiveness
Dominance Boost: Extra weight for assets exceeding specified dominance thresholds
Dynamic Rebalancing: Automatic weight recalculation on portfolio changes
7. Intelligent USD Management System
The system treats USD as a competing asset with its own dominance score, enabling sophisticated cash management.
USD Scoring Methodologies:
Smart Competition Mode (Recommended):
f_calculate_smart_usd_dominance() =>
usd_wins = 0
// USD beats assets in downtrends or weak uptrends
for i = 0 to active_count - 1
asset_state = get_asset_state(i)
asset_dbbmd = get_asset_dbbmd(i)
// USD dominates shorts and weak longs
if asset_state == -1 or (asset_state == 1 and asset_dbbmd < long_threshold)
usd_wins += 1
// Calculate Copeland-style score
base_score = usd_wins - (active_count - usd_wins)
// Boost during weak market conditions
qualified_assets = count_qualified_long_assets()
if qualified_assets <= active_count * 0.2
base_score := math.round(base_score * usd_boost_factor)
base_score
Auto Short Count Mode:
// USD dominance based on number of bearish assets
usd_dominance = count_assets_in_short_state()
// Apply boost during low activity
if qualified_long_count <= active_count * 0.2
usd_dominance := usd_dominance * usd_boost_factor
Regime-Based USD Positioning:
When the five-component regime filter indicates unfavorable conditions, the system automatically overrides all asset signals and positions 100% in USD, protecting capital during choppy markets.
8. Multi-Asset Infrastructure & Data Management
The system maintains comprehensive data structures for up to 39 assets simultaneously.
Data Collection Framework:
// Full OHLC data matrices (200 bars depth for performance)
var matrix open_data = matrix.new(39, 200, na)
var matrix high_data = matrix.new(39, 200, na)
var matrix low_data = matrix.new(39, 200, na)
var matrix close_data = matrix.new(39, 200, na)
// Real-time data collection
if barstate.isconfirmed
for i = 0 to active_count - 1
ticker = array.get(assets, i)
= request.security(ticker, timeframe.period,
[open , high , low , close ],
lookahead=barmerge.lookahead_off)
// Store in matrices with proper shifting
matrix.set(open_data, i, 0, nz(o, 0))
matrix.set(high_data, i, 0, nz(h, 0))
matrix.set(low_data, i, 0, nz(l, 0))
matrix.set(close_data, i, 0, nz(c, 0))
Asset Configuration:
The system comes pre-configured with 39 major cryptocurrency pairs across multiple exchanges:
Major Pairs: BTC, ETH, XRP, SOL, DOGE, ADA, etc.
Exchange Coverage: Binance, KuCoin, MEXC for optimal liquidity
Configurable Count: Users can activate 2-39 assets based on preferences
Custom Tickers: All asset selections are user-modifiable
---
⚙️ COMPREHENSIVE CONFIGURATION GUIDE
Portfolio Management Settings
Maximum Portfolio Size (1-10):
Conservative (1-2): High concentration, captures strong trends
Balanced (3-5): Moderate diversification with trend focus
Diversified (6-10): Lower concentration, broader market exposure
Dominance Clarity Threshold (0.1-1.0):
Low (0.1-0.4): Prefers diversification, holds multiple assets frequently
Medium (0.5-0.7): Balanced approach, context-dependent allocation
High (0.8-1.0): Concentration-focused, single asset preference
Signal Generation Parameters
DBBMD Thresholds:
// Standard configuration
primary_long_threshold = 71 // Conservative: 75+, Aggressive: 65-70
primary_short_threshold = 33 // Conservative: 25-30, Aggressive: 35-40
// BB System parameters
bb1_ma_len = 40 // Fast system: 20-50
bb1_sd_len = 65 // Stability: 50-80
bb2_ma_len = 8 // Trend: 60-100
bb2_sd_len = 66 // Sensitivity: 10-20
Risk Management Configuration
Alpha/Beta Filters:
Alpha Threshold: 0.0-2.0% (higher = more selective)
Beta Threshold: 0.5-2.0 (1.0+ for aggressive assets)
Calculation Periods: 20-50 bars (longer = more stable)
Regime Filter Settings:
Trending Threshold: 0.3-0.8 (higher = stricter trend requirements)
Component Lookbacks: 30-100 bars (balance responsiveness vs stability)
Enable/Disable: Individual component control for customization
---
📊 PERFORMANCE TRACKING & VISUALIZATION
Real-Time Dashboard Features
The compact dashboard provides essential information:
Current Holdings: Asset names and allocation percentages
Dominance Score: Current position's relative strength ranking
Active Assets: Qualified long signals vs total asset count
Returns: Total portfolio performance percentage
Maximum Drawdown: Peak-to-trough decline measurement
Trade Count: Total portfolio transitions executed
Regime Status: Current market condition assessment
Comprehensive Ranking Table
The left-side table displays detailed asset analysis:
Ranking Position: Numerical order by dominance score
Asset Symbol: Clean ticker identification with color coding
Dominance Score: Net wins minus losses in head-to-head comparisons
Win-Loss Record: Detailed breakdown of dominance relationships
DBBMD Reading: Current momentum percentage with threshold highlighting
Alpha/Beta Values: Fundamental analysis metrics when filters enabled
Portfolio Weight: Current allocation percentage in signal portfolio
Execution Status: Visual indicator of actual holdings vs signals
Visual Enhancement Features
Color-Coded Assets: 39 distinct colors for easy identification
Regime Background: Red tinting during unfavorable market conditions
Dynamic Equity Curve: Portfolio value plotted with position-based coloring
Status Indicators: Symbols showing execution vs signal states
---
🔍 ADVANCED TECHNICAL FEATURES
State Persistence System
The system maintains asset states across bars to prevent excessive switching:
// State tracking for each asset and ratio combination
var array asset_states = array.new(1560, 0) // 39 * 40 ratios
// State changes only occur on confirmed threshold breaks
if long_crossover and current_state != 1
current_state := 1
array.set(asset_states, asset_index, 1)
else if short_crossover and current_state != -1
current_state := -1
array.set(asset_states, asset_index, -1)
Transaction Cost Integration
Realistic modeling of trading expenses:
// Transaction cost calculation
transaction_fee = 0.4 // Default 0.4% (fees + slippage)
// Applied on portfolio transitions
if should_execute_transition
was_holding_assets = check_current_holdings()
will_hold_assets = check_new_signals()
// Charge fees for meaningful transitions
if transaction_fee > 0 and (was_holding_assets or will_hold_assets)
fee_amount = equity * (transaction_fee / 100)
equity -= fee_amount
total_fees += fee_amount
Dynamic Memory Management
Optimized data structures for performance:
200-Bar History: Sufficient for calculations while maintaining speed
Matrix Operations: Efficient storage and retrieval of multi-asset data
Array Recycling: Memory-conscious data handling for long-running backtests
Conditional Calculations: Skip unnecessary computations during initialization
12H 30 assets portfolio
---
🚨 SYSTEM LIMITATIONS & TESTING STATUS
CURRENT DEVELOPMENT PHASE: ACTIVE TESTING & OPTIMIZATION
This system represents cutting-edge algorithmic trading technology but remains in continuous development. Key considerations:
Known Limitations:
Requires significant computational resources for 39-asset analysis
Performance varies significantly across different market conditions
Complex parameter interactions may require extensive optimization
Slippage and liquidity constraints not fully modeled for all assets
No consideration for market impact in large position sizes
Areas Under Active Development:
Enhanced regime detection algorithms
Improved transaction cost modeling
Additional portfolio weighting methodologies
Machine learning integration for parameter optimization
Cross-timeframe analysis capabilities
---
🔒 ANTI-REPAINTING ARCHITECTURE & LIVE TRADING READINESS
One of the most critical aspects of any trading system is ensuring that signals and calculations are based on confirmed, historical data rather than current bar information that can change throughout the trading session. This system implements comprehensive anti-repainting measures to ensure 100% reliability for live trading .
The Repainting Problem in Trading Systems
Repainting occurs when an indicator uses current, unconfirmed bar data in its calculations, causing:
False Historical Signals: Backtests appear better than reality because calculations change as bars develop
Live Trading Failures: Signals that looked profitable in testing fail when deployed in real markets
Inconsistent Results: Different results when running the same indicator at different times during a trading session
Misleading Performance: Inflated win rates and returns that cannot be replicated in practice
GForge Anti-Repainting Implementation
This system eliminates repainting through multiple technical safeguards:
1. Historical Data Usage for All Calculations
// CRITICAL: All calculations use PREVIOUS bar data (note the offset)
= request.security(ticker, timeframe.period,
[open , high , low , close , close],
lookahead=barmerge.lookahead_off)
// Store confirmed previous bar OHLC for calculations
matrix.set(open_data, i, 0, nz(o1, 0)) // Previous bar open
matrix.set(high_data, i, 0, nz(h1, 0)) // Previous bar high
matrix.set(low_data, i, 0, nz(l1, 0)) // Previous bar low
matrix.set(close_data, i, 0, nz(c1, 0)) // Previous bar close
// Current bar close only for visualization
matrix.set(current_prices, i, 0, nz(c0, 0)) // Live price display
2. Confirmed Bar State Processing
// Only process data when bars are confirmed and closed
if barstate.isconfirmed
// All signal generation and portfolio decisions occur here
// using only historical, unchanging data
// Shift historical data arrays
for i = 0 to active_count - 1
for bar = math.min(data_bars, 199) to 1
// Move confirmed data through historical matrices
old_data = matrix.get(close_data, i, bar - 1)
matrix.set(close_data, i, bar, old_data)
// Process new confirmed bar data
calculate_all_signals_and_dominance()
3. Lookahead Prevention
// Explicit lookahead prevention in all security calls
request.security(ticker, timeframe.period, expression,
lookahead=barmerge.lookahead_off)
// This ensures no future data can influence current calculations
// Essential for maintaining signal integrity across all timeframes
4. State Persistence with Historical Validation
// Asset states only change based on confirmed threshold breaks
// using historical data that cannot change
var array asset_states = array.new(1560, 0)
// State changes use only confirmed, previous bar calculations
if barstate.isconfirmed
=
f_calculate_enhanced_dbbmd(confirmed_price_array, ...)
// Only update states after bar confirmation
if long_crossover_confirmed and current_state != 1
current_state := 1
array.set(asset_states, asset_index, 1)
Live Trading vs. Backtesting Consistency
The system's architecture ensures identical behavior in both environments:
Backtesting Mode:
Uses historical offset data for all calculations
Processes confirmed bars with `barstate.isconfirmed`
Maintains identical signal generation logic
No access to future information
Live Trading Mode:
Uses same historical offset data structure
Waits for bar confirmation before signal updates
Identical mathematical calculations and thresholds
Real-time price display without affecting signals
Technical Implementation Details
Data Collection Timing
// Example of proper data collection timing
if barstate.isconfirmed // Wait for bar to close
// Collect PREVIOUS bar's confirmed OHLC data
for i = 0 to active_count - 1
ticker = array.get(assets, i)
// Get confirmed previous bar data (note offset)
=
request.security(ticker, timeframe.period,
[open , high , low , close , close],
lookahead=barmerge.lookahead_off)
// ALL calculations use prev_* values
// current_close only for real-time display
portfolio_calculations_use_previous_bar_data()
Signal Generation Process
// Signal generation workflow (simplified)
if barstate.isconfirmed and data_bars >= minimum_required_bars
// Step 1: Calculate DBBMD using historical price arrays
for i = 0 to active_count - 1
historical_prices = get_confirmed_price_history(i) // Uses offset data
= calculate_dbbmd(historical_prices)
update_asset_state(i, state)
// Step 2: Build dominance matrix using confirmed data
calculate_dominance_relationships() // All historical data
// Step 3: Generate portfolio signals
new_portfolio = generate_target_portfolio() // Based on confirmed calculations
// Step 4: Compare with previous signals for changes
if portfolio_signals_changed()
execute_portfolio_transition()
Verification Methods for Users
Users can verify the anti-repainting behavior through several methods:
1. Historical Replay Test
Run the indicator on historical data
Note signal timing and portfolio changes
Replay the same period - signals should be identical
No retroactive changes in historical signals
2. Intraday Consistency Check
Load indicator during active trading session
Observe that previous day's signals remain unchanged
Only current day's final bar should show potential signal changes
Refresh indicator - historical signals should be identical
Live Trading Deployment Considerations
Data Quality Assurance
Exchange Connectivity: Ensure reliable data feeds for all 39 assets
Missing Data Handling: System includes safeguards for data gaps
Price Validation: Automatic filtering of obvious price errors
Timeframe Synchronization: All assets synchronized to same bar timing
Performance Impact of Anti-Repainting Measures
The robust anti-repainting implementation requires additional computational resources:
Memory Usage: 200-bar historical data storage for 39 assets
Processing Delay: Signals update only after bar confirmation
Calculation Overhead: Multiple historical data validations
Alert Timing: Slight delay compared to current-bar indicators
However, these trade-offs are essential for reliable live trading performance and accurate backtesting results.
Critical: Equity Curve Anti-Repainting Architecture
The most sophisticated aspect of this system's anti-repainting design is the temporal separation between signal generation and performance calculation . This creates a realistic trading simulation that perfectly matches live trading execution.
The Timing Sequence
// STEP 1: Store what we HELD during the current bar (for performance calc)
if barstate.isconfirmed
// Record positions that were active during this bar
array.clear(held_portfolio)
array.clear(held_weights)
for i = 0 to array.size(execution_portfolio) - 1
array.push(held_portfolio, array.get(execution_portfolio, i))
array.push(held_weights, array.get(execution_weights, i))
// STEP 2: Calculate performance based on what we HELD
portfolio_return = 0.0
for i = 0 to array.size(held_portfolio) - 1
held_asset = array.get(held_portfolio, i)
held_weight = array.get(held_weights, i)
// Performance from current_price vs reference_price
// This is what we ACTUALLY earned during this bar
if held_asset != "USD"
current_price = get_current_price(held_asset) // End of bar
reference_price = get_reference_price(held_asset) // Start of bar
asset_return = (current_price - reference_price) / reference_price
portfolio_return += asset_return * held_weight
// STEP 3: Apply return to equity (realistic timing)
equity := equity * (1 + portfolio_return)
// STEP 4: Generate NEW signals for NEXT period (using confirmed data)
= f_generate_target_portfolio()
// STEP 5: Execute transitions if signals changed
if signal_changed
// Update execution_portfolio for NEXT bar
array.clear(execution_portfolio)
array.clear(execution_weights)
for i = 0 to array.size(new_signal_portfolio) - 1
array.push(execution_portfolio, array.get(new_signal_portfolio, i))
array.push(execution_weights, array.get(new_signal_weights, i))
Why This Prevents Equity Curve Repainting
Performance Attribution: Returns are calculated based on positions that were **actually held** during each bar, not future signals
Signal Timing: New signals are generated **after** performance calculation, affecting only **future** bars
Realistic Execution: Mimics real trading where you earn returns on current positions while planning future moves
No Retroactive Changes: Once a bar closes, its performance contribution to equity is permanent and unchangeable
The One-Bar Offset Mechanism
This system implements a critical one-bar timing offset:
// Bar N: Performance Calculation
// ================================
// 1. Calculate returns on positions held during Bar N
// 2. Update equity based on actual holdings during Bar N
// 3. Plot equity point for Bar N (based on what we HELD)
// Bar N: Signal Generation
// ========================
// 4. Generate signals for Bar N+1 (using confirmed Bar N data)
// 5. Send alerts for what will be held during Bar N+1
// 6. Update execution_portfolio for Bar N+1
// Bar N+1: The Cycle Continues
// =============================
// 1. Performance calculated on positions from Bar N signals
// 2. New signals generated for Bar N+2
Alert System Timing
The alert system reflects this sophisticated timing:
Transaction Cost Realism
Even transaction costs follow realistic timing:
// Fees applied when transitioning between different portfolios
if should_execute_transition
// Charge fees BEFORE taking new positions (realistic timing)
if transaction_fee > 0
fee_amount = equity * (transaction_fee / 100)
equity -= fee_amount // Immediate cost impact
total_fees += fee_amount
// THEN update to new portfolio
update_execution_portfolio(new_signals)
transitions += 1
// Fees reduce equity immediately, affecting all future calculations
// This matches real trading where fees are deducted upon execution
LIVE TRADING CERTIFICATION:
This system has been specifically designed and tested for live trading deployment. The comprehensive anti-repainting measures ensure that:
Backtesting results accurately represent real trading potential
Signals are generated using only confirmed, historical data
No retroactive changes can occur to previously generated signals
Portfolio transitions are based on reliable, unchanging calculations
Performance metrics reflect realistic trading outcomes including proper timing
Users can deploy this system with confidence that live trading results will closely match backtesting performance, subject to normal market execution factors such as slippage and liquidity.
---
⚡ ALERT SYSTEM & AUTOMATION
The system provides comprehensive alerting for automation and monitoring:
Available Alert Conditions
Portfolio Signal Change: Triggered when new portfolio composition is generated
Regime Override Active: Alerts when market regime forces USD positioning
Individual Asset Signals: Can be configured for specific asset transitions
Performance Thresholds: Drawdown or return-based notifications
---
📈 BACKTESTING & PERFORMANCE ANALYSIS
8 Comprehensive Metrics Tracking
The system maintains detailed performance statistics:
Equity Curve: Real-time portfolio value progression
Returns Calculation: Total and annualized performance metrics
Drawdown Analysis: Peak-to-trough decline measurements
Transaction Counting: Portfolio transition frequency
Fee Tracking: Cumulative transaction cost impact
Win Rate Analysis: Success rate of position changes
Backtesting Configuration
// Backtesting parameters
initial_capital = 10000.0 // Starting capital
use_custom_start = true // Enable specific start date
custom_start = timestamp("2023-09-01") // Backtest beginning
transaction_fee = 0.4 // Combined fees and slippage %
// Performance calculation
total_return = (equity - initial_capital) / initial_capital * 100
current_drawdown = (peak_equity - equity) / peak_equity * 100
---
🔧 TROUBLESHOOTING & OPTIMIZATION
Common Configuration Issues
Insufficient Data: Ensure 100+ bars available before start date
[*} Not Compiling: Go on an asset's price chart with 2 or 3 years of data to
make the system compile or just simply reapply the indicator again
Too Many Assets: Reduce active count if experiencing timeouts
Regime Filter Too Strict: Lower trending threshold if always in USD
Excessive Switching: Increase MD multiplier or adjust thresholds
---
💡 USER FEEDBACK & ENHANCEMENT REQUESTS
The continuous evolution of this system depends heavily on user experience and community feedback. Your insights will help motivate me for new improvements and new feature developments.
---
⚖️ FINAL COMPREHENSIVE RISK DISCLAIMER
TRADING INVOLVES SUBSTANTIAL RISK OF LOSS
This indicator is a sophisticated analytical tool designed for educational and research purposes. Important warnings and considerations:
System Limitations:
No algorithmic system can guarantee profitable outcomes
Complex systems may fail in unexpected ways during extreme market events
Historical backtesting does not account for all real-world trading challenges
Slippage, liquidity constraints, and market impact can significantly affect results
System parameters require careful optimization and ongoing monitoring
The creator and distributor of this indicator assume no liability for any financial losses, system failures, or adverse outcomes resulting from its use. This tool is provided "as is" without any warranties, express or implied.
By using this indicator, you acknowledge that you have read, understood, and agreed to assume all risks associated with algorithmic trading and cryptocurrency investments.
RT-Signal LiteRT-Signal Lite — Learning & Price-Action Companion (EN)
Protected script – source code is not visible. Educational tool for learning structured entries, filters and risk management.
What it is
RT-Signal Lite is a learning-first price-action indicator that helps you turn chart context into repeatable entries. It combines a score engine (trend, momentum, volume, divergences) with optional pattern/structure filters, a clear signal panel, and a visual TP/SL ladder in R-multiples.
How it helps you learn
• Practice exact entry logic (Cross/Pullback/Breakout with optional Retest).
• See why a setup is allowed or blocked (FVG/HTF proximity, ADX/DI, Volume Z, Liquidity sweep etc.).
• Train risk thinking with R-based TP ladder, BE/Trailing, “SL-Fishing” concept and a compact monthly performance table (educational only).
• Multi-TF RSI panel + simple market labels keep the big picture in view.
• Works great in Replay mode for bar-by-bar drills.
Quick start
Pick a supported timeframe (3/5/15/30/45/60/240/D by default; or add your own in Settings → Timeframe-Gate).
Choose an Entry Mode : CrossOnly / Pullback / Breakout (with ATR buffer) / Retest / Any.
Keep default risk presets (ATR or Structure SL, TP1 in R, step in R, optional BE/Trailing).
Read the Signal Box : direction, Entry/SL/SL-Fishing, TP1…TPn, status, VIX/VDAX state, score & confidence.
Use Trend Box for MTF RSI and a quick checklist (Breakout, Volume OK, Divergence, VIX allowed).
Train in Replay → journal your decisions.
Main features (Lite)
• Entry engine : SMA cross, EMA pullback bounce, prior HH/LL breakout with ATR buffer, optional strict Retest window; candlestick assists (Hammer/Shooting Star, Engulfing, Morning/Evening Star, Doji, Inside Bar, 3 Soldiers/Crows).
• Filters : ADX/DI thresholds (TF-aware), Volume (level & Z-score), RSI divergences (pivot-anchored), ATR/Close regime, FOMO-bar guard, Liquidity sweep window, Opposite Order-Block distance, FVG zone gating, HTF zone proximity, optional VIX/VDAX gate (auto picks VDAX for DAX).
• Structure : Support/Resistance lines, classical FVG (lifetime & mitigation), robust Order-Blocks with separate states and mitigation logic.
• Scanners : Triangle breakout (Lite).
• Risk & exits : Structure/ATR SL, SL-Fishing buffer, TP ladder in R (TP1…TPn), optional BE & Trailing after TP1, cooldown, max bars in trade.
• UI : Signal Box, Trend Box, local trade boxes/lines (entry/sl/tp), watermark, monthly performance table (one outcome per trade: highest TP or SL-Fishing; counted by exit/entry month – for learning only).
• Alerts : Alerts are available in PRO only.
• Privacy : Compiled & protected; source code is not visible.
Key inputs (short list)
Entry mode • Breakout ATR buffer • Retest window/strict • Pullback bounce •
Risk: min R:R, Structure/ATR SL, ATR multiplier, TP ladder, BE/Trail, Cooldown •
Filters: ADX/DI, Volume/Z, ATR regime, RSI limits, FVG/HTF gates, Liquidity sweep, Opp. OB distance •
Scanners: Triangle (Lite) • RSI-MTF toggles • Visuals (Signal/Trend boxes, SR, OB/FVG).
Markets & timeframes
Indices (US/DE), commodities, crypto, forex, stocks.
Works on the whitelisted/custom TFs (e.g., 3/5/15/30/45/60/240/D). Heikin-Ashi and some feeds may change results; volume-based filters need reliable volume.
Best practice (learning workflow)
• Start with 5m/15m/1h on liquid symbols.
• Train in Replay: define entry, see blockers, adjust rules, collect screenshots.
• Move to live observation (paper/sim) only after you can explain every entry/avoidance.
• Use strict risk: position sizing to SL, no over-optimization, no promises.
FAQ — “No signal?” (common blockers)
TF not allowed • Cooldown active • ADX/DI below threshold • VIX/VDAX gate off •
Retest not hit yet • FVG/HTF gate blocking • FOMO bar filtered • Min R:R to next level not met • Opposite OB too close • Liquidity sweep window not satisfied.
PRO upgrade
Adds alerts and extra scanners (Range/Channel/Double-Top/Bottom), more visualization and flexibility. Links are provided inside the script under Settings → Info .
Disclaimer
For educational purposes only. No financial advice. No performance guarantee. Always validate signals in context (structure, liquidity, volatility, news). You are fully responsible for your decisions and risk.

Chhatrapati Indicator by TradeNitiX ⚔️ Chhatrapati Indicator by TradeNitiX
A precision-driven trading system built to capture strong trends and avoid market noise. It blends range filtering, momentum checks, and volatility-based risk control for clean, confident entries and exits.
🔍 Core Strategy Components
1. Range Filter – Trend Detection
2. RSI – Momentum Confirmation
3. ADX – Trend Strength Filter
4. ATR – Volatility-Based Risk Management
💎 Highlights – Chhatrapati Indicator
✔ Display Profit/Loss values above each candle
✅ Clear Buy/Sell Signals – No guesswork, just precision entries and exits
📊 High Accuracy – Filters out false signals using multi-layer confirmation
⚡ Beginner-Friendly – Simple logic, powerful results for all skill levels
🔥 Multi-Market Compatibility – Works seamlessly on Forex, crypto, indices, stocks
🎯 Volatility-Based Risk Control – ATR-driven SL/TP for realistic, dynamic targets
🧠 Smart Trend Detection – Combines range filtering with ADX for strong setups
💡 Live Trade Demos – Real-time examples to build trader confidence
📈 Momentum + Strength Filters – RSI + ADX combo avoids weak or choppy trades
🛡️ Risk-Reward Focused – Built-in 3:1 RR logic for disciplined growth
🚀 Tested & Trusted – Proven results across multiple market conditions
⚙️ Key Advantages of Chhatrapati Indicator
✅ Noise-Free Trend Detection – Filters weak moves, locks onto strong trends
📊 RSI + ADX Confirmation – Only trades with real momentum and strength
🎯 ATR-Based Risk Control – Smart SL/TP placement, adapts to volatility
⏱️ Multi-Timeframe Ready – Works for scalping, swing, and intraday setups
👁️ Visual Clarity – Clean signals, SL/TP zones, and trend markers
🎯 Ideal Users
✔ Trend Followers – Ride strong moves with confidence
✔ Swing Traders – Target medium-term setups with solid RR
✔ Scalpers – Quick, precise entries with minimal noise
✔ Algo Traders – Use alerts for automated execution
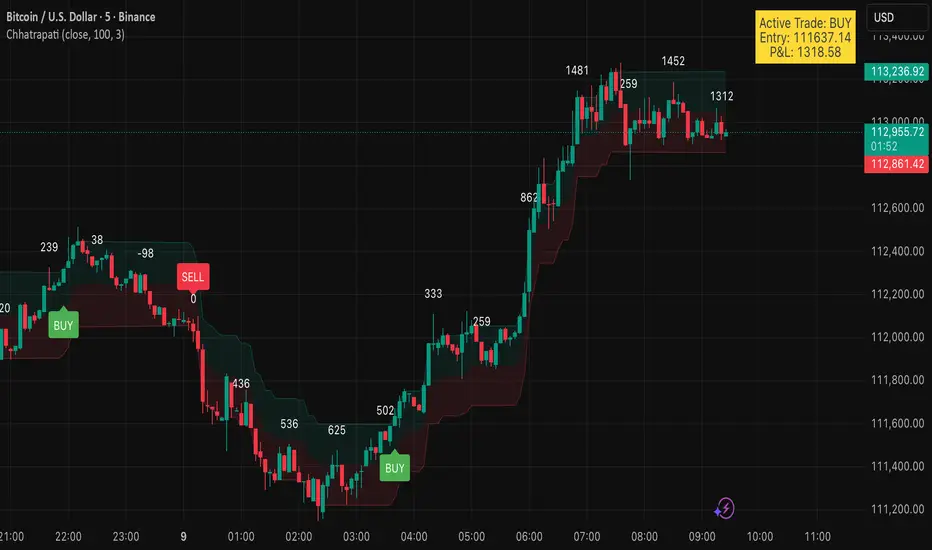
Chhatrapati (TradeNitiX)⚔️ Chhatrapati Indicator by TradeNitiX
A precision-driven trading system built to capture strong trends and avoid market noise. It blends range filtering, momentum checks, and volatility-based risk control for clean, confident entries and exits.
🔍 Core Strategy Components
1. Range Filter – Trend Detection
2. RSI – Momentum Confirmation
3. ADX – Trend Strength Filter
4. ATR – Volatility-Based Risk Management
💎 Highlights – Chhatrapati Indicator
✅ Clear Buy/Sell Signals – No guesswork, just precision entries and exits
📊 High Accuracy – Filters out false signals using multi-layer confirmation
⚡ Beginner-Friendly – Simple logic, powerful results for all skill levels
🔥 Multi-Market Compatibility – Works seamlessly on Forex, crypto, indices, stocks
🎯 Volatility-Based Risk Control – ATR-driven SL/TP for realistic, dynamic targets
🧠 Smart Trend Detection – Combines range filtering with ADX for strong setups
💡 Live Trade Demos – Real-time examples to build trader confidence
📈 Momentum + Strength Filters – RSI + ADX combo avoids weak or choppy trades
🛡️ Risk-Reward Focused – Built-in 3:1 RR logic for disciplined growth
🚀 Tested & Trusted – Proven results across multiple market conditions
⚙️ Key Advantages of Chhatrapati Strategy
✅ Noise-Free Trend Detection – Filters weak moves, locks onto strong trends
📊 RSI + ADX Confirmation – Only trades with real momentum and strength
🎯 ATR-Based Risk Control – Smart SL/TP placement, adapts to volatility
⏱️ Multi-Timeframe Ready – Works for scalping, swing, and intraday setups
👁️ Visual Clarity – Clean signals, SL/TP zones, and trend markers
🎯 Ideal Users
✔ Trend Followers – Ride strong moves with confidence
✔ Swing Traders – Target medium-term setups with solid RR
✔ Scalpers – Quick, precise entries with minimal noise
✔ Algo Traders – Use alerts for automated execution

Malama's Quantum Swing Modulator# Multi-Indicator Swing Analysis with Probability Scoring
## What Makes This Script Original
This script combines pivot point detection with a **weighted scoring system** that dynamically adjusts indicator weights based on market regime (trending vs. ranging). Unlike standard multi-indicator approaches that use fixed weightings, this implementation uses ADX to detect market conditions and automatically rebalances the influence of RSI, MFI, and price deviation components accordingly.
## Core Methodology
**Dynamic Weight Allocation System:**
- **Trending Markets (ADX > 25):** Prioritizes momentum (50% weight) with reduced oscillator influence (20% each for RSI/MFI)
- **Ranging Markets (ADX < 25):** Emphasizes mean reversion signals (40% each for RSI/MFI) with no momentum bias
- **Price Wave Component:** Uses EMA deviation normalized by ATR to measure distance from central tendency
**Pivot-Based Level Analysis:**
- Detects swing highs/lows using configurable left/right lookback periods
- Maintains the most recent pivot levels as key reference points
- Calculates proximity scores based on current price distance from these levels
**Volume Confirmation Logic:**
- Defines "volume entanglement" when current volume exceeds SMA by user-defined factor
- Integrates volume confirmation into confidence scoring rather than signal generation
## Technical Implementation Details
**Scoring Algorithm:**
The script calculates separate bullish and bearish "superposition" scores using:
```
Bullish Score = (RSI_bull × weight) + (MFI_bull × weight) + (price_wave × weight × position_filter) + (momentum × weight)
```
Where:
- RSI_bull = 100 - RSI (inverted for oversold bias)
- MFI_bull = 100 - MFI (inverted for oversold bias)
- Position_filter = Only applies when price is below EMA for bullish signals
- Momentum component = Only active in trending markets
**Confidence Calculation:**
Base confidence starts at 25% and increases based on:
- Market regime alignment (trending/ranging appropriate conditions)
- Volume confirmation presence
- Oscillator extreme readings (RSI < 30 or > 70 in ranging markets)
- Price position relative to wave function (EMA)
**Probability Output:**
Final probability = (Base Score × 0.6) + (Proximity Score × 0.4)
This balances indicator confluence with proximity to identified levels.
## Key Differentiators
**vs. Standard Multi-Indicator Scripts:** Uses regime-based dynamic weighting instead of fixed combinations
**vs. Simple Pivot Indicators:** Adds quantified probability and confidence scoring to pivot levels
**vs. Basic Oscillator Combinations:** Incorporates market structure analysis through ADX regime detection
## Visual Components
**Wave Function Display:** EMA with ATR-based uncertainty bands for trend context
**Pivot Markers:** Clear visualization of detected swing highs and lows
**Analysis Table:** Real-time probability, confidence, and action recommendations for current pivot levels
## Practical Application
The dynamic weighting system helps avoid common pitfalls of multi-indicator analysis:
- Reduces oscillator noise during strong trends by emphasizing momentum
- Increases mean reversion sensitivity during sideways markets
- Provides quantified probability rather than subjective signal interpretation
## Important Limitations
- Requires sufficient historical data for pivot detection and volume calculations
- Probability scores are based on current market regime and may change as conditions evolve
- The scoring system is designed for confluence analysis, not standalone trading decisions
- Past probability accuracy does not guarantee future performance
## Technical Requirements
- Works on all timeframes but requires adequate lookback history
- Volume data required for entanglement calculations
- Best suited for liquid instruments where volume patterns are meaningful
This approach provides a systematic framework for evaluating swing trading opportunities while acknowledging the probabilistic nature of technical analysis.

Gestor DeFi Pools con CFBManual DeFi Strategy Manager
What does this indicator do?
It combines cryptocurrency trading with DeFi strategies:
Trading signals: When to buy/sell based on EMAs and momentum
AAVE management: When to switch collateral between ETH and USDC
Uniswap V3: Optimal ranges for liquidity pools
🚨 Indicator Signals (Quick Reference)
Symbol Meaning Action
▲E Lime Early ETH Start switching to ETH (aggressive)
▲C Green Confirm ETH Confirm switch to ETH (safe)
▲D Teal DCA ETH Scale ETH position (+10%)
▼E Orange Early USDC Start switching to USDC (aggressive)
▼C Red Confirm USDC Confirm switch to USDC (safe)
▼D Dark Red DCA USDC Scale USDC position (-10%)
❌ Dark Red EMERGENCY Repay loan NOW
LP+ Lime Create NEW LP Open liquidity pool
LP? Green LP Opportunity Similar pool available
LP- Orange Close LP Close liquidity pool
REB Yellow Rebalance Adjust pool ranges
WAIT Gray Pause Wait before acting
Graphic Elements
Element Color Description
Blue Line Blue Fast EMA (10)
Red Line Red Slow EMA (55)
Purple Lines Purple CFB Adaptive Bands
Colored Band Green/Yellow/Red LP range (color = risk)
Orange Background Orange Active squeeze
Blue Background Blue Trending market
Red Background Red Strong breakout
🚀 Installation and Basic Setup
Step 1: Installation (MANDATORY)
Open TradingView → Pine Editor
Create new indicator
Copy and paste the full code
Save as "DeFi Strategy Manager"
Add to ETHUSDC 1H chart
Step 2: Basic Configuration (MANDATORY)
Only two parameters need to be configured:
🎯 Strategy Mode:
🟢 Conservative (±20%): 0.05% daily, very low risk
🟡 Balanced (±10%): 0.2% daily, medium risk
🔴 Aggressive Day Trading (±5%): 0.5% daily, high risk
⚡ Ultra Scalper (±2%): 0.8% daily, extreme risk
⏰ Timeframe:
Scalping (minutes): 0.5x narrower ranges
Day Trading (hours): 0.8x narrower ranges
Swing (days): 1.2x wider ranges
Position (weeks): 1.8x wider ranges
✅ Ready to Use!
Once configured:
✅ Indicator calculates everything automatically
✅ CFB Adaptive is enabled by default (recommended)
✅ Machine Learning learns from your signals automatically
✅ Dashboard shows expected profits in real time
## 📊 Dashboard Explicado (TV makes me write this in English, but the dashboard is in Spanish, so...)
El tablero superior derecha muestra información esencial en tiempo real con 15 indicadores clave:
### Configuración y Setup:
- **Estrategia**: Tu modo seleccionado (Conservador/Balanceado/Agresivo/Scalper) + temporalidad
- **Rango Final**: El rango actual de Uniswap V3 después de todos los ajustes automáticos
- **ML Confidence**: Porcentaje de éxito de señales pasadas (70%+ = alta confianza)
- **Config Status**: Comparación con tu perfil base + recomendaciones de ajuste
### Estado del Mercado:
- **Market State**: Tipo de mercado (Tendencial/Lateral) + condiciones de squeeze + dirección
- **CFB Status**: Estado del sistema adaptativo CFB + posición del precio + rango dinámico
### Performance y Retornos:
- **Performance**: Tu retorno actual + ganancias proyectadas diarias/mensuales
- **Expected APY**: Retorno anual esperado con clasificación de riesgo
### Gestión de Pools:
- **Pool Status**: Estado actual de tu pool de liquidez + drift de precio + tiempo activo
- **Pool Ranges**: Rangos de precio específicos superior e inferior + distancias actuales
### Señales y Acciones:
- **Trend Progress**: En qué dirección optimiza la estrategia (ETH/USDC/ninguna)
- **Señal Activa**: Qué señal está ejecutándose ahora (Early/Confirm/DCA)
- **Acción Prioritaria**: Próxima acción recomendada con emoji de estado
### Monitoreo de Riesgo:
- **Risk Level**: Nivel de riesgo de Impermanent Loss + rango de volatilidad del mercado
- **Overall Status**: Estado general del sistema + puntuación para day trading
#### **🔧 Ejemplo de Dashboard Simplificado:**
```
📊 DEFI CFB SMART │ VALOR │ STATUS
─────────────────────┼───────────────────┼──────────────────
Estrategia │ Agresivo DT │ Day Trading
Rango Final │ ±5.8% │ 🟡 MEDIO
Confianza ML │ 67% │ MEDIA (12)
Estado Config │ +15% │ CONFIGURACIÓN OK
Estado Mercado │ Lateral-Release │ ↑BULL DÉBIL
Rendimiento │ 5.2% │ $50/día $1.5K/mes
APY Esperado │ 182% │ 🟡 ALTO
Estado CFB │ ACTIVO ↑$2,247 │ ±6.2%
Estado Pool │ ACTIVO │ 2.3% drift 4h
Rangos Pool │ $2,180-2,314 │ +3.1% / -4.2%
Progreso Trend │ ETH Trend │ DCA Ready
Señal Activa │ ETH DCA │ Scale Up
Acción Prioritaria │ Swap → ETH │ 🔄
Nivel Riesgo │ IL: 🟡 MEDIO │ Vol: 45%ile NORMAL
Estado General │ ✅ NORMAL │ ÓPTIMO DT (1.2x)
🎯 DeFi Context: AAVE Collateral Management
Triangle signals can be used for both traditional trading and AAVE collateral management:
🏦 What is AAVE?
AAVE is a lending protocol where you can:
Deposit collateral (ETH or USDC)
Borrow against that collateral
Switch collateral type to optimize your position
🔄 Two ways to use the signals:
💹 Traditional Trading:
▲ ETH Signal: Buy ETH with fiat
▼ USDC Signal: Sell ETH for fiat
Goal: Profit by buying low and selling high
🏦 AAVE Management (Recommended for DeFi):
▲ Swap → ETH: Switch your collateral from USDC to ETH (expecting ETH to rise)
▼ Swap → USDC: Switch your collateral from ETH to USDC (expecting ETH to fall)
Goal: Optimize collateral value without changing total amount
💡 Practical AAVE Example:
You have $10,000 in USDC as collateral in AAVE
↓
▲E Early ETH appears
↓
You switch your collateral: $10,000 USDC → $10,000 ETH
↓
If ETH rises 20%, your collateral is worth $12,000
↓
▼E Early USDC appears
↓
You switch back: $12,000 ETH → $12,000 USDC
↓
You gained $2,000 by optimizing your collateral
⚠️ Advantages of the AAVE approach:
No extra money needed – use existing collateral
Loan remains active – continue using borrowed USDC for LP
Lower taxes – collateral swaps vs buy/sell
Higher efficiency – optimize without changing main strategy
🎯 Strategies by Profile
🟢 Conservative – "Confirmations Only":
Follow only: ▲C/▼C (Confirmation signals)
Ignore: Early signals (too risky)
Strategy: Switch only when trend is confirmed
Result: Fewer changes, more safety
🟡 Balanced – "Gradual":
Early: ▲E/▼E (25% of position)
Confirm: ▲C/▼C (50% additional)
DCA: ▲D/▼D (remaining 25%)
Result: Balanced risk/optimization
🔴 Aggressive – "Full Cycle":
Early: ▲E/▼E (50% immediately)
Confirm: ▲C/▼C (30% additional)
Each DCA: ▲D/▼D (maintain full optimization)
Result: Maximum optimization, maximum risk
📈 Advanced Configuration (Optional)
🔬 CFB Adaptive MOGALEF (Enabled by Default)
CFB Adaptive Ranges: Smart system that adjusts ranges based on market volatility and momentum.
Enabled (default): Ranges adapt automatically
Disabled: Uses fixed ranges based on your setup
Manual Override: Full manual control if desired
🤖 Machine Learning: Learns from past signals (last 20) and improves accuracy automatically. If ML Signal Quality > 70%, signals are highly reliable.
💰 Yield Optimization: Suggests when to switch between conservative and aggressive for better returns:
"OPTIMAL": Your current setup is fine
"GO CONSERVATIVE": You could earn more with wider, safer ranges
"GO AGGRESSIVE": You could earn more with tighter ranges (more risk!)
📊 Portfolio Tracker: Tracks estimated P&L starting from $10,000. Includes LP and IL fees, excludes gas fees. Use as a trend indicator.
Manual Override (Experts Only)
To customize:
Enable "Override Manual" in Advanced Settings
Manually adjust your preferred range
To return to automatic: disable override
📝 Detailed Input Configuration (Advanced)
👤 Basic User Configuration
Strategy Mode: Select your base risk profile
Conservative (±20%): Prioritize safety over returns. Ideal for beginners or large capital (> $50K)
Balanced (±10%): Balance between safety and returns. Recommended for most users
Aggressive Day Trading (±5%): For active users who monitor frequently. Higher returns, more risk
Scalper Ultra (±2%): For professionals only. Requires constant monitoring
Timeframe: Adjust strategy frequency
Scalping (minutes): 50% narrower ranges. For very active trading
Day Trading (hours): 20% narrower ranges. For review every few hours
Swing (days): 20% wider ranges. For daily review
Position (weeks): 80% wider ranges. For weekly review
🔬 CFB Adaptive MOGALEF
CFB Length (8): Period for CFB filter. Lower = more sensitive
CFB Adaptive Length (20): Period for adaptive volatility. Affects band adjustment speed
CFB Band Multiplier (2.0): Band width. Higher = wider bands
CFB Smoothing (3): Volatility smoothing. Reduces noise
CFB Adaptive Ranges (true): Enable/disable adaptive system
CFB Sensitivity (1.0): Filter sensitivity. 0.3 = conservative, 3.0 = very aggressive
🎛️ Advanced Settings
Dynamic Ranges (true): Adjust ranges based on market conditions
Breakout Protection (true): Automatically widens ranges during breakouts
IL Alerts (true): Shows Impermanent Loss warnings
Manual Override (false): Disables automation, uses manual range
Manual Range % (5.0): Fixed range if override is enabled
📈 TradingLatino Core
Fast EMA (10): Fast moving average period. Lower = more sensitive
Slow EMA (55): Slow moving average period. Determines main trend
ADX Length (14): ADX calculation period. Industry standard
ADX Threshold (23): Minimum ADX to consider strong trend
🏊♂️ Pool Management
Pool Range Tolerance % (20.0): % of price movement considered valid for pool
Missed Opportunity Window (24): Bars to keep missed opportunity visible
Recommendation: Use default settings until familiar with the system. Values are optimized for balance between precision and usability.

FlowScape PredictorFlowScape Predictor is a non-repainting, regime-aware entry qualifier that turns complex market context into two readiness scores (Long & Short, each 0/25/50/75/100) and clean, confirmed-bar signals. It blends three orthogonal pillars so you act only when trend energy, momentum, and location agree:
Regime (energy): ATR-normalized linear-regression slope of a smooth HMA → EMA baseline, gated by ADX to confirm when pressure is meaningful.
Momentum (push): RSI slope alignment so price has directional follow-through, not just drift.
Structure (location): proximity to pivot-confirmed swings, scaled by ATR, so “ready” appears near constructive pullbacks—not mid-trend chases.
A soft ATR cloud wraps the baseline for context. A yellow Predictive Baseline extends beyond the last bar to visualize near-term trajectory. It is visual-only: scores/alerts never use it.
What you see
Baseline line that turns green/red when regime is strong in that direction; gray when weak.
ATR cloud around the baseline (context for stretch and pullbacks).
Scores (Long & Short, 0–100 in steps of 25) and optional “L/S” icons on bar close.
Yellow Predictive Baseline that extends to the right for a few bars (visual trajectory of the smoothed baseline).
The scoring system (simple and transparent)
Each side (Long/Short) sums four binary checks, 25 points each:
Regime aligned: trendStrong is true and LR slope sign favors that side.
Momentum aligned: RSI side (>50 for Long, <50 for Short) and RSI slope confirms direction.
Baseline side: price is above (Long) / below (Short) the baseline.
Location constructive: distance from the last confirmed pivot is healthy (ATR-scaled; not overstretched).
Valid totals are 0, 25, 50, 75, 100.
Best-quality signal: 100/0 (your side/opposite) on bar close.
Good, still valid: 75/0, especially when the missing block is only “location” right as price re-engages the cloud/baseline.
Avoid: 75/25 or any opposition > 0 in a weak (gray) regime.
The Predictive (Kalman) line — what it is and isn’t
The yellow line is a visual forward extension of the smoothed baseline to help you see the current trajectory and time pullback resumptions. It does not predict price and is excluded from scores and alerts.
How it’s built (plain English):
We maintain a one-dimensional Kalman state x as a smoothed estimate of the baseline. Each bar we observe the current baseline z.
The filter adjusts its trust using the Kalman gain K = P / (P + R) and updates:
x := x + K*(z − x), then P := (1 − K)*P + Q.
Q (process noise): Higher Q → expects faster change → tracks turns quicker (less smoothing).
R (measurement noise): Higher R → trusts raw baseline less → smoother, steadier projection.
What you control:
Lead (how many bars forward to draw).
Kalman Q/R (visual smoothness vs. responsiveness).
Toggle the line on/off if you prefer a minimal chart.
Important: The predictive line extends the baseline, not price. It’s a visual timing aid—don’t automate off it.
How to use (step-by-step)
Keep the chart clean and use a standard OHLC/candlestick chart.
Read the regime: Prefer trades with green/red baseline (trendStrong = true).
Check scores on bar close:
Take Long 100 / Short 0 or Long 75 / Short 0 when the chart shows a tidy pullback re-engaging the cloud/baseline.
Mirror the logic for shorts.
Confirm location: If price is > ~1.5 ATR from its reference pivot, let it come back—avoid chasing.
Set alerts: Add an alert on Long Ready or Short Ready; these fire on closed bars only.
Risk management: Use ATR-buffered stops beyond the recent pivot; target fixed-R multiples (e.g., 1.5–3.0R). Manage the trade with the baseline/cloud if you trail.
Best-practice playbook (quick rules)
Green light: 100/0 (best) or 75/0 (good) on bar close in a colored (non-gray) regime.
Location first: Prefer entries near the baseline/cloud right after a pullback, not far above/below it.
Avoid mixed signals: Skip 75/25 and anything with opposition while the baseline is gray.
Use the yellow line with discretion: It helps you see rhythm; it’s not a signal source.
Timeframes & tuning (practical defaults)
Intraday indices/FX (5m–15m): Demand 100/0 in chop; allow 75/0 when ADX is awake and pullback is clean.
Crypto intraday (15m–1h): Prefer 100/0; 75/0 on the first pullback after a regime turn.
Swing (1h–4h/D1): 75/0 is often sufficient; 100/0 is excellent (fewer but cleaner signals).
If choppy: raise ADX threshold, raise the readiness bar (insist on 100/0), or lengthen the RSI slope window.
What makes FlowScape different
Energy-first regime filter: ATR-normalized LR slope + ADX gate yields a consistent read of trend quality across symbols and timeframes.
Location-aware entries: ATR-scaled pivot proximity discourages mid-air chases, encouraging pullback timing.
Separation of concerns: The predictive line is visual-only, while scores/alerts are confirmed on close for non-repainting behavior.
One simple score per side: A single 0–100 readiness figure is easier to tune than juggling multiple indicators.
Transparency & limitations
Scores are coarse by design (25-point blocks). They’re a gatekeeper, not a promise of outcomes.
Pivots confirm after right-side bars, so structure signals appear after swings form (non-repainting by design).
Avoid using non-standard chart types (Heikin Ashi, Renko, Range, etc.) for signals; use a clean, standard chart.
No lookahead, no higher-timeframe requests; alerts fire on closed bars only.
