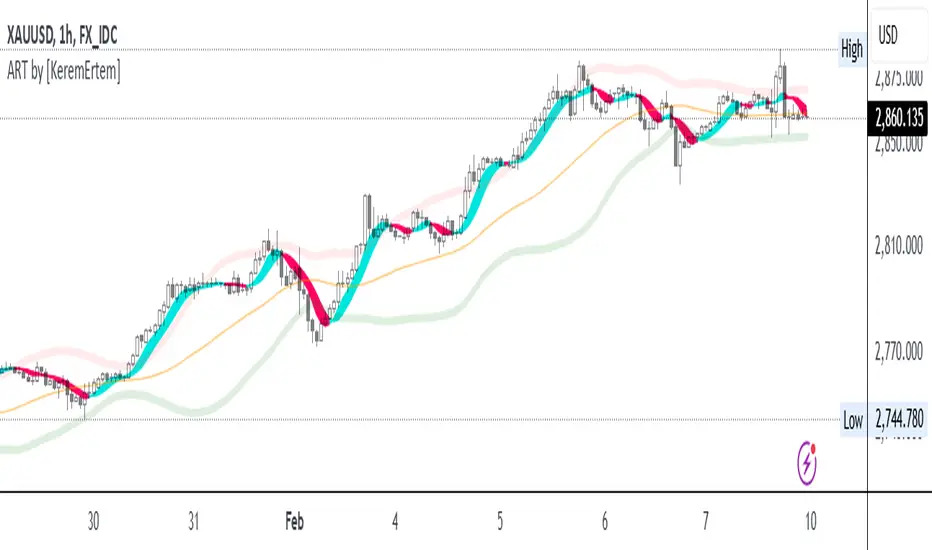
ADX, RSI, & TSI utilized as ART [by KeremErtem]The "ADX, RSI, & TSI utilized as ART" script is an advanced technical analysis tool designed by Kerem Ertem to help traders identify trend direction, strength, and potential reversals. It integrates the Average Directional Index (ADX), Relative Strength Index (RSI), and True Strength Index (TSI) into a cohesive, user-friendly indicator known as ART (Adaptive Relative Trend) .
What it does:
Trend Detection: Utilizes ADX to identify the strength and direction of trends.
Momentum Analysis: Uses RSI to gauge the speed and change of price movements.
Signal Smoothing: Incorporates TSI to reduce noise and provide clearer signals.
How it works:
Input Settings: Customize the source (hlc3), signal period (l1), and lookback range (l2) to tailor the indicator to your trading strategy.
Angle Calculation (ACI): The script calculates the angle of price movements using a custom function, which combines the lowest and highest prices with moving averages to create a smoother representation of trend angles.
Weighted Average: The ACI function is applied to the source price to derive a weighted average, which serves as the foundation for further calculations.
RSI Integration: The script calculates the RSI based on the weighted average price and further refines it using the ACI function to enhance signal accuracy.
ADX Calculation: ADX values are computed and adjusted using the ACI function to provide a clearer indication of trend strength and direction.
ART Indicator: The combined results of the RSI and ADX calculations form the ART indicator, which is plotted alongside trend lines and bands for comprehensive trend analysis.
Bands and Trend Lines: The script plots upper, lower, and center bands based on standard deviation and moving averages, providing visual cues for potential support and resistance levels.
How to use it:
Customization: Adjust the signal period, lookback range, RSI length, and ADX settings to fit your trading preferences.
Interpretation: Green ART signal lines indicate bullish trends, while red lines indicate bearish trends. The trend line color changes from cyan to magenta based on the trend direction.
Bands: Use the upper and lower bands as potential entry and exit points, with the center line acting as a trend confirmation.
This script offers a comprehensive approach to trend and momentum analysis, making it a valuable tool for traders seeking to enhance their trading strategies with advanced technical indicators.
Cari dalam skrip untuk "adx"
ADX DI EMA Clouds
EMA clouds colored by DI and ADX indicator:
9 EMA and 21 EMA Cloud turns green in a bull trend and red when in a bull trend...if the trend is half bulll and half bear..the clouds turn white.
I also coded if the momentum in increasing (yellow) or if the momentum is decreasing (blue) or if the momentum is flat (white).
The Clouds are colored based off the Di (+/-)
9 EMA is colored based of ADX momentum strength
ADX:
ADX is used to quantify trend strength. ADX calculations are based on a moving average of price range expansion over a given period of time. The default setting is 14 bars, although other time periods can be used.1
ADX can be used on any trading vehicle such as stocks, mutual funds, exchange-traded funds and futures .
DI (+/-):
The directional movement index (DMI) is an indicator developed by J. Welles Wilder in 1978 that identifies in which direction the price of an asset is moving. The indicator does this by comparing prior highs and lows and drawing two lines: a positive directional movement line ( +DI ) and a negative directional movement line ( -DI ). An optional third line, called the average directional index ( ADX ), can also be used to gauge the strength of the uptrend or downtrend.
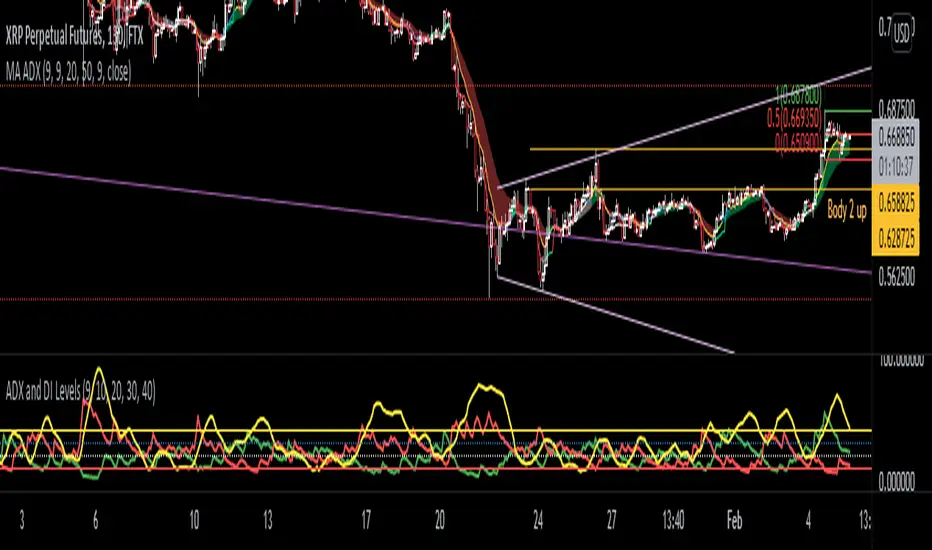
This indicator has the length changed from 14 to 9 so you can have more updated price calculation
I also add the 4 levels I use for day trading; the 10, 20, 30, 40-50 are the levels I like to see the Di to break over.
A lot of traders use different levels, but these I have and found most useful. You can set alerts when any Di crosses over the 40 for true trend breakout!
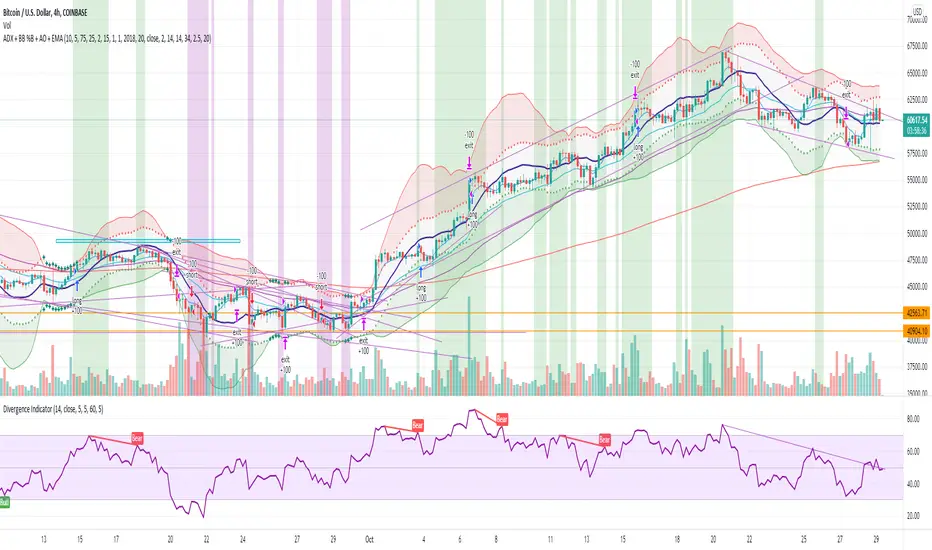
ADX + BB %B + AO + EMA [Luca Massuda]This trading strategy combines different indicators:
1) ADX, Average Directional Movement: to spot the trend
2) BB %B Bollinger Band %B: to spost relative price position to Bollinger Bands
3) AO Awesome Oscillator: to spot momentum
4) ema 5,ema21, ema50, ema200: to decide long or short position
You can configure:
Take profit % : at which % gains to take profit from the entry price
Stop loss % : at which % stop loss from the entry price
BB %B Overbought: At which level you consider Overbought respect to Bollinger Bands (values 0 to 100)
BB %B Oversold: At which level you consider Oversold respect to Bollinger Bands (values 0 to 100)
Awesome Oscillator: AO level to consider a long or short position +/- 2
ADX: ADX value to consider a long or short position
Start Date, Month, Year: Starting point for a backtesting strategy
Lenght , Source , Standard Deviation: Bollinger Bands values
ADX smoothing, DI Lenght: ADX values
Green and purple zones indicate when the strategy can go long or short.
Default Long conditions:
ema5>ema21 and ema50>ema200 and bb>75% and ao>2 and adx>15
Default Short conditions:
ema515
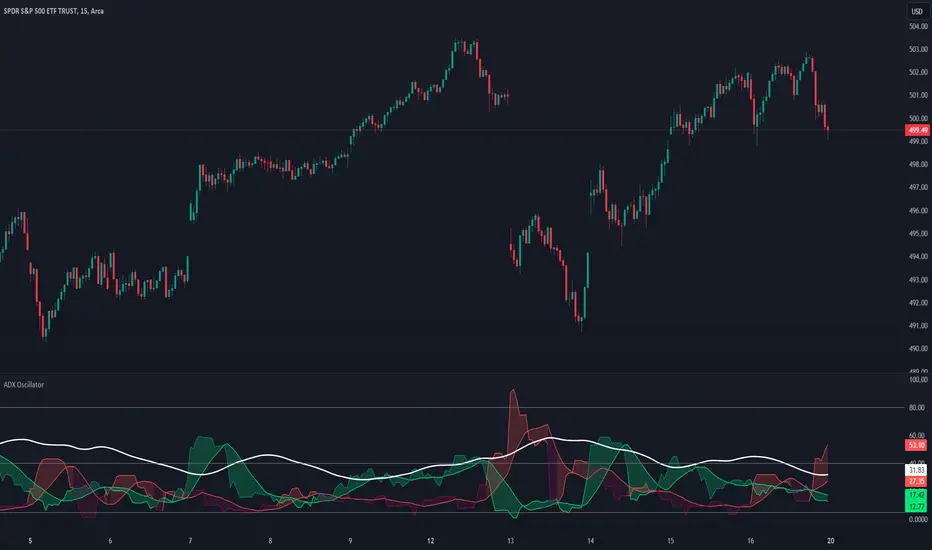
ADX Oscillator @shrilssThis Indicator calculates the Average Directional Index (ADX), a popular indicator used to quantify the strength of a trend. Additionally, it computes the Positive Directional Index (+DI) and Negative Directional Index (-DI), which measure the strength of upward and downward price movements respectively.
What sets this script apart is its enhanced ADX calculations. It incorporates Moving Averages (MAs) of the +DI and -DI to offer a smoother representation of trend direction. By averaging these directional indices over a specified period, it aims to filter out noise and provide clearer signals of trend strength.
Traders have the flexibility to visualize the traditional ADX alongside the enhanced ADX oscillator. The script also highlights potential buying and selling opportunities based on crossover events between the directional indices and the ADX, helping traders identify optimal entry and exit points.
With customizable parameters such as the length of the Directional Movement (DM), ADX, and MA periods, this script empowers traders to adapt the indicator to different market conditions and timeframes.
ADX Trend Confirmer [Honestcowboy]The ADX Trend Confirmer aims to give traders or algorithms a way to confirm a trend before entering a trade.
While the default for ADX is a smoothing factor of 14 and a length of 14 to measure directional strength. In my experience this is a lagging indicator and not the best for confirming if the market is trending.
🟢 What are the methods used for confirming trend in this indicator?
ADX above x number : By default we use an ADX length of 3 and it's value needs to be above 50.
ADX sloping up ? This will check if the ADX value is higher than that of previous bar, this to confirm that trend is getting momentum and not slowing down.
close>open / close

ADX Breakout Enhanced Signal🥋 Trading Dojo – ADX Breakout Enhanced Signal
This indicator combines the trend-strength power of the ADX with dynamic breakout-based signals, designed for traders who want more frequent and higher-probability entries on timeframes like 1 hour.
The core logic focuses on:
📌 1. Trend Strength Detection with ADX
The indicator evaluates whether the market is showing a strong directional trend using an optimized ADX.
When ADX rises above the configured threshold, the system interprets that price has enough momentum to validate an entry.
📌 2. Breakout Entry Logic
It identifies points where price breaks recent highs or lows, confirming the start or continuation of movement.
This breakout-based approach produces more entries than traditional ADX strategies alone.
📌 3. Clear and Simple Signals
🟩 Long when price breaks a recent high with strong trend confirmation.
🟥 Short when price breaks a recent low with strong trend confirmation.
📌 4. Built-In Automated Alerts
The indicator automatically generates JSON alerts ready for use with automation tools such as trading bots, webhooks, BingX, 3Commas, Discord bots, and more.
🎯 Purpose of the Indicator
To provide more frequent, well-distributed, and momentum-validated entries, while maintaining simplicity and speed — perfect for real-time decision-making.
Perfect For:
Intraday trading
1h, 30m, and 15m timeframes
Breakout-based strategies
Automated trading systems

ADX BoxDescription:
The ADX Box indicator provides traders with a quick and intuitive way to monitor the current trend strength based on the Average Directional Index (ADX), calculated with a customisable period (default: 7 periods).
This compact indicator neatly displays the current ADX value rounded to one decimal place, along with a clear directional arrow:
Green upward triangle (▲): Indicates that ADX is rising above its moving average, signaling increasing trend strength.
Red downward triangle (▼): Indicates that ADX is declining below its moving average, signaling weakening trend strength.
Key Features:
Small and clean visual representation.
Dynamically updates in real-time directly on the chart.
Ideal for quick trend strength assessment without cluttering your workspace.
Recommended Usage:
Quickly identifying whether market trends are strengthening or weakening.
Enhancing decision-making for trend-following or breakout trading strategies.
Complementing other indicators such as ATR boxes for volatility measurement.
Feel free to use, share, and incorporate this indicator into your trading setups for clearer insights and more confident trading decisions!

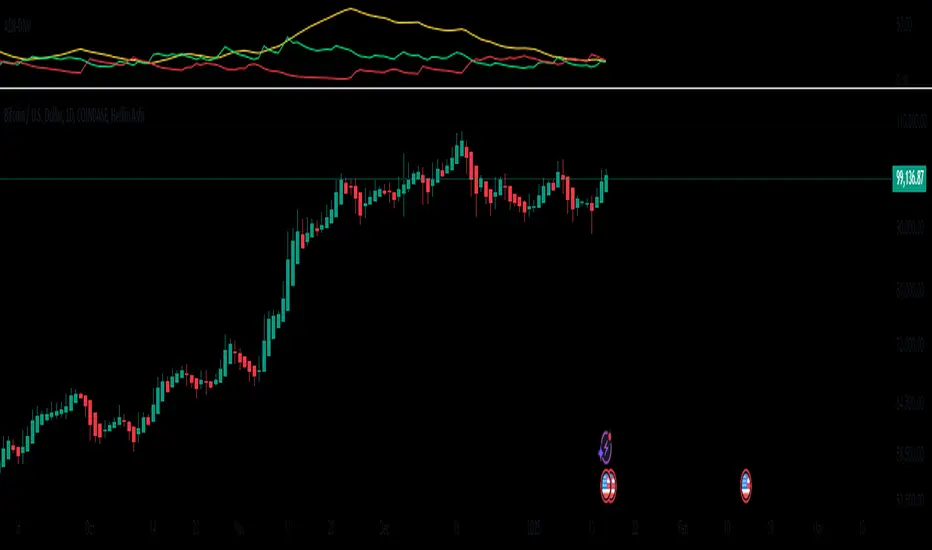
ADX-DMIThis script manually calculates the Directional Movement Index (DMI) and the Average Directional Index (ADX) using Wilder’s smoothing technique. The DMI indicators are used to assess the strength and direction of a market trend. It includes three main lines: ADX (yellow), DI+ (green), and DI− (red). Traders use these indicators to determine whether a trend is strong and in which direction it is moving.
The process begins by defining the length parameter, which determines how many periods are considered in the calculation. It then calculates the True Range (TR), which is the greatest of three values: the difference between the current high and low, the difference between the current high and the previous close, and the difference between the current low and the previous close. This TR is used to compute the Average True Range (ATR), which smooths out price fluctuations to get a clearer picture of the market’s volatility. Next, the script calculates the +DM (positive directional movement) and -DM (negative directional movement) based on the changes in the highs and lows from one period to the next.
Finally, the script computes the DI+ and DI− values by dividing the smoothed +DM and -DM by the ATR and multiplying by 100 to express them as percentages. The DX value is calculated as the absolute difference between DI+ and DI−, normalized by the sum of both values. The ADX is then derived by smoothing the DX value over the specified length. The three indicators — ADX, DI+, and DI− — are plotted in the lower chart panel, providing traders with visual cues about the trend’s direction (DI+ and DI−) and strength (ADX).
Important Notice:
The use of technical indicators like this one does not guarantee profitable results. This indicator should not be used as a standalone analysis tool. It is essential to combine it with other forms of analysis, such as fundamental analysis, risk management strategies, and awareness of current market conditions. Always conduct thorough research.
Note: The effectiveness of any technical indicator can vary based on market conditions and individual trading styles. It's crucial to test indicators thoroughly using historical data before applying them in live trading scenarios.
Disclaimer:
Trading financial instruments involves substantial risk and may not be suitable for all investors. Past performance is not indicative of future results. This indicator is provided for informational and educational purposes only and should not be considered investment advice. Always conduct your own research before making any trading decisions.
ADX Trend + RSI V2Indicator combining in one chart : ADX + RSI.
V2 : NOW, BULL TREND = SLOPE(ADX)>0 AND SLOPE(long EMA)>0
Changing settings :
Slow ADX Smoothing : periods for the EMA to smooth the ADX
Zero? : threshold (dotted line) at which the label will show "trend" (if the ADX is increasing)
Length RSI : Periods for calculating RSI
Settings for MACD Length : don't touch, except if you need to.
Coded with my buttocks, thanks for your indulgence.
Credits at the beginning of the code (thanks to newmen41)

ADX FAST and NOICE FREE DIThis tool is designed to identify trend strength and direction earlier than the traditional ADX/DI system.
Instead of relying on the normal Wilder smoothing, this version applies momentum projection to ADX (Fast ADX)
and then filters all directional movement signals through Hull smoothing to minimize market noise.
The result:
• Trends are detected faster
• Pullbacks are filtered more cleanly
• Sideways or weak structures become easy to avoid
Recommended Usage:
• Look for Fast ADX above the threshold to confirm trend environment
• Use Noise-Free +DI and -DI to confirm trend direction (bullish / bearish dominance)
• Background color highlights only when trend + direction are aligned
This is not a buy/sell signal generator by itself; it is best used as a trend and market condition confirmation layer.
Disclaimer:
This script is provided for educational and informational purposes only.
It does not constitute financial advice or a recommendation to buy or sell any security.
Market conditions vary and past performance does not guarantee future results.
Always perform your own analysis and risk management, and trade responsibly.

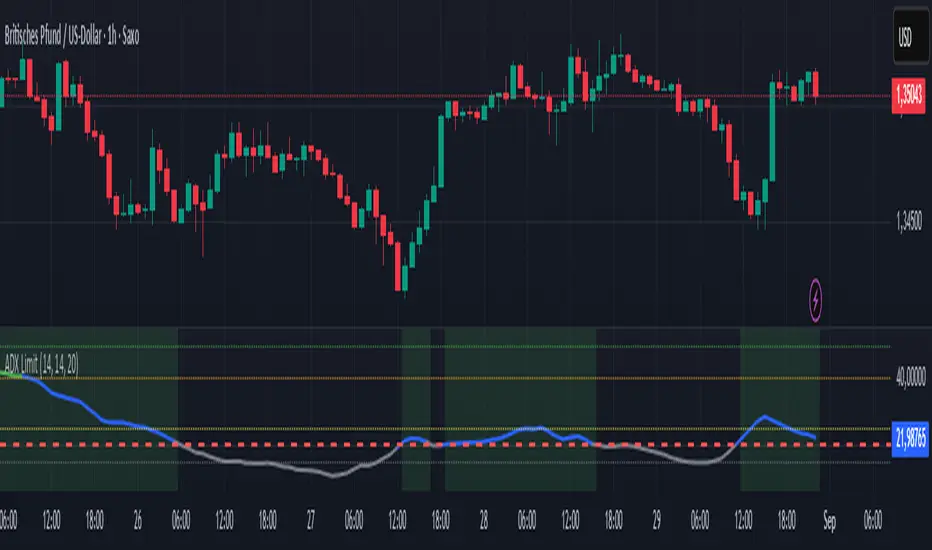
ADX with Custom Limit LineSimple ADX with Custom Threshold
A clean, educational ADX indicator that allows traders to set their own trend strength threshold.
Features:
- Customizable limit line for personalized trend analysis
- Color-coded ADX line based on trend strength
- Educational reference lines (15, 25, 40, 50)
- Background highlighting when above custom threshold
- Comprehensive alerts for trend changes
Perfect for traders who want a simple but effective tool to assess trend strength without complexity.
This indicator helps understand:
- When trends are strong enough to trade
- How to interpret ADX readings
- Optimal entry/exit timing based on trend strength
Educational and straightforward - ideal for both beginners and experienced traders.
⚠️ RISK DISCLAIMER:
This indicator is for educational purposes only and does not constitute financial advice.
Trading involves significant risk of loss. Always do your own research and consider
consulting with a qualified financial advisor before making trading decisions.
ADX Green Trend, Red ChopBased on the ADX indicator. This uses the calculated slope of the ADX line to show if momentum is increasing or decreasing. Green means the slope of the ADX is positive and the trend in increasing. Red means the ADX slope is positive and momentum is decreasing.Gray or Yellow is aneutral transitional zone

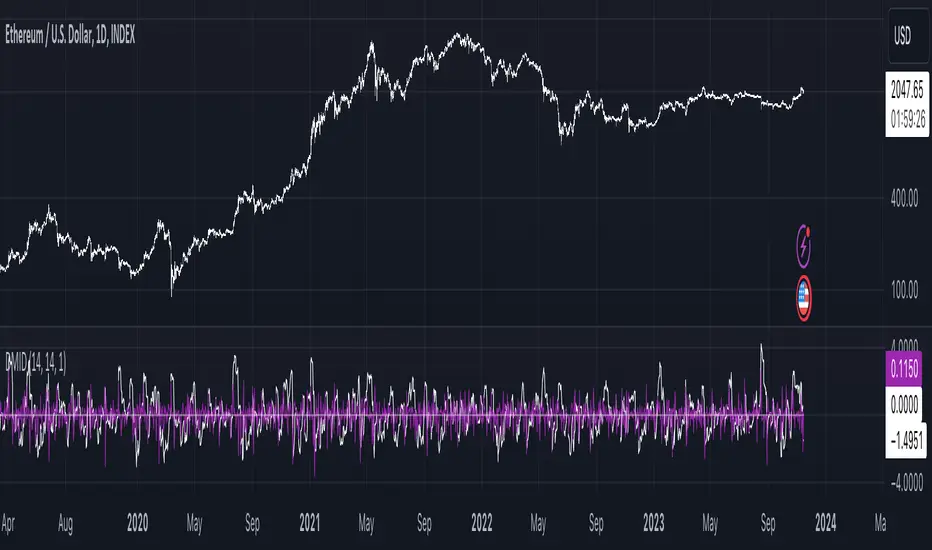
ADX Speed DerivativeThe ADX Speed Derivative (ADXSD) is a cutting-edge trading indicator meticulously crafted for trend analysis. By harnessing the power of the Average Rate Of Change (AROC) method applied to the first and second derivatives (pictured in white and purple, respectively) of the ADX oscillator, this indicator transcends conventional tools, offering traders unparalleled insights into market dynamics.
Key Features and Analysis Capabilities:
The ADXSD stands out with its ability to detect shifts in market trend directions, precisely quantify the speed and intensity of those transitions, and gauge the weakening or strengthening of prevailing trends. This comprehensive toolkit is designed for traders who demand accuracy and nuance in their technical analysis.
AROC Differentiation:
Unlike traditional ADX-based indicators, the ADXSD incorporates the AROC method, offering a nuanced perspective on trend acceleration or deceleration. The first derivative provides insight into the simplest rate of change, while the second derivative unveils the acceleration or deceleration of the trend, empowering traders with a deeper understanding of market dynamics.
Signal Precision:
This indicator excels at pinpointing potential trend reversals and transitions. Utilizing AROC on the ADX oscillator, it generates precise signals marked on the chart, giving traders timely and actionable information to make informed decisions.
Customization and Adaptability:
The ADXSD offers a range of customization options to cater to diverse trading strategies. Traders can adjust the lookback parameters to align with their risk tolerance and preferences, ensuring a personalized and adaptive approach to technical analysis.
Trend Visualization:
Incorporating a visual approach, this indicator enhances the interpretation of market trends. Traders can quickly identify shifts in trend strength and direction by observing midline crossovers, providing a visual guide for strategic decision-making.
Comprehensive Analysis:
The ADXSD serves as a comprehensive tool for traders seeking in-depth insights into market trends. It complements existing technical indicators, offering a holistic approach to market analysis.
ADX trend reversal/continuation spotterThis indicator is based on ADX and uses a method based on pivot points to identify a possible trend reversal or trend continuation.
To better understand how to use this indicator, follow these instructions:
Check which type of line ADX is below/above.
If the ADX line is above the green line and has changed color, you can expect a possible trend change.
Similarly, if the ADX line is below the red line and has changed color, you can expect a continuation of the previous trend or a possible trend uptake based on the current situation in the chart.
FX:EURUSD

ADX Trend + RSIIndicator combining in one chart : ADX + RSI.
Changing settings :
Slow ADX Smoothing : periods for the EMA to smooth the ADX
Zero? : threshold (dotted line) at which the label will show "trend" (if the ADX is increasing)
Length RSI : Periods for calculating RSI
Settings for MACD Length : don't touch, except if you need to.
Coded with my buttocks, thanks for your indulgence.
Credits at the beginning of the code (thanks to newmen41)

ADX of VortexHow to Trade
> Rising ADX of Vortex from 10 to 15 is trend building area to be noticed.
> If ADX of Vortex is falling but above 10 and below 15 avoid trade in such case because even if signal is generated by cross over of Vi-Plus and VI-Minus it may not give good profit.
> Once the position is taken and Price is steady but ADX of Vortex is falling then keep eye on cross over of Vi-Plus and VI-Minus to exit from trade.
> ADX rising above 15 is strong trending signal.
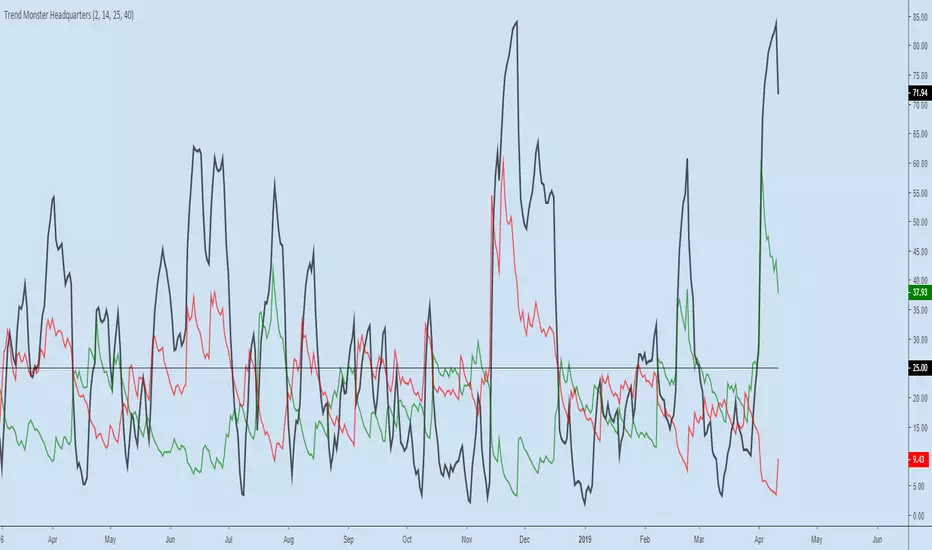
Trend Monster HeadquartersADX-DMI enhanced & modified for faster reaction
ADX (black line) above 80 = mega-trend peaked, reversal imminent, rare case scenario
ADX (black line) above 60 = trend topping out, reversal possible, depending on other indicators
ADX (black line) above 25 threshold = trend strenghening
DMI- (red line) - above 25 - bear trend strenghening
DMI+ (green line) - above 25 - bull trend strenghening
DMI- (red line) - coming off the bottom - bull trend weakening
DMI+ (green line) - coming off the bottom - bear trend weakening
ADX & DI trend exhaustionAn EMA is applied to the ADX in order to catch the exhaustion of a trend (i.e. ADX line crossunder EMAADX line) or the possible formation of a new one. In the first case, we would wait a confirmation signal, which happens when the crossunder has a value greater then 50. A new trend is created when the difference between the ADX and the EMAADX is positive, with ADX greater then 20. As confirmation, we would have the DI+ greater then 20 e the DI- smaller then 20 (this would trigger a bullish sentiment, bearish for the opposite), consequently the histogram will be display in green (red in the bearish case).
ADX EMA's DistanceIt is well known to technical analysts that the price of the most volatile and traded assets do not tend to stay in the same place for long. A notable observation is the recurring pattern of moving averages that tend to move closer together prior to a strong move in some direction to initiate the trend, it is precisely that distance that is measured by the blue ADX EMA's Distance lines on the chart, normalized and each line being the distance between 2, 3 or all 4 moving averages, with the zero line being the point where the distance between them is zero, but it is also necessary to know the direction of the movement, and that is where the modified ADX will be useful.
This is the well known Directional Movement Indicator (DMI), where the +DI and -DI lines of the ADX will serve to determine the direction of the trend.

ADX FunctionsLibrary "ADX"
adx(dilen, adxLen)
Parameters:
dilen : Length of the Directional Index.
adxLen : Length (smoothing) of the Average Directional Index.
Returns:
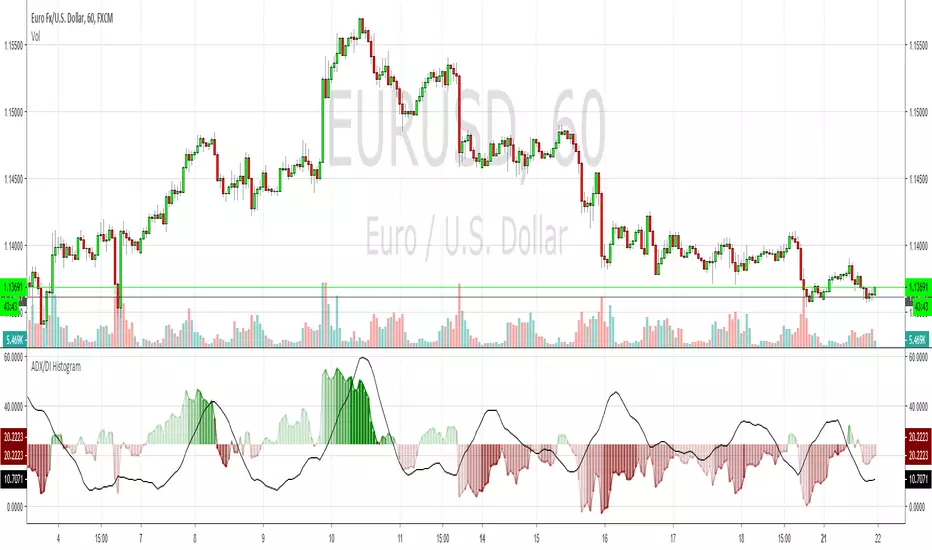
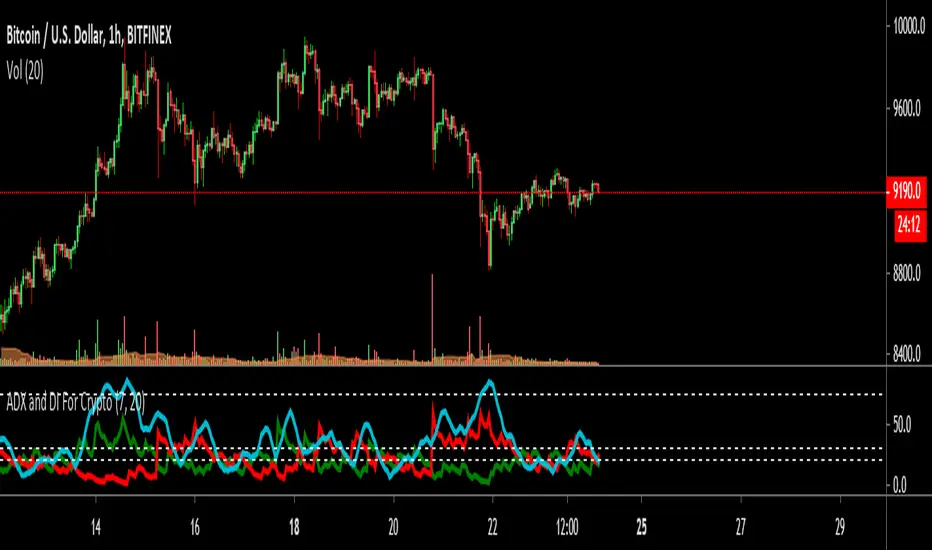
ADX and DI For Cryptocustomized version to add my favourite settings for crypto
Best time frame is daily followed by 4H
ADX Near 20 or less means trend is choppy and weak
ADX Cross over 30 means trend is starting to gain momentum
ADX Near 75 means momentum is near maximum, trend needs to rest for a while ( The area between 70~90 )
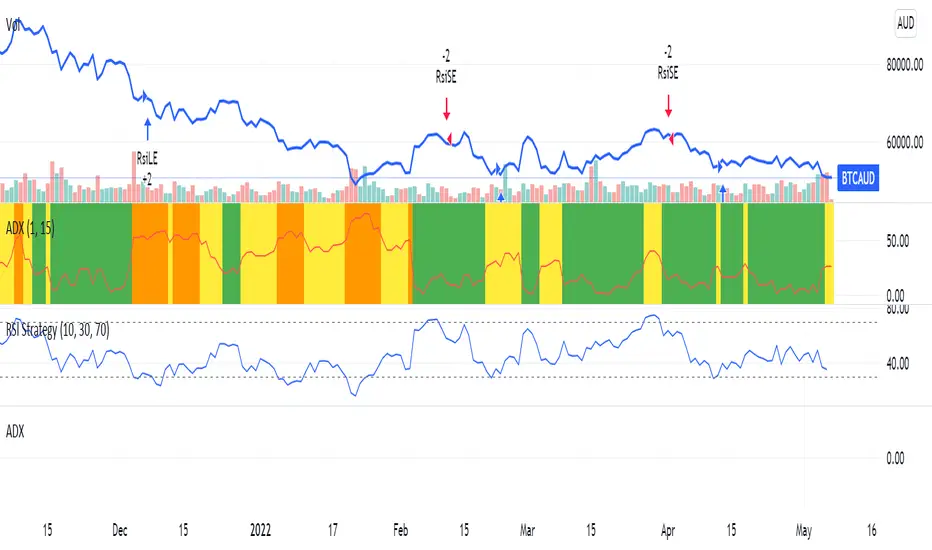
ADX GapperBased on the ADX Gapper strategy described in the book Street Smarts, it looks to exploit retracement to a prevailing trend when there has been a gap away from the trend, giving you multiple potential entries. It uses the ADX to determine a trend and detects when there is a gap to signal an entry day where:
You would enter short if the DI-(red line) > DI+ (green line), ADX (blue area) > 30 indicating a strong trend and if there is a gap up from the previous day. If all the described conditions are met then you would place a short stop at the previous day highs and trail a stop until the end of the day. This strategy is meant to give you trades to hold for 1 day (the day you enter) or 2 days if you consider you should hold it overnight.
ADX & DI HistogramThis bad boy shows the same info as a normal ADX & DI but I've endeavoured to remove a lot of the confusion. I also added red/green colour gradients to show how much ADX is trending, the darker the colour, the stronger the trend. This should help to avoid the upsidedowniness and confusion I've always found with the original. I made this a while ago and have made a few changes recently but I can't remember where I go the basic ADX code from, so credit to whoever that was. Enjoy