Candle Close AlertCandle Close Alert (CCA) :
The "Candle Close Alert" (CCA) is a custom technical analysis tool. It operates as an overlay on price charts and serves to detect and notify users about significant changes in consecutive candle closes. The script calculates the difference between the closing price of the current candle and the previous candle, referred to as the "close difference." It then compares this close difference against a user-specified threshold value.
When the close difference exceeds the threshold, the script triggers an alert, notifying users of a potential noteworthy event. This alert can serve as a prompt for traders and investors to investigate the current price action further or to consider possible trading decisions .
Additionally, the script enhances visualization by plotting the close differences on the price chart. Positive close differences exceeding the threshold are plotted in green, while negative close differences exceeding the threshold in magnitude are plotted in red. This color-coded visualization helps users quickly identify periods of significant price movement and potential market trends.
However, it's important to note that the CCA script is a standalone tool and should be used in conjunction with comprehensive market analysis. Trading decisions should not be solely based on the alerts and visualizations provided by this script. Instead, they should be considered within the broader context of other technical indicators, fundamental analysis, and risk management strategies. Enjoy it!
Cari dalam skrip untuk "alert"

Multiple Indicator 50EMA Cross AlertsHere’s a screener including Symbol, Price, TSI, and 50 ema cross in a table output.
The 50 Exponential Moving Average is a trend indicator
You can find bullish momentum when the 50 ema crossed over or a bearish momentum when the 50 ema crossed under we are looking to take advantage by trading the reversion of these trends.
True strength index (TSI) is a trend momentum indicator
Readings are bullish when the True Strength Index shows positive values
Readings are bearish when the indicator displays negative values.
When a value is above 20, we look for selling overbought opportunity and when the value is under 20, we look for buying oversold opportunity.
You can select the pair of your choice in the settings.
Make sure to create an alert and choose any alerts then an alert will trigger when a price cross under or cross over the 50 ema for every pair separately.
This allow the user to verify if there is a trade set up or not.
Disclaimer
This post and the script don’t provide any financial advice.

Auto Fibonacci From Previous High & Low w/ Percentages & AlertsAUTO FIBONACCI FROM PREVIOUS D/W/M/Q/Y HIGH & LOW WITH PERCENTAGES & ALERTS
This is an auto fibonacci level generating indicator that uses the high and low from the previous day, week, month, quarter or year. It also has a table with real time updates of how far away the nearest fibonacci levels are above and below the current price, represented in percentages. It includes alerts for each level as well if you want to be notified of price crossing fibonacci levels without watching the chart.
***HOW TO USE***
Fibonacci levels are also known as the golden ratio and are popular levels for traders to use as support and resistance levels. Expect price to bounce off of these levels regularly.
The previous high and low are marked as white lines. These are very important levels so make sure to pay attention when price reaches these lines.
Make sure to check out the higher timeframes for major levels.
Each fibonacci line retracement and extension up to the 3.272 level in each direction is displayed as red or green depending on whether price is above or below that level.
The retracement levels used are: previous high, .117, .236, .382, .5, .618, .786, .883, previous low, 1.272, 1.618, 2, 2.272, 2.618, 3 and 3.272.
The extension levels used are: .272, .618, 1, 1.272, 1.618, 2, 2.272, 2.618, 3 and 3.272.
In the indicator settings input tab you can quickly change the timeframe used, turn lines on/off, upper line colors, lower line colors, previous high and low line colors, line width, turn percentage table on/off, change the color of the percentage table and move the percentage table to a different location on the chart.
The indicator includes alerts for each fibonacci level as well, just set your fibonacci timeframe on your favorite ticker and turn on tradingview alerts for alert() calls.
***MARKETS***
This indicator can be used as a signal on all markets, including stocks, crypto, futures and forex.
***TIMEFRAMES***
This auto fibonacci indicator can be used on all timeframes.
***TIPS***
Try using numerous indicators of ours on your chart so you can instantly see the bullish or bearish trend of multiple indicators in real time without having to analyze the data. Some of our favorites are our Buy & Sell Pressure Colored Candles, Directional Movement Index + Fisher Transform, Volume Profile W/ Buy & Sell Pressure Labels, Auto Support And Resistance and Money Flow Index in combination with this Auto Fibonacci. They all have real time Bullish and Bearish labels or percentage gap info as well so you can immediately understand each indicator's trend and how far away major levels are in percentages.

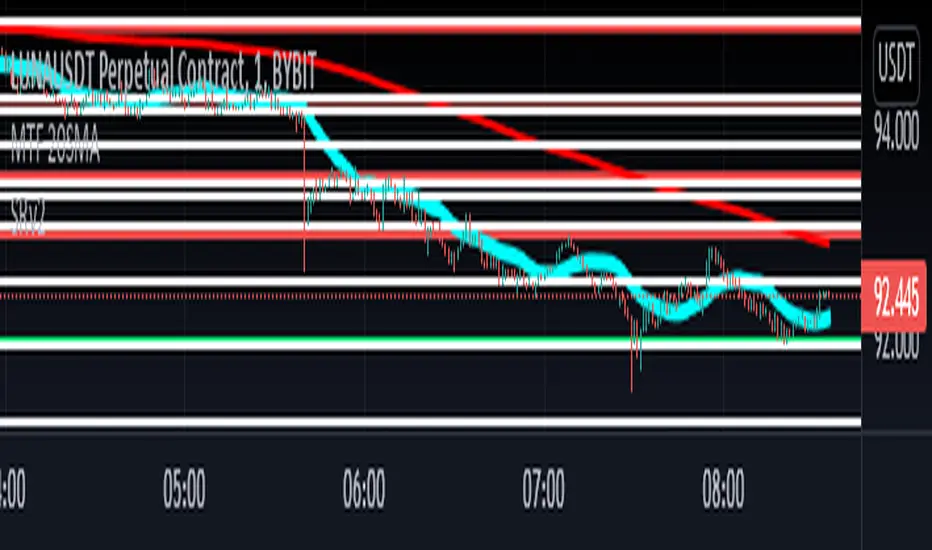
3MA Proximity AlertScript for alerting when:
A) Price
B) 20 SMA
C) 200 SMA
D) 1 Support or Resistance line
Are all in proximity to each other at the same time.
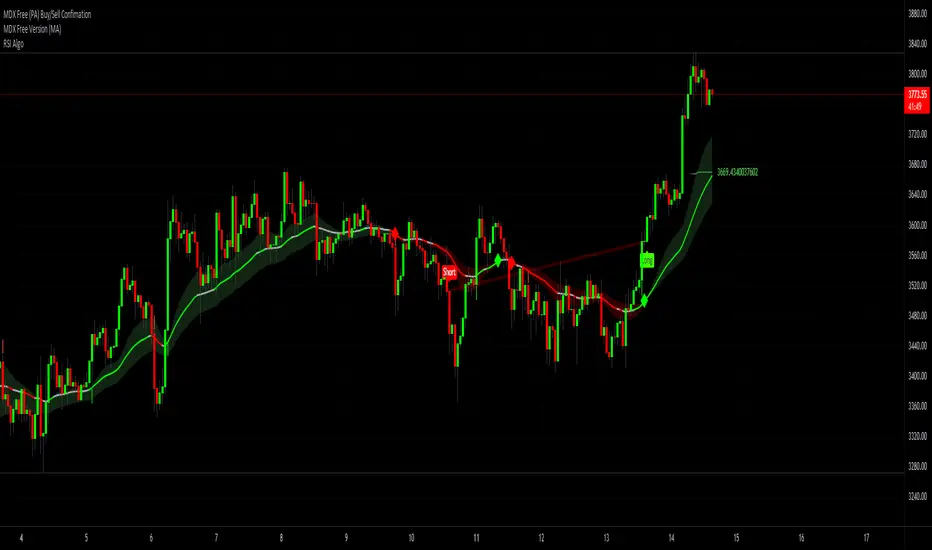
RSI Algo (Pinescript v5 + Alerts)Found this the other day and thought it might be useful to have an updated version with alerts:
Credit to the original author.
Dump AlertsNYSE:BRK.B
By popular demand: An inverted version of my first indicator Pump Alerts in Pine Script with two alert conditions for trading bots and automated stock trading setups.
It's originally based on "Pump Catcher" by @joepegler
I modified some parts, hopefully improved the usability and enabled alerts, so you can use it to trigger bots like 3commas via webhooks or stock brokers partnering with TradingView.
Dump Alerts 📉 attempts to detect moments of abnormal and accelerating increase in volume concurrent with falling prices AKA "dumps". Small and big dumps.
I recommend trying different timeframes and tinkering with the lookback period as well as both threshold values.
Other than that it's pretty self-explanatory and beginner-friendly.
Free and Open Source. Let me know how you use it!

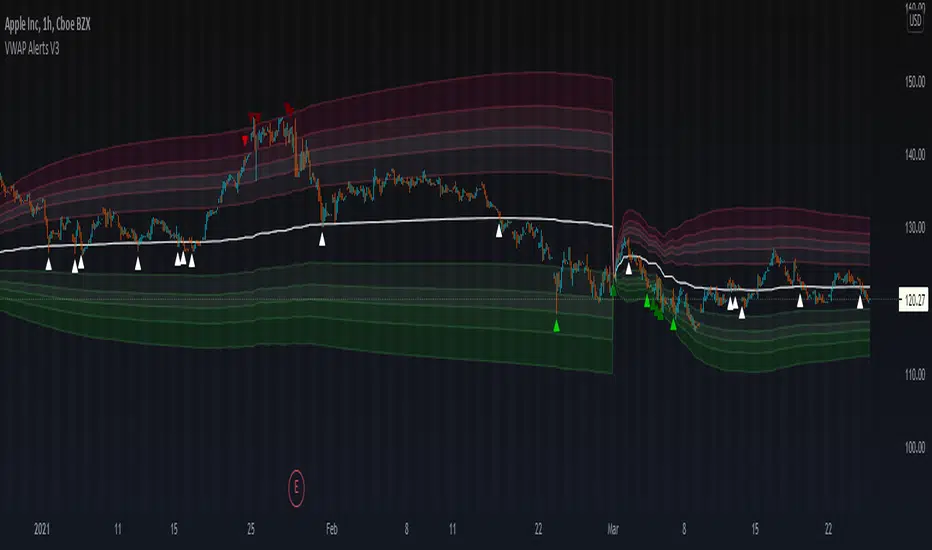
VWAP Alerts V3VWAP Alerts signal over bought/over sold conditions, relative to volume weighted average price, while deviation bands plot an extremely accurate point of mean reversion.
VWAP Alerts V3 includes multiple timeframe selection, along with multiplier input for deviation band setting
Alerts can be set for each individual band, for extreme oversold/overbought conditions, use "Vwap Low Deviation 4" and "Vwap High Deviation 4".
Alerts can also be set for VWAP bounces, by simply setting "VWAP Alert"
Bollinger Bands + RSI Alerts for 3commas/DCA botHey Folks !
This is in indicator that generates buy alerts combining Bollinger Bands and RSI.
RSI validates the BB signal by confirming we are not in an oversold area.
Interval: 3m to 15m
Recommended settings for 3commas DCA bot
- TP/TTP: 0.3%/0.1%,
- Base Order: Your choice ,
- Safety Order: 1.2 * Your choice of base order
- Safety Order Volume Scale: 1.2,
- Safety Order Step Scale: 1.5,
- Price Deviation to Open Safety Order (% from initial order): 0.25%,
- Max Safety Trades Count: 7
- DO NOT USE STOP LOSS
> Create Alert with Buy Alert and link it to "Message for deal start signal"

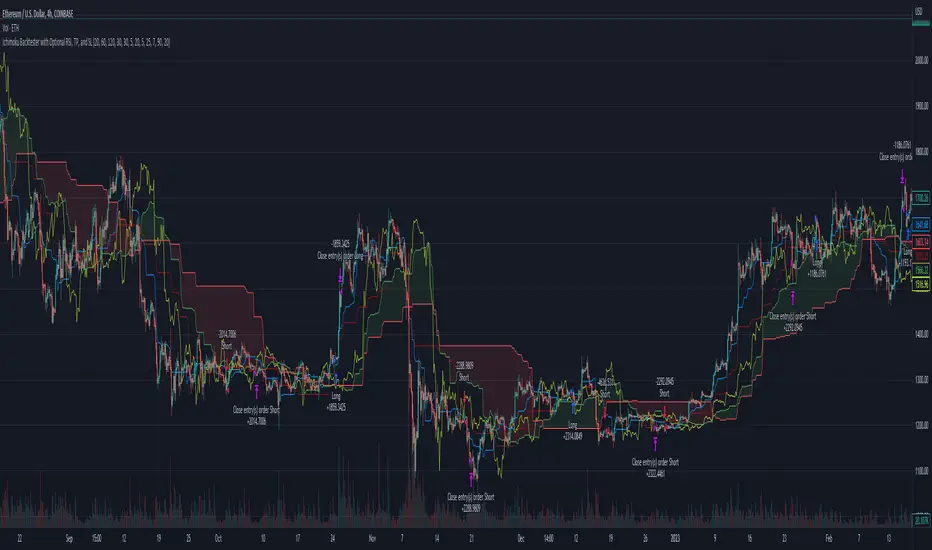
Ichimoku Basic AlertsStarted with Ichimoku Kinko Hyo by Mizuki32. Converted to study and added alerting and cloud confirmation.
MACD With Trend Filter: Visual Backtest Module TemplateSample Strategy: MACD Crossover with trend filter options
MA Filter : Price Close Above MA, Search for Buy, Price Close Below MA, Search for Sell
ADX Filter : Take trade only when ADX is above certain treshold
MACD Signal : MACD Cross above signal line while under 0 line indicate Buy Signal
MACD Cross below signal line while above 0 line indicate Sell Signal
-----------------------------
Using Alert Module:
Enable Alert --> Enable TV's alert and plot signal to chart
Alert Type --> Set to take Buy only, Sell only or Both alert
----------------------------
Using Backtest Module:
Enable Backtest --> Enable Backtest simulation
Backtest Type --> Set to take Buy only, Sell only or Both
SL Type -->
ATR : Set SL in ATR times Multiplier below/above entry price
Fixed : Set SL in fixed point below entry point (in 'Dollar'). e.g. for Stocks -> 0.5 equals to 50cent while for EURUSD currency -> 0.005 equal to 50 pips
HiLo Bar : Set SL at highest/lowest wick of previous bar plus/minus Fixed point. e.g. EURUSD HiLo=3 and Fixed Point = 0.0005, buy trade will place SL 5 Pips below lowest of previous 3 bar
SL ATR Period --> Set Lookback Period used for SL's ATR calculation
SL ATR Multi --> Set ATR Multiplier for SL
SL Fixed --> Set Fixed Level for SL (Use when SL Type is either Fixed or HiLo Bar)
SL Bar --> Set Number of previous bar to check for SL placement
TP RR Ratio --> Set TP based on RR multiplier. e.g. 2 means TP level will be twice further from entry point compared to Entry-SL distance.
Notes: The point is for preliminary testing, so it only supports 1 trade at a time and no Trailing Stop
----------------------------
Disclaimer:
This script main objective is to create my personal indicator template so that i just have to modify the indicator module for preliminary testing in future.
Testing Alert Module so i can re-use it as template in future study/indicator
Testing Visual Backtest Module so i can re-use it as template in future study/indicator
i believe using Strategy function is a better approach for this but the entry/exit level seems to be hit n miss (at least for me, still trying to figure what i did wrong)
also, i rather code the strategy in other platform where i can use the more accurate tick data if i want to validate backtest statistics.
My study scripts was built only to test/visualize an idea to see its viability and if it can be used to optimize existing strategy.
credit: ADX code are originally from "ADX and DI" by @BeikabuOyaji although i re-wrote so i can have cleaner read and use RMA instead of SMA

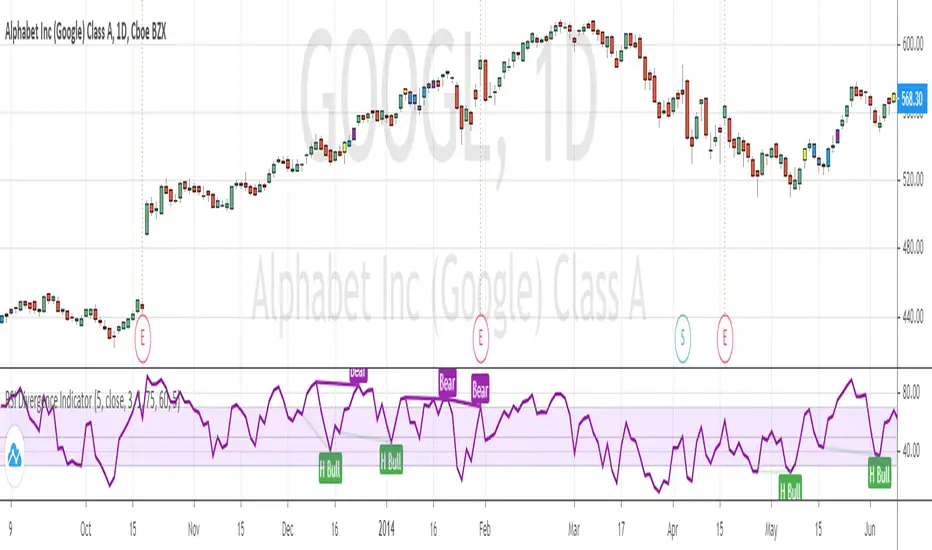
RSI Divergence Indicator (with alerts)Many have requested me for indicator version with alerts for the RSI Divergence strategy. Here is the one ...
Please note alert triggers in delay by number of bars defined in the settings. (same as strategy) ...
Bar color also changes when alert triggers ...
Yellow Bar shows BUY
Purple Bar shows EXIT ( Exit the Long position ... NO SHORTing )
On each Yellow Bar can be added to existing position
On each Purple Bar , exit partial position OR exit the whole position
Appreciate your feedback.
Warning
Use for education purpose only ...
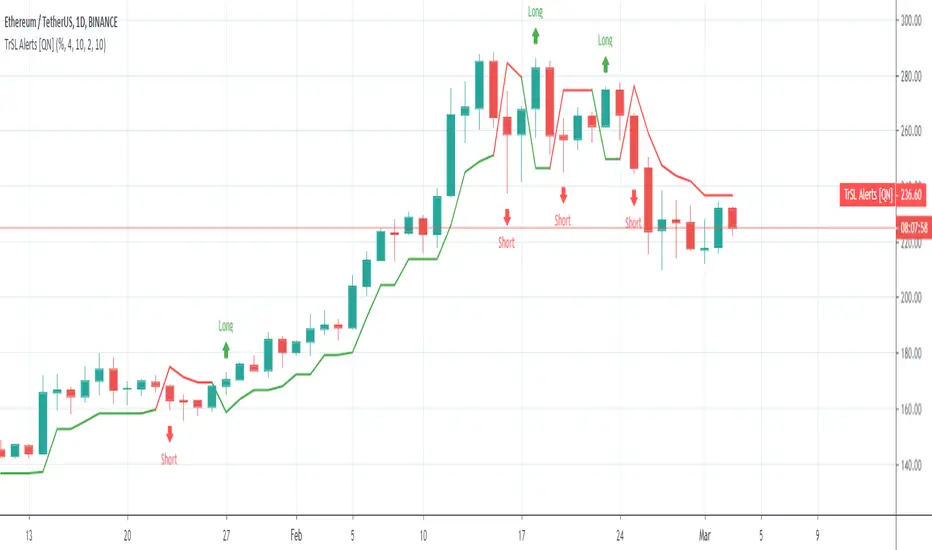
Trailing SL Alerts [QuantNomad]It's alerts version of my Trailing SL strategy:
Use "Once Per Bar" param when creating alerts.

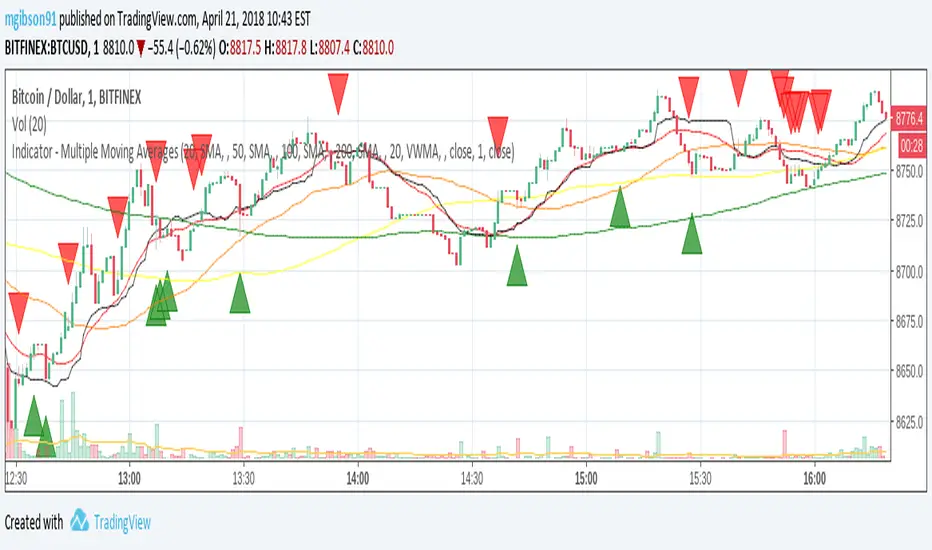
MG - Multiple Moving Averages & Candle Wick Alerts - 1.0Features:
- Each moving average has customizable length, type and source
- The ability to change the source of all moving averages with one input (changing an individual MA source will override the general for that MA)
- At a glance comparison of 20 SMA and 20 VWMA to gauge volume trend
- Wick alerts which can be toggled for each moving average.
- Bullish wick alerts are when the wick is the only part of the candle to drop below the moving average
- Bearish wick alerts are when the wick is the only part of the candle to reach above the moving average
- Simple candle closed alert if you want a notification, for example each hour.
Defaults: Four SMAs (20, 50, 100, 200) and a 20 VWMA .
Recommended Usage:
- Set the general source (sets the source of all moving averages) to 'low' when in an uptrend and 'high' in a downtrend to maximize Risk : Reward.
- Use Fibonacci levels, oscillators .etc for confluence
NOTE: The moving average component of this indicator is the same as the previous indicator ()
Two Bar Break Line Alerts R1.0 by JustUncleLThis indicator with default settings is designed for BINARY OPTIONS trading. The indicator can also be used for Forex trading with some setting changes. The script shows Two Bar Pullback Break lines and alerts when those Break lines are Touched (broken) creating a short term momentum entry condition.
For a Bullish Break (Green Up Arrow) to occur: first must have two (or three) consecutive bear (red) candles which is followed by a bull (green) candle creating a pivot point. The breakout occurs then the High of the current Bull (green) exceeds the highest point of the previous two (or three) pivotal bear candles. The green channel Line shows where the current Bullish BreakOut occurs.
For a Bearish Break (Red Down Arrow) to occur: first must have two (or three) consecutive bull (green) candles which is followed by a bear (red) candle creating a pivot point. The breakout occurs when the Low of the current Bear (red) drops below the lowest point of the previous two (or three) pivotal Bull candles. The red channel Line shows where the current Bearish BreakOut occurs.
The break Line Arrows can optionally be filtered by the Coloured MA (enabled by default), a longer term directional MA (disabled by default) and/or a MACD condition (enabled by default) as a momentum filter.
You can optionally select three Bar break lines instead of two. The three bar break lines are actually equivalent to Guppy's Three Bar Count Back Line method for trade entries (see Guppy's video reference below).
Included in this indicator is an ability to display some basic Binary Option statistics, when enabled (enabled by default) it shows Successful Bars in Yellow and failed Bars in Black and the last Nine numbers on the script title line represent the Binary option Statistics in order:
%ITM rate
Total orders
Successful Orders
Failed Orders
Total candles tested
Candles per Day
Trades per Day
Max Consecutive Wins
Max Consecutive Losses
You can start the Binary Option statistics from a specific Date, which is handy for checking more recent history.
HINTS:
BINARY OPTIONS trading: use 5min, 15m, 1hr or even Daily charts. Trade after the price touches one of the Breakout lines and the Arrow first appears. Wait for the price to come back from Break Line by 1 or 2 pips, the alert arrow must stay on and candle change to black, then take Binary trade expiry End of Candle. If price pull back and arrow turns off, don't trade this candle, move on you probably don't have momentum, there will be plenty of other trigger events. The backtesting results are good with ITM rates 65% to 72% on many currency pairs, commodities and indices. Realtime trading has confirmed the backtesting results and they could even be bettered, provided you are selective on which signals to trade (strong MACD support etc), that you are patient and disciplined to this trading method.
FOREX trading: the default settings should work with scalping. For longer term trades try with settings change to a more standard MACD filter or slower to catch the longer term momentum swings and the idea would be to trade the first Break Line alert that occurs after a decent Pullback in the direction of the trend. Setting the SL to just above/below the Pivot High/Low and set target to two or three times SL.
References:
"Fundamentals of Price Action Trading for Forex, Stocks, Options and Futures" video:
www.youtube.com
Other videos by "basecamptrading" on Naked Trading.
"Taking Profits in Today's Market by Daryl Guppy" video:
www.youtube.com

Bollinger Bands Width with AlertsStandard Bollinger Band Width indicator with some convenience alerts -- please only use these alerts in conjunction with the alert-type "Once per Bar Close" in order to avoid premature (false) signals!
Alerts provided:
- bbw has rounded (started to decrease after period of rising)
- bbw has started rising (after a period of falling)
Many thanks again to J. Bollinger for his indicators and efforts in education.

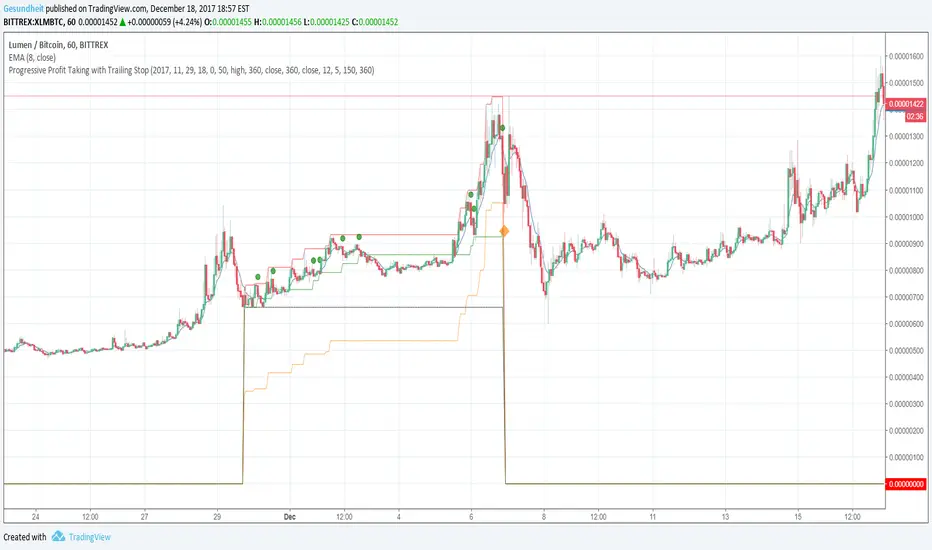
Progressive Profit Taking with Trailing StopThis is version 2 of
Special features:
Added partial profit taking as price rises. Profit taking is triggered by price crossing an EMA.
After profit taking, price has to rise by a user-specified percent before taking profits again.
Also includes condition for fully closing position after meeting specified profit target.
To incorporate into your algo, turn the plotshape functions into alertcondition.
Heiken Ashi zero lag EMA v1.1 by JustUncleLI originally wrote this script earlier this year for my own use. This released version is an updated version of my original idea based on more recent script ideas. As always with my Alert scripts please do not trade the CALL/PUT indicators blindly, always analyse each position carefully. Always test indicator in DEMO mode first to see if it profitable for your trading style.
DESCRIPTION:
This Alert indicator utilizes the Heiken Ashi with non lag EMA was a scalping and intraday trading system
that has been adapted also for trading with binary options high/low. There is also included
filtering on MACD direction and trend direction as indicated by two MA: smoothed MA(11) and EMA(89).
The the Heiken Ashi candles are great as price action trending indicator, they shows smooth strong
and clear price fluctuations.
Financial Markets: any.
Optimsed settings for 1 min, 5 min and 15 min Time Frame;
Expiry time for Binary options High/Low 3-6 candles.
Indicators used in calculations:
- Exponential moving average, period 89
- Smoothed moving average, period 11
- Non lag EMA, period 20
- MACD 2 colour (13,26,9)
Generate Alerts use the following Trading Rules
Heiken Ashi with non lag dot
Trade only in direction of the trend.
UP trend moving average 11 period is above Exponential moving average 89 period,
Doun trend moving average 11 period is below Exponential moving average 89 period,
CALL Arrow appears when:
Trend UP SMA11>EMA89 (optionally disabled),
Non lag MA blue dot and blue background.
Heike ashi green color.
MACD 2 Colour histogram green bars (optional disabled).
PUT Arrow appears when:
Trend UP SMA11

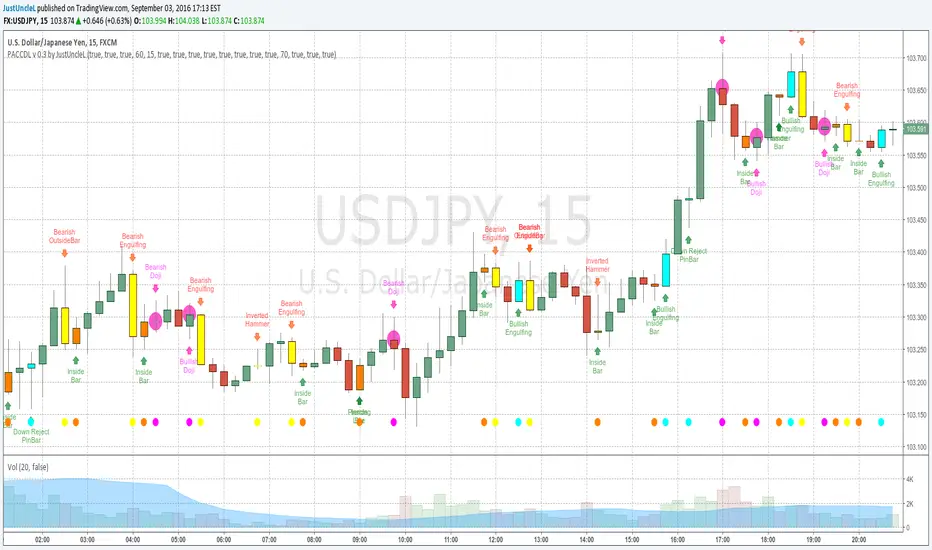
Price Action Candles v0.3 by JustUncleLThis requested release includes an Alert condition, so an alarm can be created on selected Price Action bars. Also this version modifies the Doji calculation to be similar to an Harami, so now the description of the Doji's are:
- Bearish Doji (aka Bearish Harami) (Fuchsia Highlight above Bar):
A large body Bull (green) candle followed by a small or no body candle
with wicks top and bottom that are at least 60% of candle.
- Bullish Doji (aka Bullish Harami) (Fuchsia Highlight below Bar):
A large body Bear (red) candle followed by a small or no body candle
with wicks top and bottom that are at least 60% of candle.
The % wick size (default 60%) of the Doji and the size of previous candle (default 15 pips) can be modified in the script Format parameters.
This modified Doji is particularly useful when combined with Heikin Ashi candles.
When Alerts are selected, an alert dot is also displayed along the bottom of the chart.
strategy MACD and RSI alertThis is a script I created by combining parts of other scripts I looked at. It uses RSI and MACD to give entrance signals for longs or shorts. When the color changes from red to green it signifies a buy, from green to red signifies a short.
The problem that I am having is that I cannot set up the alert script properly, Using the code :
alert1 = (xRSI > Overbought and signal < macd) ? 1: 0
gives repeat signals every time the criteria reasserts itself, and I only want it to show an alert at the same time the bar color changes.
If I could get some advice on how to set up the alert so it only alerts me at the same time that the bars change color, it would be much appreciated.
Thankyou

Hidden Div ALERT ONLY v1.9 1. This script detects **price-anchored hidden divergences** for trend continuation, not reversals.
2. It uses **price pivots** as the reference and reads **RSI at the exact pivot candle**.
3. **Hidden Bearish**: lower high in price with higher high in RSI → bearish trend continuation.
4. **Hidden Bullish**: higher low in price with lower low in RSI → bullish trend continuation.
5. A **RefLock mechanism** prevents small or noisy pivots from overwriting the main swing.
6. **Min/Max gap filters** ensure only valid swing structures are evaluated.
7. Optional **EMA, RSI range, and volume filters** help align signals with market context.
8. The script is **alert-only**, non-repainting, and optimized for **mobile use**.
9. Designed for **set-and-forget trading**, alerts trigger execution without watching the chart.

Price Range CHoCH Alert🎯 Smart Money Concept (SMC) indicator that monitors a specific price level and alerts only when price touches that level AND
subsequently creates a Change of Character (CHoCH).
Key Features:
• Set a custom price level to monitor
• Detects CHoCH/BOS based on pivot highs/lows
• Alerts ONLY when: Price touches level → CHoCH occurs
• Visual confirmation with level line and status table
• Configurable tolerance for precise level targeting
• Works for both bullish and bearish scenarios
Perfect for:
✓ Institutional level trading
✓ Key support/resistance breakouts
✓ Liquidity grab confirmations
✓ Structure break validation
Simply set your target price level and let the indicator watch for the perfect SMC setup!
