SPY Daily Gamma Levels [Manual Input With Alerts]Overview This indicator plots key options-based support and resistance levels (Gamma Exposure / GEX) directly on your chart. Unlike standard technical analysis, these levels (Call Wall, Gamma Flip, Put Support, and Volatility Trigger) represent where Market Makers are positioned, often acting as "magnets" or "repellents" for price action.
Important Note: TradingView Pine Script cannot currently access external options open interest data natively. Therefore, this is a Manual Input Indicator. You must update the four price levels in the settings each morning before the market opens.
Key Features:
4 Key Levels: Plots the Call Wall, Gamma Flip (Zero Gamma), Put Support, and Volatility Trigger.
Auto-Cleaning: Automatically deletes yesterday's lines to keep your chart clean; lines only show for the current session.
Alerts Included: Built-in alert conditions allow you to set notifications when price crosses the Gamma Flip or breaks the Vol Trigger.
Customization: Fully customizable colors and line styles.
Best Practices:
Timeframe: Works best on 15-minute charts for trend identification and 5-minute charts for entry execution.
Strategy:
Above Gamma Flip: Market generally stabilizes; dealers buy dips.
Below Gamma Flip: Volatility expands; dealers sell rips.
Below Vol Trigger: "Danger Zone" – expect accelerated selling pressure.
How to Get the Data (The AI Workflow)
Since these numbers change daily, I use Google Gemini to fetch the data and remind me every morning. Here is how you can set up the same automated workflow:
1. The Prompt You can ask Gemini (or your preferred AI) the following prompt manually each morning:
"Find the daily SPY Call Wall, Gamma Flip, Put Support, and Vol Trigger levels for today to input into my TradingView indicator."
2. Automating the Routine I have set up a scheduled daily reminder with Gemini. To do this yourself, simply ask Gemini:
"Can you schedule a daily task to search for these SPY Gamma levels and send them to me every morning at 8:00 AM?"
3. Updating the Chart
Receive the notification from the AI.
Open the Indicator Settings in TradingView.
Type in the new numbers.
The chart updates instantly.
Disclaimer: This tool is for educational purposes only. Gamma levels are estimates based on Open Interest and Dealer Gamma exposure models. Always manage your risk.
Cari dalam skrip untuk "alert"

BTC 1H Momentum + Near-Setup Alerts bigbeeukthis alert, sets up on 1h chart of BTC only. it alerts you to price action and when its close to a setup. it will then trigger again once the setup is ready

Price Movement Alert with Previous Close as ReferenceFunctionality of the Indicator
The "Price Movement Alarm with Previous Day Close as Reference" indicator is a tool that helps you monitor significant price levels based on the previous day's closing price. The indicator calculates both decline and rise thresholds in specified percentages to generate potential trade alerts. The lines on the chart represent these thresholds, and the corresponding labels show the exact percentage.
Usage Instructions:
Previous Day's Close: The indicator uses the previous trading day's close as the reference point.
Setting Decline and Rise Percentages: You can adjust the alarm levels for declines (e.g., 0.5%, 1.0%, 1.5%, 2.0%, 2.5%, 3.0%) and rises (e.g., 0.5%, 1.0%, 1.5%, 2.0%, 2.5%, 3.0%).
Lines and Labels: The indicator draws lines on the chart and displays labels that indicate the percentage of price movement.
Market Analysis: Analyze the price movements to make potential trading decisions.
Market in Equilibrium:
A market is in equilibrium when price movements remain within a narrow range (e.g., 0.5% to 1%). During this phase, volatility is low, and there are no significant price changes.
Market not in Equilibrium:
A market is not in equilibrium when price movements fall outside the narrow range (e.g., above 1%). During this phase, larger price movements can occur, often triggered by news or economic events.

Awesome SuperTrend Zone Dynamic Alerts// created by © OmegaTools, upgrade to v6 and alert condition added
//@version=6
Awesome SuperTrend Zone Alerts with dynamic alerts

Triple EMA (5, 8, 13) + Confirmed Alerts with SoundThis indicator uses three Exponential Moving Averages (EMA 5, 8, and 13) to generate buy and sell signals when the EMAs are properly aligned and not touching. Signals are confirmed on candle close and can trigger customizable sound alerts directly from the TradingView alert panel.

Triple EMA (5, 8, 13) + Confirmed Alerts with SoundThis indicator uses three Exponential Moving Averages (EMA 5, 8, and 13) to generate buy and sell signals when the EMAs are properly aligned and not touching. Signals are confirmed on candle close and can trigger customizable sound alerts directly from the TradingView alert panel.
BTC Confluence Alert 1 Overall Purpose
This script is a custom TradingView indicator that scans for confluence (agreement) between:
BTC’s short-term and medium-term momentum (12-minute and 1-hour RSIs),
The MACD histogram (trend direction and momentum strength),
Bitcoin dominance (money flowing back into BTC).
When all three are bullish, it flashes green and triggers a single alert.

Divergences + Alerts (ANY Indicator)📊 Divergences + Alerts (ANY Indicator)
This versatile indicator detects four types of divergences between price action and an oscillator:
Buyer Exhaustion
Buyer Absorption
Seller Exhaustion
Seller Absorption
Each divergence type is automatically identified and visually marked on the chart with colored lines. The indicator also includes built-in alert conditions for all four divergence types, allowing traders to receive real-time notifications when potential reversal signals occur.
By default, the oscillator is a candle-style visualization of the Money Flow Index (MFI), enhanced with volatility filtering via a VWMA-based ATR. However, users can replace the default MFI oscillator with any external source using the “Plug External Source” input, enabling full customization and compatibility with other indicators.
Key features:
🔍 Detects both exhaustion and absorption divergences
🔔 Alerts for each divergence type
🕯️ Candle-style oscillator visualization
🔌 Optional input for external indicator sources
⚙️ ATR-based filtering for precision
Ideal for traders seeking to spot early signs of trend reversals or momentum shifts with customizable flexibility.

Multi-Market Trend-Pullback Alerts (EMA20/50 + RSI) [v6]//@version=6 replaces 5
Some functions (like label.delete) need to be called as methods
Minor syntax tightening around string concatenation and label management
All alertcondition() and table logic still works, but must be explicitly version 6 compatible

34 EMA Cross Alert (Once per sequence)This script is used when 5-12 EMA is above 34-50 EMA and if price corrects to 34-50 cloud and bounces i.e. price crosses below 34 EMA and then cross above 34 EMA, it will trigger alert.
MTF FVG Confluence v6 — JSON Alerts via alert()This strategy combines multi-timeframe confluence with candlestick analysis and fair value gaps (FVGs) to generate structured long/short entries. It aligns Daily and 4H EMA trends with 1H MACD momentum, then confirms with engulfing candles and FVG zones for precision entries. Risk management is built-in, featuring stop-loss, 3R take-profit targets, and optional break-even logic, with dynamic JSON alerts for webhook automation.
Categories:
Candlestick analysis
Chart patterns
Cycles

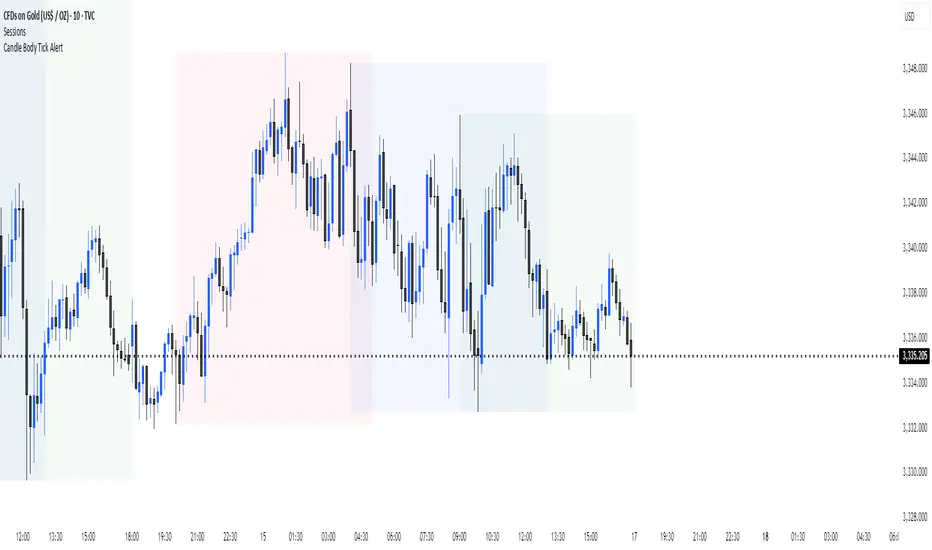
Candle Body Size AlertThis indicator monitors the body size of each candle (close minus open, ignoring wicks) and compares it to a user-defined threshold measured in ticks. If the candle body exceeds the threshold, the indicator triggers an alert condition at the close of the candle.
Features:
1. Adjustable threshold in ticks (default: 4000)
2. Adjustable timeframe (or use chart timeframe)
3. Alerts only at candle close (no intrabar signals)
Use Case:
Designed for traders who want to be notified when unusually large candles form, helping to identify strong momentum moves or volatility spikes.
THE TRINTY - Multi-Timeframe MACD Alignment (Single Alert)Analyzes up to 3 timeframes at the same time waiting for MACD alignment plus determines when it's very bullish, very bearish, or just mixed. Ideal for traders who only want to trade in high probability markets to increase your chances at success. Also, there's only 1 single alert system that you can set for each pair making things much easier instead of setting separate bullish and bearish alerts like most other indicators.

EMA 9/21 Crossover Alert (BerryRight)This indicator gives entry signals through EMA crossover and the gives the opportunity to set up alerts. I will update this indicator with exits in the future. it's written in Pinesctipt v5

Inside Bar With Alert - RajThis indicator helps you reduce your screen time by giving you consistent alerts on the formation of inside bar candle and it gives you bullish and bearish alerts on breakout of the mother candle. So if you believe in inside strategy this indicator will be helpful for you.

Inside Bar Breakout Alert - RajThis indicator is based on the inside bar strategy it help you to cut down your screen time by giving you constant alerts when a inside bar forms while also gives you alert on bullish and bearish break out of the mother candle.

Impulse Alert - Supply (Sell) [Fixed]🟥 Supply Zone (Sell) – Institutional Order Block Detector
This custom indicator automatically detects valid Supply Zones (Sell Zones) based on Smart Money Concepts and institutional trading behavior.
🔍 How It Works:
Identifies strong bearish impulsive moves after price forms a potential Order Block
Valid supply zones are plotted after:
A valid rally–base–drop or drop–base–drop structure
A shift in structure or clear imbalance is detected
The zone is created from the last bullish candle before a strong bearish engulfing move
Zones remain on chart until price revisits and reacts
📊 Use Case:
Ideal for traders using Smart Money Concepts (SMC), Supply & Demand, or ICT-inspired strategies
Perfect for scalping, day trading, or swing setups
Designed for confluence with HTF bias and LTF execution
⚙️ Features:
Supply Zone auto-plotting
Customizable zone color and opacity
Alerts when price returns to the zone (retest entry opportunity)
🧠 Tip for Best Use:
Use in confluence with:
HTF Supply zones (manual or other indicator)
Market Structure breaks
Fair Value Gaps or Imbalance zones
Strong impulsive moves from HTF to LTF
🔁 Future Additions (Coming Soon):
Demand Zone detection
Zone strength rating system
Refined zone filters (volume, candle size, etc.)
Alerts for mitigation or invalidation
📌 Created by: Rohit Jadhav | Real-time market trader | YT/Insta - @GrowthByTrading
💬 Feedback? Drop a comment or connect via profile for updates and tutorials!

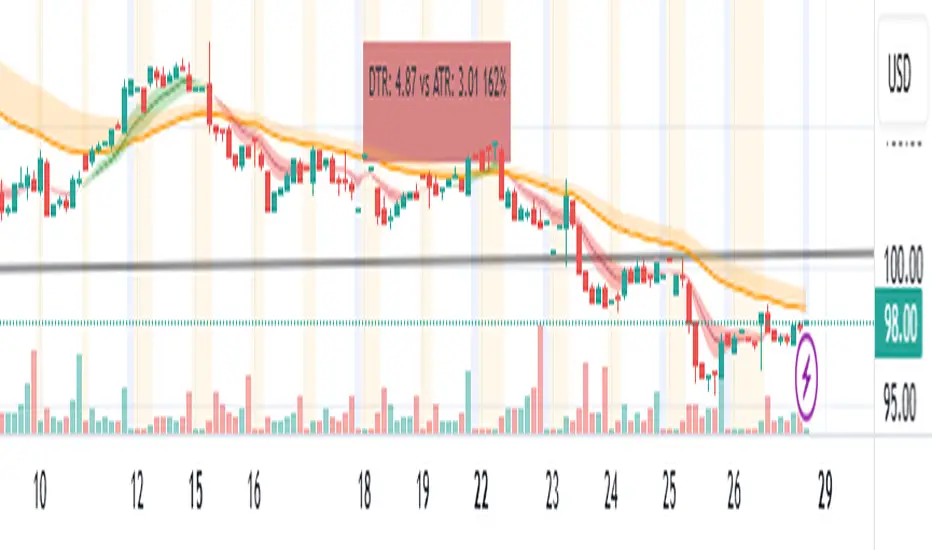
ATR Trailing + Alerts + Price LabelsATR Trend is a clean and intelligent trend-following overlay built for traders who want clarity during both trending and ranging markets.
This indicator dynamically detects bullish and bearish market trends using the Average True Range (ATR), applying a confirmation-based approach to filter out false signals and minor pullbacks.
The trend line is:
Blue 🔵 during uptrends.
Black ⚫ during downtrends.
Continuous, recalculating only when the market truly shifts — not just when price temporarily crosses the line.
When a confirmed trend reversal occurs:
A 🔼 or 🔽 label shows the exact price of the flip.
An alert can be triggered to notify the user immediately.
💡 Features:
✅ Single-line trend direction
✅ Filters out short-term noise
✅ Exact price labeling on trend change
✅ Built-in alerts for up/down trend shifts
⚙️ Inputs:
ATR Period – Length of ATR calculation (default: 14)
ATR Multiplier – Offset for trend line placement (default: 2.0)
Flip Sensitivity – Number of bars required to confirm a trend reversal (default: 3)
This tool is suitable for:
Swing traders avoid false breakouts
Scalpers looking for high-probability trend entries
Algorithmic setups requiring structured trend logic

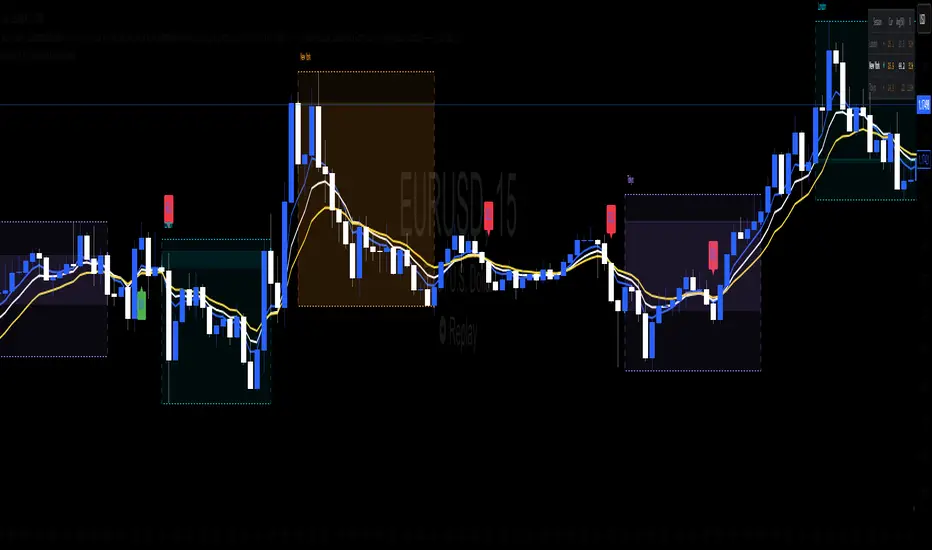
TitanGrid L/S SuperEngineTitanGrid L/S SuperEngine
Experimental Trend-Aligned Grid Signal Engine for Long & Short Execution
🔹 Overview
TitanGrid is an advanced, real-time signal engine built around a tactical grid structure.
It manages Long and Short trades using trend-aligned entries, layered scaling, and partial exits.
Unlike traditional strategy() -based scripts, TitanGrid runs as an indicator() , but includes its own full internal simulation engine.
This allows it to track capital, equity, PnL, risk exposure, and trade performance bar-by-bar — effectively simulating a custom backtest, while remaining compatible with real-time alert-based execution systems.
The concept was born from the fusion of two prior systems:
Assassin’s Grid (grid-based execution and structure) + Super 8 (trend-filtering, smart capital logic), both developed under the AssassinsGrid framework.
🔹 Disclaimer
This is an experimental tool intended for research, testing, and educational use.
It does not provide guaranteed outcomes and should not be interpreted as financial advice.
Use with demo or simulated accounts before considering live deployment.
🔹 Execution Logic
Trend direction is filtered through a custom SuperTrend engine. Once confirmed:
• Long entries trigger on pullbacks, exiting progressively as price moves up
• Short entries trigger on rallies, exiting as price declines
Grid levels are spaced by configurable percentage width, and entries scale dynamically.
🔹 Stop Loss Mechanism
TitanGrid uses a dual-layer stop system:
• A static stop per entry, placed at a fixed percentage distance matching the grid width
• A trend reversal exit that closes the entire position if price crosses the SuperTrend in the opposite direction
Stops are triggered once per cycle, ensuring predictable and capital-aware behavior.
🔹 Key Features
• Dual-side grid logic (Long-only, Short-only, or Both)
• SuperTrend filtering to enforce directional bias
• Adjustable grid spacing, scaling, and sizing
• Static and dynamic stop-loss logic
• Partial exits and reset conditions
• Webhook-ready alerts (browser-based automation compatible)
• Internal simulation of equity, PnL, fees, and liquidation levels
• Real-time dashboard for full transparency
🔹 Best Use Cases
TitanGrid performs best in structured or mean-reverting environments.
It is especially well-suited to assets with the behavioral profile of ETH — reactive, trend-intraday, and prone to clean pullback formations.
While adaptable to multiple timeframes, it shows strongest performance on the 15-minute chart , offering a balance of signal frequency and directional clarity.
🔹 License
Published under the Mozilla Public License 2.0 .
You are free to study, adapt, and extend this script.
🔹 Panel Reference
The real-time dashboard displays performance metrics, capital state, and position behavior:
• Asset Type – Automatically detects the instrument class (e.g., Crypto, Stock, Forex) from symbol metadata
• Equity – Total simulated capital: realized PnL + floating PnL + remaining cash
• Available Cash – Capital not currently allocated to any position
• Used Margin – Capital locked in open trades, based on position size and leverage
• Net Profit – Realized gain/loss after commissions and fees
• Raw Net Profit – Gross result before trading costs
• Floating PnL – Unrealized profit or loss from active positions
• ROI – Return on initial capital, including realized and floating PnL. Leverage directly impacts this metric, amplifying both gains and losses relative to account size.
• Long/Short Size & Avg Price – Open position sizes and volume-weighted average entry prices
• Leverage & Liquidation – Simulated effective leverage and projected liquidation level
• Hold – Best-performing hold side (Long or Short) over the session
• Hold Efficiency – Performance efficiency during holding phases, relative to capital used
• Profit Factor – Ratio of gross profits to gross losses (realized)
• Payoff Ratio – Average profit per win / average loss per loss
• Win Rate – Percent of profitable closes (including partial exits)
• Expectancy – Net average result per closed trade
• Max Drawdown – Largest recorded drop in equity during the session
• Commission Paid – Simulated trading costs: maker, taker, funding
• Long / Short Trades – Count of entry signals per side
• Time Trading – Number of bars spent in active positions
• Volume / Month – Extrapolated 30-day trading volume estimate
• Min Capital – Lowest equity level recorded during the session
🔹 Reference Ranges by Strategy Type
Use the following metrics as reference depending on the trading style:
Grid / Mean Reversion
• Profit Factor: 1.2 – 2.0
• Payoff Ratio: 0.5 – 1.2
• Win Rate: 50% – 70% (based on partial exits)
• Expectancy: 0.05% – 0.25%
• Drawdown: Moderate to high
• Commission Impact: High
Trend-Following
• Profit Factor: 1.5 – 3.0
• Payoff Ratio: 1.5 – 3.5
• Win Rate: 30% – 50%
• Expectancy: 0.3% – 1.0%
• Drawdown: Low to moderate
Scalping / High-Frequency
• Profit Factor: 1.1 – 1.6
• Payoff Ratio: 0.3 – 0.8
• Win Rate: 80% – 95%
• Expectancy: 0.01% – 0.05%
• Volume / Month: Very high
Breakout Strategies
• Profit Factor: 1.4 – 2.2
• Payoff Ratio: 1.2 – 2.0
• Win Rate: 35% – 60%
• Expectancy: 0.2% – 0.6%
• Drawdown: Can be sharp after failed breakouts
🔹 Note on Performance Simulation
TitanGrid includes internal accounting of fees, slippage, and funding costs.
While its logic is designed for precision and capital efficiency, performance is naturally affected by exchange commissions.
In frictionless environments (e.g., zero-fee simulation), its high-frequency logic could — in theory — extract substantial micro-edges from the market.
However, real-world conditions introduce limits, and all results should be interpreted accordingly.

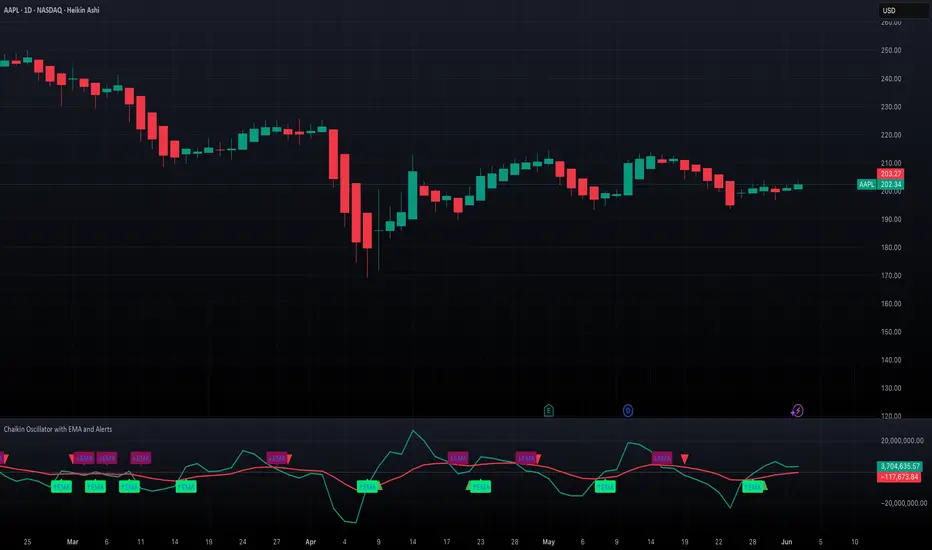
Chaikin Oscillator with EMA and AlertsOverview
This indicator plots the classic Chaikin Oscillator along with an EMA overlay to help identify changes in accumulation or distribution momentum. It includes visual markers and built-in alerts for key crossover events such as crossing the zero line and crossing above or below the Chaikin EMA.
Concepts
The Chaikin Oscillator is calculated as the difference between two EMAs of Accumulation/Distribution (A/D) volume. It is used to measure the momentum behind buying and selling pressure. An EMA is applied to the oscillator itself to smooth out signals and provide an additional layer of trend confirmation. Crossovers above or below zero, and above or below the EMA, are interpreted as potential signals of market sentiment shifts.
How to Use the Indicator
Apply the indicator to any chart and select your preferred short, long, and EMA lengths. The script will plot the Chaikin Oscillator in teal and its EMA in red. Triangles and labels will appear on the chart when the oscillator crosses above or below the zero line, or when it crosses its EMA. Green triangles indicate bullish zero-line crossovers, while red triangles indicate bearish ones. Lime and maroon labels signal EMA crossovers. Use these signals to assess momentum shifts and potential entry or exit points.
Interpretation
When the Chaikin Oscillator is above zero and rising, it suggests strong buying pressure. When it is below zero and falling, it suggests strong selling pressure. A crossover above the EMA may indicate an emerging bullish trend, while a crossover below the EMA may suggest increasing bearish momentum. Using both the zero line and EMA crossover together helps filter noise and improves reliability of momentum-based signals.
Notes
The indicator includes four alert conditions that can be enabled in TradingView to notify you of Chaikin Oscillator crossovers. It works across all asset classes and timeframes. This tool is especially useful for identifying momentum shifts ahead of price moves and for confirming volume-based signals in trend continuation or reversal scenarios. Adjust input lengths to suit your trading style or the volatility of the instrument you are analyzing.
TrendMaster Pro 2.3 with Alerts
Hello friends,
A member of the community approached me and asked me how to write an indicator that would achieve a particular set of goals involving comprehensive trend analysis, risk management, and session-based trading controls. Here is one example method of how to create such a system:
Core Strategy Components
Multi-Moving Average System - Uses configurable MA types (EMA, SMA, SMMA) with short-term (9) and long-term (21) periods for primary signal generation through crossovers
Higher Timeframe Trend Filter - Optional trend confirmation using a separate MA (default 50-period) to ensure trades align with broader market direction
Band Power Indicator - Dynamic high/low bands calculated using different MA types to identify price channels and volatility zones
Advanced Signal Filtering
Bollinger Bands Volatility Filter - Prevents trading during low-volatility ranging markets by requiring sufficient band width
RSI Momentum Filter - Uses customizable thresholds (55 for longs, 45 for shorts) to confirm momentum direction
MACD Trend Confirmation - Ensures MACD line position relative to signal line aligns with trade direction
Stochastic Oscillator - Adds momentum confirmation with overbought/oversold levels
ADX Strength Filter - Only allows trades when trend strength exceeds 25 threshold
Session-Based Trading Management
Four Trading Sessions - Asia (18:00-00:00), London (00:00-08:00), NY AM (08:00-13:00), NY PM (13:00-18:00)
Individual Session Limits - Separate maximum trade counts for each session (default 5 per session)
Automatic Session Closure - All positions close at specified market close time
Risk Management Features
Multiple Stop Loss Options - Percentage-based, MA cross, or band-based SL methods
Risk/Reward Ratio - Configurable TP levels based on SL distance (default 1:2)
Auto-Risk Calculation - Dynamic position sizing based on dollar risk limits ($150-$250 range)
Daily Limits - Stop trading after reaching specified TP or SL counts per day
Support & Resistance System
Multiple Pivot Types - Traditional, Fibonacci, Woodie, Classic, DM, and Camarilla calculations
Flexible Timeframes - Auto-adjusting or manual timeframe selection for S/R levels
Historical Levels - Configurable number of past S/R levels to display
Visual Customization - Individual color and display settings for each S/R level
Additional Features
Alert System - Customizable buy/sell alert messages with once-per-bar frequency
Visual Trade Management - Color-coded entry, SL, and TP levels with fill areas
Session Highlighting - Optional background colors for different trading sessions
Comprehensive Filtering - All signals must pass through multiple confirmation layers before execution
This approach demonstrates how to build a professional-grade trading system that combines multiple technical analysis methods with robust risk management and session-based controls, suitable for algorithmic trading across different market sessions.
Good luck and stay safe!

EMA 200 Price Deviation Alerts (1H Only)This script monitors the price deviation from the 200-period Exponential Moving Average (EMA) exclusively on the 1-hour chart. It generates alerts when the absolute difference between the current price and the EMA 200 exceeds a user-defined threshold (default: 65).
Features:
Works only on 1-hour (60-minute) charts to avoid false signals on other timeframes.
Customizable deviation threshold via script input.
Visual display of the 200 EMA on the chart.
Alert system to notify when price deviates significantly above or below the EMA.
Buy/Sell arrows shown when conditions are met:
Sell arrow appears when price is above the EMA and deviation exceeds threshold.
Buy arrow appears when price is below the EMA and deviation exceeds threshold.
Use this tool to identify potential overextended price moves relative to long-term trend support or resistance on the 1H timeframe.
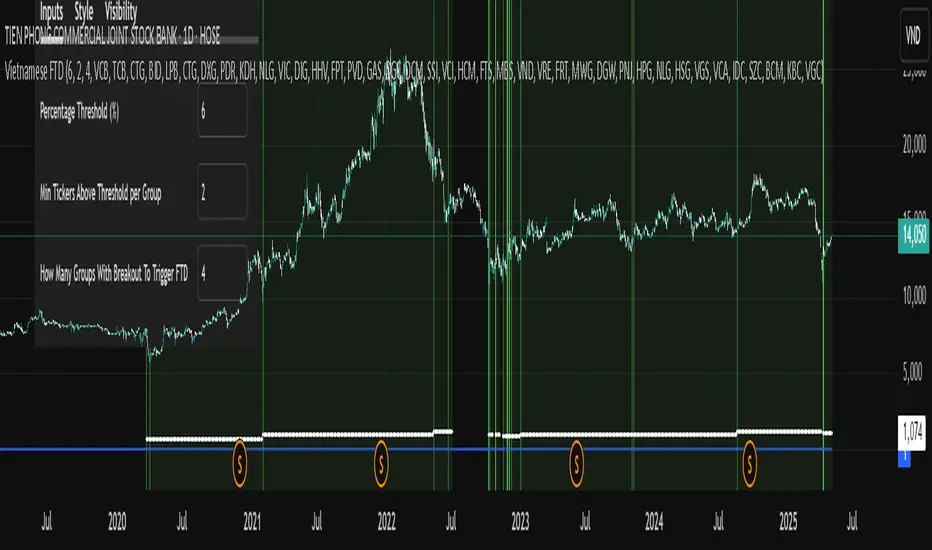
Vietnamese Stock Market FTD (Follow Through Day) AlertA Pine Script implementing William O'Neil’s Follow Through Day (FTD) strategy for the Vietnamese stock market. It scans 7 predefined sector groups (Banks, Real Estate, Retail, etc.) to detect momentum breakouts.
Key Features :
Triggers an FTD signal when ≥X groups (default: 3) have ≥Y stocks (default: 2) rising above a Z% threshold (default: 5%) daily.
Highlights qualifying stocks by group in a dynamic label during alerts.
Visualizes strength via histograms and background shading.
Open-source under Mozilla Public License 2.0 .
Purpose : Identify institutional buying and potential market reversals.