Cari dalam skrip untuk "alert"
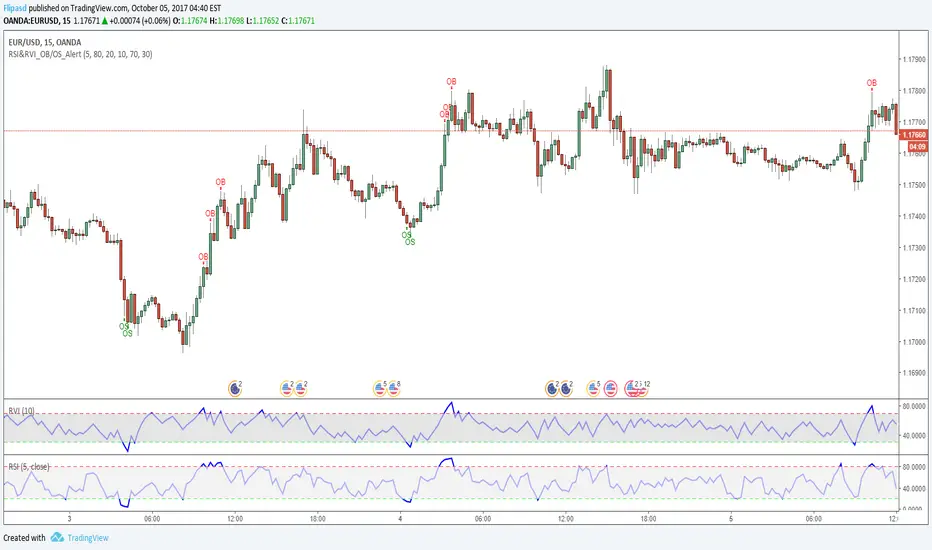
RSI & RVI OB/OS Alert ArrowThe script shows arrows on bars that are in overbought or oversold, based on the set parameters of Relative Strength Index ( RSI ) and Relative Volatility Index (RVI).
Also there is a universal allert, which includes both conditions - overbought and oversold.
You can change the period of RSI and RVI, as well as the upper and lower boundaries of these indicators.
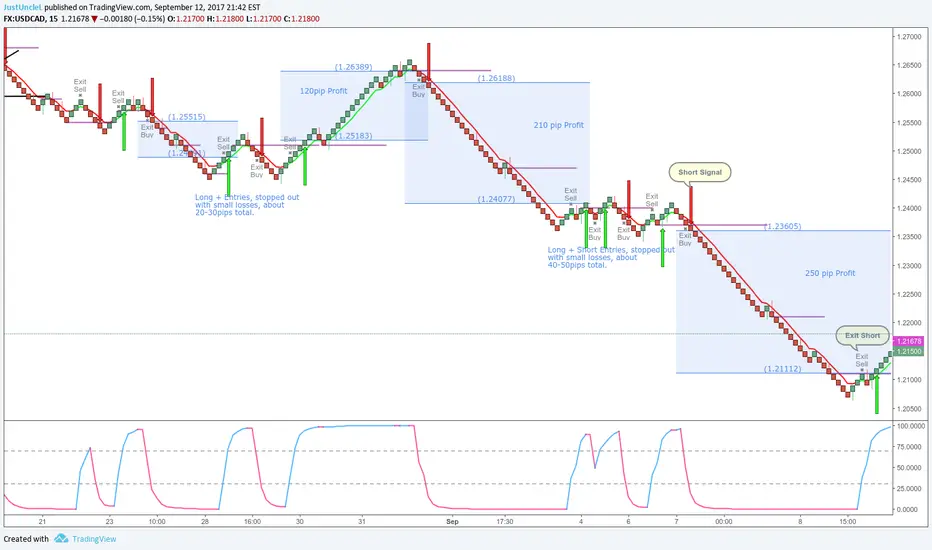
Renko+Moving Average+RMI Alert R3 by JustUncleLThis script idea is designed to be used with 10pip brick (recommended) Renko charts. It combines the Renko price action with a directional coloured EMA (default length 6) and a RMI (instead of the usual RSI) indicator to provide entry and exit signals. RMI is bit like RSI with a built-in momentum factor and works well with Renko.
Signals can optionally be filtered by Daily or Weekly Open, where by only trade long above open and short below open (this option is enabled by default). Exit occur when EMA or RMI reverses direction, or optionally (disabled by default) when the Renko prints a brick in the reverse direction. Each Entry and Exit signal creates an Alertcondition that can be picked up by the TradingView Alarm system.
TIP: To get 10pip Bricks set Renko to "Traditional" type bricks and 0.001 for non-JPY currency pairs, and 0.1 for JPY currency pairs. Also set chart Time frame to 5min or 15mins.
References:
TheLark Relative Momentum Index (RMI)
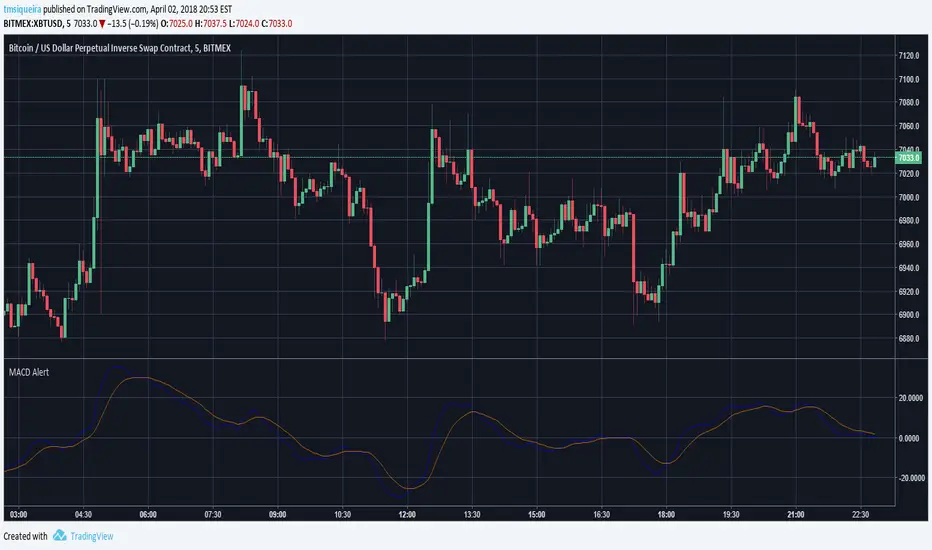
JC_MacD_RSI_Candle_Strat_public//
// Author : Jacques CRETINON
// Last Version : V1.0 11-22-2016
//
// Risk disclaimer : Do not use this script in production environment. We assume no liability or responsibility for any damage to you, your computer, or your other property, due to the use of this script.
//
// Purpose of this script :
// 1- use same pine code for strategy or study script (with simple modifications)
// 2- be able to send alerts : enterlong, entershort, exitlong, exitshort, stoplosslong, stoplossshort, takeprofitlong, takeprofitshort in a study script like a strategy script should do
// 3- do not repaint (I HOPE)
//
// RoadMap :
// 1- manage : Trailing Stop Loss and Trailing Stop Loss offset
//
// I use this script :
// 1- with default value for XAUUSD, current chart resolution : 1mn, large timeframe : 15mn.
// 2- That's why I hard code MACD5 (5mn average), MACD15 (15mn average), MACD60 (1h average) ...
// 3- MACD, RSI (1mn and 15mn) and Candles info are my inputs to take any decisions
//
// I do not publish my enterLong, enterShort, exitLong and exitShort conditions (lines 204 to 207 are sample !) as they are not as perfect as I'd like. Fell free to use your own conditions :)
//
// Please, report me any bug, fell free to discuss and share. English is not my natural language, so be clement ;) Happy safe trading :)

Stefan Krecher: Jeddingen Divergence v2This is an update to my script:
Stefan-Krecher-Jeddingen-Divergence/
The behaviour is exactly the same, I just added the option to create alerts based on this indicator

Doji signalsYou can create an alert based on this signal :)
Works on standard and Heikin-ashi candles
You can also adjust the sensitivity (how big you want the body of the doji)
:)


Harami Reversal Alerts BB Touch (Strict First Candle)Harami Reversal Alerts BB Touch (Strict First Candle)
Harami Reversal Alerts BB Touch (Strict First Candle)Harami Reversal Alerts BB Touch (Strict First Candle)Harami Reversal Alerts BB Touch (Strict First Candle)Harami Reversal Alerts BB Touch (Strict First Candle)Harami Reversal Alerts BB Touch (Strict First Candle)

Gamma Levels w/AlertsPlots Gamma Levels for identifying Market Positioning. Has alert function on the specific levels.
---To apply to different tickers You Must:
1. apply to chart layout
2. input ticker specific levels
3. Save as an INDICATOR TEMPLATE titled same as ticker (check the remember symbol box)
Now when switching to different tickers, simply open that template

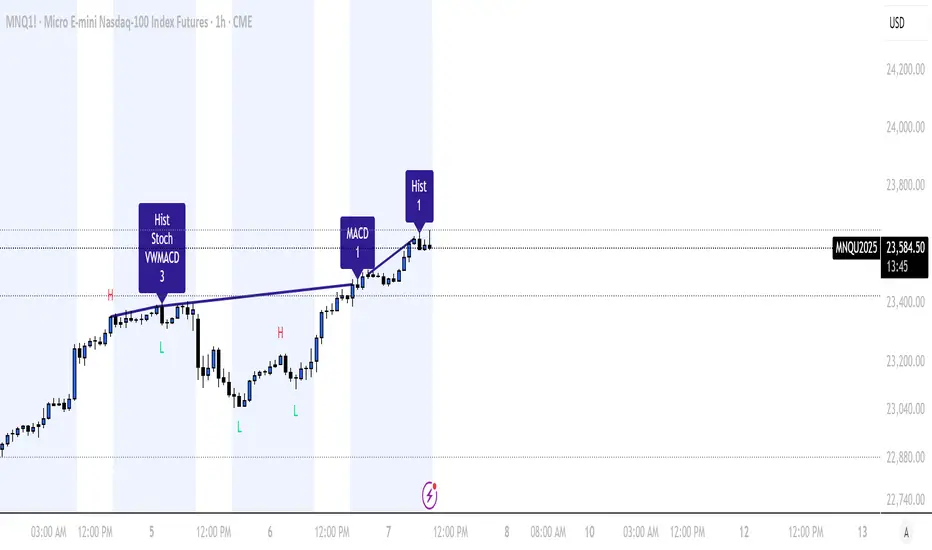
MACD Divergence auto displayed on chart, with alertsMACD Pivot Divergence Detector
This tool identifies MACD histogram divergences based on confirmed pivot highs and lows.
Instead of comparing swing points on the MACD line, this script focuses specifically on the histogram, which measures momentum shifts between MACD and Signal.
How it works
The script detects confirmed pivots using a two-bar swing structure.
When price breaks above a previous pivot high, the script compares the MACD histogram value at that pivot to the current histogram value:
• If price makes a higher high while the histogram makes a lower high, a potential bearish divergence is marked.
The reverse logic is applied for bullish divergence when price breaks below a pivot low.
What makes this script unique
It uses pivot-confirmed histogram values, not lookback-based divergence.
It evaluates divergence only at actual highs/lows, reducing false positives.
It marks divergence directly on the candles for visual clarity.
Alert conditions are included for automated detection.
How to use
Bullish signals may highlight potential momentum loss in downtrends; bearish signals may highlight momentum loss near highs. Divergence does not guarantee reversal and should be combined with broader context, structure, or trend analysis.

SCOB Pattern with ERC & AlertsSingle Candle Block (SC0B) consists of a single candle appearing at a significant price level, indicating a confirmed reversal in price direction from that particular area of interest.
SCOB is primarily used to confirm and execute trades.
Using a single candle block to enter a trade minimizes risk and maximizes reward.
Single bullish candle block?
1st candle closes at bullish point of interest with a short or long wick.
2nd candle sweeps the low of previous(1st) candle and closes above the low of previous candle.
3rd candle closes above the high of 2nd candle.
How to trade with Scob bullish.
To Trade using Bullish SCOB you have to wait for price to come down and test the single candle order block.
When price tests the SCOB you can directly execute a buy trade or for a precise entry you can wait for a market structure shift in lower time frame.
Scob discount is the opposite of price increase.
This strategy should only be used when price "sweeps through key lever, liquidity, imbalance, poi htf areas.
This indicator will add a filter to help you reduce signal noise.
Use the "Use engulfing candle to test" function to filter the 3rd candle.
Only search for Scob if the 3rd candle is an Engulfing candle.
The logic for finding Engulfing candles can be changed based on the "% maximum wick length" option. The default is that the candle wick is 25% of the total candle wick length.
You can also use the alert function when Scob appears
With Smart money concept, no strategy is perfect in trading, so you should not risk too much of your capital on this strategy.
To be safer, always remember to use stop loss for every trade.

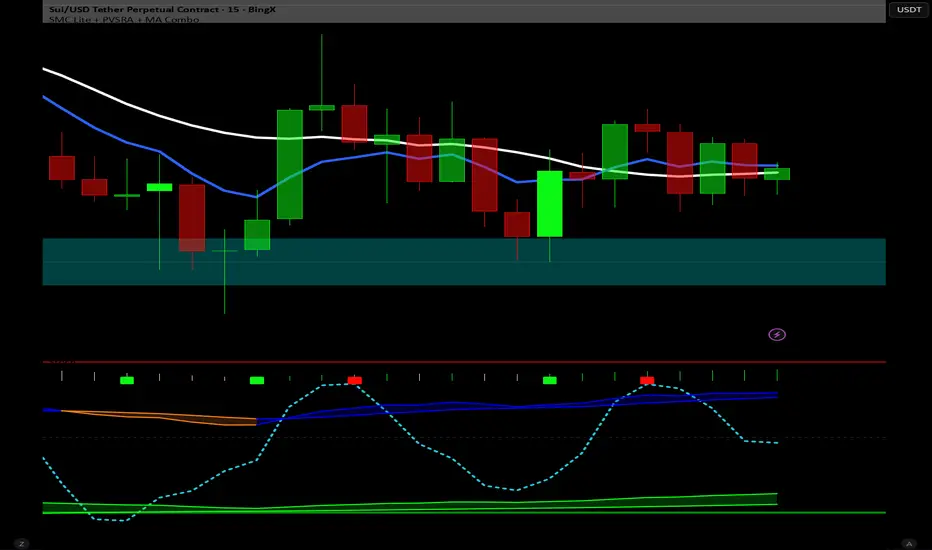
Dual MACD With Pilot Background + + Stoch RSI Alert HELL 2macd 1 chart time macd 2 4x chart time with over bought and over sold stoc rsi alerts
AI Candlestick Pattern Identifier — Arrows & AlertsAI shows you high confidence candlestick patterns so that you can identify them quickly. Buy/Sell arrows will be placed alongside the pattern to alert you of which direction the indicator believes the market will go, as well as showing you the confidence in that indicator.

Wick % Highlighter + AlertThis indicator indicates when the is a wick grater then 1%, You can also add alerts when the indicator fires

Mag 8 ± VWAP AlertI have been following Mag 7 plus Avgo for directional indicators for overall market. This is a chart that displays those over or under vwap and alerts can be added, ie 4 of 8 are under vwap, etc.

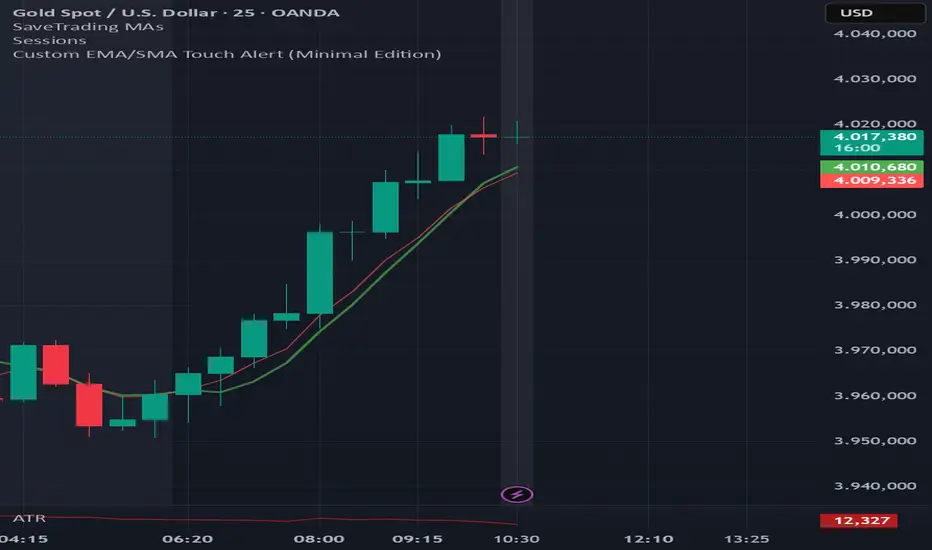
EMA6 or SMA6 Touch AlertThis script monitors the market and notifies you whenever the price touches either the 6-period EMA or the 6-period SMA.
It helps identify potential pullbacks, reaction points, or entry zones, as price interaction with these moving averages often signals short-term market shifts.
What the script does:
Calculates the EMA 6 and SMA 6
Detects if price touches either moving average within the candle
Plots both lines on the chart for visibility
Allows you to set alerts to receive automatic notifications
Best suited for:
Scalping
Day Trading
Pullback Entries
Short-term trend reactions
VIX Overnight Unch or Up AlertThis indicator alerts when VIX opens the day unchanged or higher on the day. If in fact VIX opens up unchanged or higher, it will display near the first bar of the day, previous day's close time and level and the opening time and level. The close time is typically 16:15 New York Time and the opening time is 09:30 or the first print a few minutes later. I use TVC:VIX instead of CBOT because TVC for me is real time. I also use the 1 minute chart and the script is coded as 1 minute.

High Volume AlertThis Pine Script monitors trading volume in real time and alerts you whenever current volume is unusually high — specifically, when it’s greater than a chosen multiple (for example, 1.5×) of the average volume over a recent period (for example, 20 bars).
It’s a quick way to detect volume spikes, which often precede breakouts or reversals.

Koncorde Crossing Screener (UP/DOWN) AlertThis indicators works on Koncorde Crossing Pattern, generating alerts when Cross is Up (buy) and Down (sell).

Strat 2-1-2 Reversal Alerts v2Trying out a new alert! first time. be nice, this will be cool thos!!! woooho
Green & Red Bar AlertsThis indicator identifies when a bar (candle) closes green or red and provides visual markers plus alert notifications.

Divergence Mucho Indicators w/ AlertsUsed to signal divergences of well known indicators bearish or bullish. I prefer to create the alert option that shows 4 or more signaling.
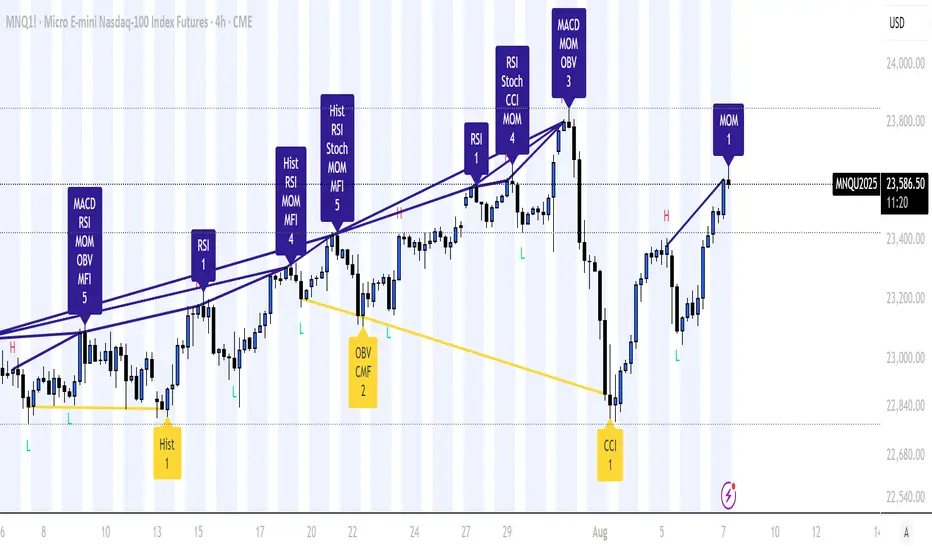
Divergence Mucho Indicators v6 AlertsShows divergence for well known indicators. Allows option to create alert for 4 or more divergences signaling.