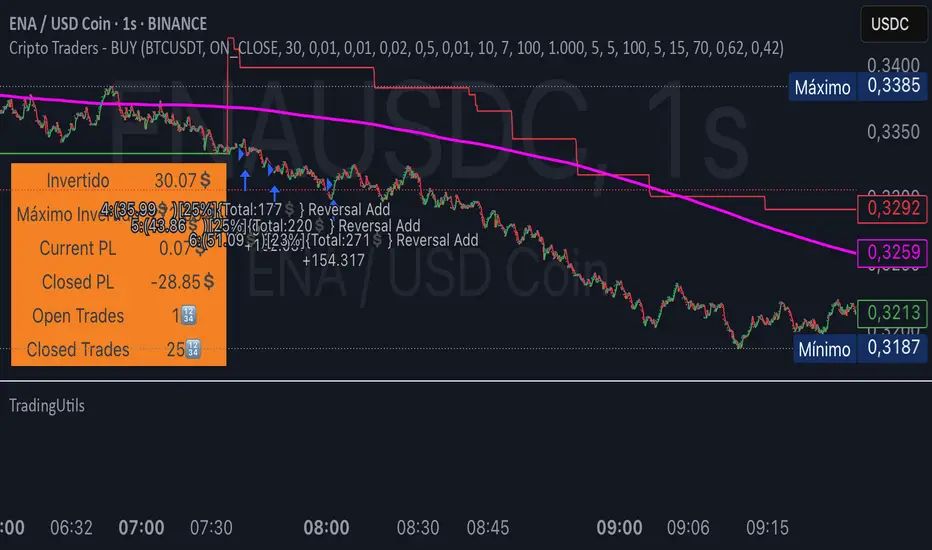
TradingUtilsLibrary "TradingUtils"
Utility library for common trading functions
calcVariation(price, threshold)
Calculates variation of a price based on a threshold
Parameters:
price (float) : (float) The price to be varied
threshold (float) : (float) The threshold for the variation
Returns: (float) The varied price
sendAlert(action, symbol, orderType, quantity, message)
Sends an alert message in JSON format
Parameters:
action (string) : (string) The action to be taken (e.g., "BUY", "SELL")
symbol (string) : (string) The trading symbol (e.g., "BTCUSDT")
orderType (string) : (string) The order type (e.g., "MARKET")
quantity (float) : (float) The quantity of the order
message (string) : (string) The message to be included in the alert
updateLine(condition, index, price, lineColor)
Updates or creates a line on the chart
Parameters:
condition (bool) : (bool) Condition to check if the line should be updated or created
index (int) : (int) The current bar index
price (float) : (float) The price value for the line
lineColor (color) : (color) The color of the line
Returns: (line) The updated or newly created line
Cari dalam skrip untuk "alert"
FrostyBotLibrary "FrostyBot"
JSON Alert Builder for FrostyBot.js Binance Futures and FTX orders
github.com
More Complete Version Soon.
TODO: Comment Functions and annotations from command reference ^^
TODO: Add additional whitelist and symbol mappings.
leverage()
buy()
sell()
cancelall()
closelong()
closeshort()
traillong()
trailshort()
long()
short()
takeprofit()
stoploss()

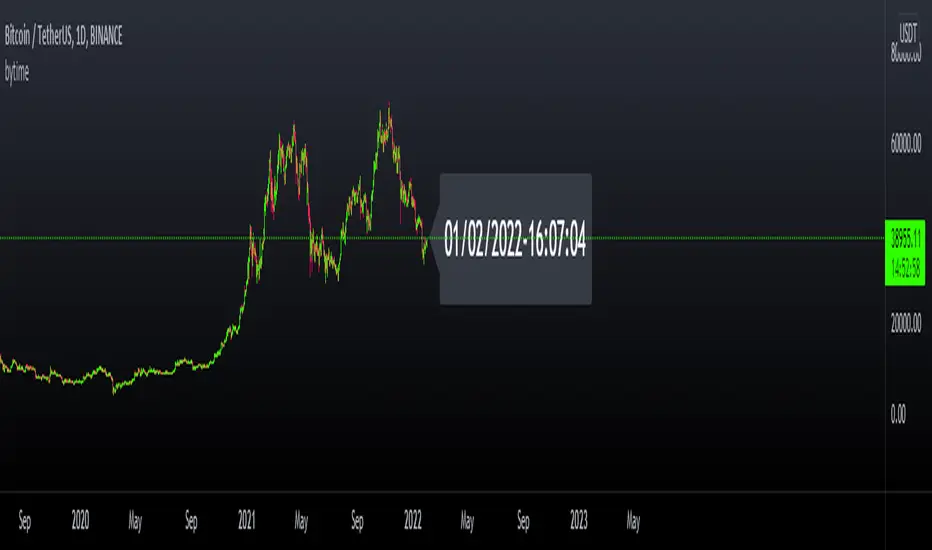
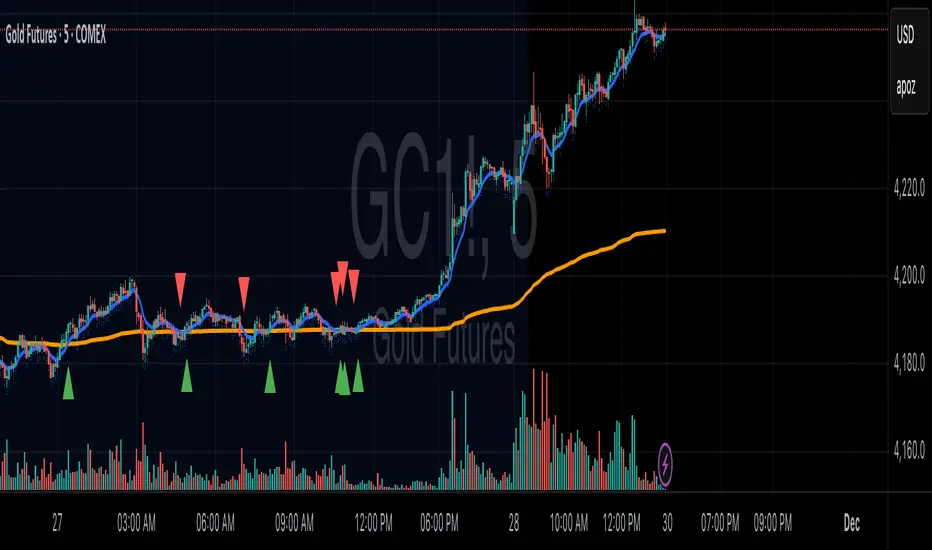
bytimeLibrary "bytime"
TODO: to do something at the specified time.
////Return =>> ht = hour , mt = minute , st = second ,Dt = Day, Mt = month, Yt = year , dateTime = full time format./////////////
Note : Remember to always add import when you call our library and change Gtime() to Timeset.Gtime() is used to access internal data.
import hapharmonic/bytime/1 as Timeset
=Timeset.Gtime()
/////////////Set a time to trigger an alert./////////////
ck = false
///hour : minute : second
if ht == TH and mt == TM and st == TS
//some action
//...
//.
ck := true
Gtime()
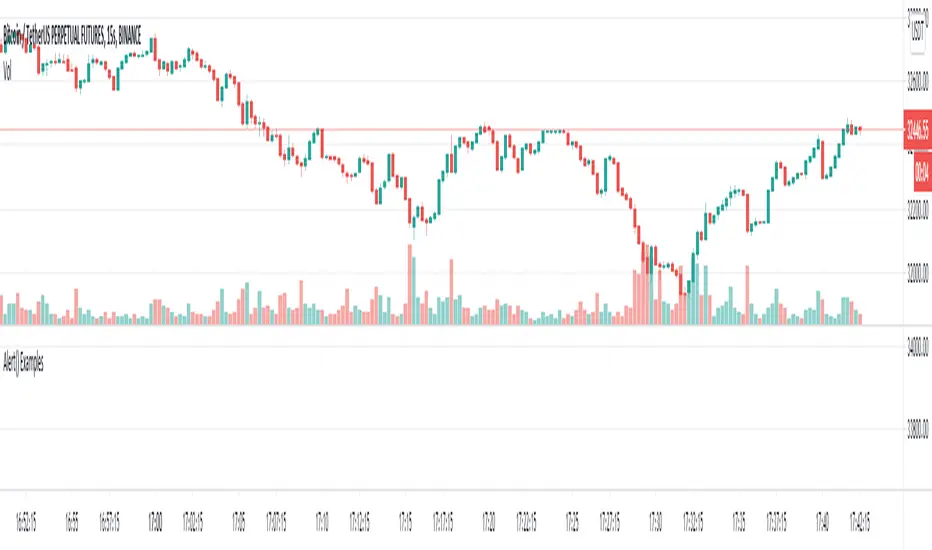
Alert() Example syntax builderToday Tradingview released a lovely new update that I am sure many are eager to play with.
Here is a little example script of how you can use this fantastic new update to include a built-in syntax builder for integration with Autoview into all your scripts going forward.
It is only configured for basic commands, but should be a great starting point for most, and at bare minimum a glimpse at the possibilties this latest update provides.
Add this to your chart and go to the settings to see all the options that can be configured.
Go ahead, fire some alerts and see how it all affects what is passed through the alert ready to hit the exchange.
Strat-test ALERTSAlerts script, accompanying the "Strategy Tester EMA-SMA-RSI-MACD" script,
when you find a good strategy, you can use the same settings in this Alert script and
you'll have your alerts
Have fun!

Alert-QuarryLake Indicator Map - ATR Trend Following Strategy A lot of times I don't like my chart crowding with indicators, thus the reason for creating this script for my strategy QuarryLake.
This script also comes with alert.
Below is the explanation for QuarryLake
I have also updated the script in version 4.
This strategy consists of 3 indicators that I found works quite well together.
Keltner Channel, Waddah Attah Explosion, and Volatility Stop.
You can find WAE here
KC Period = 200
KCATR = 5
Vstop Period = 3
Vstop Mult = 1.5
Long when close > KC, close > Vstop, WAE trendUp
Short when close < KC, close < Vstop, WAE trendDown
Works well on BTCUSD XBTUSD, as well as other major liquid Pair.
Feel free to follow me on Twitter @Lancelot_Auger for more free Alpha.
Please acknowledge my effort by like and follow.
And lastly,
Save Hong Kong, the revolution of our times.

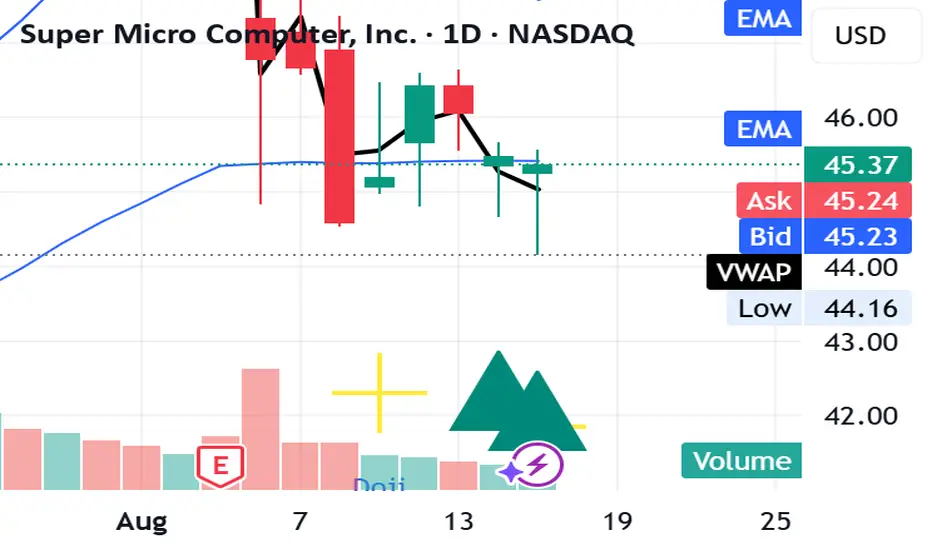
VWAP & EMA9 Cross AlertAlerts the user when VWAP and EMA 9 cross. It gives a general direction of the market to help make decisions.
VWAP & EMA9 Cross AlertAlerts when EMA9 and VWAP Cross. This provides an indicator of general market direction based on these 2 indicators.


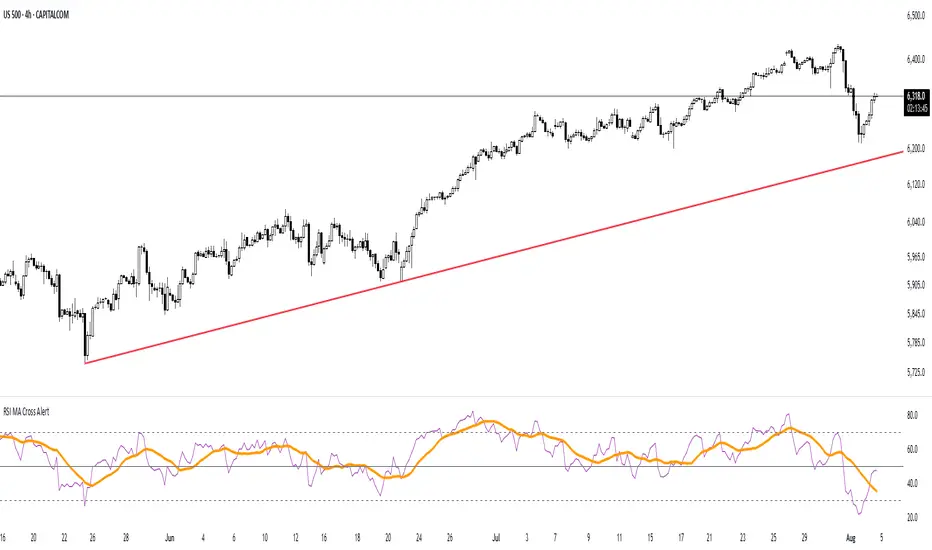
RSI MA Cross AlertAlerts when RSI-based Moving Average crosses above 50. Can be used on any symbol and timeframe. Displays RSI, RSI-MA, and levels 30/50/70.
OteHmacSha256Library "OteHmacSha256"
Library to use HMAC SHA-256 by OgahTerkenal
hmac_sha256(string) HMAC SHA-256
Parameters:
string : msg String to be hashed
Returns: Return a hashed string in hex format and an array of 8 32 bits integer
Library to use HMAC SHA-256 for authenticating alert message going out from TradingView.
It has limitation on allowed characters (because PineScript cannot access the underlying bits of each ASCII) from ASCII 32 to 126 only.
Usage Example section at the end of the source code pretty much tell everything about this library.
General example as how to import to your PineScript code is not included (please refer to the PineScript manual).

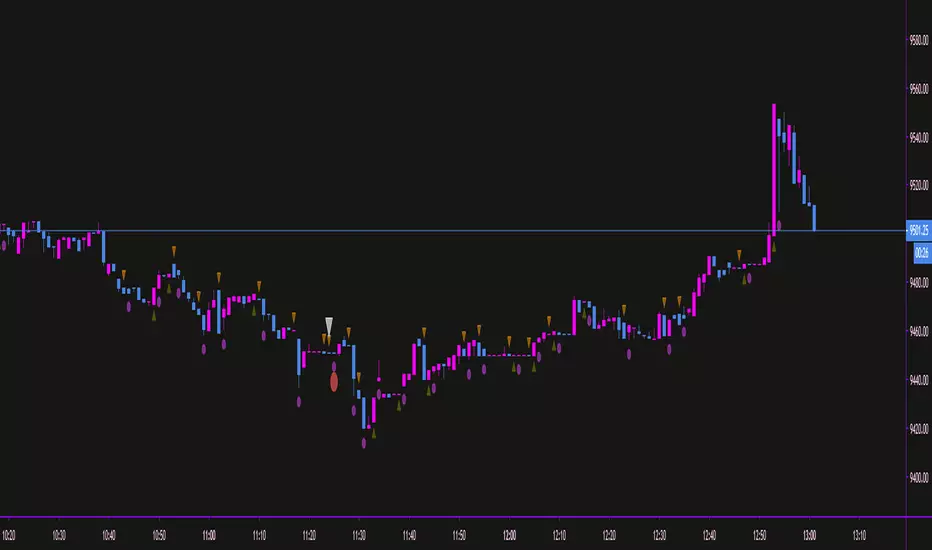
No Shadow Candles - Alertsalert script to detect candles with no wick, for testing.
scripted on request.
Alert Batches v2This version triggers every batch within each candle. The previous version only triggered one batch per candle.
This will not trigger batches in perfect order, but I left the "sequential" option because it still triggers the batches in order more often than not.

Alerts Killzones + PD/WL/ML Levels (No Labels)This indicator automatically highlights the London and New York killzones and triggers alerts at key price levels — without adding any labels or text clutter to the chart.
Features:
Highlights London (10:00–13:00) and New York (15:00–17:00) sessions (GMT+3, Romania).
Draws and updates key levels automatically:
PDH / PDL – Previous Day High & Low
WH / WL – Previous Week High & Low
MH / ML – Previous Month High & Low
Alerts when price touches any of these levels.
Alerts at session opens and closes for both London and New York.
Clean interface – no labels or extra markers on chart.
Ideal for:
Traders who follow ICT concepts, session-based setups, or liquidity sweeps and want precise alerts without chart noise.

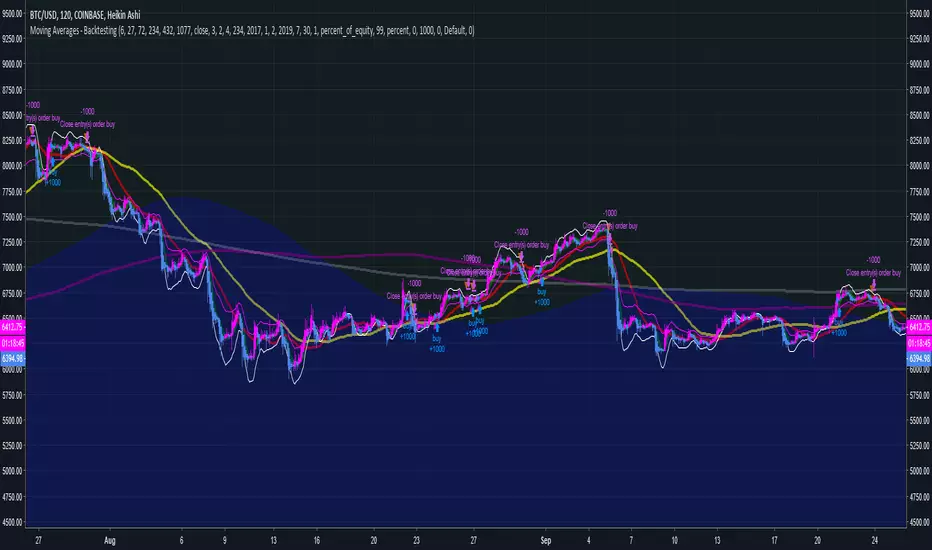
Moving Averages - BacktestingAlerts script that has triggers on multiple moving average crossovers so that profit is maximised, it also has an optional control moving average, enabled by default, that when active will stop trading when the price (first ma) is below the control moving average.
Source code is open so that others can use and modify
Click Below for Alerts Study version:
Disclaimers, not an expert, not intended to be financial advise.
Biffy
myAutoviewAlertsLibrary "myAutoviewAlerts"
My Alerts Functions - To use with autoview
@returns - These functions returns a string to use in alerts to send commands to autoview. You can open an order, place a stop or take order, close an opened order or a opened position, or open a hedge position.
@param a = String - Account Identification
@param e = String - Exchange
@param s = String - Symbol
@param b = String - Book Side
@param q = Float - Quantity
@param fp = Float - Fixed Price
@param delay = Integer - In Seconds
@param i = Integer - Account Index (to multiple accounts allerts)
@param base = String - Base Currency (bitmex) - "Tether" or "Bitcoin"
@param fsl = Float - Stop Loss Limit Price
@param c = String - Close -> "order" or "position"
@param ro = Bool - Reduce Only
@param sl = Bool - Stop Loss -> bitfinex
@param t = String - Type -> "market" or "limit"
@function f_order => Open Orders
@function f_stop => Set Stop Loss Order
@function f_take => Set Take Order
@function f_closeOrder => Close Open Orders
@function f_closePosition => Close Open Positions
@function f_hedge => To Open a Hedge Position (short 100% of balance)

Alerts EMA RSI [ Buy/Sell ]Buy alerts when RSI cross over 30, 40, 50, 60, 70 and EMA5 changes > 0.
Sell alerts when RSI cross down 80, 70, 60, 50, 40 and EMA5 changes < 0.
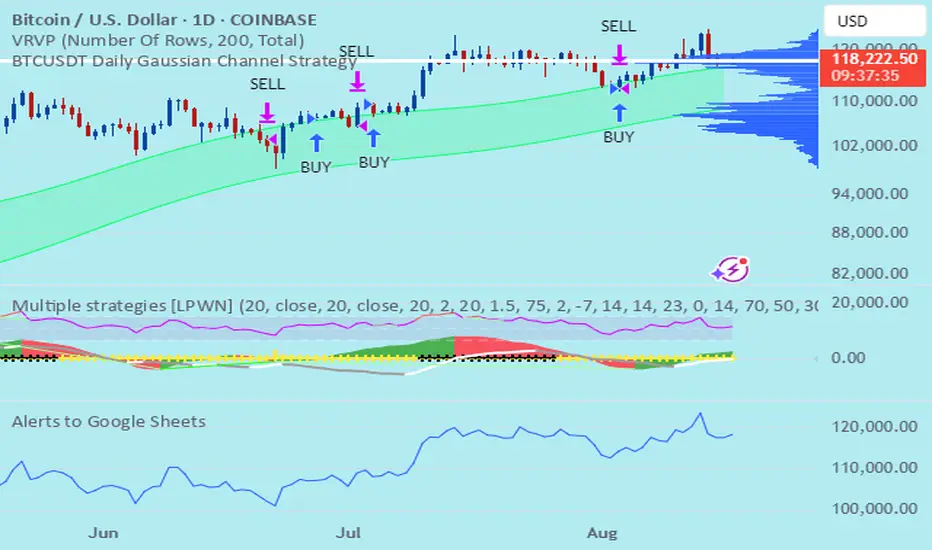
Alerts to Google Sheetsa script that will send us alerts from TradingView. For simplicity, I’ve created a basic script that sends long/short signals for each bar, depending on its color. In this example, I construct the JSON manually using string concatenation. This is a straightforward example, but of course, you can create and run much more complex scripts if needed.
Alert Kabi Family Unlimited Alarm indicator for any time frame and any type of currency, stock and index
اندییکاتور آلارم نامحدود برای هر تایم فریم و هر شاخص و ارز و سهام
Settings :
1- Before starting, clear all alarms in the trading view alarm section
2- Specify your alarm areas and currency pairs in the indicator settings section
3- Go to the trading view alarm section, click create alert, select the name of the indicator and click OK
4- Good Luck
T e L : @Ar3781
1- قبل از شروع تمام آلارم های تریدینگ ویو را پاک کنید
2- در قسمت تنظیمات اندیکاتور نواحی آلارم و جفت ارز خود را مشخص کنید
3- به قسمت الارم تریدینگ ویو رفته ایجاد هشدار را زده و اسم اندیکاتور را انتخاب کنید و اوکی کنید
4- مـــــــوفق بــــــاشـید

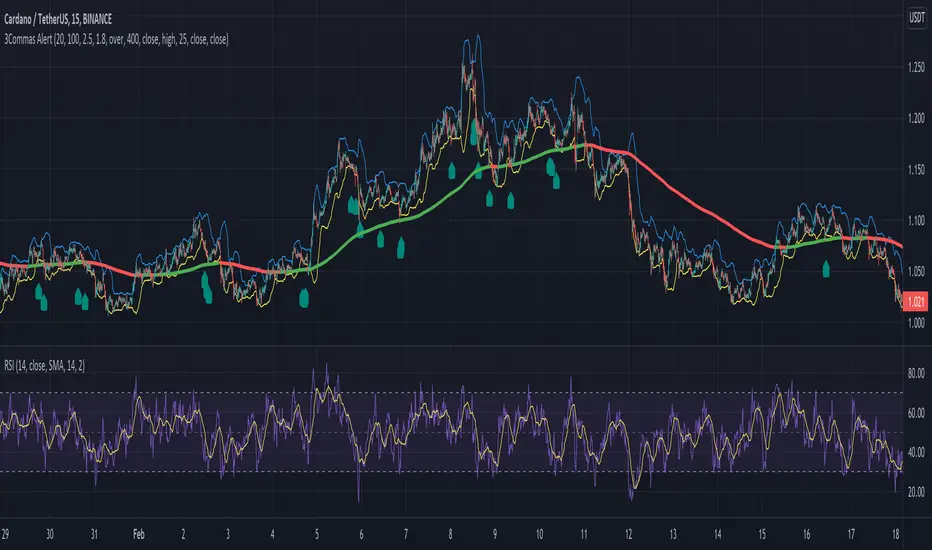
Alert for 3Commas Bollinger StrategyThis is just an alert for the 3Commas Bollinger Strategy written by tedwardd
Rule Number 1 Signals [ALERTS]Alerts version of rule number 1 signals, a long-only strategy for long term investors to help them enter positions more optimally

QuantNomad - Significant Pivot Reversal Strategy AlertsAlerts for "Significant Pivot Reversal Strategy":
As one of the ways to filter out insignificant levels I decided to check that pivot point is not above/below neighbors, but check that it's above/below at least by a certain amount.
I use ATR, so in params, you can set length of ATR and also ATR multiplier. The new level will be calculated only if PP will be above/below neighbors by atr * atr_mult.
It seems this approach might help in some cases.
