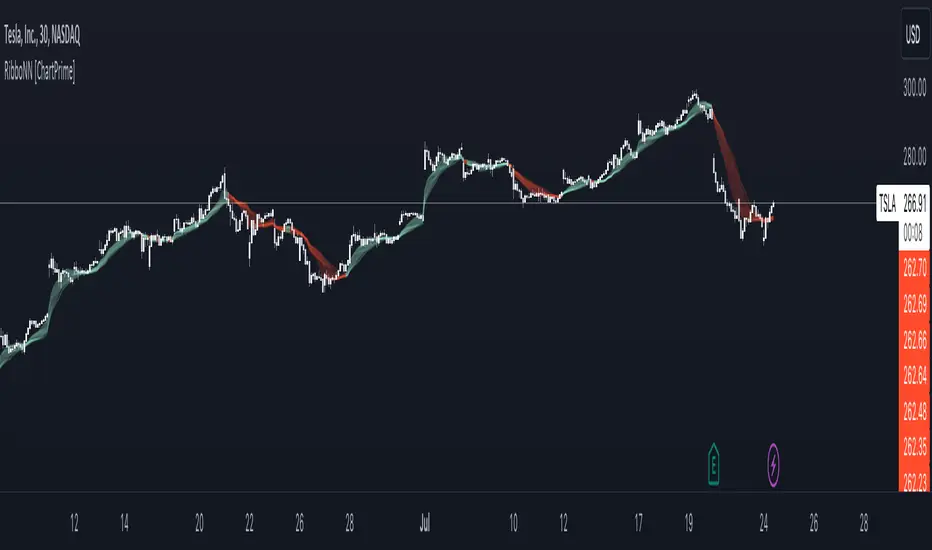
RibboNN Machine Learning [ChartPrime]The RibboNN ML indicator is a powerful tool designed to predict the direction of the market and display it through a ribbon-like visual representation, with colors changing based on the prediction outcome from a conditional class. The primary focus of this indicator is to assist traders in trend following trading strategies.
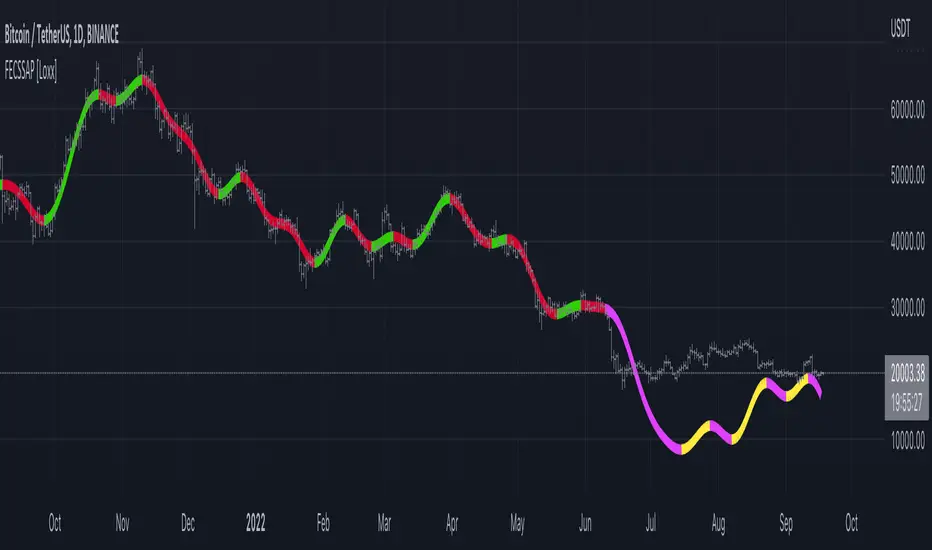
The RibboNN ML in action
Prediction Process:
Conditional Class: The indicator's predictive model relies on a conditional class, which combines information from both longcon (long condition) and short condition. These conditions are determined using specific rules and criteria, taking into account various market factors and indicators.
Direction Prediction: The conditional class provides the basis for predicting the direction of the market move. When the prediction value is greater than 0, it indicates an upward trend, while a value less than 0 suggests a downward trend.
Nearest Neighbor (NN): To attempt to enhance the accuracy of predictions, the RibboNN ML indicator incorporates a Nearest Neighbor algorithm. This algorithm analyzes historical data from the Ribbon ML's predictive model (RMF) and identifies patterns that closely resemble the current conditional prediction class, thereby offering more robust trend forecasts.
Ribbon Visualization:
The Ribbon ML indicator visually represents its predictions through a ribbon-like display. The ribbon changes colors based on the direction predicted by the conditional class. An upward trend is represented by a green color, while a downward trend is depicted by a red color, allowing traders to quickly identify potential market directions.
The introduction of the Nearest Neighbor algorithm provides the Ribbon ML indicator with unique and adaptive behaviors. By dynamically analyzing historical patterns and incorporating them into predictions, the indicator can adapt to changing market conditions and offer more reliable signals for trend following trading strategies.
Manipulation of the NN Settings:
Smaller Value of Neighbours Count:
When the value of "Neighbours Count" is small, the algorithm considers only a few nearest neighbors for making predictions.
A smaller value of "Neighbours Count" leads to more flexible decision boundaries, which can result in a more granular and sensitive model.
However, using a very small value might lead to overfitting, especially if the training data contains noise or outliers.
Larger Value of "Neighbours Count":
When the value of "Neighbours Count" is large, the algorithm considers a larger number of nearest neighbors for making predictions.
A larger value of "Neighbours Count" leads to smoother decision boundaries and helps capture the global patterns in the data.
However, setting a very large value might result in a loss of local patterns and make the model less sensitive to changes in the data.
Penunjuk Pine Script®