[Sextan] PINEv4 Sextans Backtest FrameworkLevel: 5
Background
Backtesting of technical indicators and strategies is the most common way to understand a quantitative strategy. However, the complicated configuration and adaptation work of backtesting many quantitative tools makes many traders who do not understand the code daunted. Moreover, although I have written a lot of strategies,
However, I am still not very satisfied with the backtest configuration and writing efficiency. Therefore, I have been thinking about how to build a backtesting framework that can quickly and easily evaluate the backtesting performance of any indicator with a "long/short entry" indicator, that is, a "simple backtesting tool for dummies". The performance requirements should be stable, and the operation should be simple and convenient. It is best to "copy", "paste", and "a few mouse clicks" to complete the quick backtest and evaluation of a new indicator.
Luckily, I recently realized that TradingView provides an "Indicator on Indicator" feature, which is the perfect foundation for doing "hot swap" backtesting. My basic idea is to use a two-layer design. The first layer is the technical indicator signal source that needs to be embedded, which is only used to provide buy and sell signals of custom strategies; the second layer is the trading system, which is used to receive the output signals of the first layer, and filter the signals according to the agreed specifications. , Take Profit, Stop Loss, draw buy and sell signals and cost lines, define and send custom buy and sell alert messages to mobile phones, social software or trading interfaces. In general, this two-layer design is a flexible combination of "fixed and flexiable", which can meet the needs of most traders to quickly evaluate the performance of a certain technical indicator. The first layer here is flexible. Users can insert their own strategy codes according to my template, and they can draw buy and sell signals and output them to the second layer. The second layer is fixed, and the overall framework is solidified to ensure the stability and unity of the trading system. It is convenient to compare different or similar strategies under the same conditions. Finally, all trading signals are drawn on the chart, and the output strategy returns. test report.
The main function:
The first layer: "{Sextan} Your Indicator Source", the script provides a template for personalized strategy input, and the signal and definition interfaces ensure full compatibility with the second layer. Backtesting is performed stably in the backtesting framework of the layer. The first layer of this script is also relatively simple: enter your script in the highlighted custom script area, and after ensuring the final buy and sell signals long = bool condition, short = bool condition, the design of the first layer is considered complete. Input it into the PINE script editor of TradingView, save it and add it to the chart, you can see the pulse sequence in yellow (buy) and purple (sell) on the sub-picture, corresponding to the main picture, you can subjectively judge that the quality of the trading point of the strategy is good Bad.
The second layer: "{Sextan} PINEv4 Sextans Backtest Framework". This script is the standardized trading system strategy execution and alarm, used to generate the final report of the strategy backtest and some key indicators that I have customized that I find useful, such as: winning rate , Odds, Winning Surface, Kelly Ratio, Take Profit and Stop Loss Thresholds, Trading Frequency, etc. are evaluated according to the Kelly formula. To use the second layer, first load it into the TrainingView chart, no markers will appear on the chart, since you have not specified any strategy source signals, click on the gear-shaped setting next to the "{Sextan} PINEv4 Sextans BTFW" header button, you can open the backtest settings, the first item is to select your custom strategy source. Because we have added the strategy source to the chart in the previous step, you can easily find an option "{Sextan} Your Indicator Source: Signal" at the bottom of the list, this is the strategy source input we need, select and confirm , you can see various markers on the main graph, and quickly generate a backtesting profit graph and a list of backtesting reports. You can generate files and download the backtesting reports locally. You can also click the gear on the backtest chart interface to customize some conditions of the backtest, including: initial capital amount, currency type, percentage of each order placed, amount of pyramid additions, commission fees, slippage, etc. configuration. Note: The configuration in the interface dialog overrides the same configuration implemented by the code in the backtest script.
How to output charts:
The first layer: "{Sextan} Your Indicator Source", the output of this script is the pulse value of yellow and purple, yellow +1 means buy, purple -1 means sell.
The second layer: PINEv4 Sextans Backtest Framework". The output of this script is a bit complicated. After all, it is the entire trading system with a lot of information:
1. Blue and red arrows. The blue upward arrow indicates long position, the red downward arrow indicates short position, and the horizontal bar at the end of the purple arrow indicates take profit or stop loss exit.
2. Red and green lines. This is the holding cost line of the strategy, green represents the cost of holding a long position, and red represents the cost of holding a short position. The cost line is a continuous solid line and the price action is relatively close.
3. Green and yellow long take profit and stop loss area and green and yellow long take profit and stop loss fork. Once a long position is held, there is a conditional order for take profit and stop loss. The green horizontal line is the long take profit ratio line, and the yellow is the long stop loss ratio line; the green cross indicates the long take profit price, and the yellow cross indicates the long position. Stop loss price. It's worth noting that the prongs and wires don't necessarily go together. Because of the optimization of the algorithm, for a strong market, the take profit will occur after breaking the take profit line, and the profit will not be taken until the price falls.
4. The purple and red short take profit and stop loss area and the purple red short stop loss fork. Once a short position is held, there will be a take profit and stop loss conditional order, the red is the short take profit ratio line, and the purple is the short stop loss ratio line; the red cross indicates the short take profit price, and the purple cross indicates the short stop loss price.
5. In addition to the above signs, there are also text and numbers indicating the profit and loss values of long and short positions. "L" means long; "S" means short; "XL" means close long; "XS" means close short.
TradingView Strategy Tester Panel:
The overview graph is an intuitive graph that plots the blue (gain) and red (loss) curves of all backtest periods together, and notes: the absolute value and percentage of net profit, the number of all closed positions, the winning percentage, the profit factor, The maximum trading loss, the absolute value and ratio of the average trading profit and loss, and the average number of K-lines held in all trades.
Another is the performance summary. This is to display all long and short statistical indicators of backtesting in the form of a list, such as: net profit, gross profit, Sharpe ratio, maximum position, commission, times of profit and loss, etc.
Finally, the transaction list is a table indexed by the transaction serial number, showing the signal direction, date and time, price, profit and loss, accumulated profit and loss, maximum transaction profit, transaction loss and other values.
Remarks
Finally, I will explain that this is just the beginning of this model. I will continue to optimize the trading system of the second layer. Various optimization feedback and suggestions are welcome. For valuable feedback, I am willing to provide some L4/L5 technical indicators as rewards for free subscription rights.
Subscription
To encourage more people use this framework and avoid some abuse this one, I would like to set
100 Tradingview Coins per Monthly Subscription.
100X10 Tradingview Coins per Yearly Subscription.
Cari dalam skrip untuk "algo"

Portfolio Performance - Effects of RebalancingFunction:
- Can be used to evaluate the performance of a portfolio containing 2 assets over a set time interval
- Shows the % return of the portfolio over the time interval defined by the user
- Includes a threshold rebalancing algorithm to show the effects that rebalancing has on the portfolio over the long term
- Created to evaluate of the performance of portfolios containing different weightings of stocks and bonds over time assuming that the user would rebalance the portfolio when asset weights crossed a threshold
Instructions:
- To be used with dividends adjustments turned on
- Add this script to a symbol. e.g. AMEX:SPY
- Click the chart to define the entry time and the exit time. i.e. the time interval
- Define the initial investment of the portfolio. Default setting is $100,000
- Define the second asset to be included in the portfolio. e.g. BATS:AGG
- The strategy comes pre-populated with a portfolio that has a weight of 80% asset 1 and 20% asset 2. i.e. 80% AMEX:SPY and 20% BATS:AGG if the symbols mentioned above were chosen
- The 7 lines show the weighted % return of each portfolio over the time period defined by the user
- Each line (except the blue) is the return based on a different rebalancing threshold. The default settings are 1%, 2.5%, 5%, 10%, 15%, 20%, 30%
- The blue line is the % return of a portfolio that was made up of 100% asset 1 over the time interval. i.e. 100% AMEX:SPY
- Asset weights and rebalancing thresholds are adjustable via the settings
- Each plot can be turned on and turned off via a tick box in the settings

Joint Conditions Strategy Suite + TradingConnector alerts bot"Please give us combined alerts with the possibility of having several conditions in place to trigger the alert." - was the top voted request from users under one of the recent blogposts by TradingView.
Ask and you shall receive ;)
TradingView is a great platform, with unmatched set of functionalities, yet this particular combo of features indeed seems not to be in place. Fortunately, TradingView is also very open platform, thanks to PineScript coding language, which enables developing combos like the requried one and plenty of other magic.
I have already published numerous "educational" scripts, showing how to code indicators and alerts with PineScript, but... this is not one of them. This one is for real. READY FOR USE on real markets, also by the non-coding traders. Just take my script, set parameters with dropdowns, backtest the strategy, fire the alerts and execute them.
HOW TO USE IT
In "Settings" popup I tried to mimic the CreateAlert popup dropdowns for selecting logic. Let's say you want to enter Long position at Stochastic KxD crossover. In first line of Long Entry conditions set "StochK" + "Crossing Up" + "StochD". Last field doesn't matter because in 3rd dropdown something else than "value" was selected. In second line you could set "maB" + "Greater Than" + "maC" to filter out those entries which are in direction of the uptrend. And yeah, add ADX>25 to make sure the market is actually moving: "ADX" + "Greater Than" + "value" + "25". All condition lines must be TRUE (or skipped) for the entry to be triggered. Toghether with an alert.
The same for Short entries. Combinations are limitless.
INDICATORS AND MTF (MULTI-TIMEFRAME)
In those dropdowns you can select candle values like open/close/high/low/ohlc4, but also some most popular indicators, which I have pre-built into this script: RSI, various Moving Averages, ADX-DMI, Stochastic and Bollinger Bands for start. You can configure parameters of those indicators also in "Settings" popup, in "Indicator Definitions" section. What's important, you can use any of these indicators from higher timeframe, setting MTF multiplier. So if you applied this indicator to 1h chart, but want to use rsi(close,14) from 4h chart, set MTF to 4. If you want to use current timeframe indicators, keep MTF at 1, which is a default setting here.
Note for coders: to keep focus of this script on joining conditions, entire logic for those indicators has been moved to external library, also open source. I encourage you to dig into the code and see how it's done. I love the addition of libraries concept in PineScript.
CUSTOM INDICATOR
Following the "openness" spirit of my master - which is TradingView itself - my work is also open, in 2 ways:
1. This script is open source. So you can grab it, modify or add any functionalities you want. I cannot and don't want to stop you from doing that. I'm asking for only one favor - please mention this source script in your credits.
2. You can import the plot (series) from any other indicator on TradingView. In Settings popup of my script, scroll down to "Indicator Definitions" section, and select the series of your choice in the first dropdown. Now it is ready to use in conditions dropdowns on top of the Settings popup.
Let me give you an example of that last scenario. Take another script of mine, "Pivot Points on SR lines DEMO". You can find it in "Indicators & Strategies" library or here: (). Attach it to your chart. Now come back to THIS script, open Settings popup and in "Custom Indicator aka Imported Source" select "Pivot Points on SR lines: ...". The way it works - it detects if a pivot point happened on Support/Resistance line from the past and returns 1 for PivotLow and -1 for Pivot High. Now in first Long Entry condition set: "custom indicator" + "Greater Than" + "value" + "0" and long entries will be marked on every pivot low noticed on Support/Resistance line.
ALERTS
Last but not least - the alerts. This script produces alerts on the entries calculated by strategy logic, as marked on the chart by the backtester. Moreover, syntax of those alerts is already prepared and fully compatible with TradingConnector - alerts executing tool (bot), if you want to auto-execute those trades. Apart from installing the tool, you need to set
up the alerts in TradingView, here is how:
open CreateAlert popup
in first dropdown select "Joint Conditions Strategy Template"
in second dropdown select "alert() function calls only"
And that's all. You only need to set one alert for the whole script, not one for Longs and one for Shorts as it was in the past. Also, you don't need to setup closing alerts, because stop-loss/take-profit/trailing-stop information is embedded in the entry alert so your broker receives it as early as possible. Alerts sent will look like this: "long sl=40 tp=80", which is exactly what TradingConnector expects.
Phew, that's all folks. If you think I should add something to this template (maybe other indicators?) please let me know in comments or via DM. Happy trading!
P.S. Pyramiding is not supported in this script.
Disclaimer : I'm not saying above combination of conditions will make you money. Actually none of this can be considered financial advice. It is only a software tool. Use it wisely, be aware of the risk and do your own research!

B.Bands | Augmented | Intra-range | Long-OnlyHere you have the essential trading engine based on Bollinger Bands .
The idea behind is to trade the intra-range of the bands.
How is going to work?
Define which Bollinger Bands we want to use. Classic Bollinger Bands or Augmented Bollinger Bands . Without selecting, the algorithm doesn't show a strategy.
Define the length of the Moving Average and the Standard Deviation by default the classic 20-2.
Define the Bollinger Bands Spread Max Range (Upper-Lower) to be able to determine wheter or not you're in a price range or potential breakout.
Define data source to trigger exit and entry points.
Define profit based on Middle Band or Opposite Band.
Define Stop Loss % and activate Trailing Stop if desired with the percentage required.
Determine if you want to sell only on profit after triggering the entry signal. * Note Stop Loss remains activated.
Choose a date range if you want to study a specific period.
Bear in mind, this is the essential trading engine, open for you to test, try and improve under your requirements. You can determinate when is the ideal market to implement it based on many other indicators. Maybe you wish to change the stop loss settings for ATR, previous low, etc. Totally up to you.
Note the script comes with initial capital, fee % and slippage by deault. This may change for your assets. Make sure you define it in advance.
NOTE: If you trade assets such BTC, you must update the initial capital. By default 5000 (USD) The script doesn't support fraction trading such 0.01BTC.
Will be updated on next version.
Feel free to get in touch if you've got any question.

Premium ScalperThe strategy works with a combination of a number of different factors, including:
- Volume
- Moving averages
- Volatility
- RSI
This strategy generates long and short signals based on volume movements, moving averages and RSI. By combining other algorithms, low volatility periods can be filtered out.
The best results can be achieved by pairing the indicator with a bot through 3Commas and using a diversification strategy. This way you spread your risk over different pairs and you therefore also have a great chance of taking big moves.
The strategy results we display are results WITHOUT leverage. It is therefore also possible to only long on spot with this strategy, but for optimal results a trading bot link is required.
The settings we have used for these results are an order size of 100% with a 0.08% commission size.
Side note: This indicator does NOT use repainting!
We offer the possibility to try the indicator for free for 7 days.

QaSH DCA DaytraderThis script takes advantage of the power of DCA implemented in the QaSH DCA Algorithm script, and it applies it to new entry conditions. A "Quickfingers Luc" mode has been added, which creates new entry orders whenever a level of support has been identified. If price breaks the support level and quickly drops down, the orders will already be in place to catch the dip. This method can even catch the 1-second long, 50% flash dips that occur in some exchanges.
Four entry conditions are included in this initial release : ASAP, Quickfingers Luc, Bullish Pivot point, and Bearish Pivot point
All order placements are customizable
All take profit % values are based on the average entry price
Take profit % values can change based on how big the price dip was
Entry condition filter has been added and it uses a variable timeframe EMA
Stoploss function is available
Order size can be sent in the alerts, which allows for multiple setups to be running simultaneously in one account
All alerts are sent using the new "Any alert() function call" feature, which means this indicator will only take up one alert slot to cover all entry and exit alerts
Settings advice:
- If you think price is inflated, try conservative settings that either use a stoploss and EMA filter, or no stoploss but have some of your orders placed far below the current price with increasing volume. In a bear market this will beat the buy and hold.
- If you think the market is ready for a new bull run, then try experimenting with very aggressive settings to beat the buy and hold. For example: ASAP mode with 3 layers turned on. Orders placed at 0.5%, 3%, and 5%. Volumes at 30%, 30%, and 40% respectively. No stoploss. These settings were tested on ETH and beat the buy and hold during an extreme bull market period.

RSI & SMA Strategy By DenizIntroduction
It has always been a major challenge to detect the current market price in technical analysis . There are some basic but strong indicators that help us to estimate the next market action. Relative Strength Index and Simple Moving Average indicators were used in this strategy.
This strategy aims to detect the next market action with different calculations & usages of RSI and SMA indicators.
Strategy Features
As per the result of the calculation from RSI and SMA outputs the strategy will decide to go "Long" or "Short" if the directions are changed from long to short the trade will be closed and it's opening new trade as per to the new direction.
Apart from basic "take profit" and "stop" options there is an additional closing trade option named "Long/Short Bar Count". If the trade could not reach the target in a certain period, it will look for a quit with a 0 loss.
Advantages
Informative alarm messages.
High ratio of Profitable trade numbers.
Disadvantages
Less trade count.

Bollinger band & Volume based strategy V2this script is upgraded version of previous one the major change is deleted script which find a highest price after entry the last of strategy is same.
If current volume is above daily average volume, and three bollinger band`s Standard Deviation, 1 and 1.5 and 2 if the current lowest price is bigger then 1 stdev and current closed is bigger then 1.5 stdev and the last,highest price is above 2.0 stdev, it defined current market is bullish and had momentum.
and the Short will entered when ma60 and ma120 is undercrossed it work as prevent current price is way lower then entry price.
**this script is working in 15min Only in BTC market or USDT**
** basic equity setting is 500$, set your own**
**if you will use this in real-trade,plz comment the result to me**
Ps: i wanna know why my script is only working well in 15 min tick, anyone who has similar phenomenon or if you had a answer about it, please comment me.

Dagger V1 strategyThe "Dagger V1 strategy" strategy is used for the backtest of the "Dagger V1 indicator & alerter" indicator. Their algorithm is identical. Further, all descriptions of the settings are the same for the strategy and the indicator.
Dagger is used for trading on the cryptocurrency spot market, but it can also be used for any other fairly volatile pairs.
Dagger shows the best results on the H1 timeframe, but you can experiment with other timeframes.
The logic of Dagger's work is based on the search for the optimal entry point into the market and the best moment to close a deal. Stochastic oscillator and exponential moving EMA are used for this. Also, the exit from the transaction can be optimized using several parameters.
The strategy can use trailing up to one or more red bars in order not to miss the sharp growth of the currency.

Linear SSL ShortThis script consist of two parts: linear SSL and DEMA. The difference between original SSL and current is that it calculated by linear regression. The logic is simple: when SSL "crossunder" and DEMA is above the price - we get short signal. When price became above DEMA and SSL "crossover" - close short.

Channel Strategy 0921Channel Strategy.
English:
Conditions for buying: in the channel strategy, when the price of an asset touches the lower MA of the channel line, you need to buy in Long, then you need to wait for the price to turn in the direction we need to the upper MA of the channel line. When the price crosses the upper MA line, it is necessary to close all positions on the deal.
The strategy provides safety orders to average our price in order to get more profit at the exit from the trade.
This strategy also provides parameters such as:
1. MA Length
2. Source: different calculations of candlestick closing for the channel
3. Mult: indent of channel line
4. Coeff: channel width shift
5. Order Size: order selection: fixed order /% of the deposit amount
6. Base Order: the amount of the base order
7. Safety Order: amount of the safety order
8. Max Safety Orders: maximum number of safety orders
9. Price Deviation: price deviation for placing a safety order (% of the value of the initial order)
10. Safety Order: multiplier step of safety orders
In the strategy settings, we use 0.06% commission for the futures market.
Conditions for entering a trade and exiting trades:
Entry into a trade is always on a limit order with a commission of 0.02%
Deals are always closed on the market with a commission of 0.04%
This strategy is suitable for any pair of crypto assets with individual settings for a specific pair.
In this strategy, the settings are adapted for the MATICUSDTPERP TF 15M pair on the Binance exchange.
The strategy also works for Algo Trading via API keys via personal webhook signals.
Russian:
Условия для покупки: в канальной стратегии когда цена актива касается нижней MA линии канала нужно покупать в Long, далее необходимо ждать когда цена развернется в нужную нам сторону к верхней MA линии канала. Когда цена пересекает верхнюю MA линию необходимо закрыть все позиции по сделке.
В стратегии предусмотрены страховочные ордера для усреднения нашей цены, чтобы получить больше прибыль на выходе из сделки.
В данной стратегии также предусмотрены параметры такие как:
1. Длина MA
2. Source: разные подсчёты закрытия свечей для канала
3. Mult: отступ линии канала
4. Coeff: сдвиг ширины канала
5. Order Size: выбор ордера: фиксированный ордер / % от суммы депозита
6. Base Order: сумма базового ордера
7. Safety Order: сумма страховочного ордера
8. Max Safety Orders: максимальное количество страховочных ордеров
9. Price Deviation: отклонение цены для выставления страховочного ордера (% от стоимости начального ордера)
10. Safety Order: множитель шага страховочных ордеров
В настройках стратегии комиссию мы используем 0.06% для фьючерского рынка.
Условия входа в сделку и выхода из сделок:
Вход в сделку всегда по лимит ордер с комиссией 0.02%
Закрытие сделок происходит всегда по маркету с комиссией 0.04%
Данная стратегия подходит под любую пару крипто актива с индивидуальными настройками под определенную пару.
В данной стратегии настройки адаптированы под пару MATICUSDTPERP ТФ 15М биржа Binance.
Стратегия так же работает под Algo Trading через API ключи через персональные сигналы webhook.

SQZ Multiframe StrategyThis is a first attempt to automate what my current strategy when trading is.
It uses 2 timeframes: the one you are currently using to see the chart and an "anchor trend" which is a higher order frame.
Supported timeframes are: 1m, 5m, 15m, 30m, 1H, 4H, 1D, 1W
The Strategy relies on two indicators:
Squeeze Momentum Indicator
CMF
How does it works?
It looks for a moment when the following conditions are met.
For Long:
Positive directionality in SQZM monitor in anchor timeframe
Positive directionality in SQZM monitor in current timeframe
Recent minimum in CMF
For Short:
Negative directionality in SQZM monitor in anchor timeframe
Negative directionality in SQZM monitor in current timeframe
Recent maximum in CMF
After a BUY or SELL order is executed the plot will start showing two lines: A TP line, and a SL line.
The TP and SL move dynamically based on a greedy algorithm based on 3 input parameters.
Min Profit to Start Moving SL (%): Sets an initial target for the trade.
Maximum Possible of SL (%): This is the maximum amount possible for SL. If volatility is not too high, a shorter SL will be chosen based on Kaufman's Stops method
Take profit factor: Is how much portion of the target I am taking as profit once the target is reached
Example for 5% Min profit:
When the first target is reached (+5%), the SL will be updated to 2.5% over the enter price.
When the second target is reached (+10%), the SL will be updated to 5% over the enter price.
Note: The strategy might abandon the position prematurely if a contrary signal is received while the trade is opened, and will change direction.
The Strategy has been backtested mostly for crypto. It might be good for stocks too, but the parameters mentioned might need some adjustments since price moves at a different rate.
Recommended timeframe is 4H for BTC , and 30min/1H for alts.
Comments and ideas are more than welcome!

Ultimate Triple Supertrend Strategy [PrismBot] [Lite]Initial Release on Prism Core 1.7.r493
Included in this Ultimate Supertrend Lite Strategy:
✔️ Tweak a multitude of specific settings (MA lengths, R:R, SL distance etc)
✔️ Enable advanced setup filters
✔️ Use money management and risk calculations
✔️ Draw trade info directly to chart (eg. SL size in percent, win rate etc)
✔️ Use various filters (eg. time filter, date filter, MA slope angle etc)
✔️ Manage risk per position when auto-trading forex through AutoView
✔️ Choose from various alert conditions!
✔️ Sync to any bot or algorithmic trading system
Some details about this strategy:
This strategy is a triple Supertrend strategy that includes multi-timeframe analysis built-in to the supertrend function. You also have a multitude of strategies to choose from, such as the newest addition to Prism Core - Stochastic. Our stochastic strategies includes Standard / Strict Standard which buys when overbought and sells when oversold, and a couple of %K cross strategies as well.
There are also many other filters such as RSI, ADX, and more, as well as built-in DCA (dollar cost averaging), position sizing, take profit and stoplosses, and so much more.

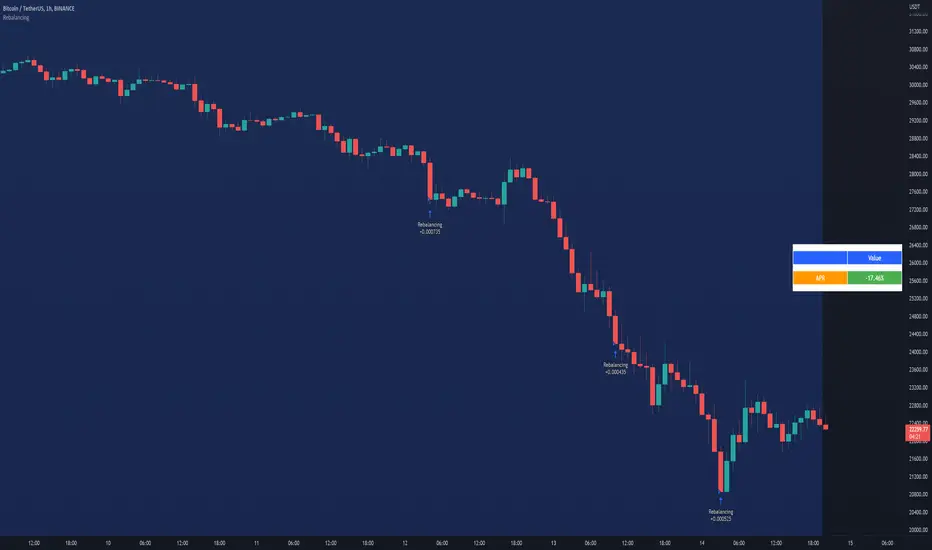
RebalancingThis script gives you an approximation of the APR you can get when using the technique of Rebalancing.
Further discription are embeded in the script.
HOW TO USE:
- Start date: Choose start date
- Settings: Change settings to your own needs
- Base currency: Select Base currency
- Portfolio: Select the coins (MAX 9 pcs.) you want to use in your portfolio for the rebalancing algoritm
- Click "Data Window" to see the APR (appr.)
Markets:
It can be used to all markets.
NOTE:
Some Exchanges don't go very far back in the past and for this reason this may have impact on this Indicator.
Make sure the coins you selected are available at the Exchange you select in the settings section. If you dont do this, the script generates an error.
COIN FX PRO TRADERCoin Fx Pro strategy makes the cryptocurrency markets buy and sell automatically. 5 stoploss, fixed profit take and stoploss level can be customized from strategy settings. There are 4 separate strategies that you can set in the strategy. First of them, there are strategies that decide long and short positions in accordance with your settings at the pivot levels, second of the super trend, third of the potential return levels, third of the up and down breaks. Pyramiding can offer multiple entry points. Strategy back tests can be adjusted to the desired time period and can be used as spot or term if desired. Frostybot is set to work fully compatible with js when the necessary inputs are made from these strategy settings. When installing an alarm for FROSTYBOT JS, the alarm message field is {{strategy.order.alert_message}}.
For best back test performance results. Use it
BTCUSDTP and 5 MIN TIME FRAME!!!

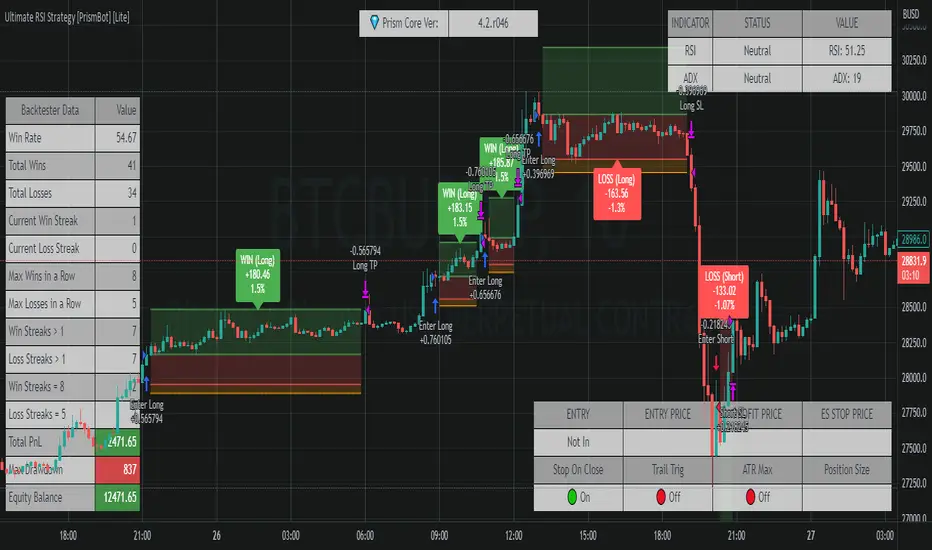
Ultimate RSI Strategy [PrismBot] [Lite]Included in this Ultimate MACD Lite Strategy:
✔️ Tweak a multitude of specific settings (MA lengths, R:R, SL distance etc)
✔️ Enable advanced setup filters
✔️ Use money management and risk calculations
✔️ Draw trade info directly to chart (eg. SL size in percent, win rate etc)
✔️ Use various filters (eg. time filter, date filter, MA slope angle etc)
✔️ Manage risk per position when auto-trading forex through AutoView
✔️ Choose from various alert conditions!
✔️ Sync to any bot or algorithmic trading system
Some details about this strategy:
There are several strategies that people use for the RSI , and one of my favorites is very different than one you have probably heard from every online RSI strategy source.
In order to compliment the RSI , there is also a built-in ADX / DMI strategy (per our All-In-One strategy on my profile as well) and you will also find a Global Trend filter (200 EMA by default).
You can also use a pullback confirmation prior to a trade entering. I.E., you have the RSI signal, wait for a pullback to the pullback EMA , and then the strategy will enter a trade.
You can easily enable and disable strategies using the checkbox.
This strategy incorporates a risk to reward system where the user can select between ATR and Percent based stop losses and take profit targets. This means that the user has much better control over money management when utilizing this strategy and it doesn't require you to babysit the strategy to ensure it's entering and existing strategies in an ideal place.
Ultimate MACD Strategy [PrismBot] [Lite]Included in this Ultimate MACD Lite Strategy:
✔️ Tweak a multitude of specific settings (MA lengths, R:R, SL distance etc)
✔️ Enable advanced setup filters
✔️ Use money management and risk calculations
✔️ Draw trade info directly to chart (eg. SL size in percent, win rate etc)
✔️ Use various filters (eg. time filter, date filter, MA slope angle etc)
✔️ Manage risk per position when auto-trading forex through AutoView
✔️ Choose from various alert conditions!
✔️ Sync to any bot or algorithmic trading system
Some details about this strategy:
LONG SIGNAL
When the MACD is below the zero line of the histogram, close is above the 200EMA, and the MACD line crosses above the signal line, longs are taken
SHORT SIGNAL
When the MACD is above the zero line of the histogram, close is below the 200EMA, and the MACD line crosses below the signal line, shorts are taken
A couple of options are given for how to calculator stop losses.
The Take profit is calculated by the risk of the stop loss. So a 1.5 take profit target is 1.5 times the stop loss added to the entry price.
There is also an option to filter out trades by the histogram deviation. This prevents crossovers that are too close to the histogram from being taken.
Please note I used the code for the PPO instead of the traditional MACD to make calculating these percentage deviations more consistent across multiple asset types.
You can easily enable and disable strategies using the checkbox.
This strategy incorporates a risk to reward system where the user can select between ATR and Percent based stop losses and take profit targets. This means that the user has much better control over money management when utilizing this strategy and it doesn't require you to babysit the strategy to ensure it's entering and existing strategies in an ideal place.
You can also enter custom messages for alerts for use with bots (set alerts to "alert() function calls only")

Keltner Worm Strategy [PrismBot] [Lite]Included in this Keltner Worm Lite Strategy:
✔️ Tweak a multitude of specific settings (MA lengths, R:R, SL distance etc)
✔️ Enable advanced setup filters
✔️ Use money management and risk calculations
✔️ Draw trade info directly to chart (eg. SL size in percent, win rate etc)
✔️ Use various filters (eg. time filter, date filter, MA slope angle etc)
✔️ Manage risk per position when auto-trading forex through AutoView
✔️ Choose from various alert conditions!
✔️ Sync to any bot or algorithmic trading system
Some details about this strategy:
- it incorporates 2 strategies - Keltner Re-entry and Baseline MA Crossing
- it uses a take profit and stop loss level fixed
- there are up to 6 allowable "worms"
- the worm multipliers are exponential, so a value of 2 will mean that the 6th worm is multiplied by 6
- you can multiply the offset or the Keltner Channel default values
- You can enable alerts for order entry, take profit, and stop loss values
- You can easily enable and disable strategies using the checkbox.
- This strategy incorporates a risk to reward system where the user can select between ATR and Percent based stop losses and take profit targets. This means that the user has much better control over money management when utilizing this strategy and it doesn't require you to babysit the strategy to ensure it's entering and existing strategies in an ideal place.

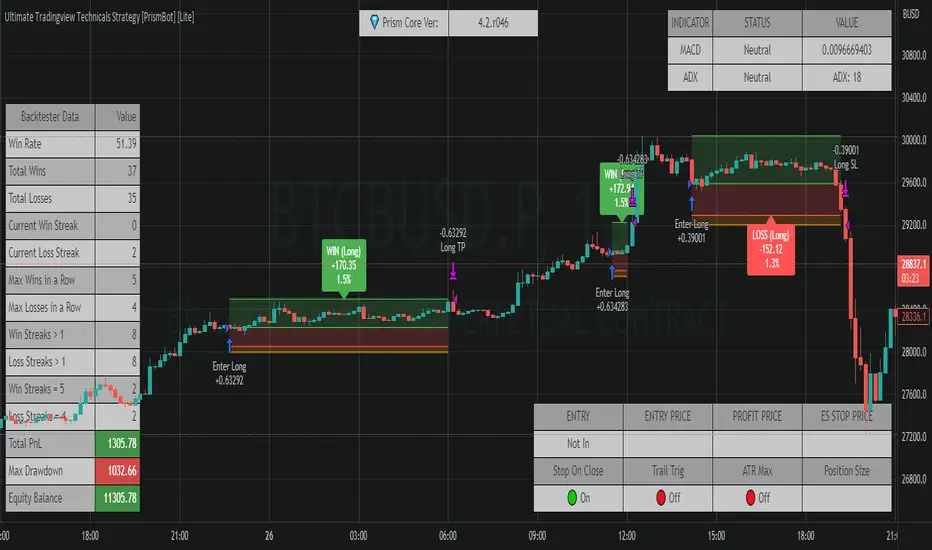
Ultimate Tradingview Technicals Strategy [PrismBot] [Lite]Included in this builder:
MACD
RSI
Tradingview Technical Analysis
Ichimoku
Global Trend Filter
Pullback Filter
Our most robust strategy to date with MACD , RSI , and many other basic strategies included as well as additional filters and alert options.
It is an advanced trading strategy built with the intent to make it easy for anyone to begin trading, but also avoid too much complication of strategy concepts.
For instance, you can change the MACD settings to be "more sensitive" by using a simple dropdown menu, and adjust which strategy you are employing with the MACD on the fly with another.
You can easily enable and disable strategies using the checkbox.
The strategy demo results use 100% equity per trade as an example - the reason for this is that the stop loss is set to 1%, so each trade is risking 1% (give or take slippage). Slippage is set to 5 ticks, and a 0.04% commission (Binance average for market and limit orders)
This strategy incorporates a risk to reward system where the user can select between ATR and Percent based stop losses and take profit targets. This means that the user has much better control over money management when utilizing this strategy and it doesn't require you to babysit the strategy to ensure it's entering and existing strategies in an ideal place.
The status box shows the current state of the various strategies and their values. A red circle indicates the filter / strategy is not valid for entry yet. A green circle indicates that filter / strategy is valid for entry. When all selected strategies are valid simultaneously, the next bar will trigger an entry signal.
If you have any questions about this strategy, please leave them in the comments below, or DM for more details. Thanks!
Additional features in this lite strategy:
✔️ Tweak a multitude of specific settings (MA lengths, R:R, SL distance etc)
✔️ Use money management and risk calculations
✔️ Draw trade info directly to chart (eg. SL size in percent, win rate etc)
✔️ Use various filters (eg. time filter, date filter etc)
✔️ Manage risk per position
✔️ Sync to any bot or algorithmic trading system
SMA-Extendido-Estrategia por NeilDescription:
Strategy that identifies entry and exit operations, using 3 moving averages and 5 strategies. New strategies are implemented such as the prediction of closing operations, independent of the events that justify entry operations.
How does it work:
1) Long strategy: if SMA5 crosses up to SMA200 and SMA200 is bullish, a buy operation begins, if SMA5 crosses down to SMA200 and SMA200 is bearish, a sale begins.
2) Short strategy with smooth filtering of operations: if SMA5 crosses up to SMA20 and SMA20 is bullish and (SMA5 are above SMA200) a buy operation is initiated. If SMA5 crosses down to SMA20 and SMA20 is bearish and (SMA5 are below SMA200) a sell trade is initiated
3) Short strategy with strong filtering of operations: if SMA5 crosses up to SMA20 and SMA20 is bullish and (SMA5 and SMA20 are above SMA200 and SMA200 is bullish) a buy is initiated, in other words, buy operations occur only if SMA5 and SMA20 are above SMA200; if SMA5 crosses down to SMA20 and SMA20 is bearish and (SMA5 and SMA20 are below SMA200 and SMA200 is bearish) a sell is initiated, that is, sell operations occur only if SMA5 and SMA20 are below SMA200
4) Short strategy without filtering operations: if SMA5 crosses up to SMA20 and SMA20 is bullish, a buy is initiated (the location of MA200 does not matter). If SMA5 crosses down to SMA20 and SMA20 is bearish, a sell is initiated (it does not matter where the MA200 is located)
5) Prediction of closing operations: the algorithm evaluates potential closing operations differently and considers the following rules: If there is an active buy trade and SMA5 crosses down to SMA20, we close the current buy (the location of the SMA200 does not matter). If there is an active sell trade and SMA5 crosses up to SMA20, we close the sale in progress (the location of the SMA200 does not matter)
How to use it:
Press the "Indicators" option, go to the "Public Librarian" segment, write the name "SMA-Extendido-Estrategia por Neil", double-click on the record in question and you will have it added in your work panel, now, just It remains to be used to identify the inputs and outputs and you can do it visually or by defining the automatic notification alerts.

Hull Crossover Strategy no TP or SLWhat is it?
A simple yet effective strategy ran on the 30m chart.
This is a basic idea that can be expanded on using different indicator to either add signals or filter out certain bad signals!
The strategy consists of 1 fast moving average and 1 slow moving average.
Both of these moving averages are the Hull Moving Average
What is the Hull Moving Average?
The Hull Moving Average ( HMA ) is a directional trend indicator.
It captures the current market conditions and uses recent price action to determine if conditions are bullish or bearish relative to historical data.
The Hull is different from traditional trend indicators like the EMA and the SMA .
It is designed to reduce the lag often associated with other MAs by providing a faster signal on a smoother visual plane.
How it works?
When the fast HMA crosses over the slow HMA , we initiate a long signal, and
when the fast HMA crosses under the slow HMA , we initiate a short signal.
Conclusion
The power of simplicity is what makes this such a great core to use to build onto making something even better!
The results were optimised to suit the most common market conditions seen today.
******** Not financial advice! ********

[Joy] Aladdin Long Trading Strategy 1.0.0 AlphaAladdin's Long trading strategy is to test out Aladdin for long trades only
This strategy is mainly used to test whether Aladdin is suitable for a coin/stocks/futures or for any trading. The profitability, average drawdown, average profits, etc are used by me to decide whether to use it for trading.
What is Aladdin and what does it do?
Using the volume and gradual flow of non-interrupted data (wicks and body of the candles), it tries to detect the macro condition of the market so that one may know in which direction the market is flowing.
* Bearish / Sell sign: On the candle's close, I open a short position
* Bullish sign: On the candle's close, I open a long position
* I take at least 50% profit when the indicator indicates to do so. One can configure that value as desired from the configuration depending on one's risk/money management. I might even convert some portion of the position into stable coins.
FAQ
Q: Does it use some EMA /MA/etc.? Does it use any indicator with tweaked settings?
Answer: No.
Q: What does it mostly depend on?
Answer: Volume and gradual flow of non-interrupted data. The logic depends purely on volume , price bars and the wicks.
Q: Does it work with all coins, stocks, futures, instruments?
Answer: I prefer to use the exchange with the best possible data. Then backtest out to find the best possible timeframe, stop loss and target all derived from this script data.
Q: Can you make it free or make it open source?
Answer: There is no free lunch in this world. I will never reveal or share the source code!
Q: Do you provide ongoing support for the indicator?
Answer: Yes, as long as I can, I will continue updating the indicator
Q: Are the bullish /buy & the bearish/sell markers automatic?
Answer: I have no control over the markers. It is driven purely by logic from the script.
Q: Is this financial advice?
Answer: This is not financial advice. I do not guarantee any profit or loss. I am not responsible for any of your losses or profits. My indicators do not assure profit or loss. It also does not auto-open or auto-close a trade.
Assumptions:
Only long trades are opened and closed. No short trades.
Starting Capital: $20,000
Order Size: 20% of Capital
Data used: Whatever data is available from 2011 till today on Trading view
Findings:
INDEX: BTCUSD 83% profitability using 2day tf
54 closed trades
Profit factor: 16
Sortino Ratio: 5.2
Average Winning Trade: 30%
Average Losing Trade: 9.12%
Largest Winning Trade: 1218%
Largest Losing Trade: 20.25%
Below are the profitability rate for the timeframe and the coins listed as found by running the trading strategy over the following as of today (Aug 1st 2021 12:40 pm Sydney Time).
⚜️ INDEX:BTCUSD 83% using 2day tf
⚜️INDEX:ETHUSD 80% using 1day tf
⚜️FTTUSD 81% using 2day tf
⚜️SRMUSD 71% using 1day tf
⚜️ADAUSDT 81% using 2day tf
⚜️ALGOUSD > 90% using 2day tf
⚜️ALTPERP 81% using 2day tf
⚜️AVAXUSDT 75% using 1day tf
⚜️BANDUSD > 90% using 2day tf
⚜️BCHUSD 82% using 2day tf
⚜️BNBUSD 79% using 1day tf
⚜️BNBUSD 85% using 2day tf
⚜️CHZUSD 71% using 1day tf
⚜️COMPUSD 81% using 1day tf
⚜️DOGEUSD 77% using 1day tf
⚜️EXCHPERP 83% using 1day tf
⚜️FILUSD > 90% using 1day tf
⚜️FTMUSD 70% using 2day tf
⚜️HTUSDT 75% using 2day tf
⚜️KINUSD >90% using 2day tf
⚜️LINKPERP 85% using 2day tf
⚜️LTCUSD 80% using 2day tf
⚜️MATICUSD 77% using 2day tf
⚜️NEOUSD 80% using 1day tf
⚜️NEXOUSD > 90% using 1day tf
⚜️OKBUSD 71% using 1day tf
⚜️OMGUSD 75% using 1day tf
⚜️RSRUSD 87% using 1day tf
⚜️RUNEUSD > 90% using 1day tf
⚜️SHITPERP > 90% using 1day tf
⚜️SOLUSD 84% using 1day tf
⚜️SUSHIUSD 71% using 1day tf
⚜️THETAUSD > 90% using 2day tf
⚜️UNIPERP 83% using 1day tf
⚜️VERTPERP > 90% using 1day tf
⚜️XAUUSD 63% using 2day tf
⚜️XTZUSD 83% using 2day tf
⚜️ZECUSD 72% using 2day tf
Disclaimer:
No one knows what will happen in the future. DYOR and decide on your own conditions. Do realize that neither I nor my indicator can guarantee any profit or loss. And there is no assurance that any trade will ever result in any profit. It is not financial advice.

HYSTERIAN BIST:SISE TRADE ALGORITHMThis strategy is using 5 minute charts and relative price movement in that period of time and determines optimum entry levels.
This strategy optimized ONLY FOR BIST:SISE stock futures because of its unique characteristics.
Strategy needs minimum 50000TRY account balance on Futures account and opens 100 lot SISE1! (Current contract in Front) Buy order when criterias met and TP or stop when criterias triggered. No pyramiding. One position at a time.
Commission used in strategy is 0.15 TRY per lot which i currently have in my real account.
Backtest results shows that strategy has an impressive %80 hit rate and above %40 percent profit in total of 81 positions. Max drawdown is below %6 percent.
You can use more position size if you have a bigger account. For example if you have 100000TRY balance in your trading account, you can set position size for 200 lot.
Brief summary in Turkish:
SISE hissesine özel tasarlanmış bir koddur. VIOP'ta kullanılır.
Hem yükselen hem düşen piyasada , sadece LONG yönlü işlem yapar. İşlemlerin yaklaşık %80 başarı oranı vardır. 1 yıllık backtest sonuçları yaklaşık %40 portföy büyümesine işaret etmektedir. Maksimum geri çekilme ise %6'nın altında olmuştur.
Her işlem 100 kontrat ile açılır, kapanana kadar yeni işlem açılmaz. 50 bin liralık bir VIOP hesabı ile kullanılması planlanmıştır.
Hesap büyüklüğüne bağlı olarak lot miktarı büyütülebilir. Yani viop hesabınız 100 bin TL ise, 200 lot ile işlem yapabilirsiniz.
5 dakikalık grafiklerde kullanılmalıdır, fiyatın o zaman dilimindeki relatif hareketlerine göre optimum giriş seviyesinde pozisyon açar. Stop ve TP seviyeleri koda gömülüdür ve optimize edilmiştir.
Lot başına 0.15 TRY komisyon tanımlanmıştır, gerçek hesabımdaki komisyon oranıdır.
