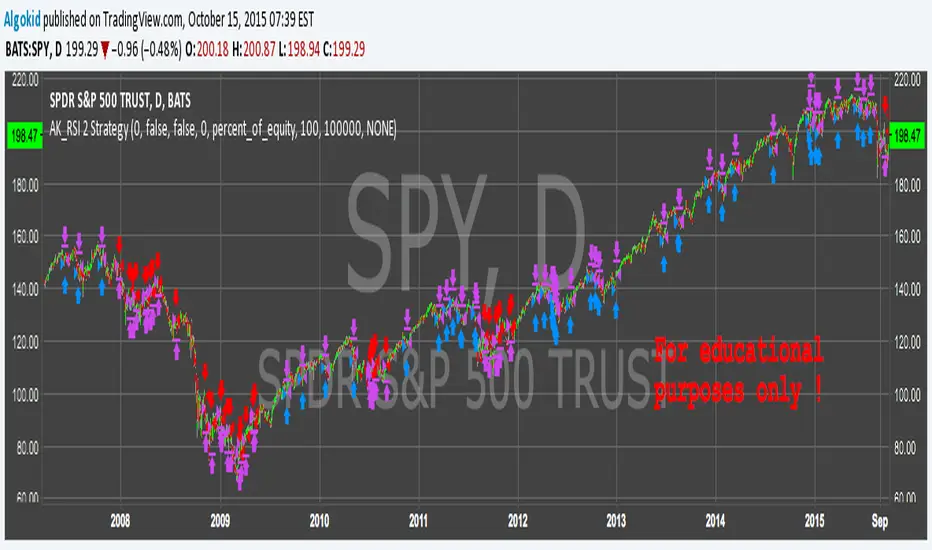
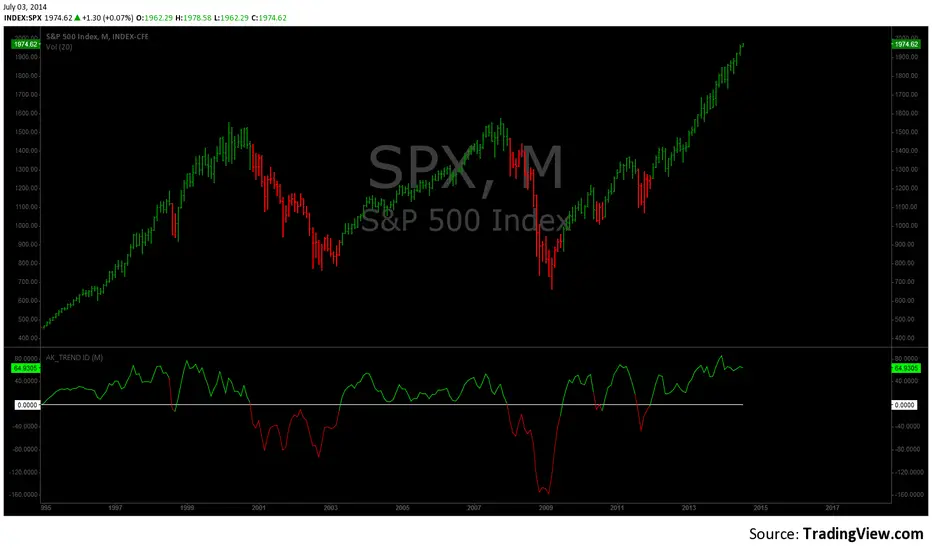
Simple RSI-MA Algo Beats DOW By Huge Margin Over Past 100 Years!This simple RSI-MA long/short algorithm beats the Dow by a FREAKING HUGE margin over the past century (excluding dividends and trading costs).
The algorithm uses a fast SMA of the RSI as a buy/cover signal and a slow SMA of the RSI as a sell/short signal.
Backtest period = 09/17/1916 - 11/02/2015
Dow = 98 --> 17,830 = +18,094% = 5.38% CAGR
Algorithm = net profit + open P/L = +43,349% = 6.31% CAGR
Notice how the algorithm dodged both the 30s' Great Depression and the 2008 Crisis. Pretty cool huh? :)
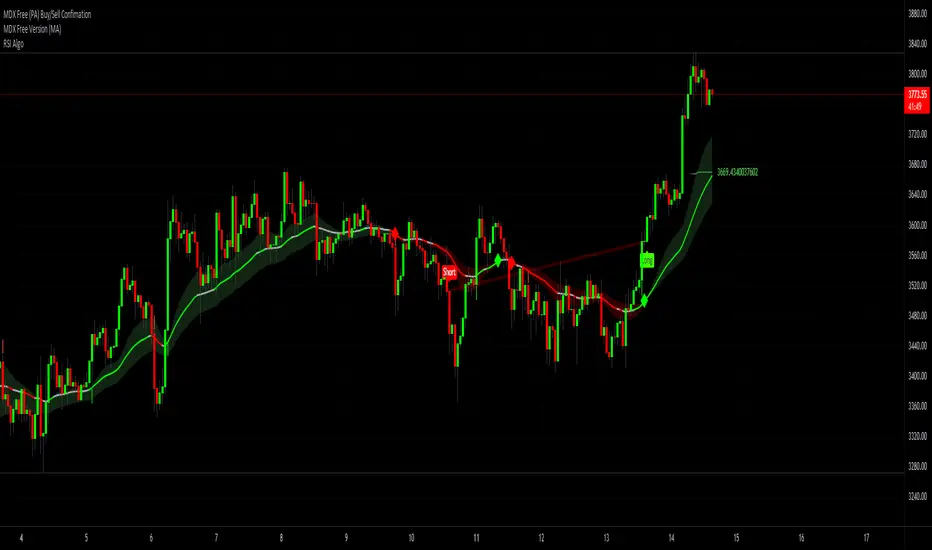
ALGORITHM'S FORMULA (use weekly chart):
Buy/Cover = MA10(RSI10) cross> 50
Sell/Short = MA50(RSI10) cross< 50
STRATEGY TESTER'S SETTINGS:
- Initial cash = $10,000
- Pyramiding disabled
- Re-investment enabled (order size = 100% of equity )
- Trade re-calculations disabled
DISCLAIMER: None of my ideas and posts are investment advice. Past performance is not an indication of future results. This strategy was constructed with the benefit of hindsight and its future performance cannot be guaranteed.
Strategi Pine Script®