Relativity BULLS FUTURES 10X 1D AlgorithmHi,
This system is prepared only for leveraged markets and for Futures and CFD markets.
Leveraged processing apply to cryptocurrency contracts that are also subject to.
System parameters:
Timeframe = 1D (1 Day)
Leverage = 10x
Position Size = %1 (0.01) Each Trade
System features :
- It targets the Risk /Reward Ratio of 1/3 and above. (Risk/Reward Ratio >= 3 )
- If a Take Profit Point has come in a successful trade but the parameter conformity has not deteriorated, system continues the trade.
- In this way, you can catch strong long trends several times a year.
But it is strict as stop-loss and avoids large declines,whipsaws whenever possible.
- The system tries to avoid unnecessary processes as much as possible.
This means less commission and less sideways market.
- Since it takes advantage of the reverse market, it is suitable not only for long and short but only for long position, ie "bulls".
But this neutralizes unnecessary processes. (Short market direction, the system for bears will be published separately.)
- Stop-Loss points and Snow-take points are shown in red and green.
-However, if there is a small amount of follow-up available at the computer, it is recommended to put stop-loss only.
Because the system revises both stop-loss and take profit points according to the conditions formed.
Doing this in the right major long trend here allows you to be in trades.
-The system takes into account the risk and only opens transactions where the value corresponding to 10 leverage ratios is greater than the risk.
This provides as much protection from risk as possible.
-Alerts added.
About Backtest :
Since this system uses leveraged market, backtest results are not healthy.
But since it targets the 1/3 Risk Reward Rate (3.00),
we must look Ratio Avg Win/Loss and it must be over 0.5 because :
This ratio means: When we reach 33% of our correct trades in all our trades, we are at breakeven.
This is 100 - 33 = 66
33/66 = 0.5
So whenever this rate is over 0.5, we make a profit.
*** The fact that this ratio is over 0.70-1.00 in terms of securing ourselves because there is a maturity in the future indicates that we are doing
successful snowball trades.(Because future contracts have loss of maturity and end dates)
And we achieve success cumulatively.
Important Note : This system is prepared only for these parameters.
These parameters are designed for Futures and CFDs.
It doesn't work in spot markets.
NOTE :
The system has been prepared as a strategy to present success in a transparent manner.
Please check "Ratio Avg. Win / Loss" rates in backtests.
Important Note 2 -
Although the system revises the stop and take profit points in the required parameters, the most accurate place is when the signal comes.
It should be entered when the signal comes as much as possible and if this did not happen,
trade must be opened in the nearest bars after the signal comes.
Best regards.
Cari dalam skrip untuk "algo"

MA strategyTrading strategy on moving averages. Based on Mean reversion. These algorithmic strategies are based on a concept that assumes a regular return of the price to a certain average level, provided that a sufficiently long time distance is considered. The main objective of such strategies is to determine the expected level of price return. Interconnected with Envelopes.

HatiKO EnvelopesPublished source code is subject to the terms of the GNU Affero General Public License v3.0
This script describes and provides backtesting functionality to internal strategy of algorithmic crypto trading software "HatiKO bot".
Suitable for backtesting any Cryptocurrency Pair on any Exchange/Platform, any Timeframe.
Core Mechanics of this strategy are based on theory of price always returning to Moving Average + Envelopes indicator (Moving_average_envelope from Wiki)
Developement of this script and trading software is inspired by:
"Essential Technical Analysis: Tools and Techniques to Spot Market Trends" by Leigh Stevens (published on 12th of April 2002)
"Moving Average Envelopes" by ChartSchool, StockCharts platform (published on 13th of April 2015 or earlier)
"Коля Колеснік" from Crypto Times channel ("Метод сетка", published on 19th of August 2018)
"3 ways to use Moving Average Envelopes" by Rich Fitton, published on Trader's Nest (published on 28st of November 2018 or earlier)
noro's "Robot WhiteBox ShiftMA" strategy v1 script, published on TradingView platform (published on 29th of August 2018)
"Moving Average Envelopes: A Popular Trading Tool" Investopedia article (published 25th of June 2019)
and KROOL1980's blogpost on Argolabs ("Гридерство или Сетка как источник прибыли на форекс", published on 27th of February 2015)
Core Features:
1) Up to 4 Envelopes in each direction (Long/Short)
2) Use any of 6 different basis MAs, optionally use different MAs for Opening and Closure
3) Use different Timeframes for MA calculation, without any repainting and lookahead bias.
4) Fixed order size, not Martingale strategy
5) Close open position earlier by using Deviation parameter
6) PineScript v4 code
Options description:
Lot - % from your initial balance to use for order size calculation
Timeframe Short - Timeframe to use for Short Opening MA calculation, can be chosen from dropdown list, default is Current Graph Timeframe
MA Type Short - Type of MA to use for Short Opening MA calculation, can be chosen from dropdown list, default is SMA
Data Short - Source of Price for Short Opening MA calculation, can be chosen from dropdown list, default is OHLC4
MA Length Short - Period used for Short Opening MA calculation, should be >=1, default is 3
MA offset Short - Offset for MA value used for Short Envelopes calculation, should be >= 0, default is 0
Timeframe Long - Timeframe to use for Long Opening MA calculation, can be chosen from dropdown list, default is Current Graph Timeframe
MA Type Long - Type of MA to use for Long Opening MA calculation, can be chosen from dropdown list, default is SMA
Data Long - Source of Price for Long Opening MA calculation, can be chosen from dropdown list, default is OHLC4
MA Length Long - Period used for Long Opening MA calculation, should be >=1, default is 3
MA offset Long - Offset for MA value used for Long Envelopes calculation, should be >= 0, default is 0
Mode close MA Short - Enable different MA for Short position Closure, default is "false". If false, Closure MA = Opening MA
Timeframe Short Close - Timeframe to use for Short Position Closure MA calculation, can be chosen from dropdown list, default is Current Graph Timeframe
MA Type Close Short - Type of MA to use for Short Position Closure MA calculation, can be chosen from dropdown list, default is SMA
Data Short Close - Source of Price for Short Closure MA calculation, can be chosen from dropdown list, default is OHLC4
MA Length Short Close - Period used for Short Opening MA calculation, should be >=1, default is 3
Short Deviation - % to move from MA value, used to close position above or beyond MA, can be negative, default is 0
MA offset Short Close - Offset for MA value used for Short Position Closure calculation, should be >= 0, default is 0
Mode close MA Long - Enable different MA for Long position Closure, default is "false". If false, Closure MA = Opening MA
Timeframe Long Close - Timeframe to use for Long Position Closure MA calculation, can be chosen from dropdown list, default is Current Graph Timeframe
MA Type Close Long - Type of MA to use for Long Position Closure MA calculation, can be chosen from dropdown list, default is SMA
Data Long Close - Source of Price for Long Closure MA calculation, can be chosen from dropdown list, default is OHLC4
MA Length Long Close - Period used for Long Opening MA calculation, should be >=1, default is 3
Long Deviation - % to move from MA value, used to close position above or beyond MA, can be negative, default is 0
MA offset Long Close - Offset for MA value used for Long Position Closure calculation, should be >= 0, default is 0
Short Shift 1..4 - % from MA value to put Envelopes at, for Shorts numbers should be positive, the higher is number, the higher should be Shift position, example: "Shift 1 = 1, shift 2 = 2, etc."
Long Shift 1..4 - % from MA value to put Envelopes at, for Longs numbers should be negative, the lower is number, the lower should be Shift position, example: "Shift 1 = -1, shift 2 = -2, etc."
From Year 20XX - Backtesting Starting Year number, only 20xx supported as script is cryptocurrency-oriented.
To Year 20XX - Backtesting Final Year number, only 20xx supported as script is cryptocurrency-oriented.
From Month - Years starting Month, optional tweaking, changing not recommended
To Month - Years ending Month, optional tweaking, changing not recommended
From day - Months starting day, optional tweaking, changing not recommended
To day - Months ending day, optional tweaking, changing not recommended
Graph notes:
Green lines - Long Envelopes.
Red lines - Short Envelopes.
Orange line - MA for closing of Short positions.
Lime line - MA for closing of Long positions.
**************************************************************************************************************************************************************************************************************
Опубликованный исходный код регулируется Условиями Стандартной Общественной Лицензии GNU Affero v3.0
Этот скрипт описывает и предоставляет функции бектеста для внутренней стратегии алгоритмического программного обеспечения "HatiKO bot".
Подходит для тестирования любой криптовалютной пары на любой бирже/платформе, на любом таймфрейме.
Кор-механика этой стратегии основана на теории всегда возвращающейся к значению МА цены с использованием индикатора Envelopes (Moving_average_envelope from Wiki)
Разработка этого скрипта и программного обеспечения для торговли вдохновлена следующими источниками:
Книга "Essential Technical Analysis: Tools and Techniques to Spot Market Trends" Ли Стивенса (опубликовано 12 апреля 2002 года)
«Moving Average Envelopes» от ChartSchool, платформа StockCharts (опубликовано 13 апреля 2015 года или раньше)
«Коля Колеснік» с канала Crypto Times («Метод сетка», опубликовано 19 августа 2018 года)
«3 ways to use Moving Average Envelopes» Рича Фиттона, опубликованные в «Trader's Nest» (опубликовано 28 ноября 2018 года или раньше)
Скрипт стратегии noro "Robot WhiteBox ShiftMA" v1, опубликованный на платформе TradingView(опубликовано 29 августа 2018 года)
«Moving Average Envelopes: A Popular Trading Tool», статья Investopedia (опубликовано 25 июня 2019 года)
Блог KROOL1980 из Argolabs («Гридерство или Сетка как источник прибыли на форекс», опубликовано 27 февраля 2015 года)
Основные особенности:
1) До 4-х Ордеров в каждом из направлении (Лонг / Шорт)
2) Выбор из 6-ти разных базовых МА, опционально используйте разные МА для открытия и закрытия.
3) Используйте разные таймфреймы для расчета MA, без перерисовки и "эффекта стеклянного шара".
4) Фиксированный размер ордера, а не стратегия Мартингейла
5) Возможность закрытия открытой позиции заблаговременно, используя параметр Deviation
6) Код реализован на PineScript v4
Описание параметров:
Lot - % от вашего первоначального баланса, используется при расчете размера Ордера
Timeframe Short - таймфрейм, используемый для расчета МА Открытия Шорт позиций, может быть выбран из списка, по умолчанию - таймфрейм текущего графика
MA Type Short - тип MA, используемый для расчета МА Открытия Шорт позиций, может быть выбран из списка, по умолчанию SMA
Data Short - источник цены для расчета МА Открытия Шорт позиций, может быть выбран из списка, по умолчанию OHLC4
MA Length Short - период, используемый для расчета МА Открытия Шорт позиций, должен быть >= 1, по умолчанию 3
MA Offset Short - смещение значения MA, используемого для расчета Шорт Ордеров, должно быть >= 0, по умолчанию 0
Timeframe Long - таймфрейм, используемый для расчета МА Открытия Лонг позиций, может быть выбран из списка, по умолчанию - таймфрейм текущего графика
MA Type Long - тип MA, используемый для расчета МА Открытия Лонг позиций, может быть выбран из списка, по умолчанию SMA
Data Long - источник цены для расчета МА Открытия Лонг позиций, может быть выбран из списка, по умолчанию OHLC4
MA Length Long - период, используемый для расчета МА Открытия Лонг позиций, должен быть >= 1, по умолчанию 3
MA Offset Long - смещение значения MA, используемого для расчета Лонг Ордеров, должно быть >= 0, по умолчанию 0
Mode close MA Short - Включает отдельное MA для закрытия Шорт позиции, по умолчанию «false». Если false, MA Закрытия = MA Открытия
Timeframe Short Close - таймфрейм, используемый для расчета МА Закрытия Шорт позиций, может быть выбран из списка, по умолчанию - таймфрейм текущего графика
MA Type Close Short - тип MA, используемый при расчете МА Закрытия Шорт позиции. Mожно выбрать из списка, по умолчанию SMA
Data Short Close - источник цены для расчета МА Закрытия Шорт позиций, может быть выбран из списка, по умолчанию OHLC4
MA Length Short Close - период, используемый для расчета МА Закрытия Шорт позиции, должен быть >= 1, по умолчанию 3
Short Deviation - % отклонения от значения MA, используется для закрытия позиции выше или ниже рассчитанного значения MA, может быть отрицательным, по умолчанию 0
MA Offset Short Close - смещение значения MA, используемого для расчета закрытия Шорт позиции, должно быть >= 0, по умолчанию 0
Mode close MA Long - Включает разные MA для закрытия Лонг позиции, по умолчанию «false». Если false, MA Закрытия = MA Открытия
Timeframe Long Close - таймфрейм, используемый для расчета МА Закрытия Лонг позиций, может быть выбран из списка, по умолчанию - таймфрейм текущего графика
MA Type Close Long - тип MA, используемый при расчете МА Закрытия Лонг позиции. Mожно выбрать из списка, по умолчанию SMA
Data Long Close - источник цены для расчета МА Закрытия Лонг позиций, может быть выбран из списка, по умолчанию OHLC4
MA Length Long Close - период, используемый для расчета МА Закрытия Лонг позиции, должен быть >= 1, по умолчанию 3
Long Deviation -% для перехода от значения MA, используется для закрытия позиции выше или ниже рассчитанного значения MA, может быть отрицательным, по умолчанию 0
MA Offset Long Close - смещение значения MA, используемого для расчета закрытия Лонг позиции, должно быть >= 0, по умолчанию 0
Short Shift 1..4 - % от значения MA для размещения Ордеров, для Шорт Ордеров должен быть положительным, чем выше номер, тем выше должна располагаться позиция Shift, например: «Shift 1 = 1, Shift 2 = 2 и т.д. "
Long Shift 1..4 - % от значения MA для размещения Ордеров, для Лонг Ордеров должно быть отрицательным, чем ниже число, тем ниже должна располагаться позиция Shift, например: «Shift 1 = -1, Shift 2 = -2, и т.д."
From Year 20XX - Год начала тестирования, из-за ориентированности на криптовалюты поддерживаются только значения формата 20хх.
To Year 20XX - Год окончания тестирования, из-за ориентированности на криптовалюты поддерживаются только значения формата 20хх.
From Month - Начальный месяц, опционально, менять не рекомендуется
To Month - Конечный месяц, опционально, менять не рекомендуется
From day - Начальный день месяца, опционально, менять не рекомендуется
To day - Конечный день месяца, опционально, менять не рекомендуется
Пояснения к графику:
Зеленые линии - Лонг Ордера.
Красные линии - Шорт Ордера.
Оранжевая линия - MA Закрытия Шорт позиций.
Лаймовая линия - MA Закрытия Лонг позиций.

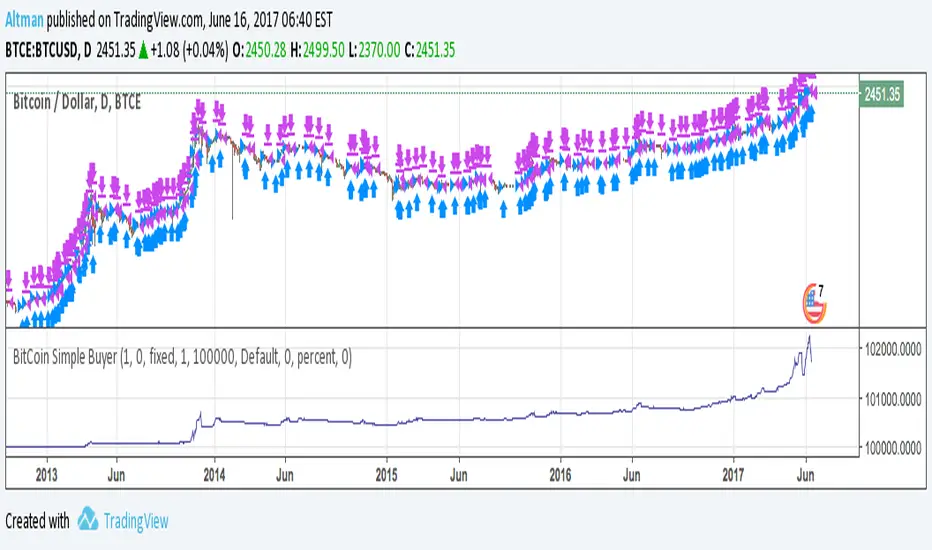
BitCoin Simple BuyerMany people asking me: How to find the right time to exit BitCoin long position? First, that comes to mind is Do Not use simple Buy-and-Hold strategy, but make short-term trades. Here is the simple algorithm for D1 or 4H timeframes.
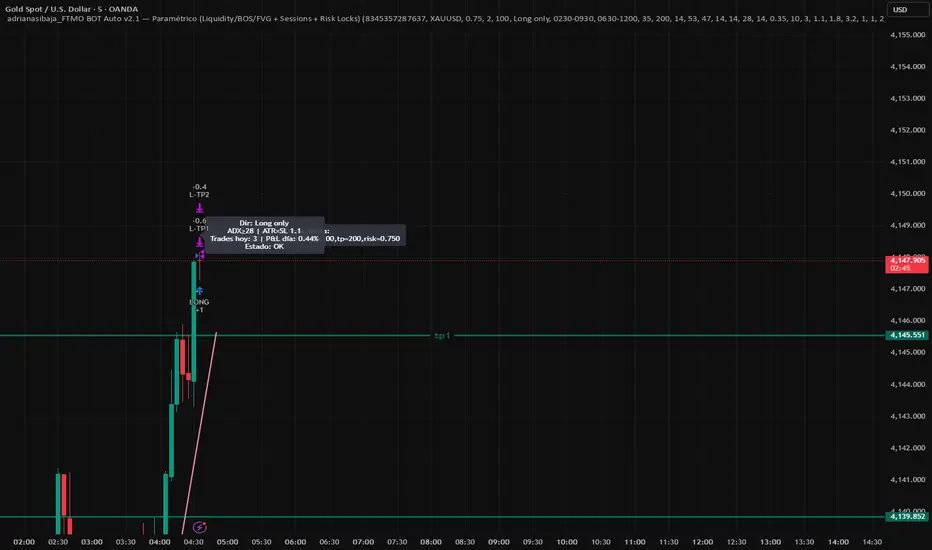
adrianasibaja_ ALGO (Liquidity/BOS/FVG + Sessions + Risk Locks)This strategy is an institutional-style automated trading system designed for XAU/USD and FTMO-funded accounts.
It combines liquidity sweeps, Break of Structure (BOS) and Fair Value Gap (FVG) confirmations with multi-filter confluences (RSI, ADX, ATR, EMA trend bias, and candle quality).
The algorithm automatically filters trades by session (London/New York), day of week, and volatility. It includes full FTMO risk management features such as daily loss lock, consecutive loss lock, and trade cooldowns.
MÈGAS ALGO : MÈGAS Engine [STRATEGY]Overview
The MÈGAS Engine is an advanced algorithmic trading system that integrates a range of technical analysis tools to pinpoint high-probability opportunities in the market.
Key Features
Core Signal Generation:
-Structure Break Detection: Advanced breakout identification with adjustable
sensitivity controls
-Dual-Direction Analysis: Separate bullish and bearish signal parameters with customizable delta
thresholds and depth settings
-Dynamic Parameter Management: OverfitShield technology with pulsewave parameter cycling
to reduce overfitting risks
Filtering Alghoritm:
-Volatility Filter: Rogers-Satchell volatility estimation with RSI-based normalization to avoid
trading in unfavorable market conditions
-Volume Confirmation: Cumulative volume analysis ensuring adequate liquidity support for trade
entries
OverfitShield Method:
OverfitShield is a built-in function within the trading strategy designed to reduce overfitting bias by introducing parameter variability during execution. When the "variable" mode is activated, instead of relying on fixed values for key strategy parameters the system dynamically selects values from customizable ranges.
This approach mimics real-world market uncertainty and ensures that the strategy does not become overly dependent on a single optimal value found during backtesting — making it more robust across different market conditions and time periods.
Position Management
-Customizable Exit Set-up
The exit logic can be customized to 'CONTINUE', 'TAKE PROFIT', or 'TRAILING PROFIT' to suit
your trading approach and maximize performance.
-CONTINUE Mode:
This mode does not use predefined take profit levels. Instead, it remains in the market as long as the trend persists. By avoiding fixed exit points, this approach is often the most effective in backtesting, as it allows positions to run in favorable trends for longer periods.
-TAKE PROFIT Mode:
This mode allows you to set multiple grid-like take profit levels at different price points, effectively creating a multi-tier exit strategy. You can specify the number of profit levels you want, along with the percentage step between each level. This structured approach can be beneficial for capturing incremental profits in a trending market while allowing for more flexibility in trade management.
-TRAILING PROFIT Mode:
Similar to the Take Profit mode, this option allows you to set the trailing stop levels. The trailing stop moves with the market, ensuring that you lock in profits as the price continues to move in your favor. Once a profit level is hit, the trailing stop "follows" the price movement, adjusting dynamically to safeguard profits as the trade progresses.
3. Customizable Insight Alerts
Traders can configure personalized alert messages for every strategy action, including entries, exits, and profit targets. These alerts are fully compatible with TradingView's webhook system.
Advantages
Customization: Fully customizable exit set-up and alerts allow traders to tailor the strategy to their personal trading objectives.
How It Works — Step by Step
Step 1: Apply the Strategy
Open the chart for your selected symbol and timeframe. Add the MÈGAS Engine to the chart.
Step 2:Backtesting and Optimization
Run a full backtest and optimize the strategy parameters across the chosen trading pairs to:
Identify robust settings that perform consistently well
Avoid overfitting through validation techniques
Select the most profitable and stable configuration for live or forward testing.
Step 3: Review Results and Alerts
Check the backtest results on the chart and confirm that the custom alert messages are displaying as expected. This helps verify that everything is functioning correctly before moving forward.
Step 4: Configure Portfolio Management
Set up the exit logic based on your specific requirements. Tailor the exit strategy to match your trading approach, whether you prefer predefined take profit levels, trailing stops, or a trend-following method. This flexibility ensures the exit logic aligns with your overall strategy for optimal performance.
Open the strategy settings window. In the dedicated portfolio management section, choose your preferred capital allocation method based on your trading style and risk preferences. Once set, save the configuration as the default.
Step 5: Set Up Alerts
Click "Add Alert" on the strategy
-In the message field, use: {{strategy.order.comment}}
Under the Notifications tab:
-Enable Webhook URL
-Enter your external webhook address
-Click 'Create' to activate alerts for your strategy
Please Note:
The results and visualizations presented are derived from optimized backtesting iterations using historical and paid real-time market data sourced via TradingView. While these results are intended to demonstrate potential performance, they do not guarantee future outcomes or accuracy. Past performance is not indicative of future results, and all trading involves risk.
We strongly recommend that users review and adjust the Properties within the script settings to align with their specific account configurations and preferred trading platforms. This ensures that the strategy outputs are reflective of real-world conditions and enhances the reliability of the results obtained. Use this tool responsibly and at your own risk.

Scalper Bot [SMRT Algo]The SMRT Algo Bot is a trading strategy designed for use on TradingView, enabling traders to backtest and refine their strategies with precision. This bot is built to provide key performance metrics through TradingView’s strategy tester feature, offering insights such as net profit, maximum drawdown, profit factor, win rate, and more.
The SMRT Algo Bot is versatile, allowing traders to execute either pro-trend or contrarian strategies, each with customizable parameters to suit individual trading styles.
Traders can automate the bot to their brokerage platform via webhooks and use third-party software to facilitate this.
Core Features:
Backtesting Capabilities: The SMRT Algo Bot leverages TradingView’s powerful strategy tester, allowing traders to backtest their strategies over historical data. This feature is crucial for assessing the viability of a strategy before deploying it in live markets. By providing metrics such as net profit, maximum drawdown, profit factor, and win rate, traders can gain a comprehensive understanding of their strategy's performance, helping them to make informed decisions about potential adjustments or optimizations.
Advanced Take Profit and Stop Loss Methods: The SMRT Algo Bot offers multiple methods for setting Take Profit (TP) and Stop Loss (SL) levels, providing flexibility to match different market conditions and trading strategies.
Take Profit Methods:
- Normal (Percent-based): Traders can set their TP levels as a percentage. This method adjusts the TP dynamically based on market volatility, allowing for more responsive profit-taking in volatile markets.
- Donchian Channel: Alternatively, the bot can use the Donchian Channel to set TP levels, which is particularly useful in trend-following strategies. The Donchian Channel identifies the highest high and lowest low over a specified period, providing a clear target for profit-taking when prices reach extreme levels.
Stop Loss Methods:
- Percentage-Based Stop Loss: This method allows traders to set a fixed percentage of the entry price as the stop loss. It provides a straightforward, static risk management approach that is easy to implement.
- Normal (Percent-based): Traders can set their SL levels as a percentage. This method adjusts the SL dynamically based on market volatility, allowing for more responsive profit-taking in volatile markets.
- ATR Multiplier: Similar to the TP method, the SL can also be set using a multiple of the ATR.
Pro-Trend and Contrarian Strategies: The SMRT Algo Bot is designed to execute either pro-trend or contrarian trading strategies, though only one can be active at any given time.
Pro-Trend Strategy: This strategy aligns with the prevailing market trend, aiming to capitalize on the continuation of current price movements. It is particularly effective in trending markets, where momentum is expected to carry the price further in the direction of the trend.
Contrarian Strategy: In contrast, the contrarian strategy seeks to exploit potential reversals or corrections, trading against the prevailing trend. This approach is more suitable in overextended markets where a pullback is anticipated. Traders can switch between these strategies based on their market outlook and trading style.
Dashboard Display: A dashboard located in the bottom right corner of the TradingView interface provides real-time updates on the bot’s performance metrics. This includes key statistics such as net profit, drawdown, profit factor, and win rate, specific to the current instrument being tested. This immediate access to performance data allows traders to quickly assess the effectiveness of the strategy and make necessary adjustments on the fly.
Input Settings:
Reverse Signals: If turned on, buy trades will be shown as sell trades, etc.
Show Signal (Bar Color): Shows the signal bar as a green candle for buy or red candle for sell.
RSI: Used as a filter for one of the conditions for trade. Can be turned on/off by clicking on the checkbox.
Timeframe: Affects the timeframe of RSI filter.
Length: Length of RSI used in measurement.
First Cross: Whether or not to factor in the first RSI cross in the calculation.
Buy/Sell (Above/Below): Look for trades if RSI is above or below these values.
EMA: Used as a trend filter for one of the conditions for trade. Can be turned on/off by clicking on the checkbox.
Timeframe: Affects the timeframe of EMA filter.
Fast Length: Value for the fast EMA.
Middle Length: Value for the middle EMA
Slow Length: Value for the slow EMA.
ADX: Used as a volatility filter for one of the conditions for trade. Can be turned on/off by clicking on the checkbox.
Threshold: Threshold value for ADX.
ADX Smoothing: Smoothing value for the ADX
DI Length: DI length value for the ADX.
Donchian Channel Length: This value affects the length value of the DC. Used in TP calculation.
Close Trade On Opposite Signal: If true, the current trade will close if an opposite trade appears.
RSI: If turned on, it will also use the RSI to exit the trade (overextended zones).
Take Profit Option: Choose between normal (percentage-based) and Donchian Channel options.
Stop Loss Option: Choose between normal (percentage-based) and Donchian Channel options.
The SMRT Algo Bot’s components are designed to work together seamlessly, creating a comprehensive trading solution. Whether using the ATR multiplier for dynamic adjustments or the Donchian Channel for trend-based targets, these methods ensure that trades are managed effectively from entry to exit. The ability to switch between pro-trend and contrarian strategies offers adaptability, enabling traders to optimize their approach based on market behavior. The real-time dashboard ties everything together, providing continuous feedback that informs strategic adjustments.
Unlike basic or open-source bots, which often lack the flexibility to adapt to different market conditions, the SMRT Algo Bot provides a robust and dynamic trading solution. The inclusion of multiple TP and SL methods, particularly the ATR and Donchian Channel, adds significant value by offering traders tools that can be finely tuned to both volatile and trending markets.
The SMRT Algo Suite, which the SMRT Algo Bot is a part of, offers a comprehensive set of tools and features that extend beyond the capabilities of standard or open-source indicators, providing significant additional value to users.
What you also get with the SMRT Algo Suite:
Advanced Customization: Users can customize various aspects of the indicator, such as toggling the confirmation signals on or off and adjusting the parameters of the MA Filter. This customization enhances the adaptability of the tool to different trading styles and market conditions.
Enhanced Market Understanding: The combination of pullback logic, dynamic S/R zones, and MA filtering offers traders a nuanced understanding of market dynamics, helping them make more informed trading decisions.
Unique Features: The specific combination of pullback logic, dynamic S/R, and multi-level TP/SL management is unique to SMRT Algo, offering features that are not readily available in standard or open-source indicators.
Educational and Support Resources: As with other tools in the SMRT Algo suite, this indicator comes with comprehensive educational resources and access to a supportive trading community, as well as 24/7 Discord support.
The educational resources and community support included with SMRT Algo ensure that users can maximize the indicators’ potential, offering guidance on best practices and advanced usage.
SMRT Algo believe that there is no magic indicator that is able to print money. Indicator toolkits provide value via their convenience, adaptability and uniqueness. Combining these items can help a trader make more educated; less messy, more planned trades and in turn hopefully help them succeed.
RISK DISCLAIMER
Trading involves significant risk, and most day traders lose money. All content, tools, scripts, articles, and educational materials provided by SMRT Algo are intended solely for informational and educational purposes. Past performance is not indicative of future results. Always conduct your own research and consult with a licensed financial advisor before making any trading decisions.

APIBridge Advanced RSI + EMAUsing Pinescript, we will use charts of Cash/Future to trade in Options. Note this strategy works well with even the free version of TradingView.
The Relative Strength Index ( RSI ). Is a momentum oscillator that measures the speed and change of price movements. The RSI oscillates between zero and 100. Increasing RSI shows increasing bullish momentum. Decreasing RSI shows increasing bearish momentum. We take RSI upper bound as 80 to indicate bullish momentum and RSI lower bound as 20 to indicate bearish momentum.
Since this strategy uses underlying data (cash/future) to place trades in Options, please ignore the backtest of this strategy given by TradingView. TradingView does not provide options data but this strategy bypasses it.
Strategy Premise
The Relative Strength Index ( RSI ) is a momentum oscillator that measures the speed and change of price movements. The RSI oscillates between zero and 100. Increasing RSI shows increasing bullish momentum. Decreasing RSI shows increasing bearish momentum. We take RSI upper bound as 80 to indicate bullish momentum and RSI lower bound as 20 to indicate bearish momentum.
apibridge rsi + ema options / futures / commodity algo strategy logic
Long Entry: When RSI crosses over oversold level and fast ema crosses over slow ema , send LE .
Long Exit: When price hit Stop loss or Target .If SL/ TGT is not hit and reverse signal is sent by strategy then exit the Long
Short Entry : When RSI crosses under overbought level and fast ema crosses under slow ema , send SE
Short Exit : When price hit Stop loss or Target. If SL/ TGT is not hit and reverse signal is sent by strategy then exit Short
TradingView Parameters
1. Start Date(Mandatory) : The strategy does not take trade before this date
2. End Date(Mandatory) : The strategy does not take trade after this trade
3.RSI Length(Mandatory): Number of bars used to calculated RSI .
4.Fast Ema Length(Mandatory): Length for fast ema
5.Slow Ema Length(Mandatory): Length for slow ema
6.Source for rsi and ema calculation(Mandatory): Source to use for rsi and ema like close , open , high , low , hl2 etc
7.Overbought(Mandatory): To specify upper band of RSI .
8.Oversold(Mandatory): For specifying lower band of RSI .
9.plot ema or rsi (Mandatory) : Due to difference in scales of rsi and ema , strategy can only plot one of both precisely (the strategy logic which is based on both esi and ema is unaffected by this choice)
10.Quantity: We use this to specify the trade quantity (for Nifty min 75)
11.Custom Stop Loss in Points: Movement in chart price against the momentum which will trigger exit in options positions
12.Custom Target in Points: Movement in chart price against the momentum which will trigger exit in options positions
13.Base symbol: This is the base instrument symbol like NIFTY or BANK NIFTY .
14.Strike distance from ATM: Our default strike selection is considered as first ATM option (with nearest distance, only 100s are considered ). This strike
distance allows to calculate ATM options which are at fixed distance.
15.Expiry: Expiry of option. Weekly and monthly both expiry are allowed.
16.Instrument: For index instrument will be OPTIDX, for stock instrument will be OPTSTK
17.Strategy Tag: The Strategy of Nifty options configured in Api bridge.

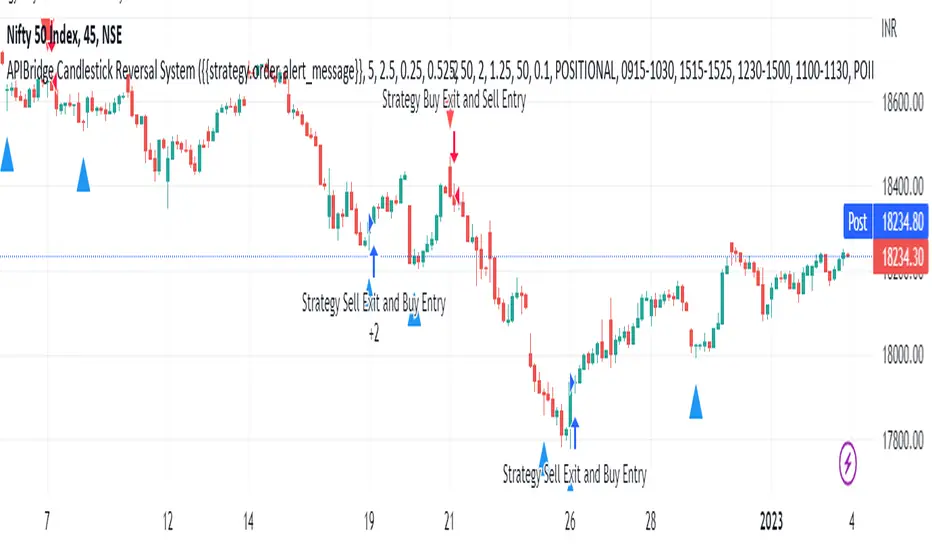
APIBridge Candlestick Reversal SystemStrategy Premise
This strategy uses the Wick Reversal System introduced in Pivot Boss and generates signals based on Candlestick Patterns.
– Wick Reversal System
– Extreme Reversal System
– Outside Reversal System
– Doji Reversal System
Wick Reversal System:
1. For a Bullish reversal wick to exist, the close of the bar should fall within the top 35% of the overall range of the candle.
2. For a bearish reversal wick to exist, the close of the bar should fall within the bottom 35% of the overall range of the candle.
Extreme Reversal System:
1. The first bar of the pattern is about two times larger than the average size of the candles in the look-back period.
2. The body of the first bar of the pattern should encompass more than 50% of the bar’s total range, but usually not more than 85%.
3. The second bar of the pattern opposes the first. If the first bar of the pattern is bullish (C > 0), then the second bar must be bearish (C < 0). If the first bar is bearish (C < 0), then the second bar must be bullish (C > 0).
Outside Reversal System:
1. The Engulfing bar of a bullish outside reversal setup has a low that is below the prior bar’s low (L < L) and a close that is above the prior bar’s high (C > H).
2. The Engulfing bar of a bearish outside reversal setup has a high that is above the prior bar’s high (H > H) and a close that is below the prior bar’s low (C < L).
3. The Engulfing bar is usually 5 to 25 percent larger than the size of the average bar in the look-back period.
Doji Reversal System:
1. The open and close prices of the Doji should fall within 10 percent of each other, as measured by the total range of the Candlestick .
2. For a Bullish Doji , the high of the Doji Candlestick should be below the ten-period Simple Moving Average (H SMA (10)).
4. For a Bearish Doji , one of the two bars following the Doji must close beneath the low of the Doji (C < L or C < L).
5. For a Bullish Doji setup, one of the two bars following the Doji must close above the high of the Doji (C > H) or C > H)
Strategy Logic
Long Entry:
When Low Pivot Point and Wick Reversal System and Bullish Wick Reversal Setup Pattern Send, LE
OR When Low Pivot Point and Extreme Reversal System and Bullish Extreme Reversal setup Send ,LE
OR When Low Pivot Point and Outside Reversal System and Bullish Outside Reversal Setup Send LE
OR When Low Pivot Point and Doji Reversal System and Bullish Doji Reversal Setup Send, LE
Long Exit:
Either when SL or Target is hit. If SL/ TGT is not hit and
When High Pivot Point and Wick Reversal System and Bearish Wick Reversal Setup Pattern Send LXSE
OR When High Pivot Point Extreme Reversal System and Bearish Extreme Reversal setup Send LXSE
OR When High Pivot Point Outside Reversal System and Bearish Outside Reversal Setup Send LXSE
OR When High Pivot Point Doji Reversal System and Bearish Doji Reversal Setup Send, LXSE
Short Entry:
When High Pivot Point and Wick Reversal System and Bearish Wick Reversal Setup Pattern Send SE
OR When High Pivot Point Extreme Reversal System and Bearish Extreme Reversal setup Send SE
OR When High Pivot Point Outside Reversal System and Bearish Outside Reversal Setup Send SE
OR When High Pivot Point Doji Reversal System and Bearish Doji Reversal Setup Send, SE
Short Exit:
Either when SL or Target is hit. If SL/ TGT is not hit and
When Low Pivot Point and Wick Reversal System and Bullish Wick Reversal Setup Pattern Send, SXLE
OR When Low Pivot Point and Extreme Reversal System and Bullish Extreme Reversal setup Send ,SXLE
OR When Low Pivot Point and Outside Reversal System and Bullish Outside Reversal Setup Send SXLE
OR When Low Pivot Point and Doji Reversal System and Bullish Doji Reversal Setup Send, SXLE
Candlestick Reversal System Algo Strategy Parameters for TradingView Charts
1.Length: This is number of bars used to calculated Ex: 14 à previous 14 candles are used
2.Backtesting : Use this to backtest the strategy between Starting and Ending Date and time , it can also be used to set trades in future time
3.Alert_Message : Need to copy while creating alert into Message Box
4.Trade Setup : Intraday / Positional (Selecct accordingly)
5.Start Time Stop Time (Session 1) : Intraday / Positional start time and end time of trade for session 1
6.End Session 1 : Define time to exit any existing position taken in session 1 so that exchange charges will not apply
7.Use Second Session : Check this to use second intraday session
8.Start Time Stop Time (Session 2) : Intraday / Positional start time and end time of trade for session 2
9.End Session 1 : Define time to exit any existing position taken in session 2 so that exchange charges will not apply
10.Use Target : check if you want to set required target if not cheque will not applicable
11.Use StopLoss : Cheque if you want to set stop loss if not cheque will not applicable
12.Trailling Stoploss : Cheque if you want to set trailing stop loss if not cheque will not applicable
13.Point Or Percentage For TG SL : Use Points or Percentage as per your choice
14.Target : Set as per the selection of (Point Or Percentage For TG SL)
15.Stop Loss : Set as per the selection of (Point Or Percentage For TG SL)
16.TSL_Type : Select as per your logic in %/ATR/Points
17.TSL_Input : Set in case you select %/Points in TSL_Type
18.ATR Length : Set as per your logic if you select ATR in the field of TSL_Type
19.ATR_Mult : Set as per your logic if you select ATR in the field of TSL_Type
20.Segment : Select segment of your logic EQ/FUTIDX/FUTSTK/OPTIDX/OPTSTK/FUTCUR/FUTCUM (Used in case of option / Futures )
21.Select Expiry Date : Select the expiry date of your trade as per the segment you selected (Used in case of option / Futures )
22.Select Expiry Month : Select the expiry Month of your trade as per the segment you selected (Used in case of option / Futures )
23.Year : Select the expiry Year of your trade as per the segment you selected (Used in case of option / Futures )
24.Quantity : Enter the quantity in which you want to trade (Used in case of option / Futures )
25.Product Type : Select MIS/Normal/ CNC as per your logic (Used in case of option / Futures )
26.Order Type : Select Market/Limit as per your logic (Used in case of option / Futures )
27.Strategy Tag : Enter the value in case you are using webhook / advance template in APIBridgeTM
28.Lotsize : Enter the lotsize as per your lotic and quentity selection (Used in case of option / Futures )
29.STEP (OTM/ATM/ ITM ) : Select OTM(+1)/ATM(0)/ ITM (-1) as per your logic works in case of options only
30.DIFFERENCE_BETWEEN 2 STRIKE : Select difference of 2 strikes you have used in APIBridge symbol setting list, like for Nifty 50 BankNifty 100
31.APIB Port : Set as per provided to you by Algoji in case of webhook / advance templet
The Segment full form is given below
EQ Equity
FUTIDX Future Index
FUTSTK Future Stock
OPTIDX Index Option
OPTSTK Stock Option
FUTCUR Futcur Currency
FUTCUM Future Commodity
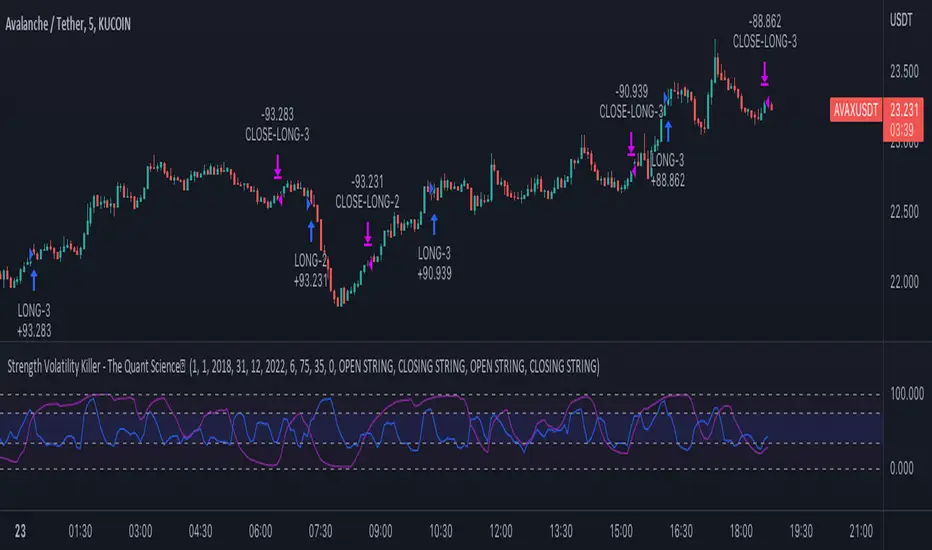
Strength Volatility Killer - The Quant ScienceStrength Volatility Killer - The Quant Science™ is based on a special version of RSI (Relative Strength Index), created with the simple average and standard deviation.
DESCRIPTION
The algorithm analyses the market and opens positions following three different volatility entry conditions. Each entry has a specific and personal exit condition. The user can setting trailing stop loss from user interface.
USER INTERFACE SETTING
Configures the algorithm from the user interface.
AUTO TRADING COMPLIANT
With the user interface, the trader can easily set up this algorithm for automatic trading.
BACKTESTING INCLUDED
The trader can adjust the backtesting period of the strategy before putting it live. Analyze large periods such as years or months or focus on short-term periods.
NO LIMIT TIMEFRAME
This algorithm can be used on all timeframes.
GENERAL FEATURES
Multi-strategy: the algorithm can apply long strategy or short strategy.
Built-in alerts: the algorithm contains alerts that can be customized from the user interface.
Integrated indicator: indicator is included.
Backtesting included: quickly automatic backtesting of the strategy.
Auto-trading compliant: functions for auto trading are included.
ABOUT BACKTESTING
Backtesting refers to the period 13 June 2022 - today, ticker: AVAX/USDT, timeframe 5 minutes.
Initial capital: $1000.00
Commission per trade: 0.03%
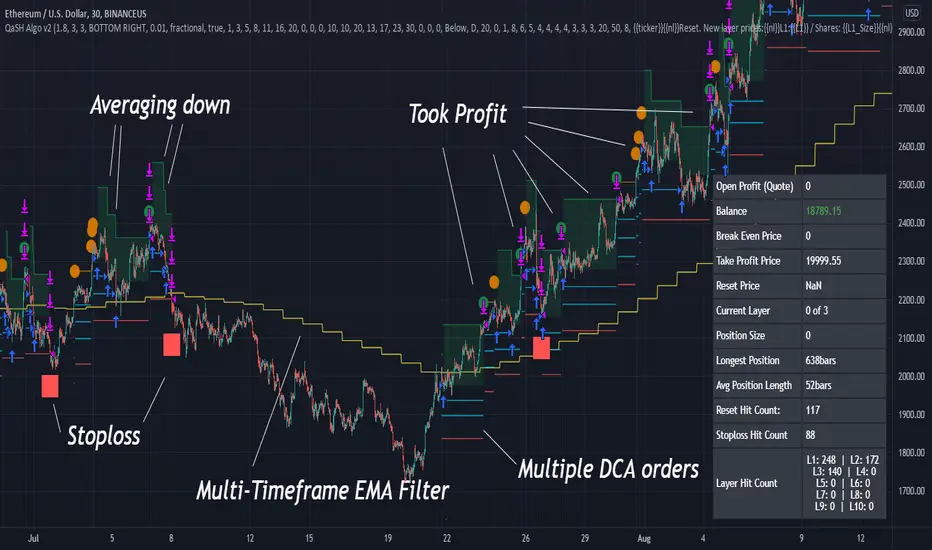
QaSH DCA Algorithm 2.0This is the strategy version of the QaSH DCA Algorithm indicator. This strategy version of the script includes live trading alert functionality, so it can be considered as a replacement that makes the indicator version obsolete. With this version, features have been added and also you can take advantage of TradingView's native backtesting system for more detailed backtest results.
QaSH DCA Algorithm implements a DCA strategy that takes advantage of price volatility by buying dips to average down, and adjusting price targets as the break-even price gets lower.
How does the DCA strategy work?
When the specified entry condition has occurred, the indicator will set up several limit orders below the current price. If price goes up a specified amount, then the layers will be overwritten at the higher prices. If price goes down and fills the first layer (limit order), then the Take Profit price is plotted and will be sent in an alert. If more layers are filled, then the TP price will move down accordingly as it’s based on the average entry price (alerts on each TP update). This action of lowering the average entry and TP price mitigates your risk, and increases the likelihood of a Take Profit event happening. This script uses a simple "ASAP" mode, where each deal will start exactly 2 bars after the last trade ended. An EMA filter and stoploss function was also added for risk management.
How does this differ from other DCA bots?
1) The layer placements, order volume , and “take profit %” for each layer or “safety order” is much more customizable than what you get from other services. For example, I can choose to have my TP% change, depending on how big the price dip was. Maybe on safety order 1 I want 10% TP, but on safety order 7 might want a 2% TP.
2) The entry condition is adjustable. For example, this script has an ema filter for entries.
3) Settings optimization. You can take advantage of the replay feature and TradingView's backtest system to see how trades would have played out, and how much PnL you would have made
4) You can use this indicator on more than just crypto. You can easily set up alerts for manual trades on stocks, or you can integrate it with your stock broker API of choice and automate your trades.
5) When combining this with an automation service, you will get unmatched execution speed by running it on your dedicated machine.
6) I can offer a lifetime subscription to the indicator upon request.
What kind of market is it best used on?
QaSH DCA Algorithm is best used on assets that are volatile. That means large and frequent swings up and down. Also I recommend running this on many uncorrelated assets at the same time. Better yet, run it with a variety of different settings simultaneously on the same asset.
What settings should I use?
The default settings are decent for most markets, and provide a good balance between profit potential and downside protection, although you can use a wide variety of settings. In a strong bull market its best to either bring up your layers to catch smaller dips, or you can go big on the first few layers (maybe 4 layers, 25% on each layer for example). In a sideways or brearish market you'll want more downside protection, so you'll want the larger orders to be at lower prices, or possibly use the stoploss and EMA filter.
BollingerBands Strat + pending order alerts via TradingConnectorSoftware part of algotrading is simpler than you think. TradingView is a great place to do this actually. To present it, I'm publishing each of the default strategies you can find in Pinescript editor's "built-in" list with slight modification - I'm only adding 2 lines of code, which will trigger alerts, ready to be forwarded to your broker via TradingConnector and instantly executed there. Alerts added in this script: 14, 17, 20 and 23.
SCRIPT INCLUDES PENDING ORDERS AND ALERTS! Alert will be sent to MetaTrader when order is triggered, but not yet filled. That means if market conditions change and order does not get filled, it needs to be cancelled as well, and there are alerts for that in the script as well.
How it works:
1. TradingView alert fires.
2. TradingConnector catches it and forwards to MetaTrader4/5 you got from your broker.
3. Trade gets executed inside MetaTrader within 1 second of fired alert.
When configuring alert, make sure to select "alert() function calls only" in CreateAlert popup. One alert per ticker is required.
Adding stop-loss, take-profit, trailing-stop, break-even or executing pending orders is also possible. These topics have been covered in other example posts.
This routing works for Forex, indices, stocks, crypto - anything your broker offers via their MetaTrader4 or 5.
Disclaimer: This concept is presented for educational purposes only. Profitable results of trading this strategy are not guaranteed even if the backtest suggests so. By no means this post can be considered a trading advice. You trade at your own risk.
If you are thinking to execute this particular strategy, make sure to find the instrument, settings and timeframe which you like most. You can do this by your own research only.

Consecutive Up/Down Strat + alerts via TradingConnector to ForexSoftware part of algotrading is simpler than you think. TradingView is a great place to do this actually. To present it, I'm publishing each of the default strategies you can find in Pinescript editor's "built-in" list with slight modification - I'm only adding 2 lines of code, which will trigger alerts, ready to be forwarded to your broker via TradingConnector and instantly executed there. Alerts added in this script: 12 and 15.
How it works:
1. TradingView alert fires.
2. TradingConnector catches it and forwards to MetaTrader4/5 you got from your broker.
3. Trade gets executed inside MetaTrader within 1 second of fired alert.
When configuring alert, make sure to select "alert() function calls only" in CreateAlert popup. One alert per ticker is required.
Adding stop-loss, take-profit, trailing-stop, break-even or executing pending orders is also possible. These topics have been covered in other example posts.
This routing works for Forex, indices, stocks, crypto - anything your broker offers via their MetaTrader4 or 5.
Disclaimer: This concept is presented for educational purposes only. Profitable results of trading this strategy are not guaranteed even if the backtest suggests so. By no means this post can be considered a trading advice. You trade at your own risk.
If you are thinking to execute this particular strategy, make sure to find the instrument, settings and timeframe which you like most. You can do this by your own research only.

3Commas BotBjorgum 3Commas Bot
A strategy in a box to get you started today
With 3rd party API providers growing in popularity, many are turning to automating their strategies on their favorite assets. With so many options and layers of customization possible, TradingView offers a place no better for young or even experienced coders to build a platform from to meet these needs. 3Commas has offered easy access with straight forward TradingView compatibility. Before long many have their brokers hooked up and are ready to send their alerts (or perhaps they have been trying with mixed success for some time now) only they realize there might just be a little bit more to building a strategy that they are comfortable letting out of their sight to trade their money while they eat, sleep, etc. Many may have ideas for entry criteria they are excited to try, but further questions arise... "What about risk mitigation?" "How can I set stop or limit orders?" "Is there not some basic shell of a strategy that has laid some of this out for me to get me going?"
Well now there is just that. This strategy is meant for those that have begun to delve into the world of algorithmic trading providing a template that offers risk defined positions complete with stops, limit orders, and even trailing stops should one so choose to employ any of these criteria. It provides a framework that is easily manipulated (with some basic working knowledge of pine coding) to encompass ones own ideas and entry criteria, while also providing an already functioning strategy.
The default settings have a basic 1:1 risk to reward ratio, which sets a limit and a stop equal distance from the entry. The entry is a simple MA cross (up for long, down for short). There a variety of MA's to choose from and the user can define the lengths of the averages. The ratio can be adjusted from the menu along with a volatility based adder (ATR) that helps to distance a stop from support or resistance. These values are calculated off the swing low/high of the user defined lookback period. Risk is calculated from position entry to stop, and projected upwards to the limit as a function of the desired risk to reward ratio. Of note: the default settings include 0.05% commissions. Competitive commissions of the leading cryptocurrency exchanges are .1% round trip (one buy and one sell) for market orders. There is also some slippage to allow time for alerts to be sent and orders to fill giving the back test results a more accurate representation of real time conditions. Its recommended to research the going rates for your exchange and set them to default for the strategy you use or build.
To get started a user would:
1) Make a copy of the code and paste in their bot keys in the area provided under the "3Comma Keys" section
- eg. Long bot "start deal" copied from 3commas in to define "Long" etc. (code is commented)
2) Place alert on desired asset with desired settings ensuring to select "Order fills and alert() function calls"
3) Paste webhook into the webhook box and select webhook URL alerts (3rd party provided webhook)
3) Delete contents of alert message box and replace with {{strategy.order.alert_message}} and nothing else
- the codes will be sent to the webhook appropriately as the strategy enters and exits positions. Only 1 alert is needed
settings used for the display image:
1hr chart on BTCUSD
-ATR stop
-Risk adjustment 1.2
-ATR multiplier 1.3
-RnR 0.6
-MAs HEMA/SMA
-MA Length 50/100
-Order size percent of equity
-Trail trigger 60% of target
Experiment with your own settings on your crypto of choice or implement your own code!
Implementing your trailing stop (optional)
Among the options for possible settings is a trailing stop. This stop will ratchet higher once triggered as a function of the Average True Range (ATR). There is a variable level to choose where the user would like to begin trailing the stop during the trade. The level can be assigned with a decimal between 0 and 1 (eg. 0.5 = 50% of the distance between entry and the target which must be exceeded before the trail triggers to begin). This can allow for some dips to occur during the trade possibly keeping you in the trade for longer, while potentially reducing risk of drawdown over time. The default for this setting is 0 meaning unless adjusted, the trail will trigger on entry if the trailing stop exit method is selected. An example can be seen below:
Again, optional as well is the choice to implement a limit order. If one were to select a trailing stop they could choose not to set a limit, which could allow a trail to run further until hit. Drawdowns of this strategy would be foregoing locking gains at highs on target on other trades. This is a trade-off the user can decide on and test. An example of this working in favor can be observed below:
Conclusion
Although a simple strategy is implemented here, the benefits of this script allow a user a starting platform to build their strategies from with built in risk mitigation. This allows the user to sidestep some of the potential difficulties' that can arise while learning Pine and taking on the endeavor of automating their trading strategies. It is meant as an aid, a structure, and an educational piece that can be seen as a "pick-up-and-go" strategy with easy 3Commas compatibility. Additionally, this can help users become more comfortable with strategy alert messages and sending strings in the form of alerts from Pine. As well, FAQs are often littered with questions regarding "strategy.exit" calls, how to implement stops. how to properly set a trailing stop based on ATR, and more. The time this can save an individual to get started is likely of the best "take-aways" here.
Happy trading

Reticulata Enhanced - StrategyThis script is the backtesting for Reticulata Enhanced.
Building on our core script - Reticulata, the enhanced version features several requested extras to give you more flexibility with your trading style.
What is Reticulata Enhanced?
The Reticulata core leverages a blend of MA/RSI strategies mixed with the Bull Bear Bots optimised logic for risk management. This enhanced version takes it a step further with additional risk management features:
Trailing Stop
Fixed Stop
Fixed Stop, but move at TP
Trend confirmation
Usage
Using the indicator is as simple as:
1. Select the strategy, or combination of strategies you want to use
2. If desired, select one or more of the available trend filters
3. Adjust your stop options
4. Review backtest results
Markets
Like the core, the enhanced algo also supports a range of markets and timeframes, including the majors (EURUSD, etc...) in Forex and a variety of Cryptocurrencies including Bitcoin (BTC/XBT etc...).
All of our scripts are designed for manual traders but are ready to use with automated trading bots.

14/28 Day SMA Divergence and RSI - No RepaintIf you are interested in purchasing my algorithmic trading bot that receives Tradingview indicator alerts via email and then executes them in Bittrex, please visit my product page here: ilikestocks.com Additionally, I would love to create video/blog guides on creating Tradingview scripts or strategies. If you are a knowledgeable in finance or other related fields and would like to be featured on my page, please contact me at tanner@ilikestocks.com.
No crossovers were used in this script, and this is likely the reason for the no repaint(Correct me if wrong).
This strategy script uses a 14-day SMA signal line, a 28-day SMA and RSI. The strategy works by determining whether the (14-day SMA is above the 28-day SMA and the RSI levels are overbought(below 30)) or RSI is very overbought(below 13 or so). Once either of these conditions have been met, a long position is opened.
The initial long position must be partially closed by the take profit first and then the final close is executed if the 14-day signal SMA is below the 28-day SMA; you may also exclusively use take profit to close positions.
The green plotted spikes are the initial long position conditions. The orange plotted spikes are take profit signals once a long position is opened. The red plotted spikes are plotted when the SMA 14-day is below the 28-day SMA.
Please do leave constructive criticism or comments below because it helps me better create scripts!

POCTraderX Pro— Structure & Precision Algorithm POCTraderX Pro is a market analysis system designed to accurately identify key interest zones and price turning points. It combines advanced Price Action reading with a dynamic filtering process that adapts signals according to market volatility and internal structure.
Methodology
The algorithm analyzes the sequence of relevant highs and lows (HH, HL, LL, LH) along with the price location in relation to Point of Control levels and consolidation ranges.
It uses multi–timeframe confirmations to filter out false breakouts and optimize trade entries.
In high–volatility conditions, it automatically adjusts validation levels to maintain a favorable risk/reward ratio.
Configuration
Recommended timeframes: from 1–minute to daily, depending on the trading style.
Applicable markets: indices, forex, commodities, and cryptocurrencies.
Adjustable parameters:
Structure detection sensitivity.
Enable/disable volatility filters.
Show/hide control zones and previous ranges.
Purpose
Provide a clear reading of market structure and critical zones to help traders execute trades with greater consistency and avoid entries in low–probability areas.
Important Notes
This script is closed–source to protect its internal methodology, but it is based on an original combination of structural analysis and zone validation not available in free indicators.
It does not produce automatic buy or sell signals without context; it is intended to be integrated into a complete trading strategy.
Trend Hunter Scalping [Daddin Algo]Trend Hunter Scalping Strategy Description
This strategy is a comprehensive scalping system designed to capture high-frequency trading opportunities within short timeframes. It combines multiple technical indicators to assess trend direction, momentum, volatility, and volume dynamics. Importantly, all parameters are user-adjustable, allowing the strategy to be optimized for various market conditions and individual preferences.
Technical Indicators and Settings
EMA (Exponential Moving Average):
The EMA is calculated based on a user-defined period. Rather than being fixed (e.g., a 200-period EMA), the period is adjustable to suit different market conditions. The position of the price relative to the EMA helps confirm the overall trend.
RSI & RSIOver:
The Relative Strength Index (RSI) measures momentum and the speed of price changes. Entry signals are generated when the RSI crosses its moving average. Additionally, overbought and oversold thresholds (set by the user) add an extra layer of confirmation for the signals.
ADX:
The Average Directional Index (ADX) assesses the strength of the current trend. When the ADX is above a user-specified threshold, the signals are considered more reliable. This helps in filtering out signals during weak trending periods.
Bollinger Bands:
Bollinger Bands gauge market volatility. The settings—including the length and the multiplier—are adjustable, providing flexibility to accommodate tightening or expanding volatility conditions.
Parabolic SAR:
This indicator identifies dynamic support and resistance levels, confirming the trend direction and helping pinpoint potential entry and exit points.
Pivot Levels (Fibonacci):
Calculated from the previous period's high, low, and close, pivot points and Fibonacci levels indicate potential reversal points and serve as support and resistance levels. These levels provide context for setting trailing stops and managing risk.
Volume Filter:
A volume condition ensures that trading signals are only considered valid when the current volume exceeds a multiple of its short-term moving average. This filter is adjustable, helping to confirm the strength of the market move.
Daddin Line:
Derived from a short-term moving average of the closing prices with a user-defined offset, the Daddin Line acts as an additional confirmation tool. Its parameters can be customized to better align with specific trading environments.
Trading Logic and Management
Signal Direction and Entry:
The strategy can generate both long (buy) and short (sell) signals, or be limited to one direction based on user preference. Entry orders are executed when all the selected indicator conditions are met. Additionally, maximum consecutive trade limits are implemented to help control risk.
Exit & Take Profit:
Trades are exited automatically when a user-defined profit percentage is reached. This take-profit percentage is flexible, enabling adjustments to match different market conditions or trading goals.
Trailing Stop (Dynamic Stop Loss):
A trailing stop mechanism is implemented using Fibonacci pivot levels. Once a position is open, the stop loss is dynamically updated as the price moves favorably. This ensures that profits are protected while minimizing losses in case of a sudden reversal.
Additional Features and Backtesting
Time Filtering (Backtesting):
The strategy includes a date range filter for backtesting. Users can define the start and end dates to evaluate the strategy’s performance during specific market periods, making it easier to assess its historical effectiveness.
Customizable Parameters:
Every indicator and risk management setting is fully customizable. This adaptability allows traders to tailor the strategy to different assets, timeframes, and market environments, ensuring optimal performance across diverse trading scenarios.
Conclusion
The Trend Hunter Scalping strategy effectively integrates multiple technical indicators to validate trends and manage risks efficiently. Its highly flexible, user-adjustable parameters make it adaptable to varying market conditions, providing traders with a robust framework for capturing quick trading opportunities.This strategy is designed to optimize both entry and exit points while offering comprehensive risk management controls.

Basic PRISM Algorithm [ByteBoost]The Basic ByteBoost PRISM strategy is designed to operate in various market conditions by leveraging the concept of brownian motion theory, which refers to the unpredictable movement of particles suspended in a fluid. This characteristic of random motion can be effectively utilized for analyzing time series data, such as market candles. Based on this notion, we are making the following assumptions regarding the market.
The stock price exhibits characteristics of Brownian motion.
The stock price is distributed in a log-normal pattern.
Volatility remains constant over time.
Options can only be exercised upon expiration.
Risk-free interest does not fluctuate over time.
There are no random or arbitrary opportunities present in the market.
Development Notes
This Strategy was developed with the PineScript language, version 5. This indicator, and most of the descriptions below, were derived largely from the TradingView reference manual. Feedback and suggestions for improvement are more than welcome, as well as recommended input settings and best practices to assist and guide new users effectively.
Features
The ByteBoost PRISM indicator is capable of analyzing multiple aspects of market behavior simultaneously such as:
Detection of potential trend reversals.
Assessment of trend strength and market sentiment.
Identification of stop loss levels.
Discovery of potential entry and exit points.
Ensuring compatibility and effectiveness with other indicators.
Visualization of strategy using historical data.
Strategy Description
PRISM is an all in one strategy that allows the visualization of entry and exit points as well as the historical performance for every set of parameters. PRISM is a slow paced indicator recommended for the 1h timeframe, because it operates on the belief that markets move in a Brownian motion, for which it leaves enough space and time for the market to decide a trend and catch it at the right time as well as finding appropriate exits given the trend.
PRISM can exist in either an uptrend or downtrend state, but it does not necessarily imply that it reflects the true trend being observed. Instead, it emphasizes capturing significant movements and capitalizing on them by utilizing oscillator levels and exit points calculated based on oversold or overbought values, along with the volatility associated with these movements.
Usage
To use this strategy it is first needed to select a correct set of inputs that correspond to the market you are using, the extra, win difference and oscillator length are dependent on the current market and the average price it manages, so these inputs need to be modified for every pair of assets used.
The long and short tags signify the opportune moment to initiate a new position in the market, whether it's a long or short position, respectively. The exit tags indicate when these positions should be closed. If no exits occur before a new long or short position emerges, it is essential to conclude the existing position and commence a new one in the opposite direction.
Regarding exits, up to two exits can be executed for each movement. The user has the flexibility to determine how these exits are utilized. In the input section, a specific percentage of equity can be selected to be sold during the first exit. If set to 100%, only a single exit will be presented. Otherwise, the remaining equity will be sold during the second exit or at the next trend reversal depending on which action occurs first.
In case the user requires additional exits beyond the initial two, the alternative exits option can be activated in the inputs. This will provide access to supplementary exits, although they may be less advisable compared to the primary exits.
Inputs / Settings
Capital - If using any leverage multiply the amount of money to invest by the leverage, else input the amount to be invested in every trade.
Start date - The date from which the strategy should begin its analysis. Leave unchanged to start from the earliest available date based on your account's plan.
End date - The date until which the strategy should conduct its analysis. Leave unchanged to continue until the current date.
Extra - The minimum gain required in the market to trigger an exit opportunity. It can be a negative number to allow exits at a loss, potentially minimizing losses.
First exit % - If an exit is decided to be partial, it is very likely that there will be a second exit, this parameter determines the percentage of equity to be sold at the first exit. Note that a second exit may not always be applicable.
Win difference - The minimum difference between the entry point and the first exit to determine whether it should be a full exit or a partial exit, as the exit price approaches the entry price, the probability of a trend reversal increases, a full exit is beneficial.
Oscillator - Enables or disables the main oscillator, which helps determine entry points. Not all assets may benefit from this parameter.
Oscillator length - Specifies the number of candles considered for the entry points oscillator.
Highlighter - Applies a light color between the trend and average price of each bar.
Labels - Displays all the labels on the chart indicating trends, positions and exits.
Candle color - Color codes the inside of the candles with the current signal.
Oscillator points - Adds visual dots to indicate when the oscillator has changed its trend.
Color uptrend - Determines the color scheme for identifying uptrend movements.
Color downtrend - Determines the color scheme for identifying downtrend movements.
Color long - Sets the color scheme for a new long position.
Color short - Sets the color scheme for a new short position.
Color exit - Decides the color scheme for the exit tag and cross shown.
Indicator Visuals
The strategy plots the direction of the trend on the chart and changes its color based on this. It also plots shapes on the chart to denote potential buy (Long) and sell (Short) points, where the signals of short and long will appear as well as exit points which can be found as three different,
Exit 1 - A partial exit which sells the previously selected percentage of equity.
Exit 2 - A second exit that can only happen after an Exit 1 has happened, and sell the remaining amount of equity.
Exit Full - A full exit is executed when the price at the exit point is lower than the entry price plus the win difference value. This condition indicates that it is more advantageous to take a single exit rather than waiting for a second exit.
Strategy Alerts
The strategy does not include built-in alerts. However, alerts can be added using the TradingView interface based on the strategy's buy and sell conditions. This way you will be able to receive notifications on your computer or phone when a new signal goes out.
Details
Repainting: It is important to mention that the strategy can mark false long or short signals, as the oscillator is allowed to repaint on the same candle. So users must make sure the candle has closed on buy/sell conditions.
Excessive capital issue: If you configure the strategy with a big amount of capital (+$1,000,000 for example) it is possible that it will completely stop calculating exit signals, as they will be too big for TradingView’s engine to process.
Conclusion
The ByteBoost PRISM strategy empowers traders by providing comprehensive market analysis, clear entry and exit signals, and the ability to visualize strategy performance using historical data. It is a superior algorithm that maximizes profit potential and minimizes risks, making it the preferred choice for traders seeking a competitive edge in the financial markets.
Disclaimer
This strategy is provided as-is, with no guarantee of profits or responsibility for losses. Trading involves risk, and you should only trade with money you can afford to lose. Always conduct your own research and consider your financial situation before engaging in trading.
Premium PRISM Algorithm [ByteBoost]The ByteBoost PRISM strategy is designed to operate in various market conditions by leveraging the concept of brownian motion theory, which refers to the unpredictable movement of particles suspended in a fluid. This characteristic of random motion can be effectively utilized for analyzing time series data, such as market candles. Based on this notion, we are making the following assumptions regarding the market.
The stock price exhibits characteristics of Brownian motion.
The stock price is distributed in a log-normal pattern.
Volatility remains constant over time.
Options can only be exercised upon expiration.
Risk-free interest does not fluctuate over time.
There are no random or arbitrary opportunities present in the market.
Development Notes
This Strategy was developed with the PineScript language, version 5. This indicator, and most of the descriptions below, were derived largely from the TradingView reference manual. Feedback and suggestions for improvement are more than welcome, as well as recommended input settings and best practices to assist and guide new users effectively.
Features
The ByteBoost PRISM indicator is capable of analyzing multiple aspects of market behavior simultaneously such as:
Detection of potential trend reversals.
Assessment of trend strength and market sentiment.
Identification of stop loss levels.
Discovery of potential entry and exit points.
Ensuring compatibility and effectiveness with other indicators.
Visualization of strategy using historical data.
Customization options available.
Strategy Description
PRISM is an all in one strategy that allows the visualization of entry and exit points as well as the historical performance for every set of parameters. PRISM is a slow paced indicator recommended for the 1h timeframe, because it operates on the belief that markets move in a Brownian motion, for which it leaves enough space and time for the market to decide a trend and catch it at the right time as well as finding appropriate exits given the trend.
PRISM can exist in either an uptrend or downtrend state, but it does not necessarily imply that it reflects the true trend being observed. Instead, it emphasizes capturing significant movements and capitalizing on them by utilizing oscillator levels and exit points calculated based on oversold or overbought values, along with the volatility associated with these movements.
Usage
To use this strategy it is first needed to select a correct set of inputs that correspond to the market you are using, the extra, win difference and oscillator length are dependent on the current market and the average price it manages, so these inputs need to be modified for every pair of assets used.
The long and short tags signify the opportune moment to initiate a new position in the market, whether it's a long or short position, respectively. The exit tags indicate when these positions should be closed. If no exits occur before a new long or short position emerges, it is essential to conclude the existing position and commence a new one in the opposite direction.
Regarding exits, up to two exits can be executed for each movement. The user has the flexibility to determine how these exits are utilized. In the input section, a specific percentage of equity can be selected to be sold during the first exit. If set to 100%, only a single exit will be presented. Otherwise, the remaining equity will be sold during the second exit or at the next trend reversal depending on which action occurs first.
In case the user requires additional exits beyond the initial two, the alternative exits option can be activated in the inputs. This will provide access to supplementary exits, although they may be less advisable compared to the primary exits.
Inputs / Settings
Capital - If using any leverage multiply the amount of money to invest by the leverage, else input the amount to be invested in every trade.
Start date - The date from which the strategy should begin its analysis. Leave unchanged to start from the earliest available date based on your account's plan.
End date - The date until which the strategy should conduct its analysis. Leave unchanged to continue until the current date.
Extra - The minimum gain required in the market to trigger an exit opportunity. It can be a negative number to allow exits at a loss, potentially minimizing losses.
First exit % - If an exit is decided to be partial, it is very likely that there will be a second exit, this parameter determines the percentage of equity to be sold at the first exit. Note that a second exit may not always be applicable.
Win difference - The minimum difference between the entry point and the first exit to determine whether it should be a full exit or a partial exit, as the exit price approaches the entry price, the probability of a trend reversal increases, a full exit is beneficial.
Limit length - Specifies the number of candles to consider for the overbought and oversold market calculation.
Low limit - Sets the minimum value of the limit to decide a short exit.
High limit - Sets the maximum value of the limit to decide a long exit.
Band length - Determines the number of candles to consider for the volatility analysis.
Band height - Sets the multiplication factor of the band to set the maximum and minimum height.
Increment - Determines the rate at which trend reversals occur. A higher value brings the line closer to the current price faster.
Candles exit - Specifies the minimum number of candles required to pass for an exit to become available after initiating a new position.
Oscillator - Enables or disables the main oscillator, which helps determine entry points. Not all assets may benefit from this parameter.
Oscillator length - Specifies the number of candles considered for the entry points oscillator.
Highlighter - Applies a light color between the trend and average price of each bar.
Trend Labels - Displays labels indicating an uptrend or downtrend.
Signal Labels - View the labels indicating a new long or short position.
Exit Labels - Displays the labels indicating exit points.
Candle color - Color codes the inside of the candles with the current signal.
Cloud - Visualize the average price cloud to determine trend direction.
Oscillator points - Adds visual dots to indicate when the oscillator has changed its trend.
Oscillator line - Displays the values of the oscillator to indicate upcoming trend changes.
Alternative exits - Shows additional exits to the ones we recommend, useful if the user missed an exit or needs to have more than two.
Color uptrend - Determines the color scheme for identifying uptrend movements.
Color downtrend - Determines the color scheme for identifying downtrend movements.
Color long - Sets the color scheme for a new long position.
Color short - Sets the color scheme for a new short position.
Color exit - Decides the color scheme for the exit tag and cross shown.
Color alternative exit - Changes the color scheme for the alternative exit cross.
Color oscillator line - Determines the color scheme used for the oscillator line.
Indicator Visuals
The strategy plots the direction of the trend on the chart and changes its color based on this. It also plots shapes on the chart to denote potential buy (Long) and sell (Short) points, where the signals of short and long will appear as well as exit points which can be found as three different,
Exit 1 - A partial exit which sells the previously selected percentage of equity.
Exit 2 - A second exit that can only happen after an Exit 1 has happened, and sell the remaining amount of equity.
Exit Full - A full exit is executed when the price at the exit point is lower than the entry price plus the win difference value. This condition indicates that it is more advantageous to take a single exit rather than waiting for a second exit.
Strategy Alerts
The strategy does not include built-in alerts. However, alerts can be added using the TradingView interface based on the strategy's buy and sell conditions. This way you will be able to receive notifications on your computer or phone when a new signal goes out.
Details
Repainting: It is important to mention that the strategy can mark false long or short signals, as the oscillator is allowed to repaint on the same candle. So users must make sure the candle has closed on buy/sell conditions.
Excessive capital issue: If you configure the strategy with a big amount of capital (+$1,000,000 for example) it is possible that it will completely stop calculating exit signals, as they will be too big for TradingView’s engine to process.
Conclusion
The ByteBoost PRISM strategy empowers traders by providing comprehensive market analysis, clear entry and exit signals, and the ability to visualize strategy performance using historical data. It is a superior algorithm that maximizes profit potential and minimizes risks, making it the preferred choice for traders seeking a competitive edge in the financial markets.
Disclaimer
This strategy is provided as-is, with no guarantee of profits or responsibility for losses. Trading involves risk, and you should only trade with money you can afford to lose. Always conduct your own research and consider your financial situation before engaging in trading.

Rocket Grid Algorithm - The Quant ScienceThe Rocket Grid Algorithm is a trading strategy that enables traders to engage in both long and short selling strategies. The script allows traders to backtest their strategies with a date range of their choice, in addition to selecting the desired strategy - either SMA Based Crossunder or SMA Based Crossover.
The script is a combination of trend following and short-term mean reversing strategies. Trend following involves identifying the current market trend and riding it for as long as possible until it changes direction. This type of strategy can be used over a medium- to long-term time horizon, typically several months to a few years.
Short-term mean reversing, on the other hand, involves taking advantage of short-term price movements that deviate from the average price. This type of strategy is usually applied over a much shorter time horizon, such as a few days to a few weeks. By rapidly entering and exiting positions, the strategy seeks to capture small, quick gains in volatile market conditions.
Overall, the script blends the best of both worlds by combining the long-term stability of trend following with the quick gains of short-term mean reversing, allowing traders to potentially benefit from both short-term and long-term market trends.
Traders can configure the start and end dates, months, and years, and choose the length of the data they want to work with. Additionally, they can set the percentage grid and the upper and lower destroyers to manage their trades effectively. The script also calculates the Simple Moving Average of the chosen data length and plots it on the chart.
The trigger for entering a trade is defined as a crossunder or crossover of the close price with the Simple Moving Average. Once the trigger is activated, the script calculates the total percentage of the side and creates a grid range. The grid range is then divided into ten equal parts, with each part representing a unique grid level. The script keeps track of each grid level, and once the close price reaches the grid level, it opens a trade in the specified direction.
The equity management strategy in the script involves a dynamic allocation of equity to each trade. The first order placed uses 10% of the available equity, while each subsequent order uses 1% less of the available equity. This results in the allocation of 9% for the second order, 8% for the third order, and so on, until a maximum of 10 open trades. This approach allows for risk management and can help to limit potential losses.
Overall, the Rocket Grid Algorithm is a flexible and powerful trading strategy that can be customized to meet the specific needs of individual traders. Its user-friendly interface and robust backtesting capabilities make it an excellent tool for traders looking to enhance their trading experience.

tvbot Trend Following with Mean Reversion algoDefault settings are for the ETHUSDT 5 min Binance Chart regular candles.
Back test Default settings are 10,000 usd to start, Commission 0.075%, capital deployment per position is 10%, slippage value of 1.
This algo uses the EMA to set the trend line . You are also able to turn the trend line into a range instead of just a static line. The algo uses the VWMA to set the base entry parameters. When a candle closes above or below the VWMA it will record that price and then wait for the VWMA to meet the candle close price. When that happens the Base entry condition is met. (it causes the vwma to create a hook like structure. essentially tell you that the momentum has changed directions.)
The algo will always check to see if the trend line has either breached or has been tested and held. If this condition has been met it will then go to the base entry condition to check to see if the momentum has changed.
There is a mean reversion component in this algo as well. When the price has moved away from the mean(set by user) by a certain amount the algo will start to look for a top or bottom. Once that condition has been met it will then use the base entry condition to look for a change in momentum, but the mean reversion base entry condition uses the HMA to check for a change in momentum.
This algo effectively looks like a hamburger. Mean reversion being the tops and bottoms(bun) and the trend following(beef patty)

[Fedra Algotrading 2TPs]This strategy uses the deviation of a simple linear regression to determine the entry point into a short-term trend. It also includes an intelligent trend filter (SMA, WMA, Super trend and MACD), to determine the dominant trend over a longer time frame and avoid opening trades against the market.
It manages capital by dividing the position into 2 take profits, the first one configurable in a fixed percentage, which will sell half of the position, and the second one that will trigger a trailing take profit once the desired percentage is reached, with the rest of the position.
Each parameter is optimizable to adapt it to the desired market, but this strategy benefits from the high volatility of mid and low capitalization cryptocurrencies due to their higher volatility.
It also includes tools to adjust the backtests, and command inputs so that the script can automatically work with bots.