ChopFlow ATR Scalp StrategyA lean, high-velocity scalp framework for NQ and other futures that blends trend clarity, volume confirmation, and adaptive exits to give you precise, actionable signals—no cluttered bands or lagging indicators.
⸻
🔍 Overview
This strategy locks onto rapid intraday moves by:
• Filtering for directional momentum with the Choppiness Index (CI)
• Confirming conviction via On-Balance Volume (OBV) against its moving average
• Automatically sizing stops and targets with a multiple of the Average True Range (ATR)
It’s designed for scalp traders who need clean, timely entries without wading through choppy noise.
⸻
⚙️ Key Features & Inputs
1. ATR Length & Multiplier
• Controls exit distances based on current volatility.
2. Choppiness Length & Threshold
• Measures trend strength; only fires when the market isn’t “stuck in the mud.”
3. OBV SMA Length
• Smoothes volume flow to confirm genuine buying or selling pressure.
4. Custom Session Hours
• Avoid overnight gaps or low-liquidity periods.
All inputs are exposed for rapid tuning to your preferred scalp cadence.
🚀 How It Works
1. Long Entry triggers when:
• CI < threshold (strong trend)
• OBV > its SMA (positive volume flow)
• You’re within the defined session
2. Short Entry mirrors the above (CI < threshold, OBV < SMA)
3. Exit uses ATR × multiplier for both stop-loss and take-profit
⸻
🎯 Usage Tips
• Start with defaults (ATR 14, multiplier 1.5; CI 14, threshold 60; OBV SMA 10).
• Monitor signal frequency, then tighten/loosen CI or OBV look-back as needed.
• Pair with a fast MA crossover or price-action trigger if you want even sharper timing.
• Backtest across different sessions (early open vs. power hours) to find your edge.
⸻
⚠️ Disclaimer
This script is provided “as-is” for educational and research purposes. Always paper-trade any new setup extensively before deploying live capital, and adjust risk parameters to your personal tolerance.
⸻
Elevate your scalp game with ChopFlow ATR—where trend, volume, and volatility converge for clear, confident entries. Happy scalping!
Cari dalam skrip untuk "atr"

Smart Breakout with ATR Stop-LossThe Smart Breakout indicator combines a classic 20-day Donchian channel breakout with a tight trailing stop, drawing green lines and “ENTRY” labels at the bar after a valid breakout, and red lines and “EXIT” label at the bar after a stop-loss breach.
By default it uses the chart’s timeframe to compute ATR and stops, but you can flip on Daily lock to freeze both ATR and price reads at the daily resolution—so your stops stay the same whether you view at 1s, 15 m, 4h or lower frequency bars.
Key features:
20-day Donchian breakout: entry when price closes above the highest high of the previous 20 bars
2 × ATR(14) trailing stop: initialized at entry and raised only when the new (close – 2 × ATR) exceeds the prior stop
Daily lock option: Ensures all ATR and close values are calculated on the daily timeframe, keeping stop levels consistent across resolutions

DEMA Trend Oscillator Strategy📌 Overview
The DEMA Trend Oscillator Strategy is a dynamic trend-following approach based on the Normalized DEMA Oscillator SD.
It adapts in real-time to market volatility with the goal of improving entry accuracy and optimizing risk management.
⚠️ This strategy is provided for educational and research purposes only.
Past performance does not guarantee future results.
🎯 Strategy Objectives
The main goal of this strategy is to respond quickly to sudden price movements and trend reversals,
by combining momentum-based signals with volatility filters.
It is designed to be user-friendly for traders of all experience levels.
✨ Key Features
Normalized DEMA Oscillator: A momentum indicator that normalizes DEMA values on a 0–100 scale, allowing intuitive identification of trend strength
Two-Bar Confirmation Filter: Requires two consecutive bullish or bearish candles to reduce noise and enhance entry reliability
ATR x2 Trailing Stop: In addition to fixed stop-loss levels, a trailing stop based on 2× ATR is used to maximize profits during strong trends
📊 Trading Rules
Long Entry:
Normalized DEMA > 55 (strong upward momentum)
Candle low is above the upper SD band
Two consecutive bullish candles appear
Short Entry:
Normalized DEMA < 45 (downward momentum)
Candle high is below the lower SD band
Two consecutive bearish candles appear
Exit Conditions:
Take-profit at a risk-reward ratio of 1.5
Stop-loss triggered if price breaks below (long) or above (short) the SD band
Trailing stop activated based on 2× ATR to secure and extend profits
💰 Risk Management Parameters
Symbol & Timeframe: Any (AUDUSD 5M example)
Account size (virtual): $3000
Commission: 0.4PIPS(0.0004)
Slippage: 2 pips
Risk per trade: 5%
Number of trades (backtest):534
All parameters can be adjusted based on broker specifications and individual trading profiles.
⚙️ Trading Parameters & Considerations
Indicator: Normalized DEMA Oscillator SD
Parameter settings:
DEMA Period (len_dema): 40
Base Length: 20
Long Threshold: 55
Short Threshold: 45
Risk-Reward Ratio: 1.5
ATR Multiplier for Trailing Stop: 2.0
🖼 Visual Support
The chart displays the following visual elements:
Upper and lower SD bands (±2 standard deviations)
Entry signals shown as directional arrows
🔧 Strategy Improvements & Uniqueness
This strategy is inspired by “Normalized DEMA Oscillator SD” by QuantEdgeB,
but introduces enhancements such as a two-bar confirmation filter and an ATR-based trailing stop.
Compared to conventional trend-following strategies, it offers superior noise filtering and profit optimization.
✅ Summary
The DEMA Trend Oscillator Strategy is a responsive and practical trend-following method
that combines momentum detection with adaptive risk management.
Its visual clarity and logical structure make it a powerful and repeatable tool
for traders seeking consistent performance in trending markets.
⚠️ Always apply appropriate risk management. This strategy is based on historical data and does not guarantee future results.

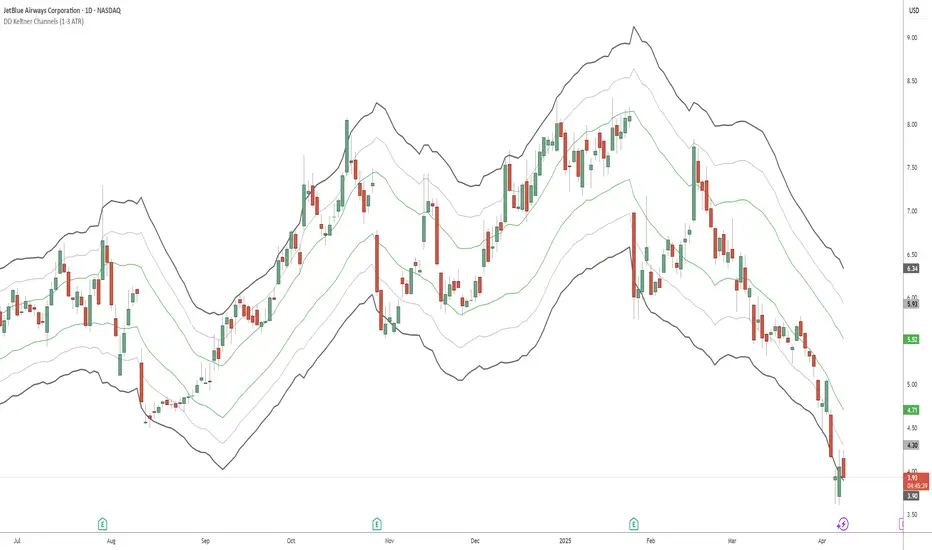
DD Keltner Channels (1-3 ATR)This indicator creates Keltner Channels with 1, 2, and 3 ATR multipliers, allowing you to visualize different volatility levels around a moving average.
It's specifically created for people taking the "Deep Dip Buy" stock trading course, and attempts to provide a ready-to-go solution for those struggling with configuring the default Keltner indicator on TradingView to suit their needs for the course.
Any input from students or the instructor is welcome to improve this indicator so it offers more value to those looking to learn how to trade.
Features:
- Uses SMA or EMA as the base (20-period default)
- Displays 6 lines: +3, +2, +1, -1, -2, and -3 ATR levels
- Color-coded for easy identification:
• +/-1 ATR: Green
• +/-2 ATR: Light Gray (thin)
• +/-3 ATR: Dark Gray (thick)
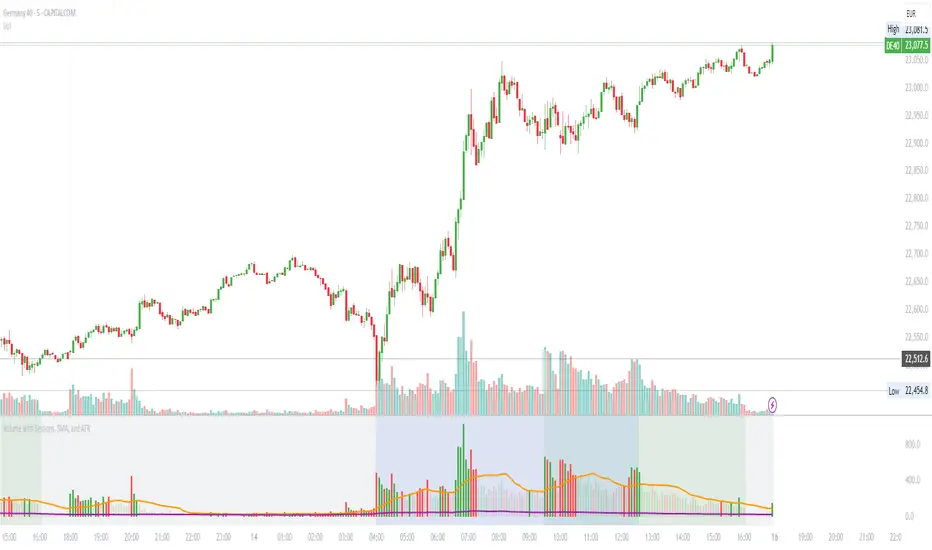
Volume with Sessions, SMA, and ATR Pine Script creates a custom volume indicator with several features, including:
SMA of Volume: It calculates the simple moving average (SMA) of the volume, which helps identify trends and determine if the current volume is above or below the average.
ATR (Average True Range): It calculates the ATR, which measures market volatility over a defined period.
Bullish/Bearish Volume Coloring: The script colors the volume bars depending on whether the price is moving up (bullish) or down (bearish), and whether the volume is above or below the SMA of volume.
Session Highlighting: It defines two major trading sessions:
NYSE (New York Stock Exchange) session from 9:30 AM to 4:00 PM Eastern Time.
LSE (London Stock Exchange) session from 8:00 AM to 4:30 PM GMT. These sessions are highlighted with background colors for easy identification.
Plotting: The volume is plotted as a histogram with varying colors depending on price movement and volume relative to its SMA. The ATR is also plotted as a purple line, and the SMA of volume is displayed as an orange line.
Background Colors: Background colors are applied during the NYSE and LSE sessions to visually differentiate between these trading periods.
Here's a breakdown of each section:
Key Inputs:
smaLength and atrLength: User-defined values for the lengths of the SMA and ATR calculations.
Main Calculations:
smaVolume: The SMA of the volume over the user-defined length (smaLength).
atrValue: The Average True Range over the user-defined length (atrLength).
Color Logic for Volume Bars:
If the current close is higher than the previous close, the volume is considered bullish, and the bar is colored green. If the volume is above the SMA, it’s a darker green; otherwise, it’s a lighter shade.
If the current close is lower than the previous close, the volume is considered bearish, and the bar is colored red. If the volume is above the SMA, it’s a darker red; otherwise, it’s a lighter red.
Plotting:
The script plots the volume as a histogram with dynamic coloring.
The SMA of the volume is plotted as a line.
ATR is plotted as a purple line for reference.
Background Color Highlighting:
The background is colored green during the NYSE session and blue during the LSE session.
MTF Signal XpertMTF Signal Xpert – Detailed Description
Overview:
MTF Signal Xpert is a proprietary, open‑source trading signal indicator that fuses multiple technical analysis methods into one cohesive strategy. Developed after rigorous backtesting and extensive research, this advanced tool is designed to deliver clear BUY and SELL signals by analyzing trend, momentum, and volatility across various timeframes. Its integrated approach not only enhances signal reliability but also incorporates dynamic risk management, helping traders protect their capital while navigating complex market conditions.
Detailed Explanation of How It Works:
Trend Detection via Moving Averages
Dual Moving Averages:
MTF Signal Xpert computes two moving averages—a fast MA and a slow MA—with the flexibility to choose from Simple (SMA), Exponential (EMA), or Hull (HMA) methods. This dual-MA system helps identify the prevailing market trend by contrasting short-term momentum with longer-term trends.
Crossover Logic:
A BUY signal is initiated when the fast MA crosses above the slow MA, coupled with the condition that the current price is above the lower Bollinger Band. This suggests that the market may be emerging from a lower price region. Conversely, a SELL signal is generated when the fast MA crosses below the slow MA and the price is below the upper Bollinger Band, indicating potential bearish pressure.
Recent Crossover Confirmation:
To ensure that signals reflect current market dynamics, the script tracks the number of bars since the moving average crossover event. Only crossovers that occur within a user-defined “candle confirmation” period are considered, which helps filter out outdated signals and improves overall signal accuracy.
Volatility and Price Extremes with Bollinger Bands
Calculation of Bands:
Bollinger Bands are calculated using a 20‑period simple moving average as the central basis, with the upper and lower bands derived from a standard deviation multiplier. This creates dynamic boundaries that adjust according to recent market volatility.
Signal Reinforcement:
For BUY signals, the condition that the price is above the lower Bollinger Band suggests an undervalued market condition, while for SELL signals, the price falling below the upper Bollinger Band reinforces the bearish bias. This volatility context adds depth to the moving average crossover signals.
Momentum Confirmation Using Multiple Oscillators
RSI (Relative Strength Index):
The RSI is computed over 14 periods to determine if the market is in an overbought or oversold state. Only readings within an optimal range (defined by user inputs) validate the signal, ensuring that entries are made during balanced conditions.
MACD (Moving Average Convergence Divergence):
The MACD line is compared with its signal line to assess momentum. A bullish scenario is confirmed when the MACD line is above the signal line, while a bearish scenario is indicated when it is below, thus adding another layer of confirmation.
Awesome Oscillator (AO):
The AO measures the difference between short-term and long-term simple moving averages of the median price. Positive AO values support BUY signals, while negative values back SELL signals, offering additional momentum insight.
ADX (Average Directional Index):
The ADX quantifies trend strength. MTF Signal Xpert only considers signals when the ADX value exceeds a specified threshold, ensuring that trades are taken in strongly trending markets.
Optional Stochastic Oscillator:
An optional stochastic oscillator filter can be enabled to further refine signals. It checks for overbought conditions (supporting SELL signals) or oversold conditions (supporting BUY signals), thus reducing ambiguity.
Multi-Timeframe Verification
Higher Timeframe Filter:
To align short-term signals with broader market trends, the script calculates an EMA on a higher timeframe as specified by the user. This multi-timeframe approach helps ensure that signals on the primary chart are consistent with the overall trend, thereby reducing false signals.
Dynamic Risk Management with ATR
ATR-Based Calculations:
The Average True Range (ATR) is used to measure current market volatility. This value is multiplied by a user-defined factor to dynamically determine stop loss (SL) and take profit (TP) levels, adapting to changing market conditions.
Visual SL/TP Markers:
The calculated SL and TP levels are plotted on the chart as distinct colored dots, enabling traders to quickly identify recommended exit points.
Optional Trailing Stop:
An optional trailing stop feature is available, which adjusts the stop loss as the trade moves favorably, helping to lock in profits while protecting against sudden reversals.
Risk/Reward Ratio Calculation:
MTF Signal Xpert computes a risk/reward ratio based on the dynamic SL and TP levels. This quantitative measure allows traders to assess whether the potential reward justifies the risk associated with a trade.
Condition Weighting and Signal Scoring
Binary Condition Checks:
Each technical condition—ranging from moving average crossovers, Bollinger Band positioning, and RSI range to MACD, AO, ADX, and volume filters—is assigned a binary score (1 if met, 0 if not).
Cumulative Scoring:
These individual scores are summed to generate cumulative bullish and bearish scores, quantifying the overall strength of the signal and providing traders with an objective measure of its viability.
Detailed Signal Explanation:
A comprehensive explanation string is generated, outlining which conditions contributed to the current BUY or SELL signal. This explanation is displayed on an on‑chart dashboard, offering transparency and clarity into the signal generation process.
On-Chart Visualizations and Debug Information
Chart Elements:
The indicator plots all key components—moving averages, Bollinger Bands, SL and TP markers—directly on the chart, providing a clear visual framework for understanding market conditions.
Combined Dashboard:
A dedicated dashboard displays key metrics such as RSI, ADX, and the bullish/bearish scores, alongside a detailed explanation of the current signal. This consolidated view allows traders to quickly grasp the underlying logic.
Debug Table (Optional):
For advanced users, an optional debug table is available. This table breaks down each individual condition, indicating which criteria were met or not met, thus aiding in further analysis and strategy refinement.
Mashup Justification and Originality
MTF Signal Xpert is more than just an aggregation of existing indicators—it is an original synthesis designed to address real-world trading complexities. Here’s how its components work together:
Integrated Trend, Volatility, and Momentum Analysis:
By combining moving averages, Bollinger Bands, and multiple oscillators (RSI, MACD, AO, ADX, and an optional stochastic), the indicator captures diverse market dynamics. Each component reinforces the others, reducing noise and filtering out false signals.
Multi-Timeframe Analysis:
The inclusion of a higher timeframe filter aligns short-term signals with longer-term trends, enhancing overall reliability and reducing the potential for contradictory signals.
Adaptive Risk Management:
Dynamic stop loss and take profit levels, determined using ATR, ensure that the risk management strategy adapts to current market conditions. The optional trailing stop further refines this approach, protecting profits as the market evolves.
Quantitative Signal Scoring:
The condition weighting system provides an objective measure of signal strength, giving traders clear insight into how each technical component contributes to the final decision.
How to Use MTF Signal Xpert:
Input Customization:
Adjust the moving average type and period settings, ATR multipliers, and oscillator thresholds to align with your trading style and the specific market conditions.
Enable or disable the optional stochastic oscillator and trailing stop based on your preference.
Interpreting the Signals:
When a BUY or SELL signal appears, refer to the on‑chart dashboard, which displays key metrics (e.g., RSI, ADX, bullish/bearish scores) along with a detailed breakdown of the conditions that triggered the signal.
Review the SL and TP markers on the chart to understand the associated risk/reward setup.
Risk Management:
Use the dynamically calculated stop loss and take profit levels as guidelines for setting your exit points.
Evaluate the provided risk/reward ratio to ensure that the potential reward justifies the risk before entering a trade.
Debugging and Verification:
Advanced users can enable the debug table to see a condition-by-condition breakdown of the signal generation process, helping refine the strategy and deepen understanding of market dynamics.
Disclaimer:
MTF Signal Xpert is intended for educational and analytical purposes only. Although it is based on robust technical analysis methods and has undergone extensive backtesting, past performance is not indicative of future results. Traders should employ proper risk management and adjust the settings to suit their financial circumstances and risk tolerance.
MTF Signal Xpert represents a comprehensive, original approach to trading signal generation. By blending trend detection, volatility assessment, momentum analysis, multi-timeframe alignment, and adaptive risk management into one integrated system, it provides traders with actionable signals and the transparency needed to understand the logic behind them.

BB ATR Fractal MMThe Bollinger Bands + ATR with Fractal indicator is a powerful combination of Bollinger Bands, ATR (Average True Range), and Fractal to help identify market volatility and potential entry/exit points on the chart.
Bollinger Bands help to assess the market’s volatility by calculating upper and lower bands based on the simple moving average (SMA) and standard deviation. It’s an excellent tool for identifying overbought and oversold conditions.
ATR (Average True Range) is used to measure market volatility. It helps determine how much the price is moving, and it can be used to adjust the Bollinger Bands, creating bands that reflect the current volatility more accurately.
Fractal helps to identify peaks and troughs in the market, supporting decision-making by highlighting potential reversal points. Fractals mark regions where price may reverse direction, making it easier to spot possible trade opportunities.
How to Use:
Bollinger Bands Upper and Lower Bands: These bands help to identify overbought or oversold conditions. If the price breaks above the upper band, the market may be overbought. If the price breaks below the lower band, the market may be oversold.
ATR: It indicates the volatility level of the market. When the market shows large volatility (ATR increases), the Bollinger Bands expand to reflect higher price swings.
Fractal: Arrows appear at the market’s peaks and troughs, helping identify entry points for buying (at fractal lows) or selling (at fractal highs). These signals can help you make trading decisions based on potential price reversals.

SMA + RSI + Volume + ATR StrategySMA + RSI + Volume + ATR Strategy
1. Indicators Used:
SMA (Simple Moving Average): This is a trend-following indicator that calculates the average price of a security over a specified period (50 periods in this case). It's used to identify the overall trend of the market.
RSI (Relative Strength Index): This measures the speed and change of price movements. It tells us if the market is overbought (too high) or oversold (too low). Overbought is above 70 and oversold is below 30.
Volume: This is the amount of trading activity. A higher volume often indicates strong interest in a particular price move.
ATR (Average True Range): This measures volatility, or how much the price is moving in a given period. It helps us adjust stop losses and take profits based on market volatility.
2. Conditions for Entering Trades:
Buy Signal (Green Up Arrow):
Price is above the 50-period SMA (indicating an uptrend).
RSI is below 30 (indicating the market might be oversold or undervalued, signaling a potential reversal).
Current volume is higher than average volume (indicating strong interest in the move).
ATR is increasing (indicating higher volatility, suggesting that the market might be ready for a move).
Sell Signal (Red Down Arrow):
Price is below the 50-period SMA (indicating a downtrend).
RSI is above 70 (indicating the market might be overbought or overvalued, signaling a potential reversal).
Current volume is higher than average volume (indicating strong interest in the move).
ATR is increasing (indicating higher volatility, suggesting that the market might be ready for a move).
3. Take Profit & Stop Loss:
Take Profit: When a trade is made, the strategy will set a target price at a certain percentage above or below the entry price (1.5% in this case) to automatically exit the trade once that target is hit.
Stop Loss: If the price goes against the position, a stop loss is set at a percentage below or above the entry price (0.5% in this case) to limit losses.
4. Execution of Trades:
When the buy condition is met, the strategy will enter a long position (buying).
When the sell condition is met, the strategy will enter a short position (selling).
5. Visual Representation:
Green Up Arrow: Appears on the chart when the buy condition is met.
Red Down Arrow: Appears on the chart when the sell condition is met.
These arrows help you see at a glance when the strategy suggests you should buy or sell.
In Summary:
This strategy uses a combination of trend-following (SMA), momentum (RSI), volume, and volatility (ATR) to decide when to buy or sell a stock. It looks for opportunities when the market is either oversold (buy signal) or overbought (sell signal) and makes sure there’s enough volume and volatility to back up the move. It also includes take-profit and stop-loss levels to manage risk.

Adaptive Fractal Grid Scalping StrategyThis Pine Script v6 component implements an "Adaptive Fractal Grid Scalping Strategy" with an added volatility threshold feature.
Here's how it works:
Fractal Break Detection: Uses ta.pivothigh and ta.pivotlow to identify local highs and lows.
Volatility Clustering: Measures volatility using the Average True Range (ATR).
Adaptive Grid Levels: Dynamically adjusts grid levels based on ATR and user-defined multipliers.
Directional Bias Filter: Uses a Simple Moving Average (SMA) to determine trend direction.
Volatility Threshold: Introduces a new input to specify a minimum ATR value required to activate the strategy.
Trade Execution Logic: Places limit orders at grid levels based on trend direction and fractal levels, but only when ATR exceeds the volatility threshold.
Profit-Taking and Stop-Loss: Implements profit-taking at grid levels and a trailing stop-loss based on ATR.
How to Use
Inputs: Customize the ATR length, SMA length, grid multipliers, trailing stop multiplier, and volatility threshold through the input settings.
Visuals: The script plots fractal points and grid levels on the chart for easy visualization.
Trade Signals: The strategy automatically places buy/sell orders based on the detected fractals, trend direction, and volatility threshold.
Profit and Risk Management: The script includes logic for taking profits and setting stop-loss levels to manage trades effectively.
This strategy is designed to capitalize on micro-movements during high volatility and avoid overtrading during low-volatility trends. Adjust the input parameters to suit your trading style and market conditions.

RSI + ADX + ATR 18-01-25Combining RSI (Relative Strength Index), ADX (Average Directional Index), and ATR (Average True Range) creates a synergistic approach to technical analysis. This powerful trio covers momentum, trend strength, and volatility, providing comprehensive insights into market conditions. Here's a deeper exploration of their combined results:
1. Momentum Assessment with RSI
Purpose: RSI measures the speed and magnitude of recent price changes to determine overbought or oversold levels.
Benefit in Combination:
When RSI indicates overbought (above 70) or oversold (below 30) levels, it signals a potential reversal or correction.
However, these signals can be false in strongly trending markets, which is why ADX is used alongside it.
2. Trend Strength Confirmation with ADX
Purpose: ADX confirms the presence and strength of a trend.
Benefit in Combination:
If RSI shows a potential reversal but ADX indicates a strong trend (above 25), the trend is likely to continue, and RSI signals may need to be approached with caution.
Conversely, if ADX is below 20 (weak trend), RSI signals are more likely to indicate genuine reversals, as the market lacks a strong directional push.
3. Volatility Analysis with ATR
Purpose: ATR evaluates the level of price volatility.
Benefit in Combination:
High ATR values indicate volatile conditions where prices can move significantly; this helps in setting wider stop-loss levels to avoid premature exits.
Low ATR values suggest quieter markets, where tighter stop-losses and profit targets are more suitable.

DAILY Supertrend + EMA Crossover with RSI FilterThis strategy is a technical trading approach that combines multiple indicators—Supertrend, Exponential Moving Averages (EMAs), and the Relative Strength Index (RSI)—to identify and manage trades.
Core Components:
1. Exponential Moving Averages (EMAs):
Two EMAs, one with a shorter period (fast) and one with a longer period (slow), are calculated. The idea is to spot when the faster EMA crosses above or below the slower EMA. A fast EMA crossing above the slow EMA often suggests upward momentum, while crossing below suggests downward momentum.
2. Supertrend Indicator:
The Supertrend uses Average True Range (ATR) to establish dynamic support and resistance lines. These lines shift above or below price depending on the prevailing trend. When price is above the Supertrend line, the trend is considered bullish; when below, it’s considered bearish. This helps ensure that the strategy trades only in the direction of the overall trend rather than against it.
3. RSI Filter:
The RSI measures momentum. It helps avoid buying into markets that are already overbought or selling into markets that are oversold. For example, when going long (buying), the strategy only proceeds if the RSI is not too high, and when going short (selling), it only proceeds if the RSI is not too low. This filter is meant to improve the quality of the trades by reducing the chance of entering right before a reversal.
4. Time Filters:
The strategy only triggers entries during user-specified date and time ranges. This is useful if one wants to limit trading activity to certain trading sessions or periods with higher market liquidity.
5. Risk Management via ATR-based Stops and Targets:
Both stop loss and take profit levels are set as multiples of the ATR. ATR measures volatility, so when volatility is higher, both stops and profit targets adjust to give the trade more breathing room. Conversely, when volatility is low, stops and targets tighten. This dynamic approach helps maintain consistent risk management regardless of market conditions.
Overall Logic Flow:
- First, the market conditions are analyzed through EMAs, Supertrend, and RSI.
- When a buy (long) condition is met—meaning the fast EMA crosses above the slow EMA, the trend is bullish according to Supertrend, and RSI is below the specified “overbought” threshold—the strategy initiates or adds to a long position.
- Similarly, when a sell (short) condition is met—meaning the fast EMA crosses below the slow EMA, the trend is bearish, and RSI is above the specified “oversold” threshold—it initiates or adds to a short position.
- Each position is protected by an automatically calculated stop loss and a take profit level based on ATR multiples.
Intended Result:
By blending trend detection, momentum filtering, and volatility-adjusted risk management, the strategy aims to capture moves in the primary trend direction while avoiding entries at excessively stretched prices. Allowing multiple entries can potentially amplify gains in strong trends but also increases exposure, which traders should consider in their risk management approach.
In essence, this strategy tries to ride established trends as indicated by the Supertrend and EMAs, filter out poor-quality entries using RSI, and dynamically manage trade risk through ATR-based stops and targets.

Multi-Timeframe ATRsThis Multi-Timeframe ATR Indicator displays the Average True Range (ATR) values from multiple timeframes on a single chart, allowing traders to assess market volatility across different time periods. The indicator calculates and plots the ATR for the 1-hour, 3-hour, 4-hour, 1-day, and 2-day timeframes, with the option to toggle each timeframe on or off based on user preferences. By visualizing these ATR values, traders can identify potential price movement expectations for various timeframes and better understand how volatility is shifting across the market. This tool is handy for traders who want to gauge volatility over different time periods and incorporate it into their trading strategies.
By evaluating higher timeframes when entering trades, a trader can better understand market conditions. This insight helps the trader make informed decisions about whether to remain in the trade for a longer period.
The indicator is fully customizable, with color-coded plots for each timeframe and optional labels that display the ATR values directly on the chart. It is ideal for traders looking to add volatility insights to their technical analysis without cluttering their charts.

Supertrend StrategyThe Supertrend Strategy was created based on the Supertrend and Relative Strength Index (RSI) indicators, widely respected tools in technical analysis. This strategy combines these two indicators to capture market trends with precision and reliability, looking for optimizing exit levels at oversold or overbought price levels.
The Supertrend indicator identifies trend direction based on price and volatility by using the Average True Range (ATR). The ATR measures market volatility by calculating the average range between an asset’s high and low prices over a set period. It provides insight into price fluctuations, with higher ATR values indicating increased volatility and lower values suggesting stability. The Supertrend Indicator plots a line above or below the price, signaling potential buy or sell opportunities: when the price closes above the Supertrend line, an uptrend is indicated, while a close below the line suggests a downtrend. This line shifts as price movements and volatility levels change, acting as both a trailing stop loss and trend confirmation.
To enhance the Supertrend strategy, the Relative Strength Index (RSI) has been added as an exit criterion. As a momentum oscillator, the RSI indicates overbought (usually above 70) or oversold (usually below 30) conditions. This integration allows trades to close when the asset is overbought or oversold, capturing gains before a possible reversal, even if the percentage take profit level has not been reached. This mechanism aims to prevent losses due to market reversals before the Supertrend signal changes.
### Key Features
1. **Entry criteria**:
- The strategy uses the Supertrend indicator calculated by adding or subtracting a multiple of the ATR from the closing price, depending on the trend direction.
- When the price crosses above the Supertrend line, the strategy signals a long (buy) entry. Conversely, when the price crosses below, it signals a short (sell) entry.
- The strategy performs a reversal if there is an open position and a change in the direction of the supertrend occurs
2. **Exit criteria**:
- Take profit of 30% (default) on the average position price.
- Oversold (≤ 5) or overbought (≥ 95) RSI
- Reversal when there is a change in direction of the Supertrend
3. **No Repainting**:
- This strategy is not subject to repainting, as long as the timeframe configured on your chart is the same as the supertrend timeframe .
4. **Position Sizing by Equity and risk management**:
- This strategy has a default configuration to operate with 35% of the equity. At the time of opening the position, the supertrend line is typically positioned at about 12 to 16% of the entry price. This way, the strategy is putting at risk about 16% of 35% of equity, that is, around 5.6% of equity for each trade. The percentage of equity can be adjusted by the user according to their risk management.
5. **Backtest results**:
- This strategy was subjected to deep backtesting and operations in replay mode, including transaction fees of 0.12%, and slippage of 5 ticks.
- The past results in deep backtest and replay mode were compatible and profitable (Variable results depending on the take profit used, supertrend and RSI parameters). However, it should be noted that few operations were evaluated, since the currency in question has been created for a short time and the frequency of operations is relatively small.
- Past results are no guarantee of future results. The strategy's backtest results may even be due to overfitting with past data.
Default Settings
Chart timeframe: 2h
Supertrend Factor: 3.42
ATR period: 14
Supertrend timeframe: 2 h
RSI timeframe: 15 min
RSI Lenght: 5 min
RSI Upper limit: 95
RSI Lower Limit: 5
Take Profit: 30%
BYBIT:1000000MOGUSDT.P

RSI ATR Range [SS]Hey everyone,
Over the course of the last year I had a bunch of requests to do something with RSI. I did do an RSI expected move plotter, but the requests were to overhaul RSI and make it better I guess.
So here is my attempt!
This is the RSI ATR plotter. Its similar to my RSI expected move plotter, however, it gives you the ATR ranges associated with the current RSI value. This allows you to conceptualize RSI in a different way. Instead of looking for "oversold" over "overbought", you can actually just see the expected high to open range and the expected open to low range based on the current RSI.
This will allow you to determine such things as:
a) Is it likely to be bullish?
b) Is it likely to be bearish?
c) The average move, in a dollar amount, associated with this RSI.
In addition to presenting RSI in terms of ranges as opposed to the actual RSI value, the indicator will also signal likely reversal areas. Whenever there is a huge spike in RSI and range, whether it be up or down, this generally corresponds to an imminent reversal. The indicator is programmed to recognize this and plot little grey circles to notify you of an impending reversal.
Let's take a look at some reversal examples using NVDA:
In the chart above, we can see that the RSI signaled a reversal. As it was part of a downtrend, the reversal was bullish.
Let's look at a top reversal:
The chart above shows a likely downside reversal.
And some little bounce reversals here and there:
In addition to showing you the ATR range and reversals, the indicator will show you the RSI in a bar graph format:
You won't be able to look for RSI divergences, if you are a believer of those. However, you can definitely visualize them in the ATR ranges which are directly affected by the RSI readings.
Aspects of the indicator:
Bull ranges are displayed in green.
Bear ranges are displayed in red.
When green is present we know its entering or currently in a bullish RSI range:
Inversely, when it starts to shift red, we know we are entering a bearish RSI range:
There is a border that circles the range. It will be green when we are in a bullish range and red when we are in a bearish range. In addition to these 2 signals, the RSI bar chart itself will turn green in bullish ranges, and red in bearish ranges.
Here is bullish:
Here is bearish:
Customizability
You can customize the Source input for the RSI (default is close). As well as the length (default is 14).
The ATR length is defaulted to 500. My suggestion is to leave this be. You can increase it but I would not suggest decreasing it as it may omit some of the RSI ranges from its history.
And that is the indicator my friends! Hope you enjoy!
As always, safe trades!

Daily Chart ATR & Movement %This Pine Script, titled "Daily ATR & Movement %," is designed for traders looking to gauge volatility and price movements relative to that volatility directly on their trading chart. The script calculates and displays the Average True Range (ATR) over a 14-day period using daily data, alongside the percentage movement of the current price from the previous day's close, scaled by the ATR. These metrics provide a snapshot of daily volatility and the magnitude of price movements within that context, which can be crucial for making informed trading decisions, especially in markets where volatility is a significant factor.
Key Features:
Daily ATR Calculation: Utilizes the ta.atr(14) function to compute the Average True Range on a daily basis, which measures market volatility by decomposing the entire range of asset prices for that day.
Movement Percentage: The script calculates the movement from yesterday’s closing price to today’s current price as a percentage of the daily ATR. This shows how significant today's price change is relative to the typical daily volatility, which helps in understanding whether the price movement is substantial or trivial.
Customizable Label Display: Traders can customize the display through a user input dropdown menu for label size ("small", "normal", "large", "huge") and a slider for vertical offset. This allows for better visibility and customization based on user preference and screen setup.
Dynamic Label Updates: A label is dynamically updated each bar with the latest ATR value and movement percentage. This ongoing update keeps traders informed in real-time without manual recalculations.
How to Use:
Setup: Apply the indicator to any chart.
Customization: Adjust the label size and vertical position to suit your viewing preference using the script’s input options.
Interpretation: Monitor the displayed ATR value and movement percentage to assess volatility and relative price movements. High percentages could indicate significant moves worth trading, while low percentages suggest minor changes.
This script is particularly useful for traders who rely on volatility-based trading strategies, such as breakout trading, where understanding the context of price movements relative to typical market fluctuations can provide a strategic edge.
ZigZag With ATR Filter [vnhilton](OVERVIEW)
The typical ZigZag indicator, which connects pivot points (see TradingView's Help Center regarding their indicator Pivot Points High Low, for an in depth explanation on how they are calculated) with lines, except instead of a percentage threshold, it uses ATR which adjusts for volatility of the ticker you are viewing. The ZigZag indicator can therefore be used to help visualise price legs and trends on a usually noisy looking chart.
(FEATURES)
- Toggles for pivot point label contents such as the value, the trend, or nothing at all.
- ATR and pivot point periods.
- ATR multiplier minimum threshold to plot pivots and draw lines only when this threshold is met (helps eliminate small, perhaps insignificant price movements, to have a better focus on the overall trend).
- Show the last 2 to 499 ZigZag lines.
- Uptrend, downtrend and range colors for high and low pivot labels, text labels and lines, for both confirmed and real-time plots.
- Label size, and label styles for the high and low pivots.
- Customisable width and styles (Arrow Right, Dashed, Dotted, Solid) for the ZigZag line.
In the main chart picture, labels show both the pivot point value and the trend at that point. In the picture above, on the left shows only the pivot point value, the right shows only the trend.
Picture above shows just the label with 0 contents. Also notice the last recent line being blue instead of green. This is because the current bar hasn't finished so this line is currently live and not confirmed, so is subject to change. Keep in mind even if a pivot point is confirmed, it can be updated by a subsequent higher high/lower low.
Left chart shows a minimum ATR threshold multiplier of 1x; Right chart has 2x ATR minimum threshold. Notice the left chart highlights more price legs as more price legs satisfy a less strict threshold.

SMA with ATR BandsSMA with ATR Bands
This custom indicator combines the Simple Moving Average (SMA) with Average True Range (ATR) bands. It’s designed to help traders identify potential price reversals and gauge volatility. Here’s what it does:
Simple Moving Average (SMA):
The SMA represents the average price over a specified period.
It acts as a trend-following line, smoothing out price fluctuations.
The blue line on the chart represents the SMA.
ATR Bands:
The ATR measures volatility by calculating the average range between high and low prices.
We add and subtract the ATR (multiplied by a user-defined factor) from the SMA to create the bands.
The green upper band and red lower band dynamically adjust based on volatility.
How to Use It:
Volatility Signals: When the bands are close together (a “squeeze”), it indicates low volatility. A breakout often follows.
Overbought/Oversold: Price touching the upper band suggests overbought conditions, while touching the lower band suggests oversold conditions.
Trend Confirmation: The indicator can confirm trends.
Feel free to use this indicator on TradingView to enhance your trading strategy. Remember to customize the parameters according to your preferences. Happy trading! 📈🚀
Standardized SuperTrend Oscillator
The Standardized SuperTrend Oscillator (SSO) is a versatile tool that transforms the SuperTrend indicator into an oscillator, offering both trend-following and mean reversion capabilities. It provides deeper insights into trends by standardizing the SuperTrend with respect to its upper and lower bounds, allowing traders to identify potential reversals and contrarian signals.
Methodology:
Lets begin with describing the SuperTrend indicator, which is the fundamental tool this script is based on.
SuperTrend:
The SuperTrend is calculated based on the average true range (ATR) and multiplier. It identifies the trend direction by placing a line above or below the price. In an uptrend, the line is below the price; in a downtrend, it's above the price.
pine_st(float src = hl2, float factor = 3., simple int len = 10) =>
float atr = ta.atr(len)
float up = src + factor * atr
up := up < nz(up ) or close > nz(up ) ? up : nz(up )
float lo = src - factor * atr
lo := lo > nz(lo ) or close < nz(lo ) ? lo : nz(lo )
int dir = na
float st = na
if na(atr )
dir := 1
else if st == nz(up )
dir := close > up ? -1 : 1
else
dir := close < lo ? 1 : -1
st := dir == -1 ? lo : up
SSO Oscillator:
The SSO is derived from the SuperTrend and the source price. It calculates the standardized difference between the SuperTrend and the source price. The standardization is achieved by dividing this difference by the distance between the upper and lower bounds of the SuperTrend.
float sso = (src - st) / (up - lo)
Components and Features:
SuperTrend of Oscillator - An additional SuperTrend based on the direction and volatility of the oscillator, behaving as the SuperTrend OF the SuperTrend. This provides further trend analysis of the underlying broad trend regime.
Reversion Tracer - The RSI of the direction of the original SuperTrend, providing a dynamic threshold for premium and discount price areas.
float rvt = ta.rsi(dir, len)
Heikin Ashi Transform - An option to apply the Heikin Ashi transform to the source price of the oscillator, providing a smoother visual representation of trends.
Display Modes - Choose between Line mode for a standard oscillator view or Candle mode, displaying the oscillator as Heikin Ashi candles for more in-depth trend analysis.
Contrarian and Reversion Signals:
Contrarian Signals - Based on the SuperTrend of the oscillator, these signals can act as potential buy or sell indications, highlighting potential trend exhaustion or premature reversals.
Reversion Signals - Generated when the oscillator crosses above or below the Reversion Tracer, signaling potential mean reversion opportunities or trend breakouts.
Utility and Use Cases:
Trend Analysis - Utilize the SSO as a trend-following tool with the added benefits of the oscillator's SuperTrend and Heikin Ashi transform.
Valuation Analysis - Leverage the oscillator's reversion signals for identifying potential mean reversion opportunities in the market.
The Standardized SuperTrend Oscillator enhances the capabilities of the SuperTrend indicator, offering a balanced approach to both trend-following and mean reversion strategies. Its customizable options and contrarian signals make it a valuable instrument for traders seeking comprehensive trend analysis and potential reversal signals.

Average True Range - ImprovedAverage True Range - Improved is a small variation I have made to the standard ATR indicator. It will test the current ATR against the Historic Average ATR of your preference to see if the current volatility is high or low.
Once it has determined if it is high or low it will color code the circles at the top based on this information. Green means the current volatility is low and red means the current volatility is higher than the historic average.
In the settings I have also placed a couple styles, if you wish to show the ATR and Historic ATR in percent format instead of normal you can turn them on in the style settings. If you are using the percent format I recommend setting the Precision to 2-3 decimal places.
I hope you all enjoy this indicator, if you have any questions please feel free to post them in the comments.

Risk Management Tool [LuxAlgo]Good money management is one of the fundamental pillars of successful trading. With this indicator, we propose a simple way to manage trading positions. This tool shows Profit & Loss (P&L), suggests position size given a certain risk, sets stop losses and take profit levels using fixed price value/percentage/ATR/Range, and can also determine entries from crosses with technical indicators which is particularly handy if you don't want to set an entry manually.
1. Settings
Position Type: Determines if the position should be a "Long" or "Short".
Account Size: Determines the total capital of the trading account.
Risk: The maximum risk amount for a trade. Can be set as a percentage of the account size or as a fixed amount.
Entry Price: Determines the entry price of the position.
Entry From Cross: When enabled, allows to set the entry price where a cross with an external source was produced.
1.1 Stop Loss/Take Profit
Take Profit: Determines the take profit level, which can be determined by a value or percentage.
Stop Loss: Determines the stop loss level, which can be determined by a value or percentage.
2. Usage
One of the main usages of position management tools is to determine the position size to allocate given a specific risk amount and stop-loss. 2% of your capital is often recommended as a risk amount.
Our tool allows setting stop losses and take profits with different methods.
The ATR method sets the stop loss/take profit one ATR away from the entry price, with the ATR period being determined in the drop-down menu next to the selected methods. The range method works similarly but instead of using the ATR, we use a rolling range with a period determined in the drop-down menu next to the selected methods as well.
Unlike the available position management tool on TradingView, the entry can be determined from a cross between the price an an external source. The image above shows entries from the Volatility Stop indicator. This is particularly useful if you set positions based on trailing stops.

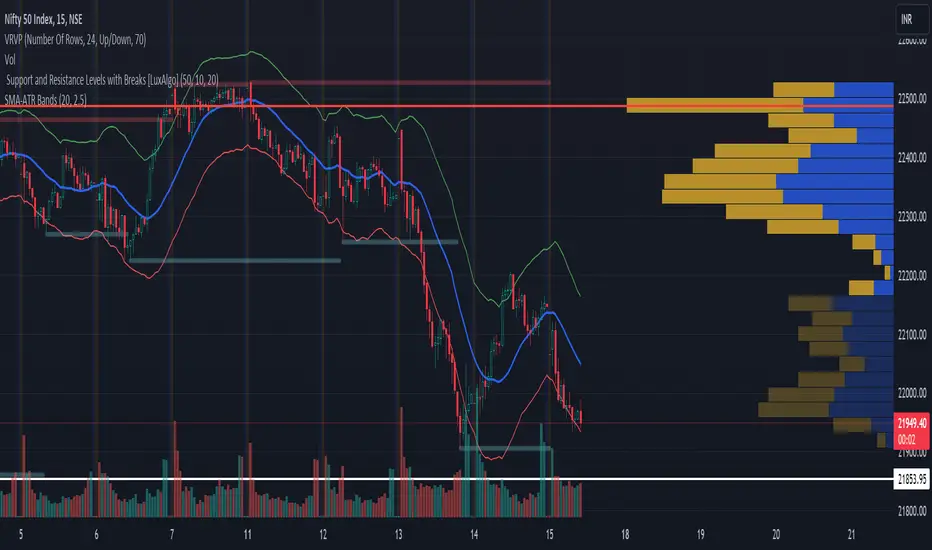
Moving Average Support and Resistance ChannelThe Moving Average Support and Resistance Channel is a channel that consists of trend lines of resistance and support of the analyzed instrument, represented as moving averages with the selected type and smoothing period on a certain timeframe, where:
- Middle Line - the middle of the channel (the moving average of the pivot point using the Floor Pivot method)
- R1 - first resistance (moving average of support + Factor*ATR)
- R2 - second resistance (R1 + Factor*ATR)
- S1 - first support (moving average of resistance-Factor*ATR)
- S2 - second support (S1-Factor*ATR)
- Factor-ATR multiplier
Despite the fact that the indicator consists of moving averages, it can work equally well both during a trend and in its absence.
Characteristics of the trend movement:
• During an uptrend, the moving averages of the indicator are directed upwards, the price is above the Middle Line level most of the time
• During a downtrend, the moving averages of the indicator are directed down, the price is below the Middle Line level most of the time
• During the flat period, the boundaries of the moving average channel narrow, the channel tends to align in a horizontal position, the price consolidates most of the time around the Middle Line level, fighting off the support and resistance levels of the indicator.
The position of asset prices outside the indicator may mean an early correction or trend reversal.
How to trade:
One of the trading methods may be that during a breakout or a pullback after a breakout of the Middle Line level, the target of further movement, depending on the direction of this movement, may be the levels R1, R2 or S1, S2. Use this situation to make a profit.
I wish you good luck in building your trading plans and remember: such indicators do not predict the future price movement on the chart, they only determine the characteristics of the price movement at the current time, taking into account historical data.

Chaikin Money Flow + MACD + ATRHere I present you on of Trade Pro's Trading Idea: Chaikin Money Flow + MACD + ATR.
This strategy is not as profitable as it can be seen in one of his videos. In the forex market, the strategy could reach a maximum of 35% profitability.
I have, as some of my followers have requested, created an overview of the current position, risk and leverage settings in the form of a table.
Furthermore, one can again swap between short and long positions.
It is now possible to select or deselect individual indicators.
I have chosen the ATR alone as a take profit stop loss, as in his strategy.
A position is only triggered as soon as all prerequisites have been fulfilled and a command is executed. This prevents false triggering by bots and repainting.
-----------------------------------------------------------------------------------
How does the strategy work?
ENTRY
Long
The MACD indicator must be above the zero line.
Then the K line must cross the D line.
Finally, when this happens, the Money Flow Index must be above the zero line.
Short
Contrary to the premise of long positions.
EXIT
ATR Exit
The value of ATR at the time of buying is multiplied by the value entered in "Profit factor ATR" and "Stop factor ATR". As soon as the price reaches this value, it is closed.
Important
The script must be optimized for each coin or currency pair.
I will publish a guide to the strategy shortly. There I will explain how the table works and how to set the strategy correctly.
The results of the strategy are without commissions and leverage.
If you have any questions or feedback, please let me know in the comments.

[JL] ATR HL CloudI am playing ATR now.
This script is made to watch ATR and highest-lowest.
ATR is calculated by max of short period and long period.
Up cloud is lowest price plus ATR * Multi
Dn cloud is highest price decrease ATR* Multi
Higher and higher cloud means up trend
Lower and lower cloud means dn trend
